Article

Waterjet Erosion Model for Rock-Like Material Considering Properties of Abrasive and Target Materials

1
Department of Civil and Environmental Engineering, Korea Advanced Institute of Science and Technology (KAIST), Daejeon 34141, Korea
2
Department of Civil Engineering, Pusan National University, Pusan 46241, Korea
*
Author to whom correspondence should be addressed.
Appl. Sci. 2019, 9(20), 4234; https://doi.org/10.3390/app9204234
Submission received: 9 September 2019 / Revised: 28 September 2019 / Accepted: 4 October 2019 / Published: 10 October 2019
(This article belongs to the Section Civil Engineering)

Abstract

:

Featured Application

Parametric studies of the developed models in this article provide characteristics of abrasive acceleration and erosion rate considering properties of abrasive and target materials. These findings can be applied to the prediction of abrasive particle velocity and erosion performance of the abrasive waterjet rock-like material cutting.

Abstract

In this study, we investigated the characteristics of abrasive erosion considering the material properties of abrasives and targets. An abrasive particle erosion model considering energy transfer due to hardness differences was developed based on energy conservation using the correlation between volume removal and effective kinetic energy. To obtain the effective erosion kinetic energy of an abrasive, an acceleration model was derived for the abrasive particles, including terms describing the properties of the abrasive and fluid. The applicability of the suggested model was verified by comparing the brittle erosion results obtained using a previous theoretical approach to those of the present numerical analysis. The results obtained using the developed model exhibited good qualitative agreement with the brittle material erosion results. By evaluating acceleration and the erosion characteristics of an abrasive, the erosion performance could be predicted and optimized.

1. Introduction

Waterjet technology has considerably advanced due to the production of optimally shaped nozzles, mixing tubes, and commercial-level orifices [1]. In particular, abrasive waterjets (AWJs), in which abrasives are injected into a plain waterjet, are being developed for better performance [2,3]. Presently, AWJs are attracting considerable attention for geotechnical purposes such as concrete demolition, rock drilling, cutting, and excavation [4,5,6,7,8] due to their distinct advantages (e.g., environmental friendliness, low vibrations, selective processing, and high machining versatility [9,10,11,12]).
The impact energy of the accelerated abrasive is the main energy causing erosion [13,14,15]. Erosion is based on the indentation of the target surface by hard particles (i.e., abrasives) [16]. The total kinetic energy of an AWJ is determined by the total input mass of the abrasive, but experimental results have shown that the erosion performance of the abrasive depends on its properties (i.e., density and diameter), even under the same conditions (i.e., pump pressure, flow rate, and traverse speed [17,18]). Therefore, it is necessary to understand the effect of abrasive properties on erosion mechanism and performance. The erosion in an AWJ has been studied from a variety of perspectives. Table 1 lists erosion models, including their basic equations. Volume displacement models assume that the volume removal rate ( V r ) is equivalent to the displacement rate ( V D ). Energy conservation models assume that the volume removal rate ( V r ) is proportional to the applied erosion energy ( E e ). Regression models originate from independent investigations of the functions of variables (f(x)), and reaction kinetic models are based on their similarities to the kinetic parameters of reactions, including the erosion probability ( k a ), abrasive flow rate ( m ˙ a ), and reaction order (m).
Figure 1 shows the impact of abrasives, plastic deformation, and microcracking (microfracture, intergranular cracking) that occurs in quasibrittle materials such as granite [15,20,21]. Energy conservation models have the advantage of considering volume removal due to both plastic deformation and microcrack fracture. In particular, an elastoplastic model [20,21] considering energy conservation provides clear theoretical explanations regarding brittle erosion. This model uses the plastic deformation based on the model developed using Bitter’s model [28,29]: it considers the threshold velocity of the impact (k) and the energy required to remove the target volume (ε). This model also defines the removal volume ( V r ) during microcrack fracture using the equation proposed by Hutching [30]: it calculates V r by considering the stress-wave energy factor ( f w ), the total stress-wave energy (W), and the fracture energy per unit area (γ) on which the stress-wave energy acts through the following equation:
V r = m p ( v t k ) 2 2 ε + f w a W 6 γ .
Here, m p is the mass of the particle, v t is the terminal velocity of the particle, and a is the flaw distribution parameter. The elastoplastic model has been used to investigate erosion in other experiments [31] as well: it has also been applied to analyze the micromechanism of material removal in polycrystalline brittle materials [32] and to develop fracture mechanics models [33]. Although this model effectively represents plastic deformation through intergranular or microcrack erosion in terms of the fracture energy, the approach used in this model is complex and difficult to use. This is because it requires estimating the specific energy for material removal (ε) through experimental and theoretical calculations; moreover, the characteristics of the abrasive particles are not considered in the theoretical representations of erosion.
Therefore, this study developed a simple but robust waterjet abrasive erosion model for rock-like material considering abrasive characteristics such as density, diameter, and hardness. The developed model was verified through comparisons to the elastoplastic model developed by Zeng and Kim [20,21] and numerical modeling results. Then, a parametric study was performed to explore the effect of the abrasive characteristics on waterjet erosion performance.

2. Waterjet Erosion Model of an Abrasive Particle

As the acceleration of abrasives in waterjets is affected by properties such as density and diameter, the exit velocity of the abrasives at the exit of the focus was derived from fluid mechanics. Then, a simple energy–work erosion model was developed that considered the effective erosion kinetic energy, depending on the ratio between the hardness of the abrasive and the target.

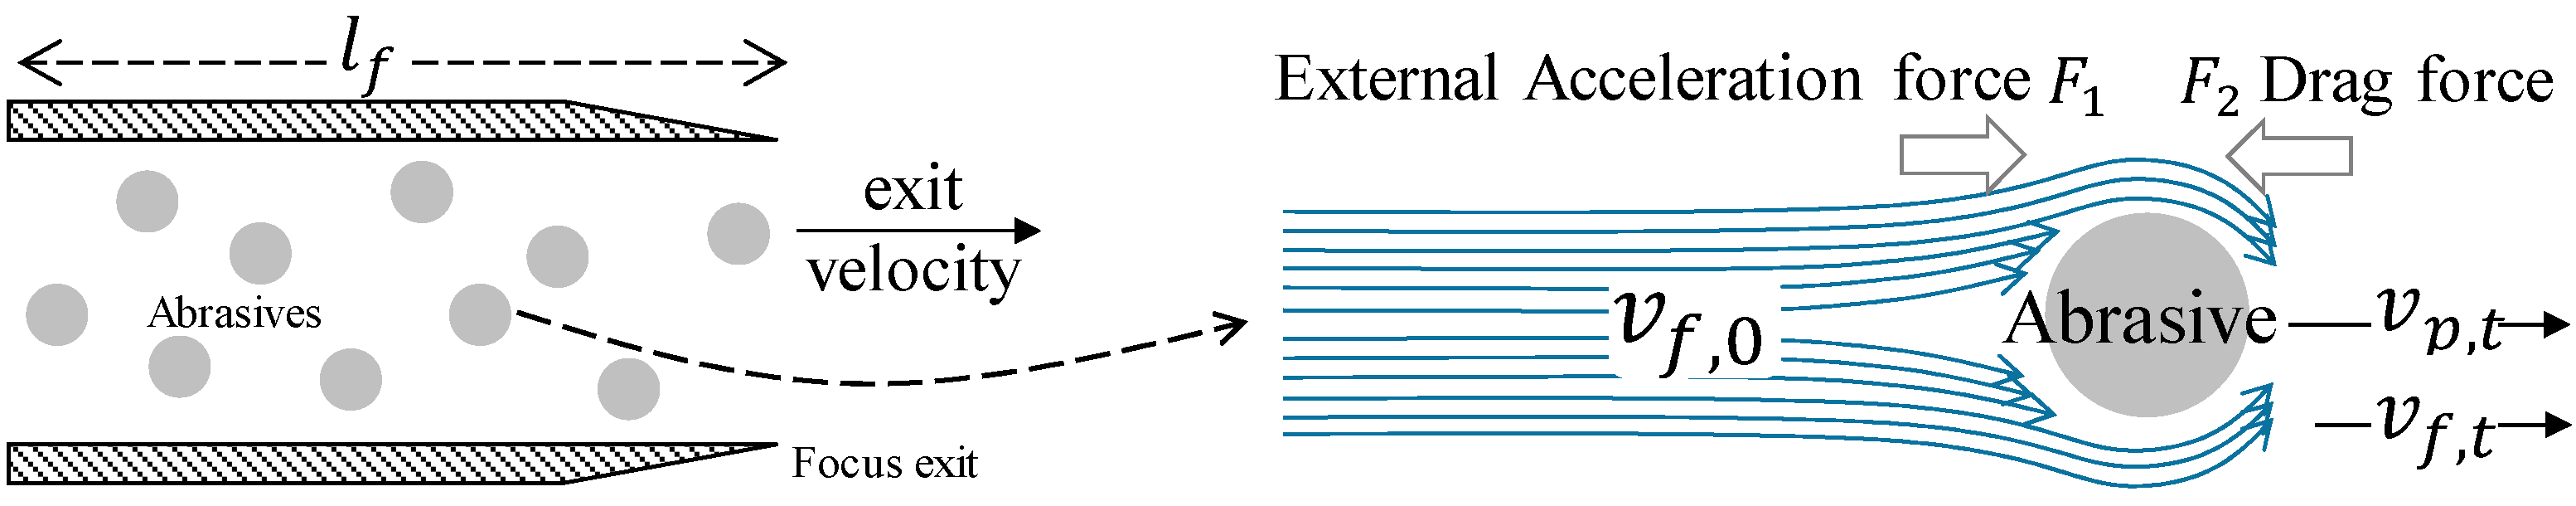
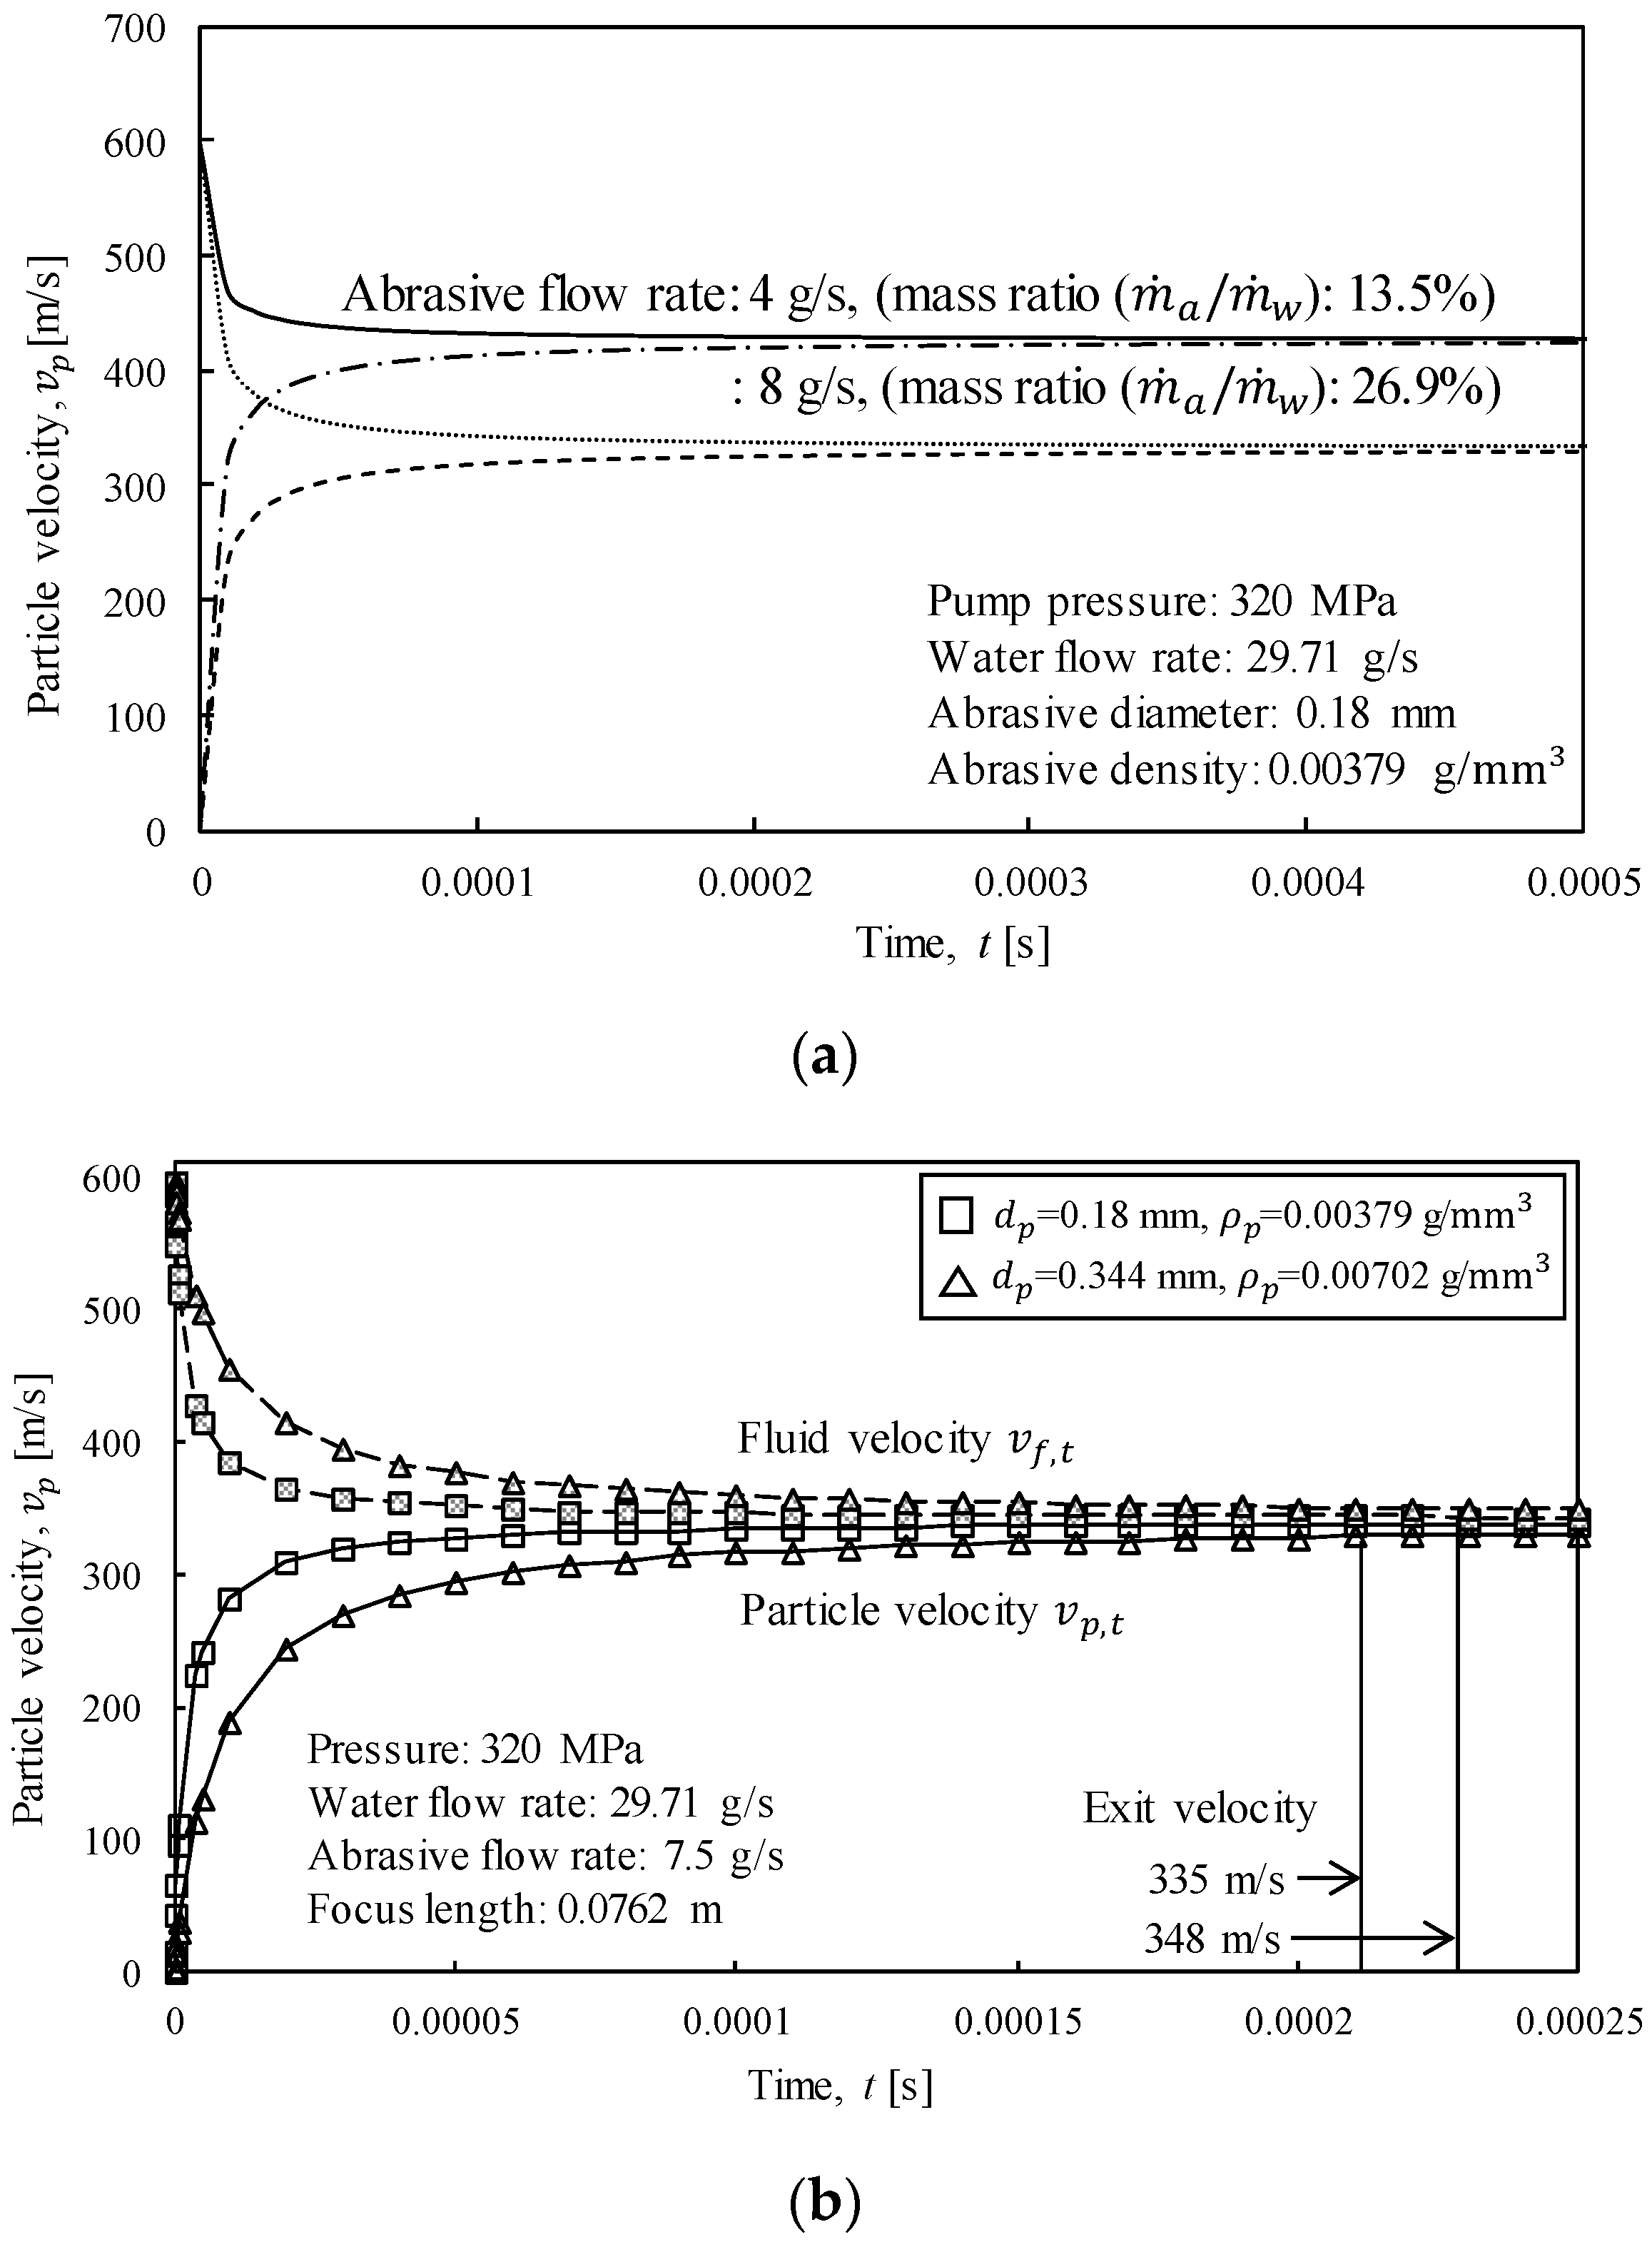
2.1. Acceleration of an Abrasive Particle

A high-pressure fluid from a pump passes through an orifice and becomes a high-velocity stream. According to Bernoulli’s principle, the energy of the pump, which comprises the pressure, kinetic energy, and potential energy of the fluid, is applied consistently throughout the waterjet system as follows:
( in   the   pump )   p f , p ρ f + v f , p 2 2 + g h p = p f , 0 ρ f + v f , 0 2 2 + g h 0 ,   ( in   the   pipe ) ,
where p f , p and p f , 0 are the pressures of the fluid in the pump and pipe, respectively; v f , p and v f , 0 are the velocities of the fluid in the pump and pipe, respectively; g is the gravitational acceleration; h p and h 0 are the potential heads in each section; and ρ f is the density of the fluid. It is expected that p f , p >> p f , 0 0 , v f , 0 >> v f , p 0 , and h p = h 0 [34,35]. Thus, the pump pressure ( p f , p ) determines the initial fluid velocity ( v f , 0 ) based on the fluid density ( ρ f ) after passing through the orifice:
p f , p ρ f = v f , 0 2 2 .
A water stream that passes through an orifice experiences turbulence. Due to this energy loss, the initial velocity of the fluid could be obtained as follows by considering the resistance constant (K), which is affected by the shape and size of the orifice nozzle:
v f , 0 = ( 1 K ) 2 p f , p ρ f ,
where the resistance constant (K) is 0.5 for a square-edged orifice, 0.25 for a chamfered orifice, and 0.04–0.28 for a rounded orifice [36,37]. The momentum of the water flow produced by the pump is converted into the momentum of the accelerated abrasive, which results in the momentum of the water–abrasive mixture slurry, and the total momentum is conserved as follows [34,38]:
m ˙ w v f , 0 = m ˙ w v f , t + m ˙ a v p , t = ( m ˙ a + m ˙ w ) v t ,
where m ˙ w is the fluid flow rate; m ˙ a is the abrasive flow rate; and v f , t and v p , t are the velocities of the fluid and particle at time (t). If the acceleration is sufficient to make the velocity of the abrasive equal to that of the fluid, the slurry velocity becomes the terminal velocity ( v t ). The slurry comprising the abrasive particles and water passes through the focus, and the energy efficiency is reduced according to the focus geometry and mixing efficiency. Thus, the terminal velocity becomes
v t = C e ( m ˙ w m ˙ w + m ˙ a ) v f , 0 ,
where C e is the mixing efficiency [37], which generally ranges from 0.57 to 0.71 [35].
The particle motion in the fluid explains the acceleration process of abrasive particles in reaching terminal velocity. The principal forces acting on the abrasive particles during their acceleration are the external acceleration force ( F 1 ) due to the momentum of the fluid and the drag force ( F 2 ) resisting the movement of the abrasive (Figure 2).
Thus, the external acceleration force ( F 1 ) becomes
F 1 = V p ( ρ p ρ f ) d v p , t d t ,
where V p is the particle volume and ρ p is the particle density. The drag force ( F 2 ) is a function of the drag coefficient ( C d ), as the streamlined motion of spheres depends on the Reynolds number and the projection area ( A d ) on which the force accelerating the particle is exerted, which is expressed as follows:
F 2 = 1 2 C d ρ f A d ( v f , t v p , t ) 2 .
Under a constant force, the sum of the forces acting upon a particle is zero ( F 1 + F 2 = 0), i.e.,
π d p 3 6 d v p , t d t ( ρ p ρ f ) + C d ρ f π d p 2 8 ( v f , t v p , t ) 2 = 0 ,
where d p is the diameter of the abrasive particle. Rearranging the equation yields
d v p , t ( v f , t v p , t ) 2 = 3 4 ρ f d p ( ρ p ρ f ) C d d t = α d p d t ,
where α is defined by the particle, fluid density, and drag coefficient and can be expressed as
α = 3 4 ρ f ρ p ρ f C d .
Integrating Equations (10) and (11) over velocity and time, respectively, we can write
1 ( v f , t v p , t ) 2 d v p , t = α d p d t .
This integration yields
1 v f , t v p , t + C = α d p t ,
where C is the integral constant. As the initial velocity of the particle is zero, the integral constant (C) is obtained as follows:
C = 1 v f , 0 .
Upon substituting C from Equation (14) into Equation (13), the particle velocity at the acceleration time (t) becomes
v p , t = v f , t d p v f , 0 α v f , 0 t + d p .
Equation (15) can be expressed using the function of the fluid ( v f , t ) and the particle velocity ( v p , t ) at the acceleration time (t) and with the initial fluid velocity ( v f , 0 ), as follows:
v f , t = v f , 0 m ˙ a m ˙ w v p , t .
By substituting the fluid velocity at time (t) from Equation (16) into Equation (15), the particle velocity at one moment ( v p , t ) is given by
v p , t = ( m ˙ w m ˙ w + m ˙ a ) ( v f , 0 d p v f , 0 α v f , 0 t + d p ) .
Upon substituting the initial fluid velocity ( v f , 0 ) from Equation (4) into Equation (17), the particle velocity at acceleration time (t) finally becomes
v p , t = ( 1 k ) 2 p f , p ρ f ( m ˙ w m ˙ w + m ˙ a ) ( 1 4 d p ( ρ p ρ f ) 3 ρ f C d v f , 0 t + d p ) .
By integrating the particle velocity ( v p , t ) over time (t), the distance traveled by particle ( l p , t ) during acceleration is
l p , t = 0 t v p , t d t = ( m ˙ w m ˙ w + m ˙ a ) { v f , 0 t d p α ( ln | α v f , 0 t + d p | ) } + C ,
where C is the integral constant. As the traveled distance at t = 0 is zero, the integral constant ( C ) is obtained as follows:
C = ( m ˙ w m ˙ w + m ˙ a ) d p α ln | d p | .
The distance traveled by the abrasive particle ( l p , t ) is given by
l p , t = ( m ˙ w m ˙ w + m ˙ a ) { v f , 0 t d p α ( ln | ( α v f , 0 t + d p ) / d p | ) } .
Figure 3 shows the velocity of the abrasive particle and fluid and the distance traveled by the particle under the following conditions: a pump pressure of 320 MPa, a water flow rate of 29.71 g/s, and an abrasive flow rate of 7.5 g/s, with a particle diameter of 0.18 mm and a density of 0.00379 g/ mm 3 . These parameters were obtained using the velocity of the fluid and the abrasive particle (Equations (16) and (18)) and the model describing the distance traveled by the abrasive (Equation (21)), which was developed in this study. As the momentum of the fluid is transferred to the abrasive, the fluid velocity decreases, the abrasive velocity increases, and the distance traveled by the particle increases. When the focus length is 0.0762 m, the abrasive finishes acceleration and leaves the focus at the exit velocity. The time taken for acceleration is 0.000228 s, and the exit velocity of the abrasive particle is 348 m/s.

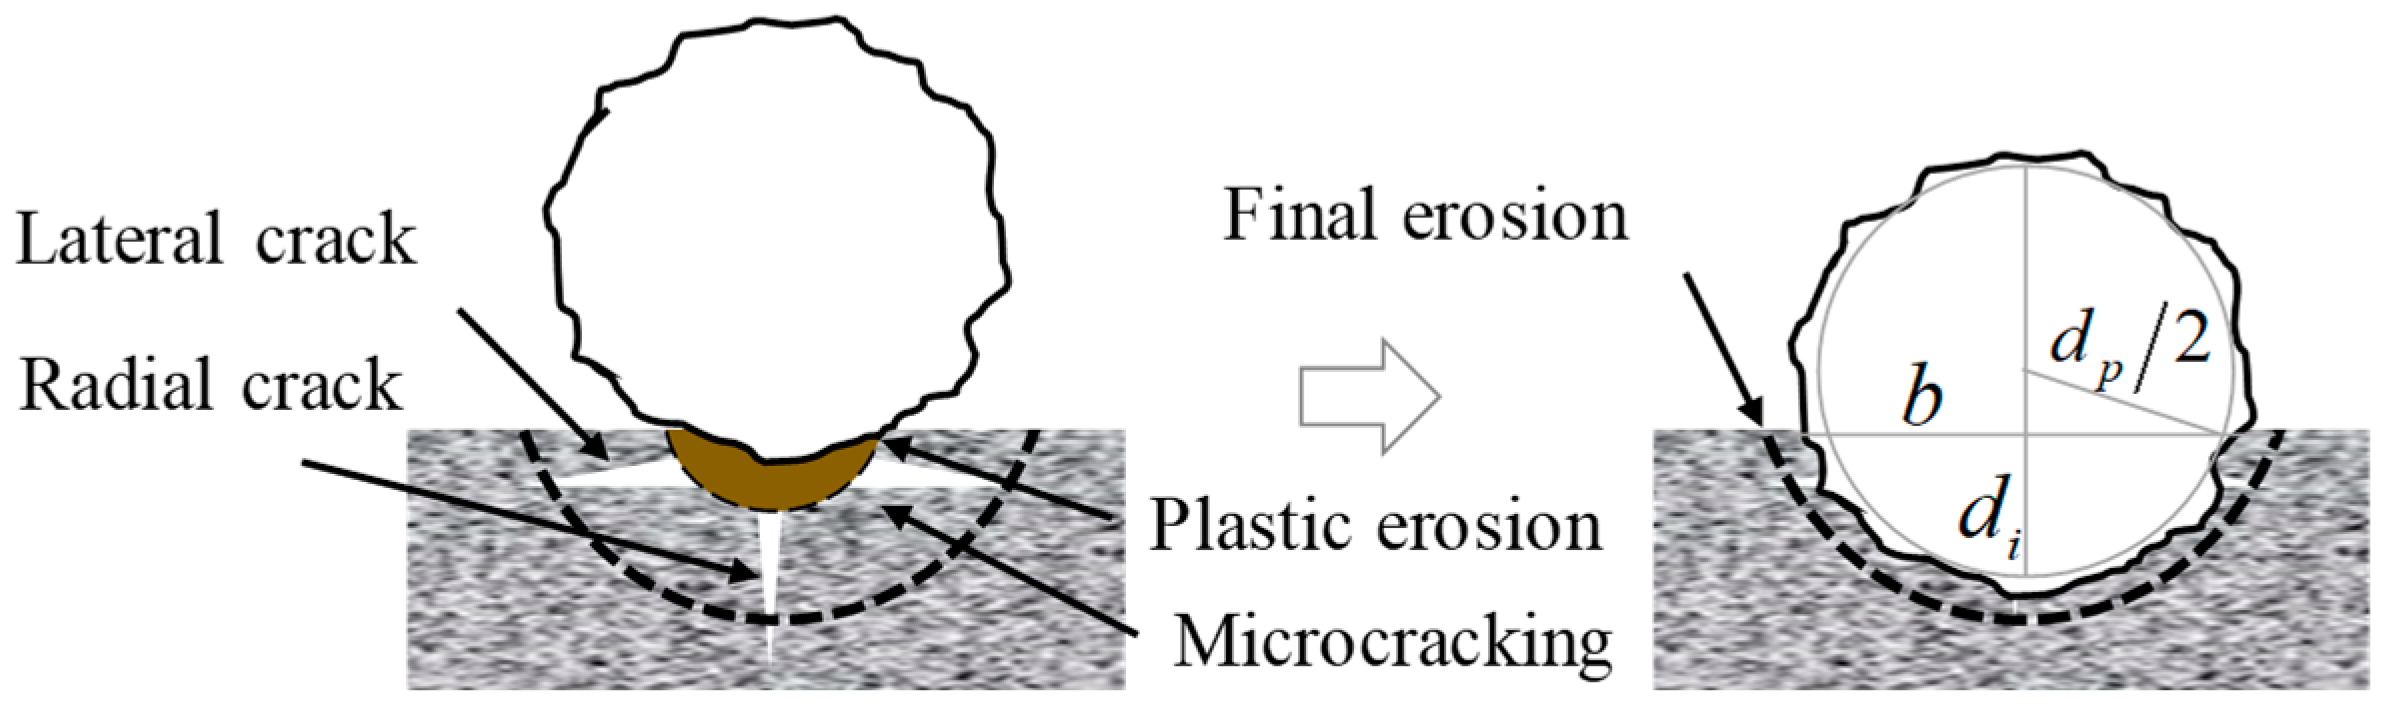
2.2. Abrasive Particle Energy and Erosion Model

The mass and velocity of the abrasive constitute the input energy of the abrasive particle ( E p ) for material removal, which is expressed as follows:
E p = π d p 3 ρ p v p 2 12 .
The removal work is a function of a resistance force as a hardness [9]. Considering the energy transfer effect during impact due to the relative hardness of the particle and the target that absorbs the input energy of the abrasive particle, the effective erosion kinetic energy ( E e ) can be expressed as [39,40]
E e = E p ( 1 1 + H t / H p ) ,
where H t and H p represent the hardness of the target and particle, respectively. As the input energy of the abrasive particle is converted into target removal work based on energy conservation, the volume of the target removed ( V r ) is associated with the energy of the particles that collide with the target ( E e ) in the following manner:
d V r d t d E e d t .
Therefore, the relationship between energy and work is given as follows:
π 2 b 2 H t d i = E p ( 1 1 + H t / H p ) = π d p 3 ρ p v p 2 12 ( 1 + H t / H p ) .
The deformation area can be expressed in terms of the erosion depth ( d i ) and particle diameter ( d p ) (Figure 1):
b 2 = ( d p 2 ) 2 ( d p 2 d i ) 2 .
Substituting Equation (26) into Equation (25), a cubic equation for the erosion depth ( d i ) can be obtained based on the abrasive particle energy ( E p ) and hardness ratio ( H t / H p ), as follows:
d i 3 d i 2 d p + 2 E p π H t ( 1 1 + H t / H p ) = d i 3 d i 2 d p + E c = 0 ,   E c = 2 E p π H t ( 1 1 + H t / H p ) .
In this case, the velocity of the abrasive is the exit velocity (Equation (18)), which is determined based on the properties of the abrasive particle. The cubic formula for erosion depth ( d i , Equation (27)) can be expressed as
d i = d p 3 + 1 54 ( ( 2 d p 3 27 E c ) + 27 E c ( 27 E c 4 d p 3 ) ) 3 + 1 54 ( ( 2 d p 3 27 E c ) 27 E c ( 27 E c 4 d p 3 ) ) 3 .
By calculating the sphere cap volume, the erosion volume V r can be obtained as follows:
V r = π d p d i 2 2 π d i 3 3 .
The characteristics of the erosion volume V r can be expressed as a function of the effective erosion kinetic energy and hardness of the target, as shown below:
V r d p 3 v p 3 ρ p 3 / 2 ( H t ( 1 + H t / H p ) ) 3 / 2 .
As it provides a simple expression for energy conversion into work during erosion, this model is called the simple energy–work erosion model. This model considers the effective erosion kinetic energy and relative hardness and proves that increasing the particle hardness increases the removal rate. This finding is similar to that of previous experimental and theoretical studies [41,42].

3. Model Verification

The suggested erosion model was verified by comparing its results to those obtained using elastoplastic and numerical models for brittle erosion [20,21]. A numerical analysis was performed using the continuous surface cap model (CSCM) in LS-DYNA to evaluate the brittle erosion due to the impact of a single particle.

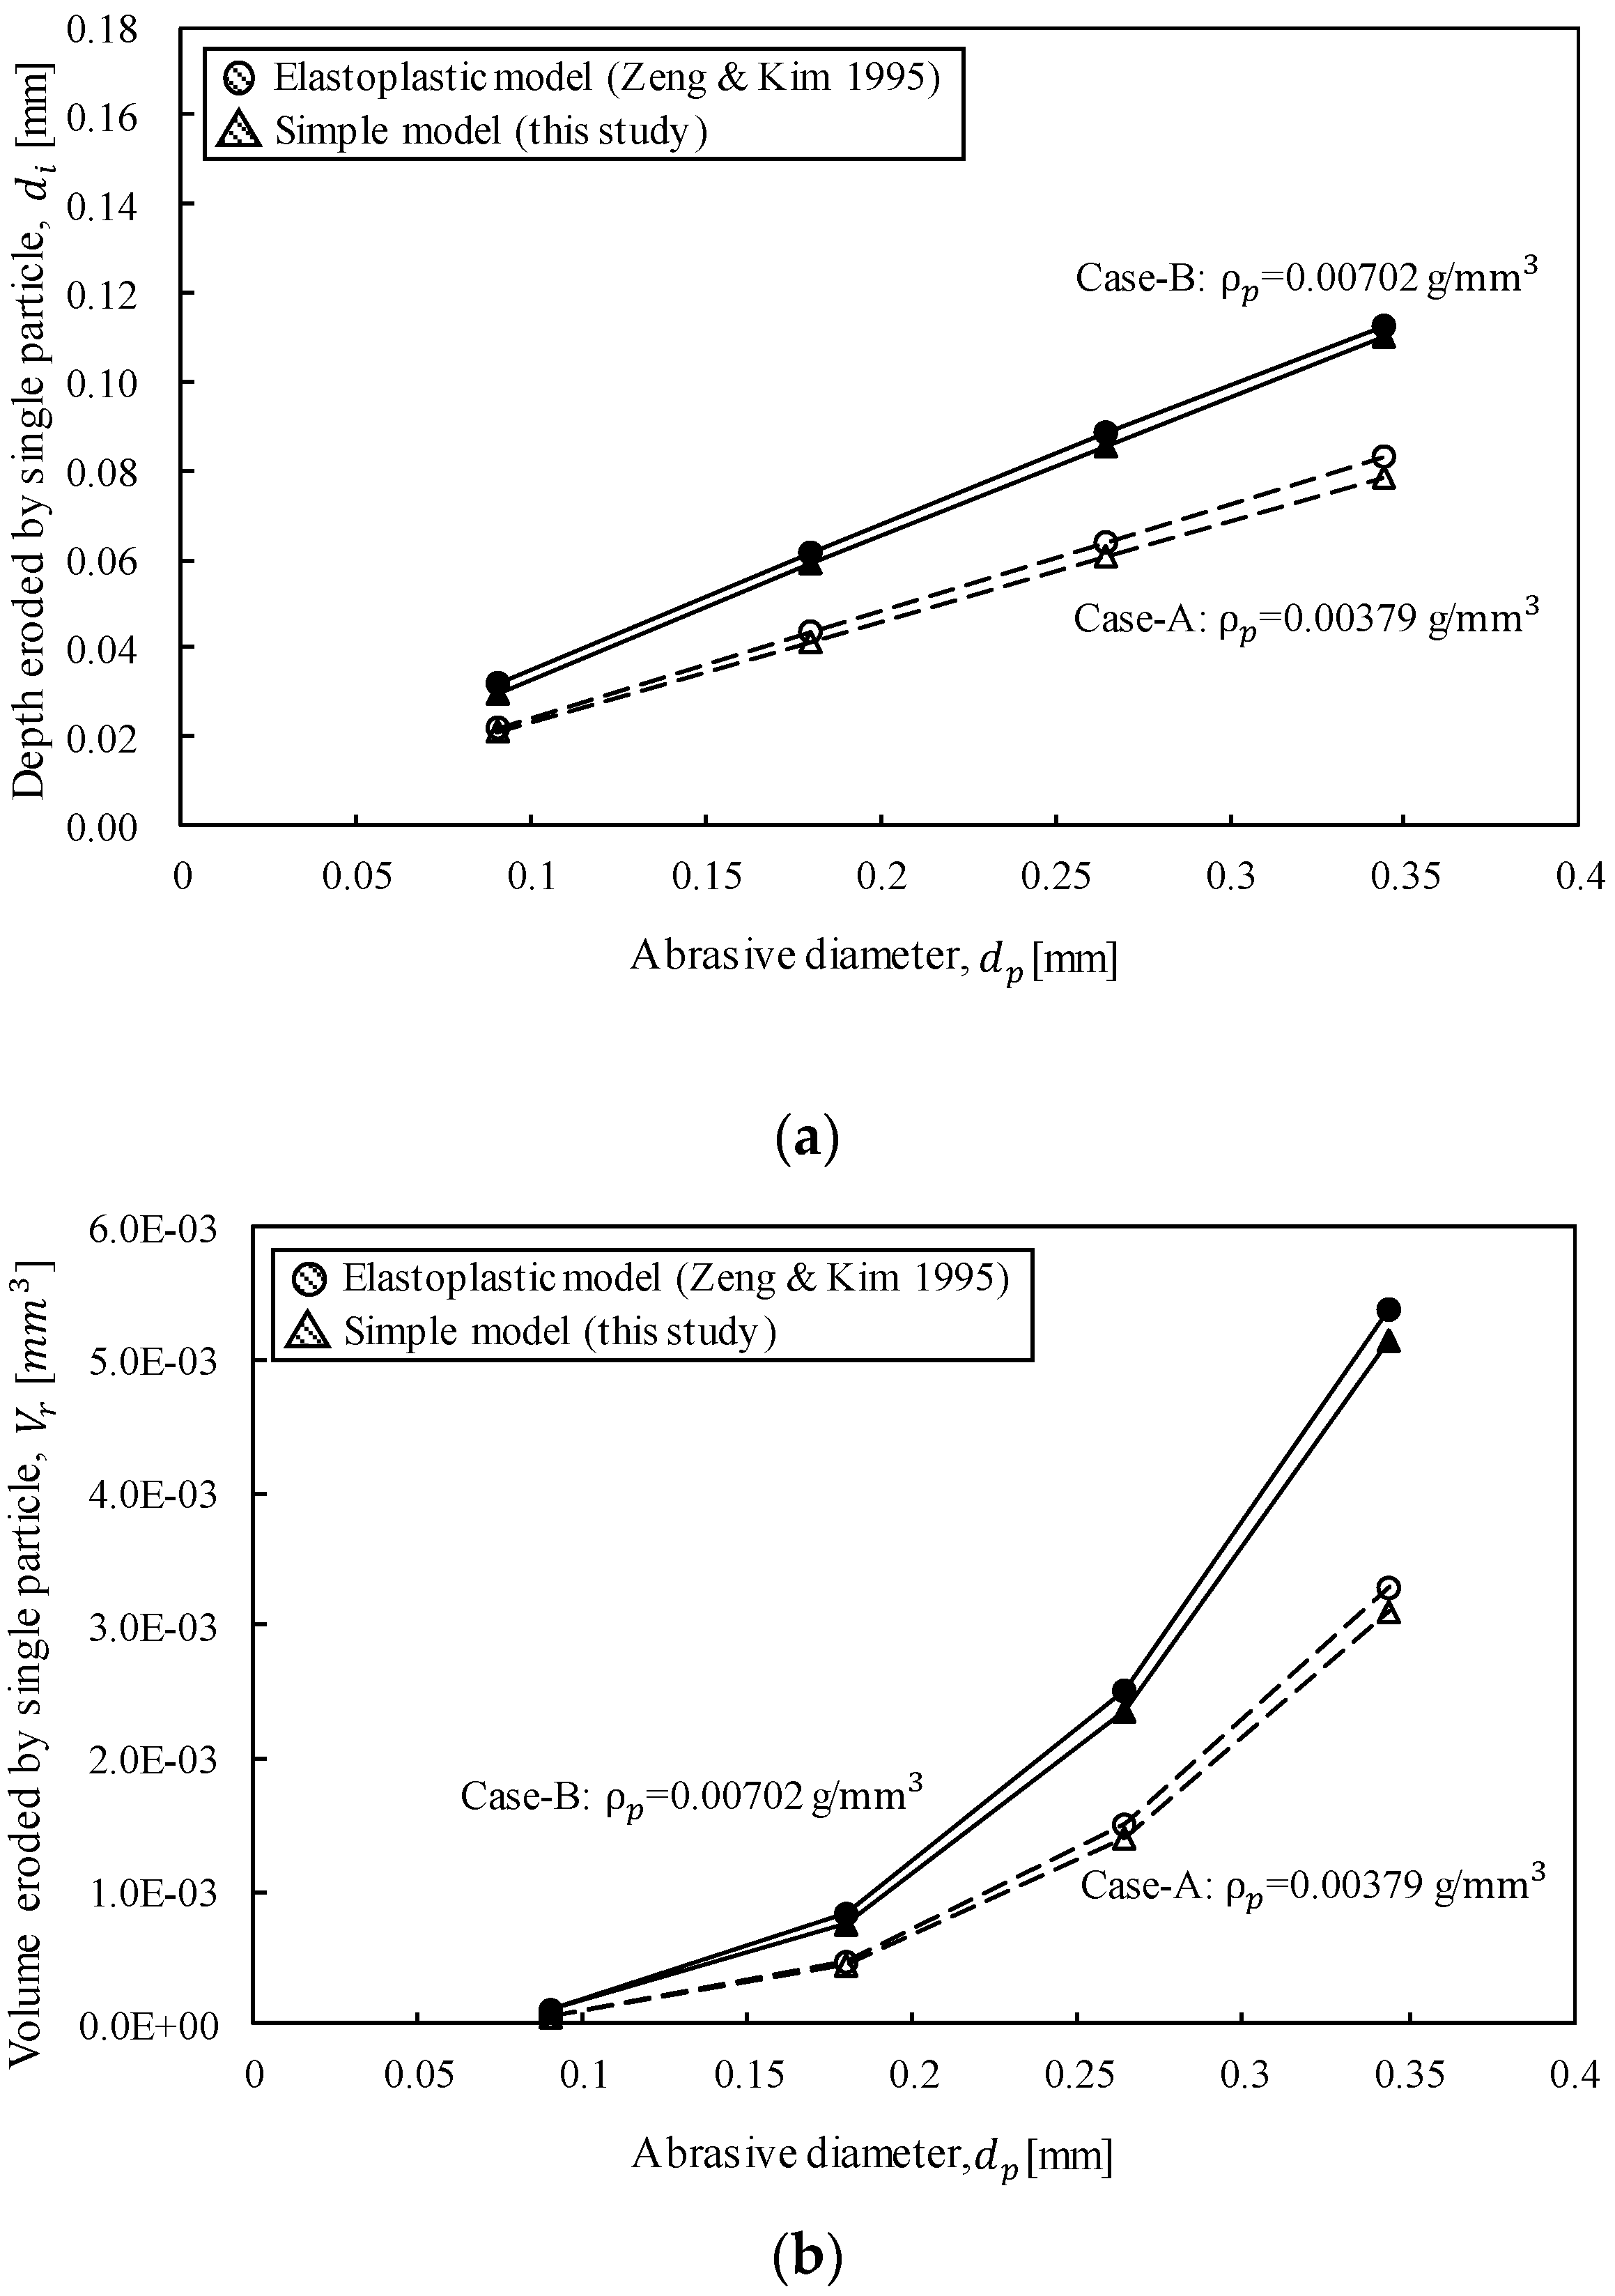
3.1. Theoretical Comparison of Erosion by Single Abrasive Particle

The model employed by Zeng and Kim [20,21] was chosen to verify our model for the following reasons. Because it is based on energy conservation, their model and that developed in this study are similar in that the erosion rate of rock-like material is calculated based on single particles. Their work was also suitable for comparison and verification of the theoretical and numerical results because plastic deformation and crack deformation occur simultaneously [43], as explained in the numerical analysis results obtained in this study.
For different kinetic energies, combinations involving different densities (A: 0.00379 g/ mm 3 and B: 0.00702 g/ mm 3 ) and diameters (0: ϕ 0.09 mm, 1: ϕ 0.18 mm, 2: 0.264 mm, and 3: 0.344 mm) of the spherical abrasive particles were used, resulting in a total of eight analytical cases (Table 2). The density and diameter of the abrasive particle were obtained from the commercial specifications for garnet and steel balls. The parameters used for theoretical verification, including the pump pressure and the water and abrasive flow rates, are given in Table 2, along with the abrasive and target material properties (e.g., diameter, density, and hardness). Under these conditions, the Reynolds number of the abrasive waterjet was in the range 18,600–20,000 [9,44]. The drag coefficient for smooth spheres under this condition was used to solve Equation (11) [36]. The exit velocity in each case was calculated (Equation (18)). The exit velocities of the abrasive particles ranged from 335 m/s to 352 m/s depending on their diameters and densities.
For the erosion model calculations, the Knoop hardness was used to describe the resistance to erosion. The Knoop hardness, also called microhardness, is often used for microscale analysis. The Knoop hardness is usually estimated based on the Vickers hardness and is suitable for evaluating microhardness-related characteristics such as microfractures or microsettlements. Therefore, the Knoop hardness was used to experimentally analyze the cutting performance of the AWJ [9,45].
In Figure 4, the erosion depth and volume, which were determined using the erosion model developed in this study (Equations (28) and (30)), are compared to those determined using the elastoplastic model (Equation (1) [20,21]). The erosion depth calculated using the suggested model was slightly smaller than that obtained from the elastoplastic model (Figure 4a): this can be attributed to the characteristics of microcracking in quasi-brittle erosion. Even with microcracks, the two sets of results corresponded well because of the high hardness of the target, resulting in considerable plastic erosion and small cracks. The erosion volume results obtained using the proposed model (this study) and those obtained using the elastoplastic model also matched well (Figure 4b). The results from the proposed model seemed to match better for smaller abrasive particles.

3.2. Numerical Analysis for Single Abrasive Erosion

The results from the proposed erosion model were numerically verified based on the exit velocity (Equation (18)), depending on the abrasive density and diameter. The finite element method based commercial program ANSYS/LS-DYNA was employed, which is a solver for finite element calculations used in many complex, real-world problems. It provides various rock and concrete material models that are widely used in geomechanical engineering analysis. As this program is suitable for nonlinear analyses of large strains, it is appropriate for analyzing the erosion of rocks by abrasives, which was the goal of this research.

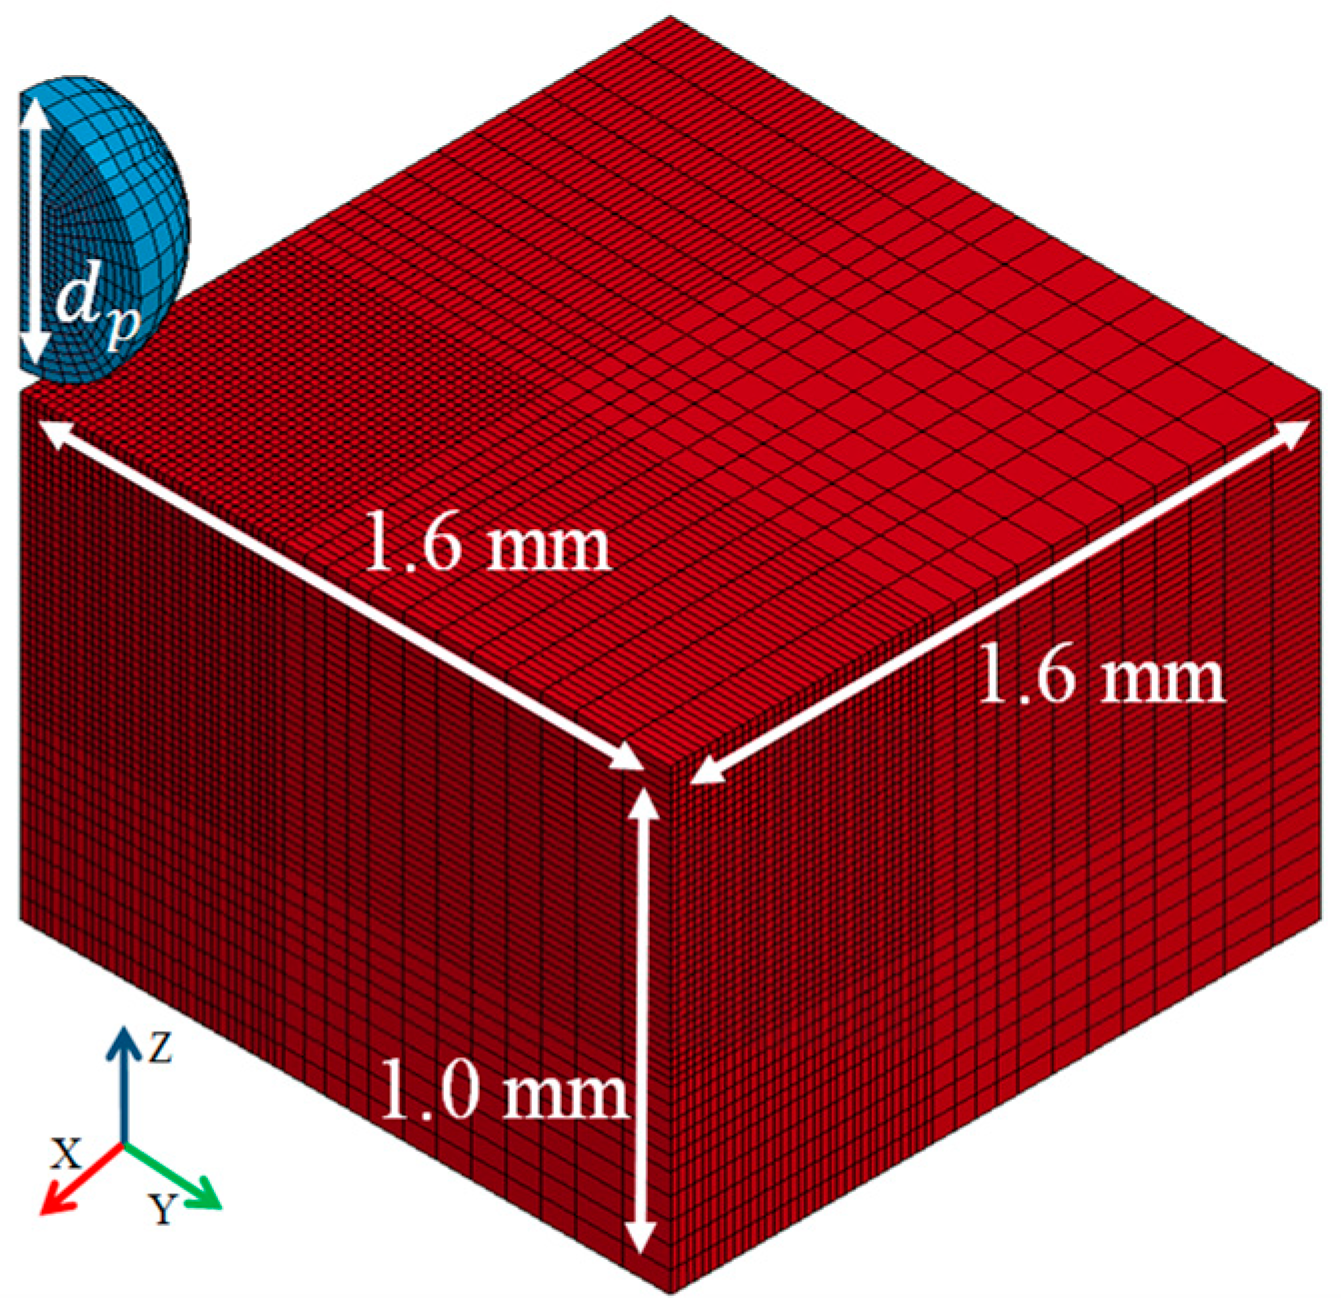
3.2.1. Numerical Model Details

Numerical analyses were conducted for the same cases as those in the theoretical tests (Table 2). LS-DYNA provides many material models for concrete, rock, and soil, including Brittle Damage, Johnson–Holmquist concrete, Concrete Damage Rel3, and Continuous Surface Cap Model (CSCM). To simulate plastic deformation and microcrack failure of the target simultaneously, CSCM was used as the damage model. In CSCM, crack failure occurs via brittle damage when the energy exceeds the threshold, due to tensile pressure [46]. This model is suitable for high-stress, large-strain conditions such as those present in crater formations, concrete spalling, and impact-induced fracture inside concrete [47]. Therefore, microcrack generation using a conical pick in rock [48], the unloading characteristics of rock [49], and the smeared crack approach for concrete damage progression under repeated impact [50,51] have been simulated using the CSCM. The properties of the target were measured and computationally modeled via numerical analysis (unconfined compressive strength: 236 MPa; tensile strength: 11 MPa; Young’s modulus: 56.5 GPa; Vickers hardness: 980 kg/ mm 3 ) (Figure 5 and Table 3). As the CSCM has many input parameters, the properties of the rock-like target were repeatedly adjusted and combined to obtain the same properties as those of the actual granitic rock specimen. To prevent breakage of the abrasive particles upon collision, an elastic model was used for modeling the abrasive particles.
During collision between a spherical abrasive particle and a box-shaped target rock at normal incidence, the entire model is symmetrical about the x and y axes; hence, a 1/4 symmetry physical model could be used. In addition, it was possible to reduce the computation time by increasing the meshing density of the impact area and widening the gap between the nodes at the boundary (Figure 6). To reduce the boundary effect, the target geometry was established at eight times the radius of the largest abrasive particle (i.e., d p / 2 = 0.172 mm), and the nonreflecting boundary condition was set on an outside surface in the model. The damage constitutive law and erosion criteria were used for evaluating nonlinear rock erosion, crack extension, and fragment formation upon contact [43,48]. The “Eroding Surface to Surface” and “Automatic General” keywords were applied for erosion through segment-based contact between the abrasive and target.

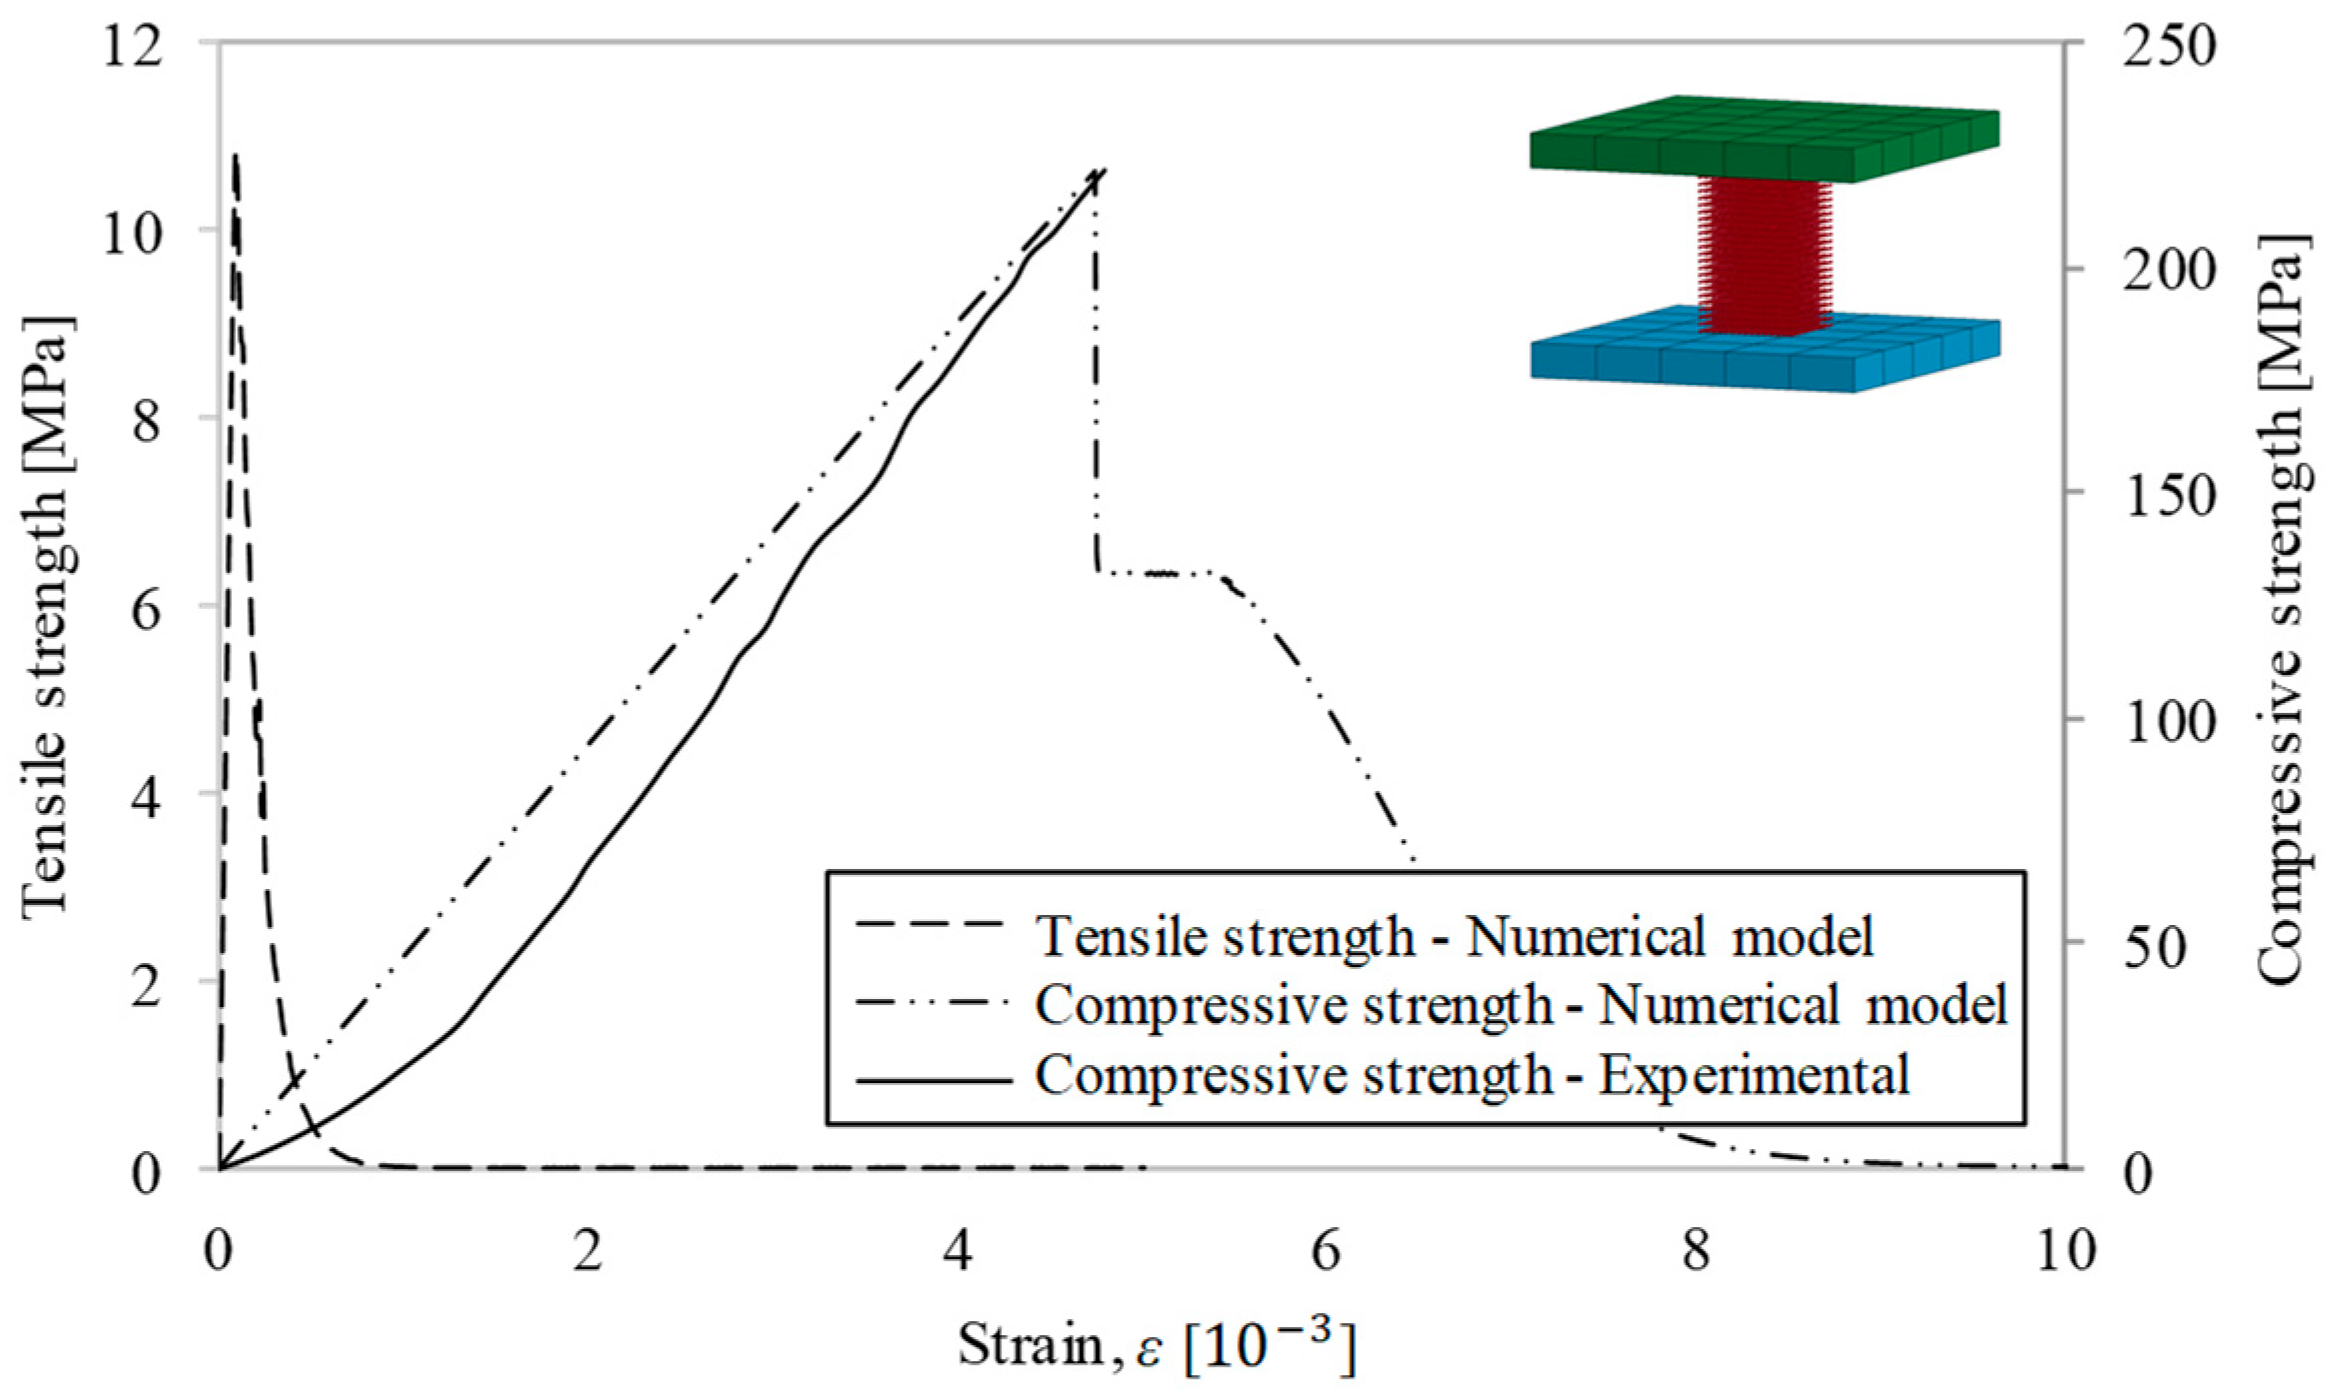
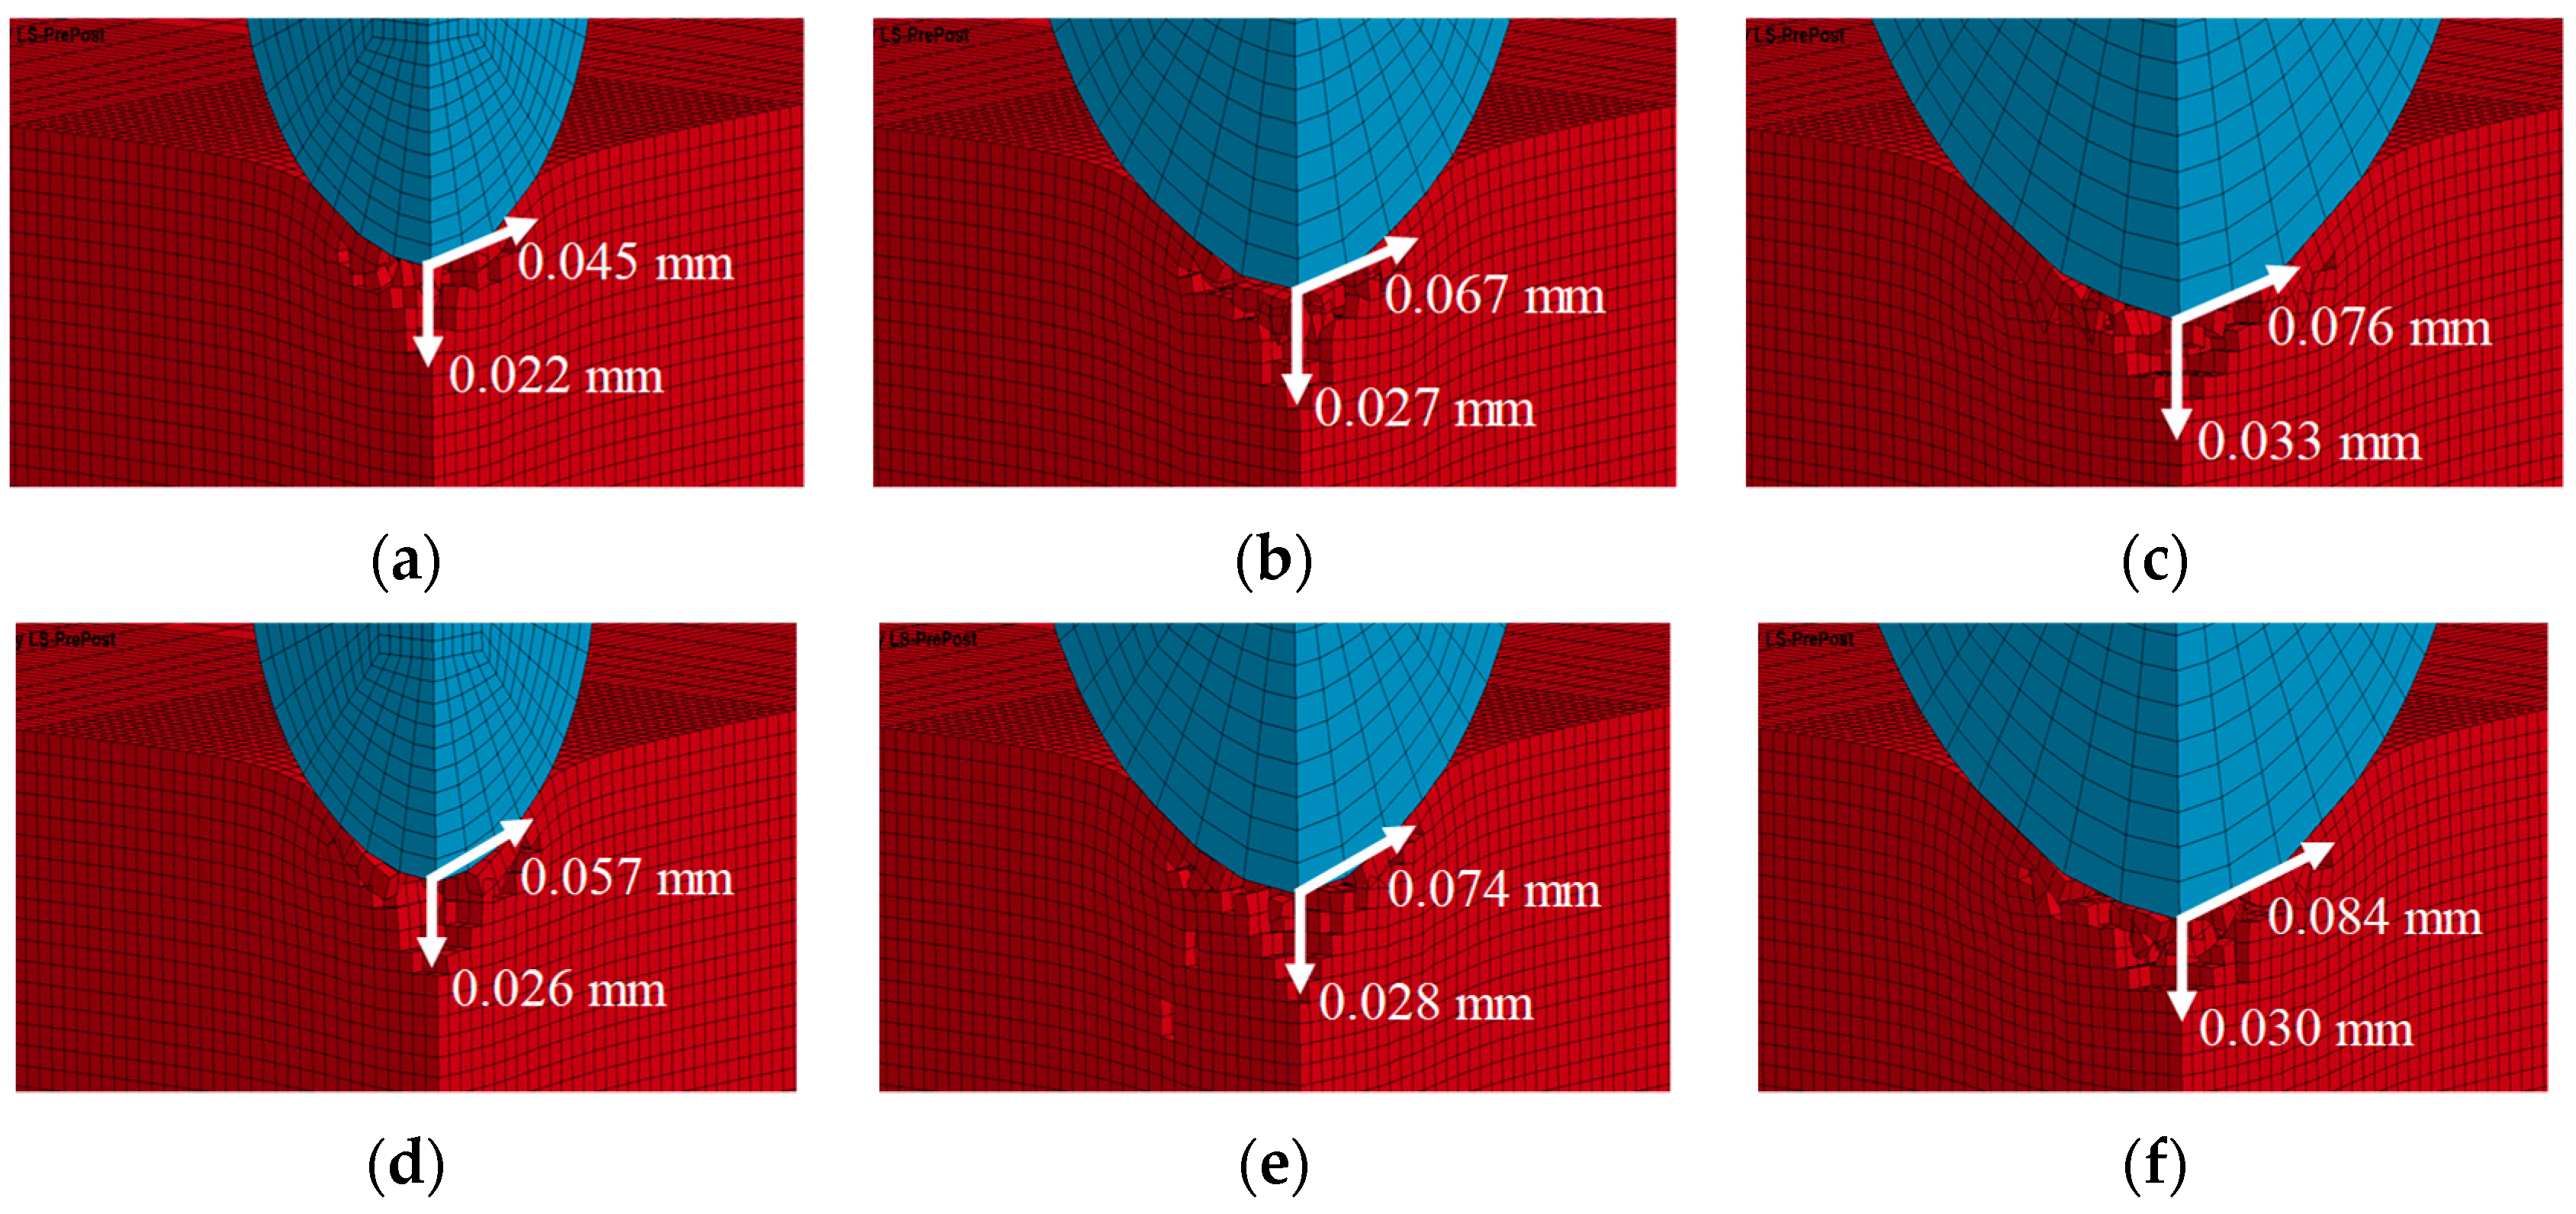
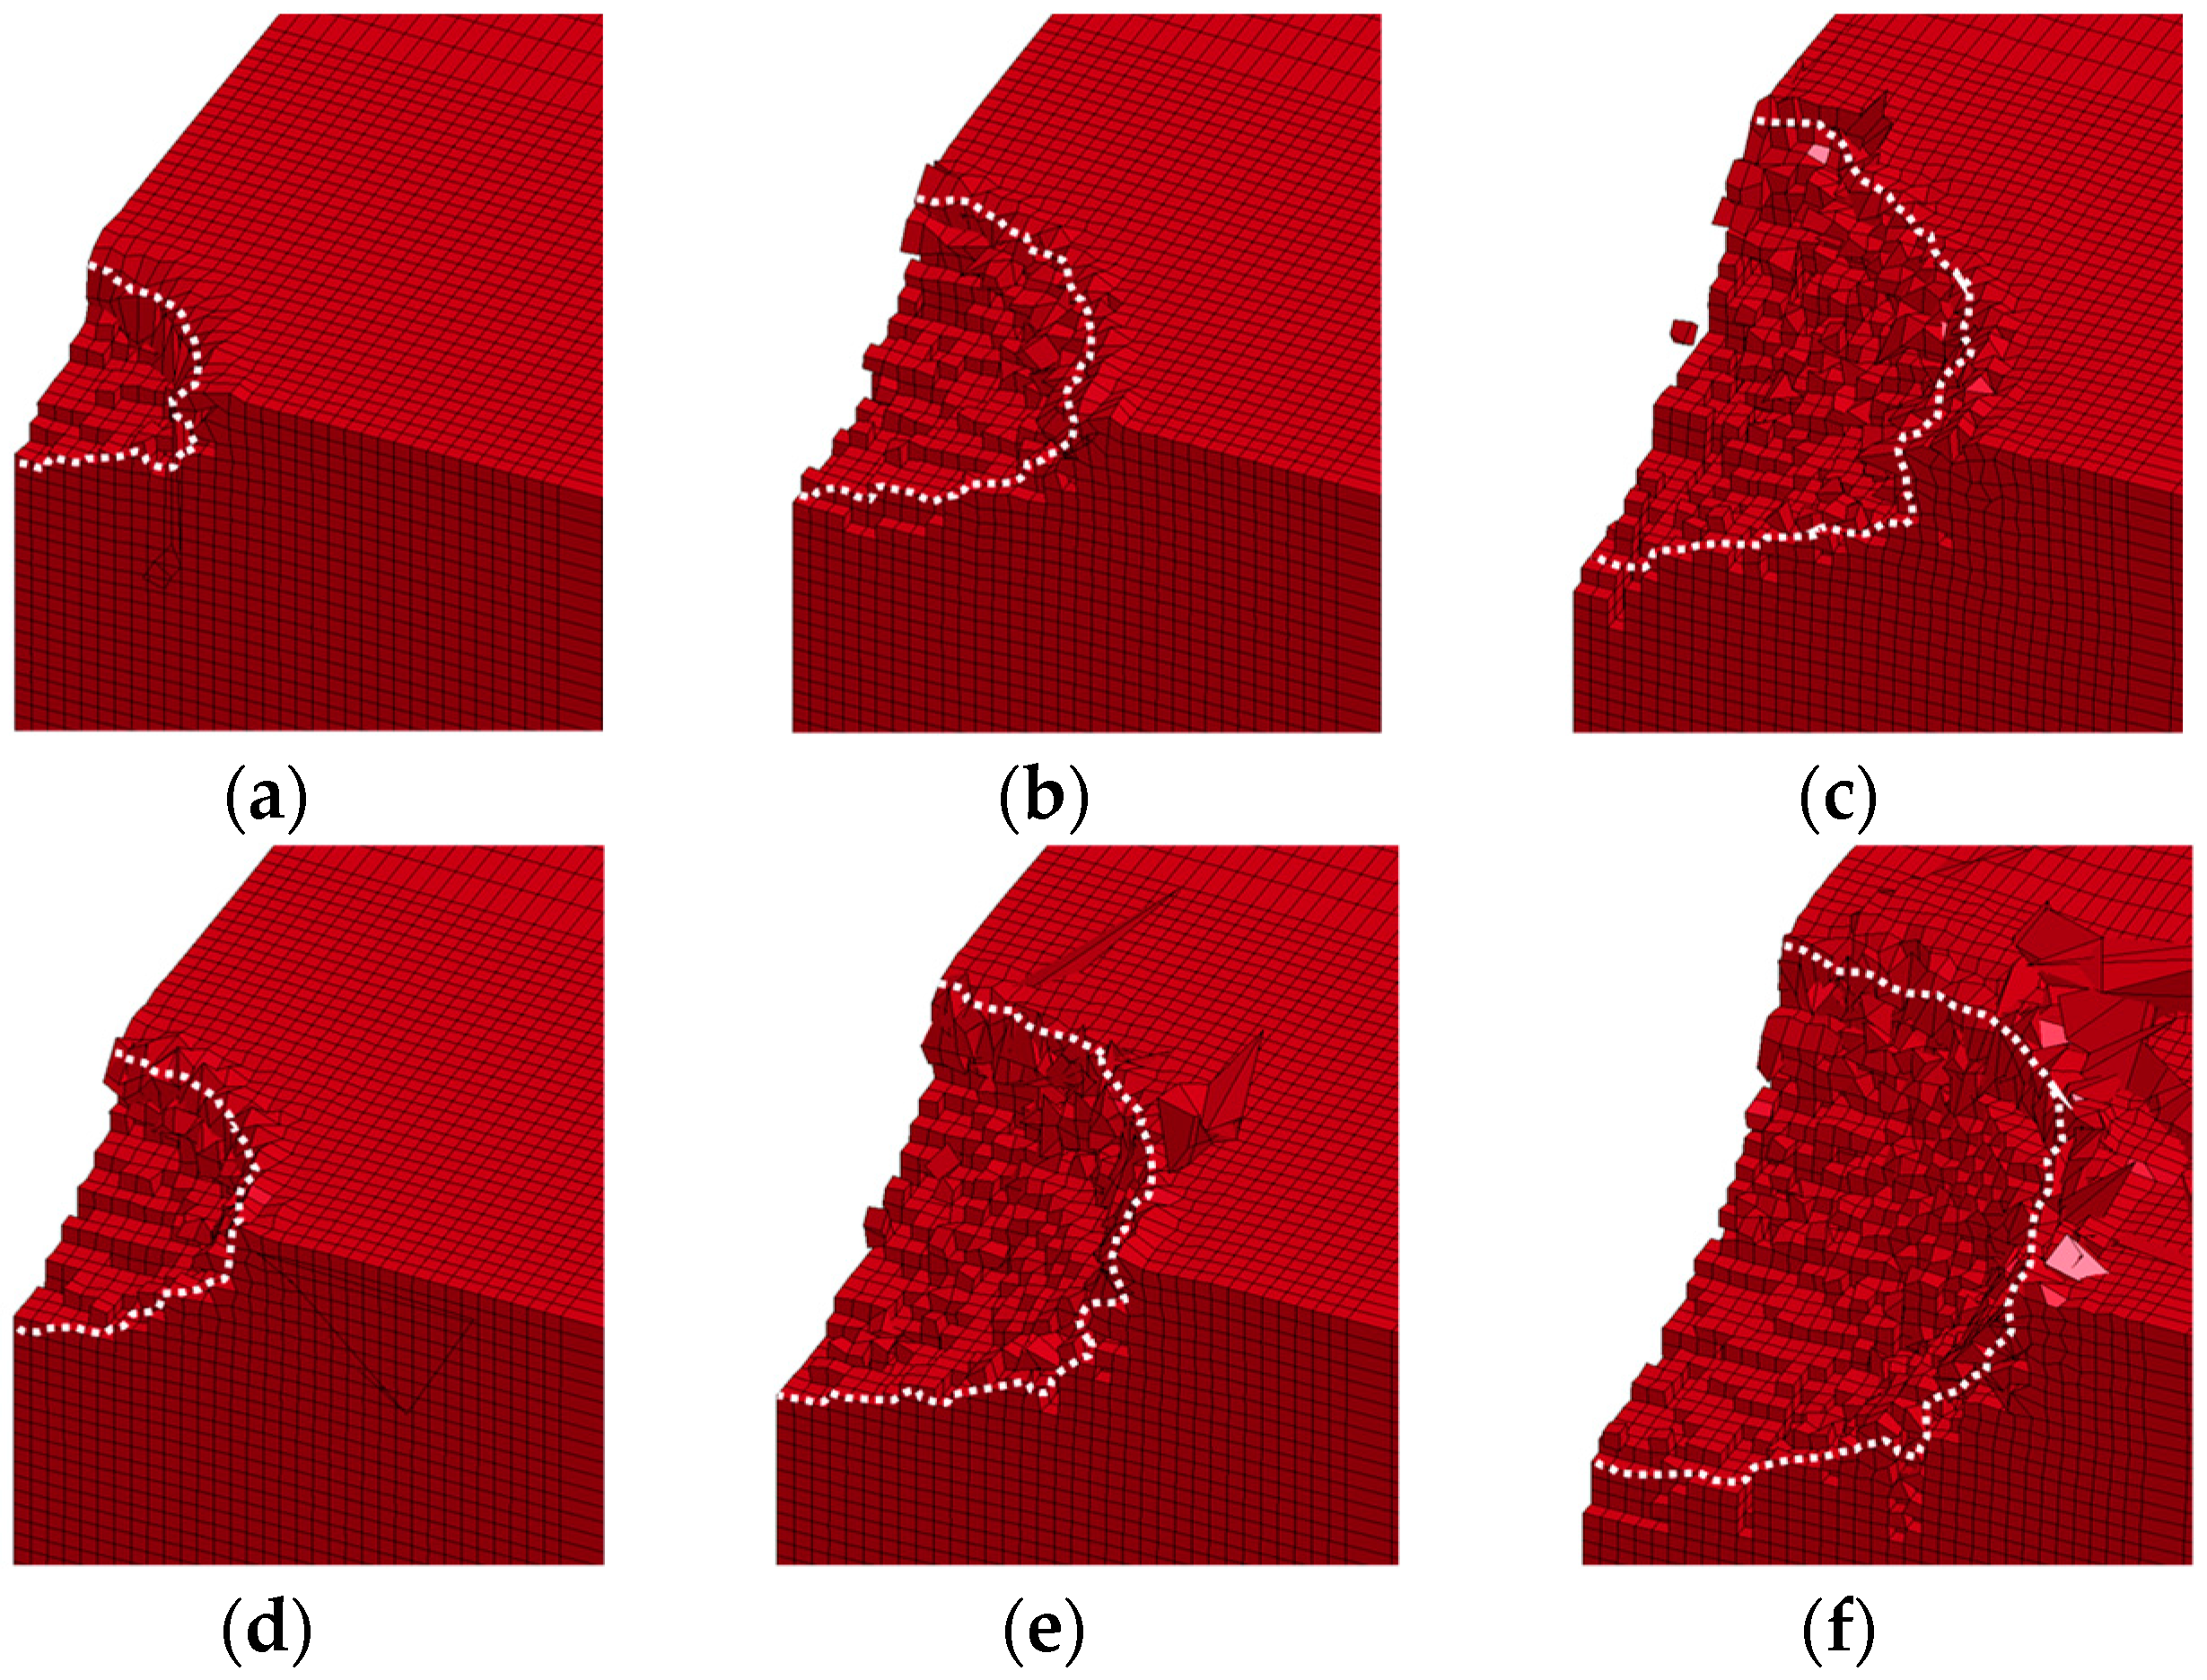
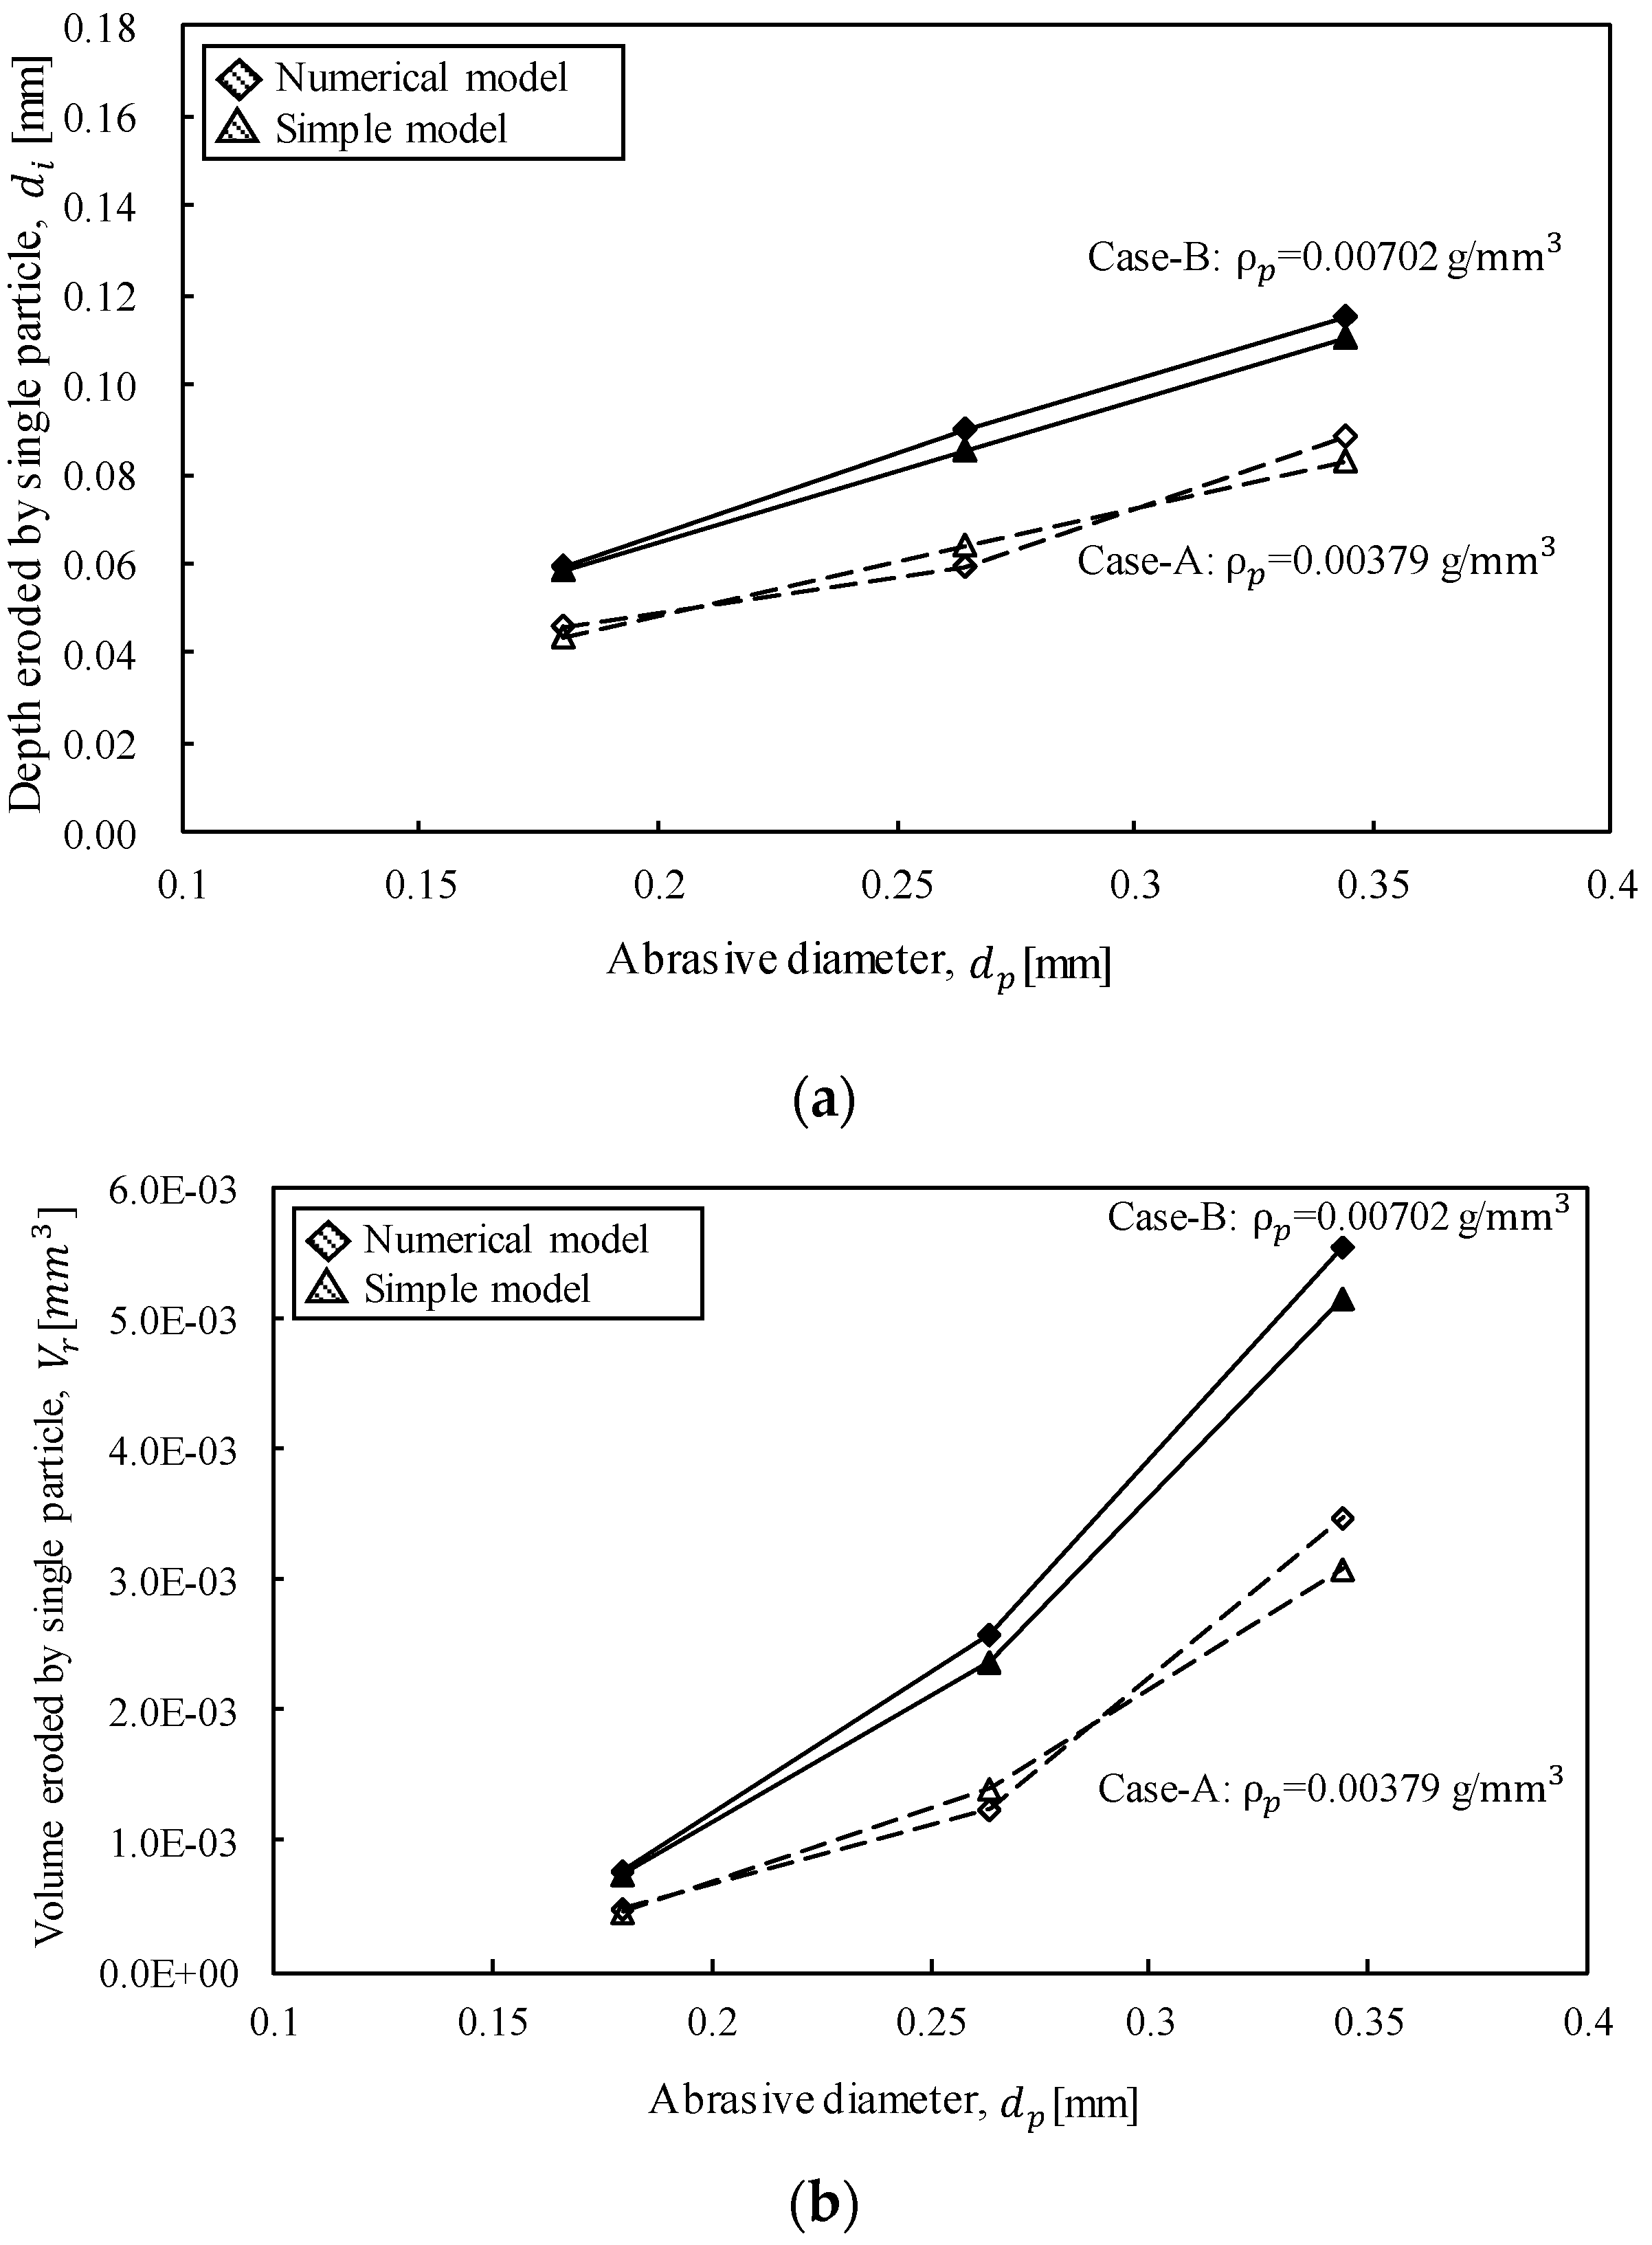
3.2.2. Numerical Analyses and Verification Results

Target sinking due to plastic deformation was evident (Figure 7), and microcracks appeared immediately. This finding was the same as that in previous studies, where the rock began to sink at first and experienced compression and breakage upon collision [43,51,52]. In the analysis results corresponding to abrasive diameters of 0.18 mm and 0.264 mm, half-penny-shaped microcracks were evident after plastic sink deformation, and lateral-shaped microcracks were observed when the abrasive diameter was 0.344 mm (Figure 7c,f). The numerically obtained erosion depths due to indentation by each abrasive particle are shown in Figure 8, and the erosion depth increased with an increasing density and diameter of the abrasive particles.
The numerically and theoretically calculated erosion depths and volumes due to single-particle impact are presented in Figure 9. The erosion depth obtained using the proposed simple model appeared to be 5% smaller; however, the model yielded results very similar to those provided by the numerical model under ideal conditions for all cases.

4. Parametric Study of Single-Particle Acceleration and Erosion

4.1. Abrasive Particle Acceleration Parameters

Parametric studies on the acceleration characteristics of the abrasive particles were conducted from various perspectives. The terminal velocity variation according to the abrasive flow rate is shown in Figure 10. At a higher abrasive flow rate, the momentum of the fluid delivered by the pump was transferred to a higher extent, accelerating the abrasive and decreasing the terminal velocity (Equation (18)). Figure 10b shows the change in velocity due to the acceleration of the abrasive particle and reduction in fluid velocity. The smaller the abrasive diameter and density, the faster the abrasive accelerated, and the faster the fluid decelerated. The acceleration rate was dependent on the properties of the abrasive at the early stages of acceleration, after which the acceleration velocity converged to the terminal velocity. Figure 10c depicts the distance traveled by the abrasive particle. The larger or heavier the abrasive was, the shorter the initial distance traveled by the particle was due to slow acceleration. As shown in Figure 10d, with a small water flow rate, the distance traveled was short, because the terminal velocity decreased due to the low fluid momentum. The theoretical results obtained using the developed acceleration model (Equations (18) and (21)) according to the mentioned abrasive properties led to the same conclusions as those obtained from previous theoretical [53], numerical [54], and experimental [55] results obtained by other researchers.

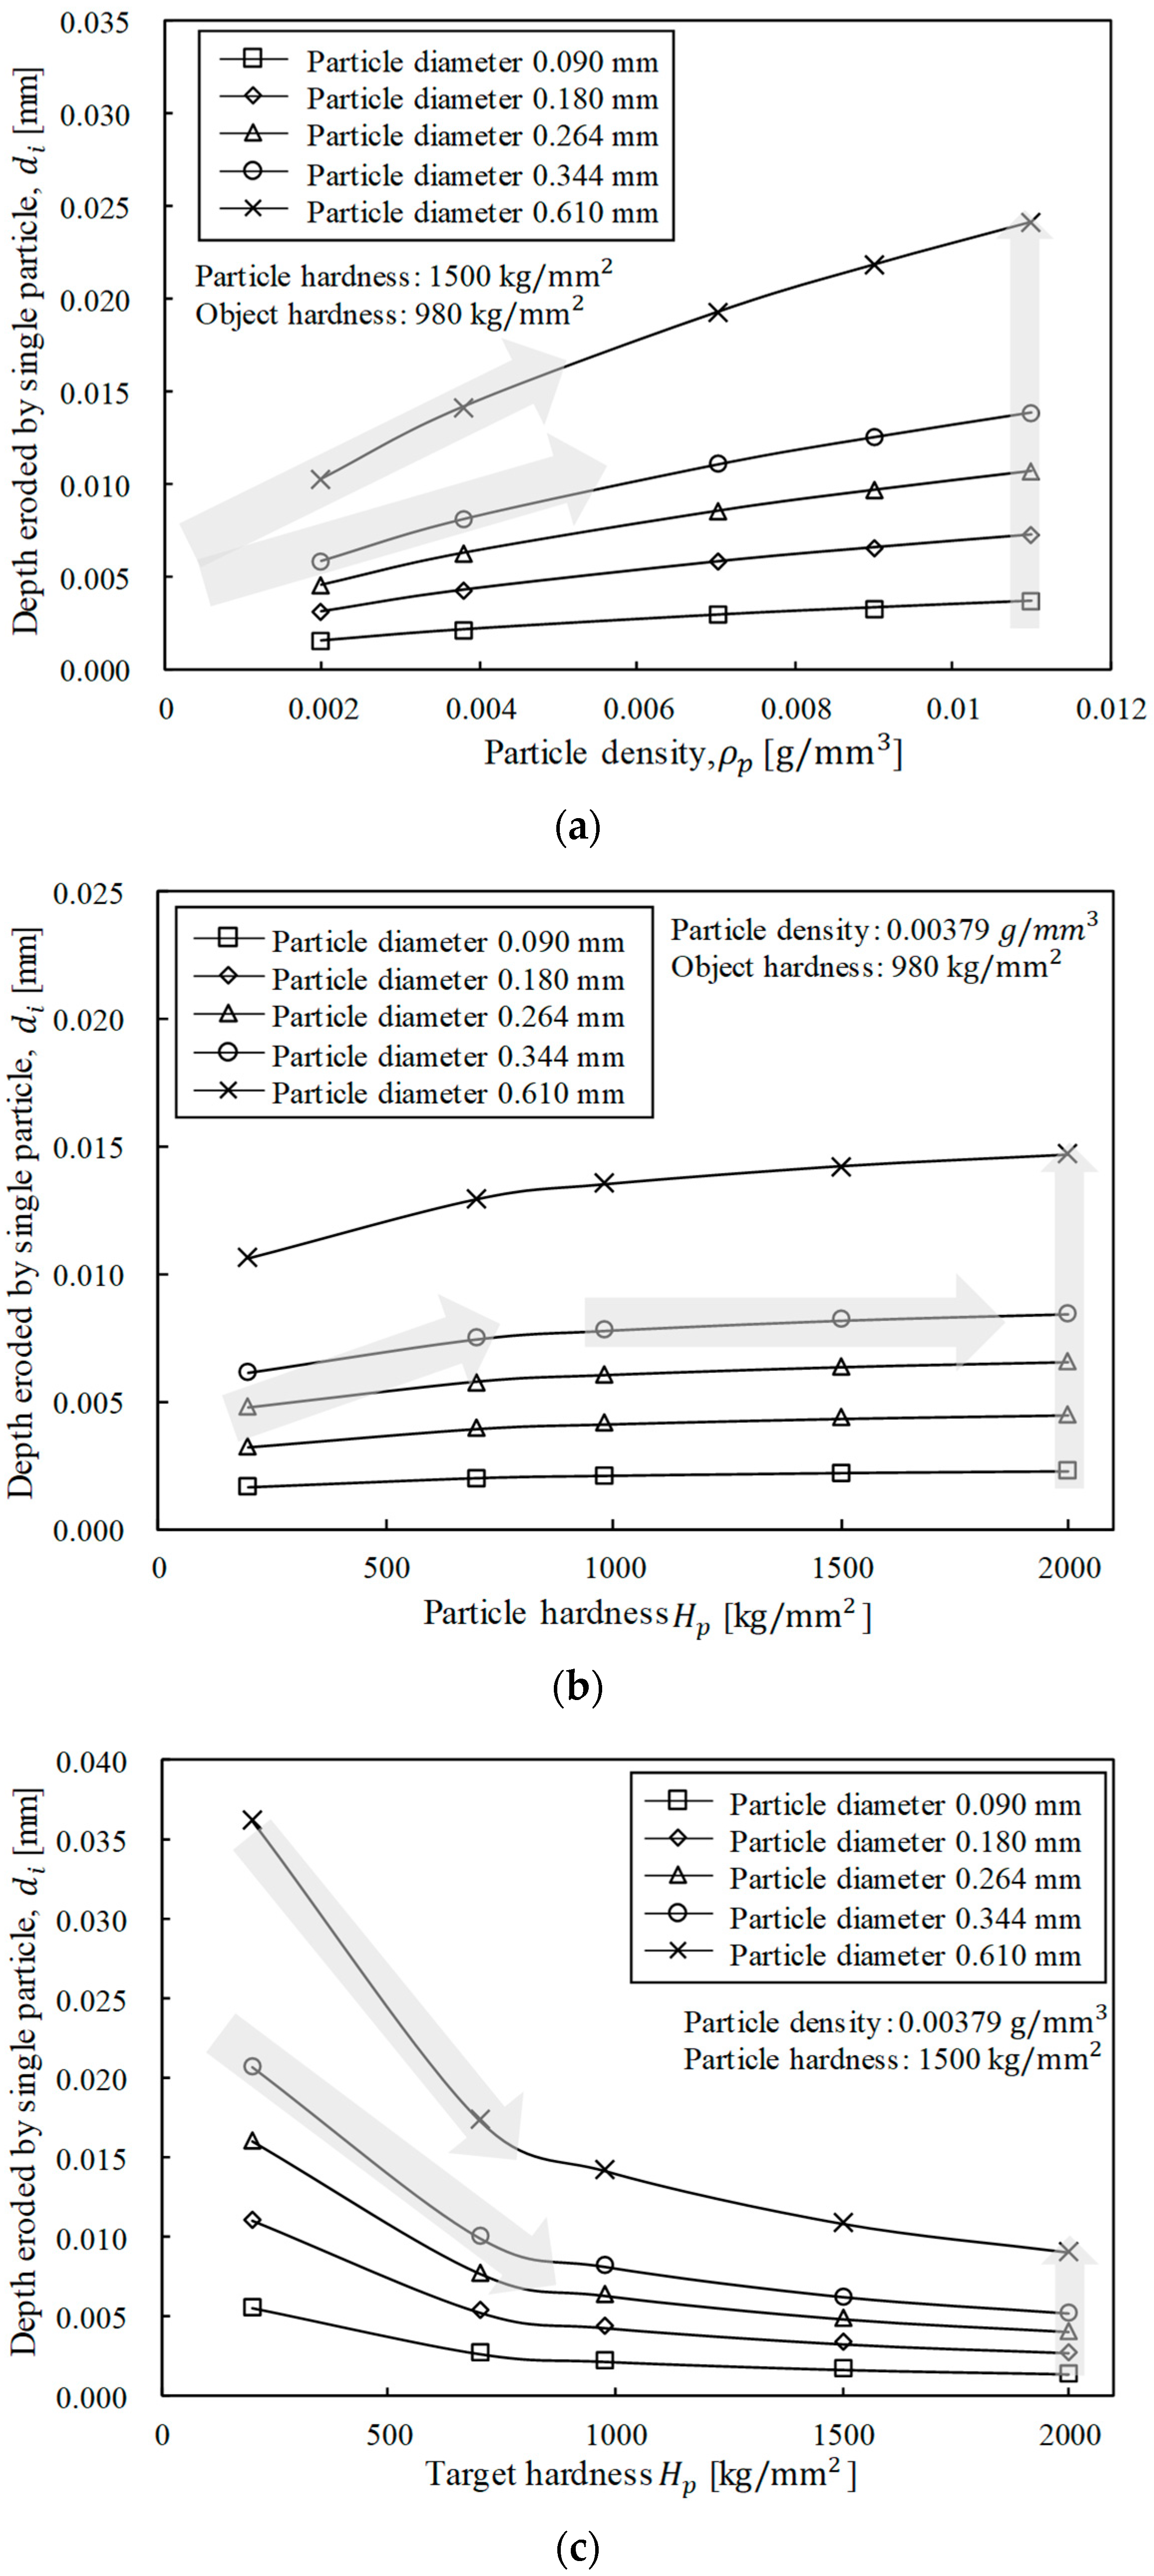
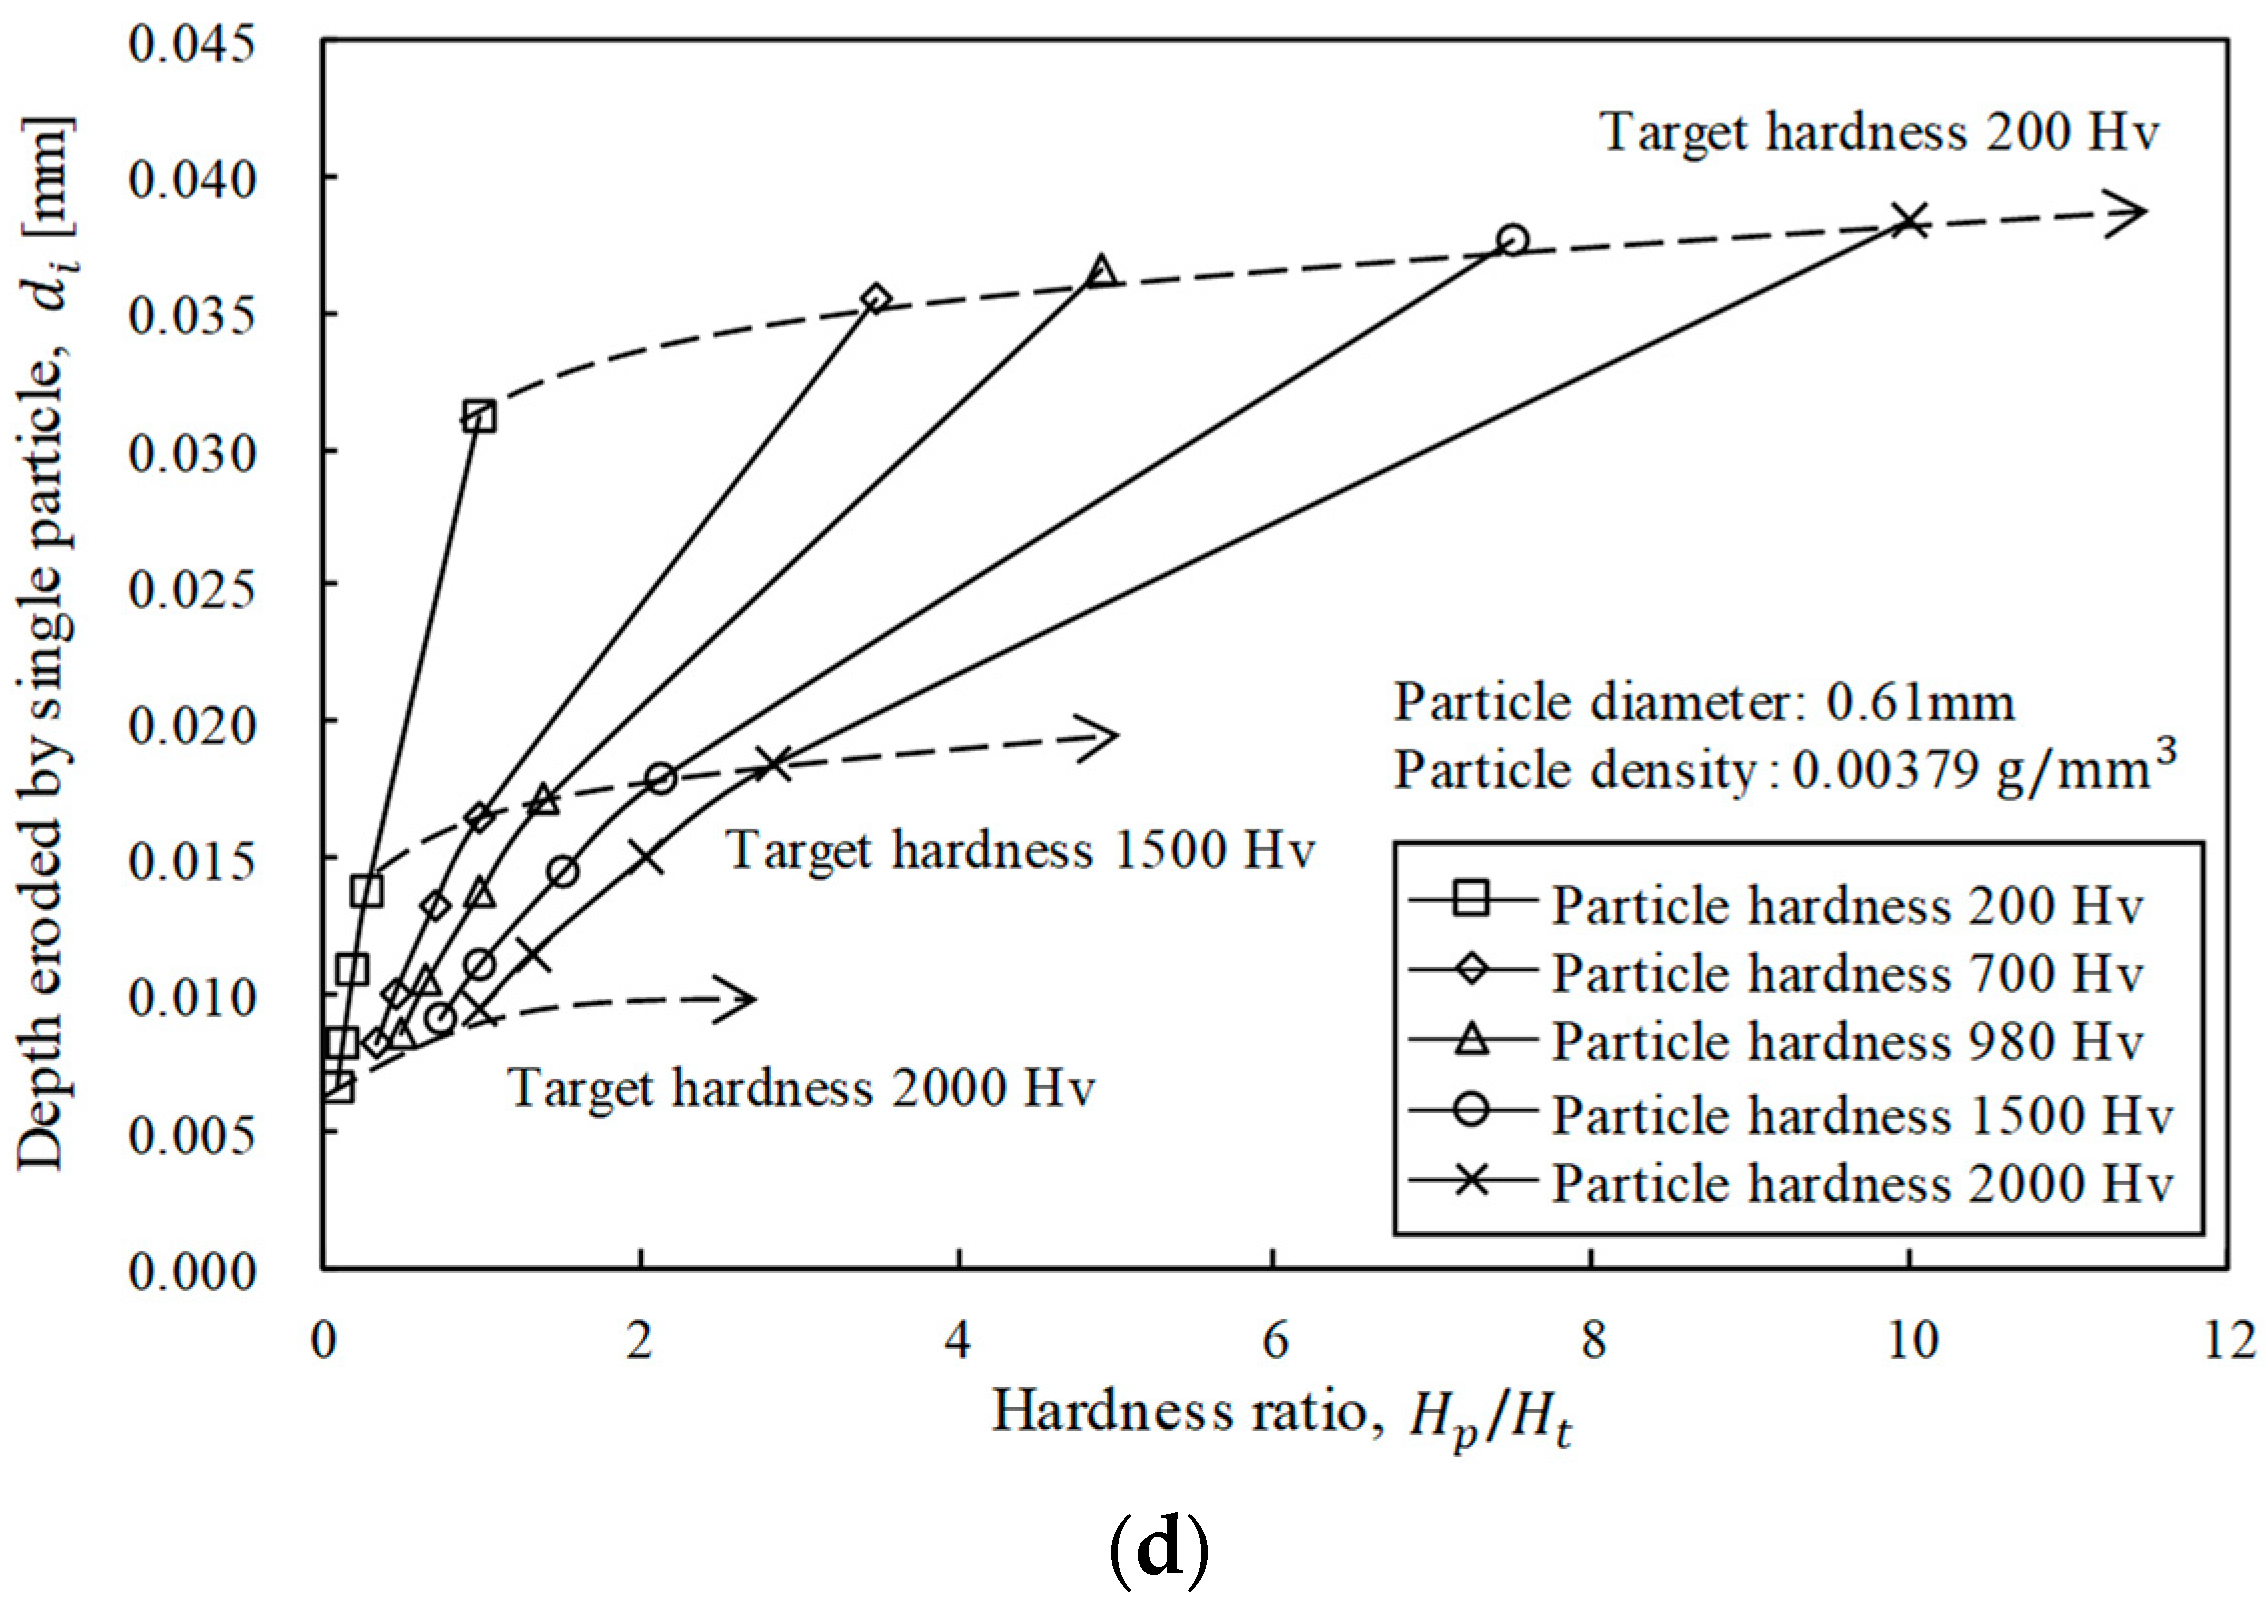
4.2. Single-Particle Erosion Parameters

Using the proposed erosion model, the relationships between the variables affecting erosion were analyzed. In this parametric study, the abrasive diameter was selected based on the commercial abrasives according to sieve specifications (30, 45, 60, 80, and 170 mesh): the used average particle sizes were 0.610, 0.344, 0.264, 0.180, and 0.09 mm according to American Society for Testing and Materials (ASTM) standards for particle size analysis. The hardness of the abrasive was close to that of garnet and steel balls, while the hardness of the target was close to that of granite. In the parametric study, a large hardness range was employed to forecast and review the trends in hardness changes.
As the density of the abrasive increased, the erosion depth increased, but the magnitude of the density effect decreased gradually as the density increased. The larger the diameter of the abrasive particle was, the greater the density effect was (Figure 11a). In addition, the greater the hardness of the abrasive particle was, the greater the erosion depth was; however this effect was not significant for small particle diameters (Figure 11b). As the hardness of the target increased, the erosion depth decreased. The larger the particle diameter was, the greater the effect of the target hardness was. The smaller the target hardness was, the larger the reduction in the particle diameter effect was, eventually leading to convergence (Figure 11c,d). The comprehensive erosion characteristics are presented in Figure 12.

5. Conclusions

Particle acceleration and erosion models were developed and verified in this study based on the properties of abrasives and target materials. This paper describes the abrasive acceleration process through hydrodynamic analysis considering the properties of the abrasive and fluid. Based on energy conservation, a simple energy–work erosion model for a rock-like material was developed, considering energy transfer due to hardness differences between the abrasive and target. This theoretical approach was verified through comparisons to a previous theoretical brittle erosion model and numerical analyses results. The results obtained using the proposed simple and convenient model showed good agreement with those obtained using the previous erosion model and numerical analyses. Through a parametric study using the proposed acceleration model and the simple energy–work erosion model, the effects of the abrasive and target properties on erosion performance were reviewed. The following are the major findings of this study:
  • The abrasive acceleration characteristics were theoretically derived depending on the density and diameter of the abrasive particle, the density of the fluid, and the fluid flow state. Therefore, the particle velocity, exit velocity, and distance traveled by the particle could be calculated;
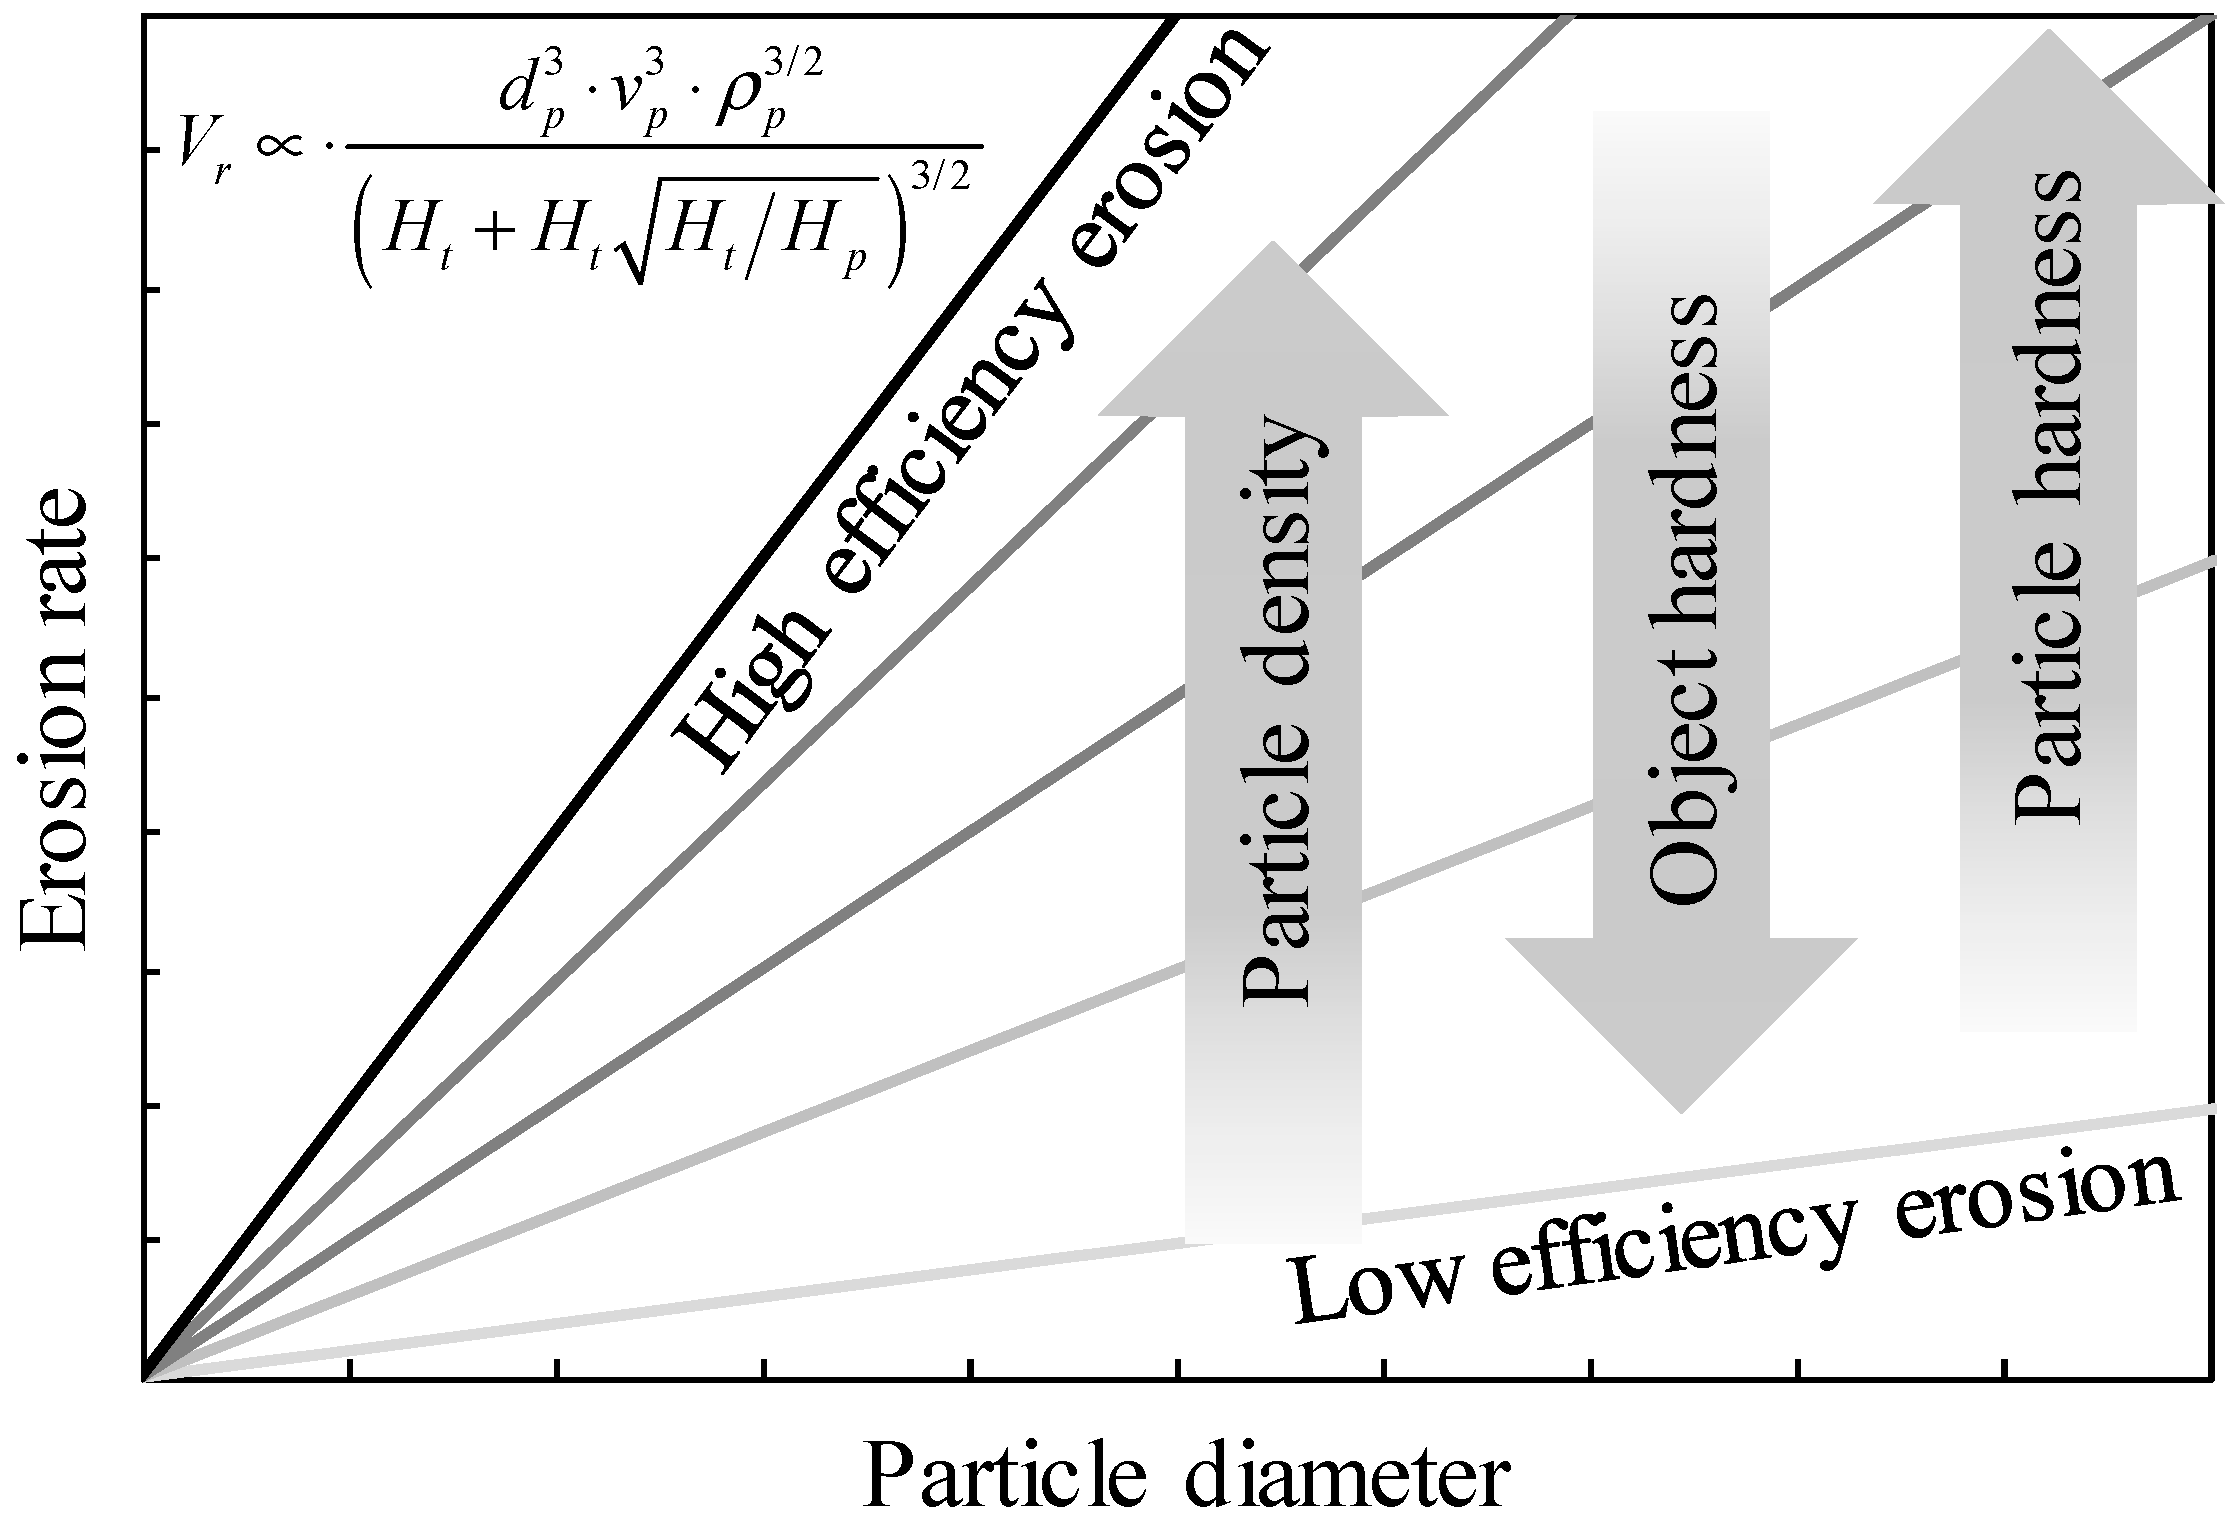
  • A simplified erosion model was developed considering the hardness as a resistance force for energy transfer from the particle to the target. The erosion depth and volume could be calculated depending on the diameter, density, and hardness of the abrasive particle and target;
  • For the erosion of rock-like materials, simultaneously occurring plastic failure and microcracking were simulated numerically. A CSCM was used for modeling the brittle material, and this numerical model was used to validate the theoretical erosion model developed in this study;
  • Parametric studies were conducted to evaluate the acceleration and erosion characteristics using a wide range of abrasive particle properties (diameters, densities, and hardness values) and target hardness values. General acceleration and erosion characteristics could be identified.
However, one limitation of this study was that the developed simple erosion model does not account for diversity in abrasive particle shapes and erosion caused by water. Therefore, further studies regarding the effects of abrasive particle shapes on targets and on erosion caused by water energy are required to overcome this limitation. Nonetheless, the results of this study can be used to estimate erosion rates based on the properties of the abrasive and target and to optimize the operation of AWJ systems.

Author Contributions

Conceptualization, G.-C.C. and Y.C.; formal analysis, T.-M.O. and Y.C.; investigation, Y.C.; writing—original draft preparation, T.-M.O. and Y.C.; writing—review and editing, G.-C.C. and Y.C.; supervision, G.-C.C.

Funding

This work was supported by a National Research Foundation of Korea (NRF) grant funded by the Korean government (MSIT) (No. 2017R1A5A1014883).

Conflicts of Interest

The authors declare no conflicts of interest.

Nomenclature

A d Projection area drag force exerted (mm2)
aFlaw distribution parameter
bRadius of indentation circle (mm)
C d Drag coefficient
C e Mixing efficiency coefficient
d p Diameter of abrasive particle (mm)
d i Depth of erosion by single particle (mm)
E c Constant term concerning the erosion energy
E e Effective kinetic erosion energy (J)
E p Erosion energy of single particle (J)
F 1 External acceleration force (N)
F 2 Drag force (N)
f w Proportional factor for stress-wave energy
gGravitational acceleration (m/ s 2 )
h 0 Potential head in the pipe tip section (mm)
h p Potential head in the pump section (mm)
H p Hardness of particle, Knoop (kg/ mm 2 )
H t Hardness of target, Knoop (kg/ mm 2 )
KResistance constant
k Threshold velocity of impact (m/s)
k a Constant for kinetic structure of reaction
l p , t Distance traveled by the particle (mm)
mReaction order
m ˙ a Abrasive flow rate (g/s)
m p Single-particle mass (g)
m ˙ w Fluid (water) flow rate (g/s)
P f , 0 Pressure of fluid (water) in the pipe tip section (Pa)
P f , p Pressure of fluid (water) in the pump section (Pa)
V D Displacement rate of target
v f , t Fluid velocity at time t (m/s)
v f , 0 Fluid velocity in the pipe tip section (initial fluid velocity) (m/s)
v f , p Fluid velocity in the pump section (m/s)
V p Volume of particle ( mm 3 )
v p , t Particle velocity at time t (m/s)
V r Volume removed by single particle ( mm 3 )
v t Terminal velocity (m/s)
WTotal stress-wave energy
γFracture energy per unit area (J/ mm 2 )
εEnergy required to remove unit material volume ( mm 3 /J)
ρfFluid density (g/ mm 3 )
ρ p Particle density (g/ mm 3 )

References

  1. Summers, D.A. Waterjetting Technology; CRC Press: London, UK, 2003. [Google Scholar]
  2. Hashish, M.A. Modeling study of metal cutting with abrasive waterjets. J. Engmater. Technol. 1984, 106, 88–100. [Google Scholar] [CrossRef]
  3. Hashish, M. The potential of an ultrahigh-pressure abrasive water jet rock drill. In Proceedings of the Fifth American Water Jet Conference, Toronto, ON, Canada, 29–31 August 1989; Vijay, M.M., Savanick, G.A., Eds.; pp. 321–332. [Google Scholar]
  4. Chen, C.; Pan, D.; Yang, L.; Zhang, H.; Li, B.; Jin, C.; Li, X.; Cheng, Y.; Zhong, X. Investigation into the water jet erosion efficiency of hydrate-bearing sediments based on the arbitrary Lagrangian-Eulerian method. Appl. Sci. 2019, 9, 182. [Google Scholar] [CrossRef]
  5. Song, K.-I.; Oh, T.-M.; Cho, G.-C. Precutting of tunnel perimeter for reducing blasting-induced vibration and damaged zone—Numerical analysis. KSCE J. Civ. Eng. 2014, 18, 1165–1175. [Google Scholar] [CrossRef]
  6. Xiao, S.; Ge, Z.; Lu, Y.; Zhou, Z.; Li, Q.; Wang, L. Investigation on coal fragmentation by high-velocity water jet in drilling: size distributions and fractal characteristics. Appl. Sci. 2018, 8, 1988. [Google Scholar] [CrossRef]
  7. Kim, J.-G.; Song, J.-J.; Han, S.S.; Lee, C.-I. Slotting of concrete and rock using an abrasive suspension waterjet system. KSCE J. Civ. Eng. 2012, 16, 571–578. [Google Scholar] [CrossRef]
  8. Huang, M.; Kang, Y.; Long, X.; Wang, X.; Hu, Y.; Li, D.; Zhang, M. Effects of a nano-silica additive on the rock erosion characteristics of a SC-CO2 jet under various operating conditions. Appl. Sci. 2017, 7, 153. [Google Scholar] [CrossRef]
  9. Momber, A.W.; Kovacevic, R. Principles of Abrasive Water Jet Machining; Springer: London, UK, 1997. [Google Scholar]
  10. Cha, Y.; Tae-Zin, A.; Cho, G.-C. The state of abrasive waterjet technologies for construction in Korea. In Proceedings of the 6th International Young Geotechnical Engineers Conference, Seoul, Korea, 17 September 2017; pp. 86–87. [Google Scholar]
  11. Kalla, D.; Zhang, B.; Asmatulu, R.; Dhanasekaran, P. Current research trends in abrasive waterjet machining of fiber reinforced composites. Mater. Sci. Forum 2012, 713, 37–42. [Google Scholar] [CrossRef]
  12. Krajcarz, D. Comparison metal water jet cutting with laser and plasma cutting. Procedia Eng. 2014, 69, 838–843. [Google Scholar] [CrossRef]
  13. Finnie, I. Erosion of surfaces by solid particles. Wear 1960, 3, 87–103. [Google Scholar] [CrossRef]
  14. Momber, A. Stress–strain relation for water-driven particle erosion of quasi-brittle materials. Appl. Fractmec. 2001, 35, 19–37. [Google Scholar] [CrossRef]
  15. Jankovic, P.; Igic, T.; Nikodijevic, D. Process parameters effect on material removal mechanism and cut quality of abrasive water jet machining. Theor. Appl. Mech. 2013, 40, 277–291. [Google Scholar] [CrossRef] [Green Version]
  16. Buijs, M. Erosion of glass as modeled by indentation theory. J. Am. Ceram. Soc. 1994, 77, 1676–1678. [Google Scholar] [CrossRef]
  17. Hashish, M. Optimization factors in abrasive waterjet machining. J. Eng. Ind. 1991, 113, 29–37. [Google Scholar] [CrossRef]
  18. Cha, Y.; Oh, T.-M.; An, T.-Z.; Cho, G.-C. The kinetic energy of abrasive particles considering specific gravity in waterjet rock cutting. In Proceedings of the World Tunnel Congress 2018, Dubai, UAE, 21–26 Aprill 2018. DXB1026. [Google Scholar]
  19. Hashish, M. An improved model of erosion by solid particle impact. In Proceedings of the 7th International Conference, Erosion by Liquid and Solid Impact; Field, J.E., Dear, J.P., Eds.; Cavendish Lab.: Cambridge, UK, 1987; pp. 66.1–66.9. [Google Scholar]
  20. Zeng, J.; Kim, T.J. Development of an abrasive waterjet kerf cutting model for brittle materials. In Jet Cutting Technology; Springer: Berlin, Germany, 1992; pp. 483–501. [Google Scholar]
  21. Zeng, J.; Kim, T.J. An erosion model of polycrystalline ceramics in abrasive waterjet cutting. Wear 1996, 193, 207–217. [Google Scholar] [CrossRef]
  22. Capello, E.; Groppetti, R. On a simplified model for hydro abrasive jet machining prediction, control and optimization. In Proceedings of the 7th American Water Jet Conference, Seattle, WA, USA, 28–31 August 1993; pp. 157–174. [Google Scholar]
  23. El-Domiaty, A.; Abdel-Rahman, A.A. Fracture mechanics-based model of abrasive waterjet cutting for brittle materials. Int. J. Adv. Manuf. Technol. 1997, 13, 172–181. [Google Scholar] [CrossRef]
  24. Chung, Y.; Geskin, E.; Singh, P.J. Prediction of the geometry of the kerf created in the course of abrasive waterjet machining of ductile materials. In Jet Cutting Technology; Springer: Berlin, Germany, 1992; pp. 525–541. [Google Scholar]
  25. Matsui, S.; Matsumura, H.; Ikemoto, Y.; Kumon, Y.; Shimizu, H. Prediction equations for depth of cut made by abrasive water jet. In Proceedings of the 6th American Water Jet Conference, Houston, TX, USA, 24–27 August 1991; pp. 24–27. [Google Scholar]
  26. Momber, A. A generalized abrasive water jet cutting model. In Proceedings of the 8th American Water Jet Conference, Houston, TX, USA, 26–29 August 1995; pp. 359–376. [Google Scholar]
  27. Momber, A.W. A probabilistic model for the erosion of cement-based composites due to very high-speed hydro-abrasive flow. Wear 2016, 368, 39–44. [Google Scholar] [CrossRef]
  28. Bitter, J.G.A. A study of erosion phenomena part I. Wear 1963, 6, 5–21. [Google Scholar] [CrossRef]
  29. Bitter, J.G.A. A study of erosion phenomena: Part II. Wear 1963, 6, 169–190. [Google Scholar] [CrossRef]
  30. Hutchings, I. Energy absorbed by elastic waves during plastic impact. J. Phys. D Appl. Phys. 1979, 12, 1819. [Google Scholar] [CrossRef]
  31. Kovacevic, R.; Momber, A.; Mohen, R. Energy dissipation control in hydro-abrasive machining using quantitative acoustic emission. Int. J. Adv. Manuf. Technol. 2002, 20, 397–406. [Google Scholar] [CrossRef]
  32. Paul, S.; Hoogstrate, A.; Van Luttervelt, C.; Kals, H. Analytical modelling of the total depth of cut in the abrasive water jet machining of polycrystalline brittle material. J. Mater. Process Technol. 1998, 73, 206–212. [Google Scholar] [CrossRef]
  33. Abdel-Rahman, A.A. A Closed-form Expression for an abrasive waterjet cutting model for ceramic materials. Int. J. Math. Mod. Meth. Appl. Sci. 2011, 5, 722–729. [Google Scholar]
  34. Momber, A. The kinetic energy of wear particles generated by abrasive–water-jet erosion. J. Mater. Process Technol. 1998, 83, 121–126. [Google Scholar] [CrossRef]
  35. Momber, A.W.K.; Kovacevic, R. Energy dissipative processes in high speed water solid particle erosion. Proc. ASME Heat Transf. Fluids Eng. Div. 1995, 321, 555–564. [Google Scholar]
  36. Mott, R.L.; Noor, F.M.; Aziz, A.A. Applied Fluid Mechanics; Prentice Hall: Upper Saddle River, NJ, USA, 2006. [Google Scholar]
  37. Oh, T.-M.; Cho, G.-C. Rock cutting depth model based on kinetic energy of abrasive waterjet. Rock Mech. Rock Eng. 2015, 49, 1059–1072. [Google Scholar] [CrossRef]
  38. Roth, P.; Looser, H.; Heiniger, K.; Bühler, S. Determination of abrasive particle velocity using laser-induced fluorescence and particle tracking methods in abrasive water jets. In Proceedings of the 2005 WJTA Conference and Exposition, Houston, TX, USA, 21–23 August 2005; pp. 21–23. [Google Scholar]
  39. Vahedi Tafreshi, H.; Pourdeyhimi, B. The effects of nozzle geometry on waterjet breakup at high Reynolds numbers. Exp. Fluids 2003, 35, 364–371. [Google Scholar] [CrossRef]
  40. Zhu, H.T.; Huang, C.Z.; Wang, J.; Zhao, G.Q.; Li, Q.L. Modeling material removal in fracture erosion for brittle materials by abrasive waterjet. Adv. Mater. Res. 2009, 76–78, 357–362. [Google Scholar] [CrossRef]
  41. Zhu, H. Study on Erosion Mechanisms and Polishing Technology of Hard-Brittle Materials Machined with Precision Abrasive Waterjet; Shandong University: Jinan, China, 2007. [Google Scholar]
  42. Fowler, G.; Pashby, I.R.; Shipway, P.H. The effect of particle hardness and shape when abrasive water jet milling titanium alloy Ti6Al4V. Wear 2009, 266, 613–620. [Google Scholar] [CrossRef]
  43. Wang, J. Predictive depth of jet penetration models for abrasive waterjet cutting of alumina ceramics. Int. J. Mech. Sci. 2007, 49, 306–316. [Google Scholar] [CrossRef]
  44. Meng, J.; Wei, Q.; Ma, Y. Numerical simulation study on erosion mechanism of pre-mixed abrasive water jet. Adv. Mech. Eng. 2017, 9, 1–10. [Google Scholar] [CrossRef]
  45. Agus, M.; Bortolussi, A.; Ciccu, R.; Kim, W.; Vargiu, A. Abrasive performance in rock cutting with AWJ and ASJ. In Proceedings of the 8th American Water Jet Conference, Houston, TX, USA, 26–29 August 1995; p. 29. [Google Scholar]
  46. Hallquist, J.O. LS-DYNA keyword user’s manual. Livermore Softw. Technol. Corp. 2007, 970, 299–800. [Google Scholar]
  47. Zhang, F.-G.; Li, E.-Z. A computational model for concrete subjected to large strains, high strain rates, and high pressures. Explos. Shock Waves 2002, 22, 198–202. [Google Scholar]
  48. Lu, Z.; Wan, L.; Zeng, Q.; Zhang, X.; Gao, K. Numerical simulation of fragment separation during rock cutting using a 3d dynamic finite element analysis code. Adv. Mater. Sci. Eng. 2017, 2017, 1–17. [Google Scholar] [CrossRef]
  49. Tao, M.; Li, X.; Wu, C. Characteristics of the unloading process of rocks under high initial stress. Comput. Geotech. 2012, 45, 83–92. [Google Scholar] [CrossRef]
  50. Khoe, Y.S.; Weerheijm, J. Limitations of smeared crack models for dynamic analysis of concrete. In Proceedings of the 12th International LS-DYNA Users Conference, Detroit, MI, USA, 3–5 June 2012; pp. 1–14. [Google Scholar]
  51. Parfilko, Y. Study of Damage Progression in CSCM Concretes under Repeated Impacts; Rochester Institute of Technology: Rochester, NY, USA, 2017. [Google Scholar]
  52. Jiang, H.; Liu, Z.; Gao, K. Numerical simulation on rock fragmentation by discontinuous water-jet using coupled SPH/FEA method. Powder Technol. 2017, 312, 248–259. [Google Scholar] [CrossRef]
  53. Tazibt, A.; Parsy, F.; Abriak, N. Theoretical analysis of the particle acceleration process in abrasive water jet cutting. Comput. Matersci. 1996, 5, 243–254. [Google Scholar] [CrossRef]
  54. Long, X.; Ruan, X.; Liu, Q.; Chen, Z.; Xue, S.; Wu, Z. Numerical investigation on the internal flow and the particle movement in the abrasive waterjet nozzle. Powder. Technol. 2017, 314, 635–640. [Google Scholar] [CrossRef]
  55. Swanson, R.K.; Kilman, M.; Cerwin, S.; Tarver, W.; Wellman, R. Study of particle velocities in water driven abrasive jet cutting. In Proceedings of the 4th US Water Jet Conference, Berkeley, CA, USA, 26–28 August 1987; pp. 103–107. [Google Scholar]
Figure 1. Schematic illustration of brittle material erosion due to the impact of a single abrasive particle [9,16].
Applsci 09 04234 g001
Figure 2. Conceptual diagram showing particle motion through a fluid in a focus and the exit velocity after the particle exits the focus.
Applsci 09 04234 g002
Figure 3. Abrasive particle velocity, distance traveled by the particle, and fluid velocity during acceleration in a waterjet.
Applsci 09 04234 g003
Figure 4. Comparison of the erosion results obtained from the proposed simple model and a previous model (elastoplastic model): (a) erosion depth and (b) erosion volume during single-particle impact.
Applsci 09 04234 g004
Figure 5. Tensile and compressive strengths of the granitic rock target used in the numerical analyses.
Applsci 09 04234 g005
Figure 6. 1/4 symmetric geometry model used in the numerical analyses.
Applsci 09 04234 g006
Figure 7. Microcracking induced by single-particle impact according to abrasive properties: (a) A-1; (b) A-2; (c) A-3; (d) B-1; (e) B-2; (f) B-3.
Applsci 09 04234 g007
Figure 8. Erosion shapes obtained with different abrasive properties: (a) A-1; (b) A-2; (c) A-3; (d) B-1; (e) B-2; (f) B-3.
Applsci 09 04234 g008
Figure 9. Comparison of erosion results obtained for single-particle impact using the proposed simple erosion model and numerical model: (a) erosion depth; (b) erosion volume.
Applsci 09 04234 g009
Figure 10. Acceleration characteristics based on abrasive properties: (a) terminal velocity according to abrasive flow rate; (b) particle acceleration and water deceleration according to abrasive properties; (c) distance traveled by an accelerating abrasive particle according to abrasive properties; (d) distance traveled by an abrasive particle according to water flow rate.
Applsci 09 04234 g010aApplsci 09 04234 g010b
Figure 11. Effects of abrasive particle parameters on erosion depth: (a) particle diameter and particle density; (b) particle diameter and particle hardness; (c) particle diameter and target hardness; (d) hardness ratio ( H p / H t = R h ).
Applsci 09 04234 g011aApplsci 09 04234 g011b
Figure 12. Erosion rate according to abrasive and target properties.
Applsci 09 04234 g012
Table 1. Overview of major erosion models.
Abrasive Waterjet ModelsEquationsReferences
Volume displacement models d V r = d V D [9,19]
Energy conservation models d V r / d t = d E e / d t [20,21,22,23]
Regression models V r = α f ( x ) β [16,24,25]
Reaction kinetic models V r = k a m ˙ a m [26,27]
Table 2. Analysis cases and details.
Water pressure (MPa)320
Water flow rate (g/s)29.71 (orifice diameter 0.254 mm)
Abrasive flow rate (g/s)7.5
Vickers hardness of abrasive (kg/mm2)1500
Vickers hardness of target) kg/mm2)980
Abrasive density (g/mm3)Density I: 0.00379;Density II: 0.00702
Abrasive diameter (mm)0.090.180.2640.3440.090.180.2640.344
Abrasive exit velocity (m/s)352348346344349344342335
Theoretical study cases (this, previous)OOOOOOOO
Numerical study casesXOOOXOOO
Case codesA-0A-1A-2A-3B-0B-1B-2B-3
Table 3. Properties of the target (granite) used in the numerical analyses.
Density (kg/m3)Compressive Strength (MPa)Shear Strength (MPa)Tensile Strength (MPa)Young’s Modulus (GPa)Vickers Hardness (kg/mm3)
2650236231156.5980

