Article

Flexible Shear and Normal Force Sensor Using only One Layer of Polyvinylidene Fluoride Film

1
Center for Robotics Research, Korea Institute of Science and Technology, Seoul 02792, Korea
2
School of Electrical Engineering, Korea University, Seoul 02841, Korea
*
Author to whom correspondence should be addressed.
Appl. Sci. 2019, 9(20), 4339; https://doi.org/10.3390/app9204339
Submission received: 23 September 2019 / Revised: 11 October 2019 / Accepted: 12 October 2019 / Published: 15 October 2019
(This article belongs to the Special Issue Flexible Piezoelectric Materials)

Abstract

:
We have proposed a flexible sensor that can sense shear and normal forces, and can be fabricated through a simple process using only one layer of polyvinylidene fluoride (PVDF) film. For the measurement of shear and normal forces, one layer of PVDF film was sealed in a three-dimensionally structured polydimethylsiloxane (PDMS). In the structure, the sensor produced voltage signals corresponding to the shear and normal forces. Using this property, we aimed to demonstrate how to sense the magnitude and direction of the force applied to the sensor from its output voltages. Furthermore, the proposed sensor with a 2 × 2 array was able to measure the applied force in real time.

1. Introduction

In recent years, the importance of flexible tactile sensors has increased owing to the development of wearable electronics and intelligent robots [1,2,3]. In the same context, various studies have been performed to enable these flexible tactile sensors to sense external inputs such as proximity [4,5], strain [6,7], and pressure [8,9]. Among these sensors, force sensors have been widely used in the field of robotics to realize functions such as object classification [10] and robot manipulation with a feedback system [11,12]. During the time of force sensing, it is very important to detect shear force as well as normal force. This is because, in reality, most of the force is applied in combination with the normal direction and the shear direction.
Force sensors that can sense shear and normal forces have been broadly studied. These sensors typically utilize the capacitive [13,14,15], piezo-resistive [16,17,18], and piezoelectric [19,20,21] properties of materials. Of these sensors, the capacitive ones have excellent sensitivity, large dynamic range, and good spatial resolution. The piezo-resistive ones have a high spatial resolution and a simple construction. Both of them require bias voltage, which consumes electric power.
In contrast, the piezoelectric ones have the characteristic advantage of being self-powered, i.e., they generate electrical signals under external mechanical inputs [22,23]. With this benefit, several studies have been performed with piezoelectric force sensors that can measure shear forces [20,21,24,25,26]. Specifically, therein, some researchers have assembled polydimethylsiloxane (PDMS) bump structures on flat or micropillar-type polyvinylidene fluoride (PVDF) and have used electrodes of specific shapes for effective sensing, resulting in the detection of shear and normal forces. These fabrication methods are, however, complicated to perform owing to processes such as lithography and sputtering.
In this paper, we proposed a force sensor that could be fabricated through a simple process using only one layer of PVDF film and PDMS, and that could measure not only normal force but also shear force. Since the spatial resolution of the force sensor is required for applications in robotics [1], the sensors are fabricated into arrays to demonstrate their practical applicability. In general, PVDF has been used as a sensing material because of its flexibility, biocompatibility, and good performance [27,28,29,30,31,32,33,34,35]. In addition, the PVDF generates internal electric potentials through mechanical deformation, so we can sense the force using this measured electric signal. The top and bottom PDMS of a 3D trapezoid structure seals one layer of PVDF film, enabling it to sense shear and normal forces. Herein, the PDMS acts as an insulator so that the sensor is not affected by an external electrostatic field. The sensing capability of the sensor was investigated by applying different forces in different directions, and then the direction and magnitude of the applied forces were estimated. Furthermore, when the forces were applied, the morphology of the PVDF film composed of one domain was investigated by using the finite element method (FEM) procedure in the COMSOL Multiphysics software. Finally, we have presented a real-time measurement system for practical applications of the sensor array. Therein, the sensing system can display the magnitude and direction of the unknown force applied to the sensor in real time.

2. Fabrication

The fabrication process of the sensor is shown in Figure 1a–c. First, two custom-made molds were fabricated with a 3D printer (ProJet HD3500 Plus, 3D Systems, Inc.) in ultra-high-definition (UHD) mode using VisiJet M3 Crystal and VisiJet S300 as the build and support materials, respectively. Then, the molds were coated with trichlorosilane (Sigma Aldrich, Inc.) to easily separate the PDMS from these molds [36]. PDMS (SYLGARD 184 A/B, Dow Corning Corp.) was molded using the custom-made molds and cured at 55 °C for 4 h to fabricate the bottom and top PDMS (Figure 1a). Therein, the base/agent weight ratio of the bottom PDMS was 25:1 for the adhesion surface and that of the top PDMS was 5:1. As shown in Figure 1b, the upper surface electrode of the silver-coated PVDF film (thickness: 28 μm; Measurement Specialties, Inc.) with an area of 6 × 23 mm2 was patterned by a laser marking machine (Cat-Fs20 Mini, Marc Co., Ltd.). Finally, the patterned PVDF layer and flexible printed circuit board (FPCB, 4MITECH Co., Ltd.) layer were stacked up on the bottom PDMS and, afterwards, the top PDMS was used to cover them (Figure 1c). Figure 1d shows a photograph of the shear and normal force sensor with a 2 × 2 sensor array. The module of this sensor consisted of three piezoelectric sensors (namely, P1, P2, and P3 in Figure 1e). From the side view, there were two isosceles trapezoid bumps in the bottom PDMS. The length of an upper base and the legs of the trapezoid was 3 mm, and the angle between a bottom base and a leg was 45° (Figure 1f). For measuring the sensor outputs, the FPCB with electrode pattern as shown in Figure 1g was utilized by connecting it to the top surface electrode, and the bottom surface electrode was connected to an electric wire.

3. Experimental Setup

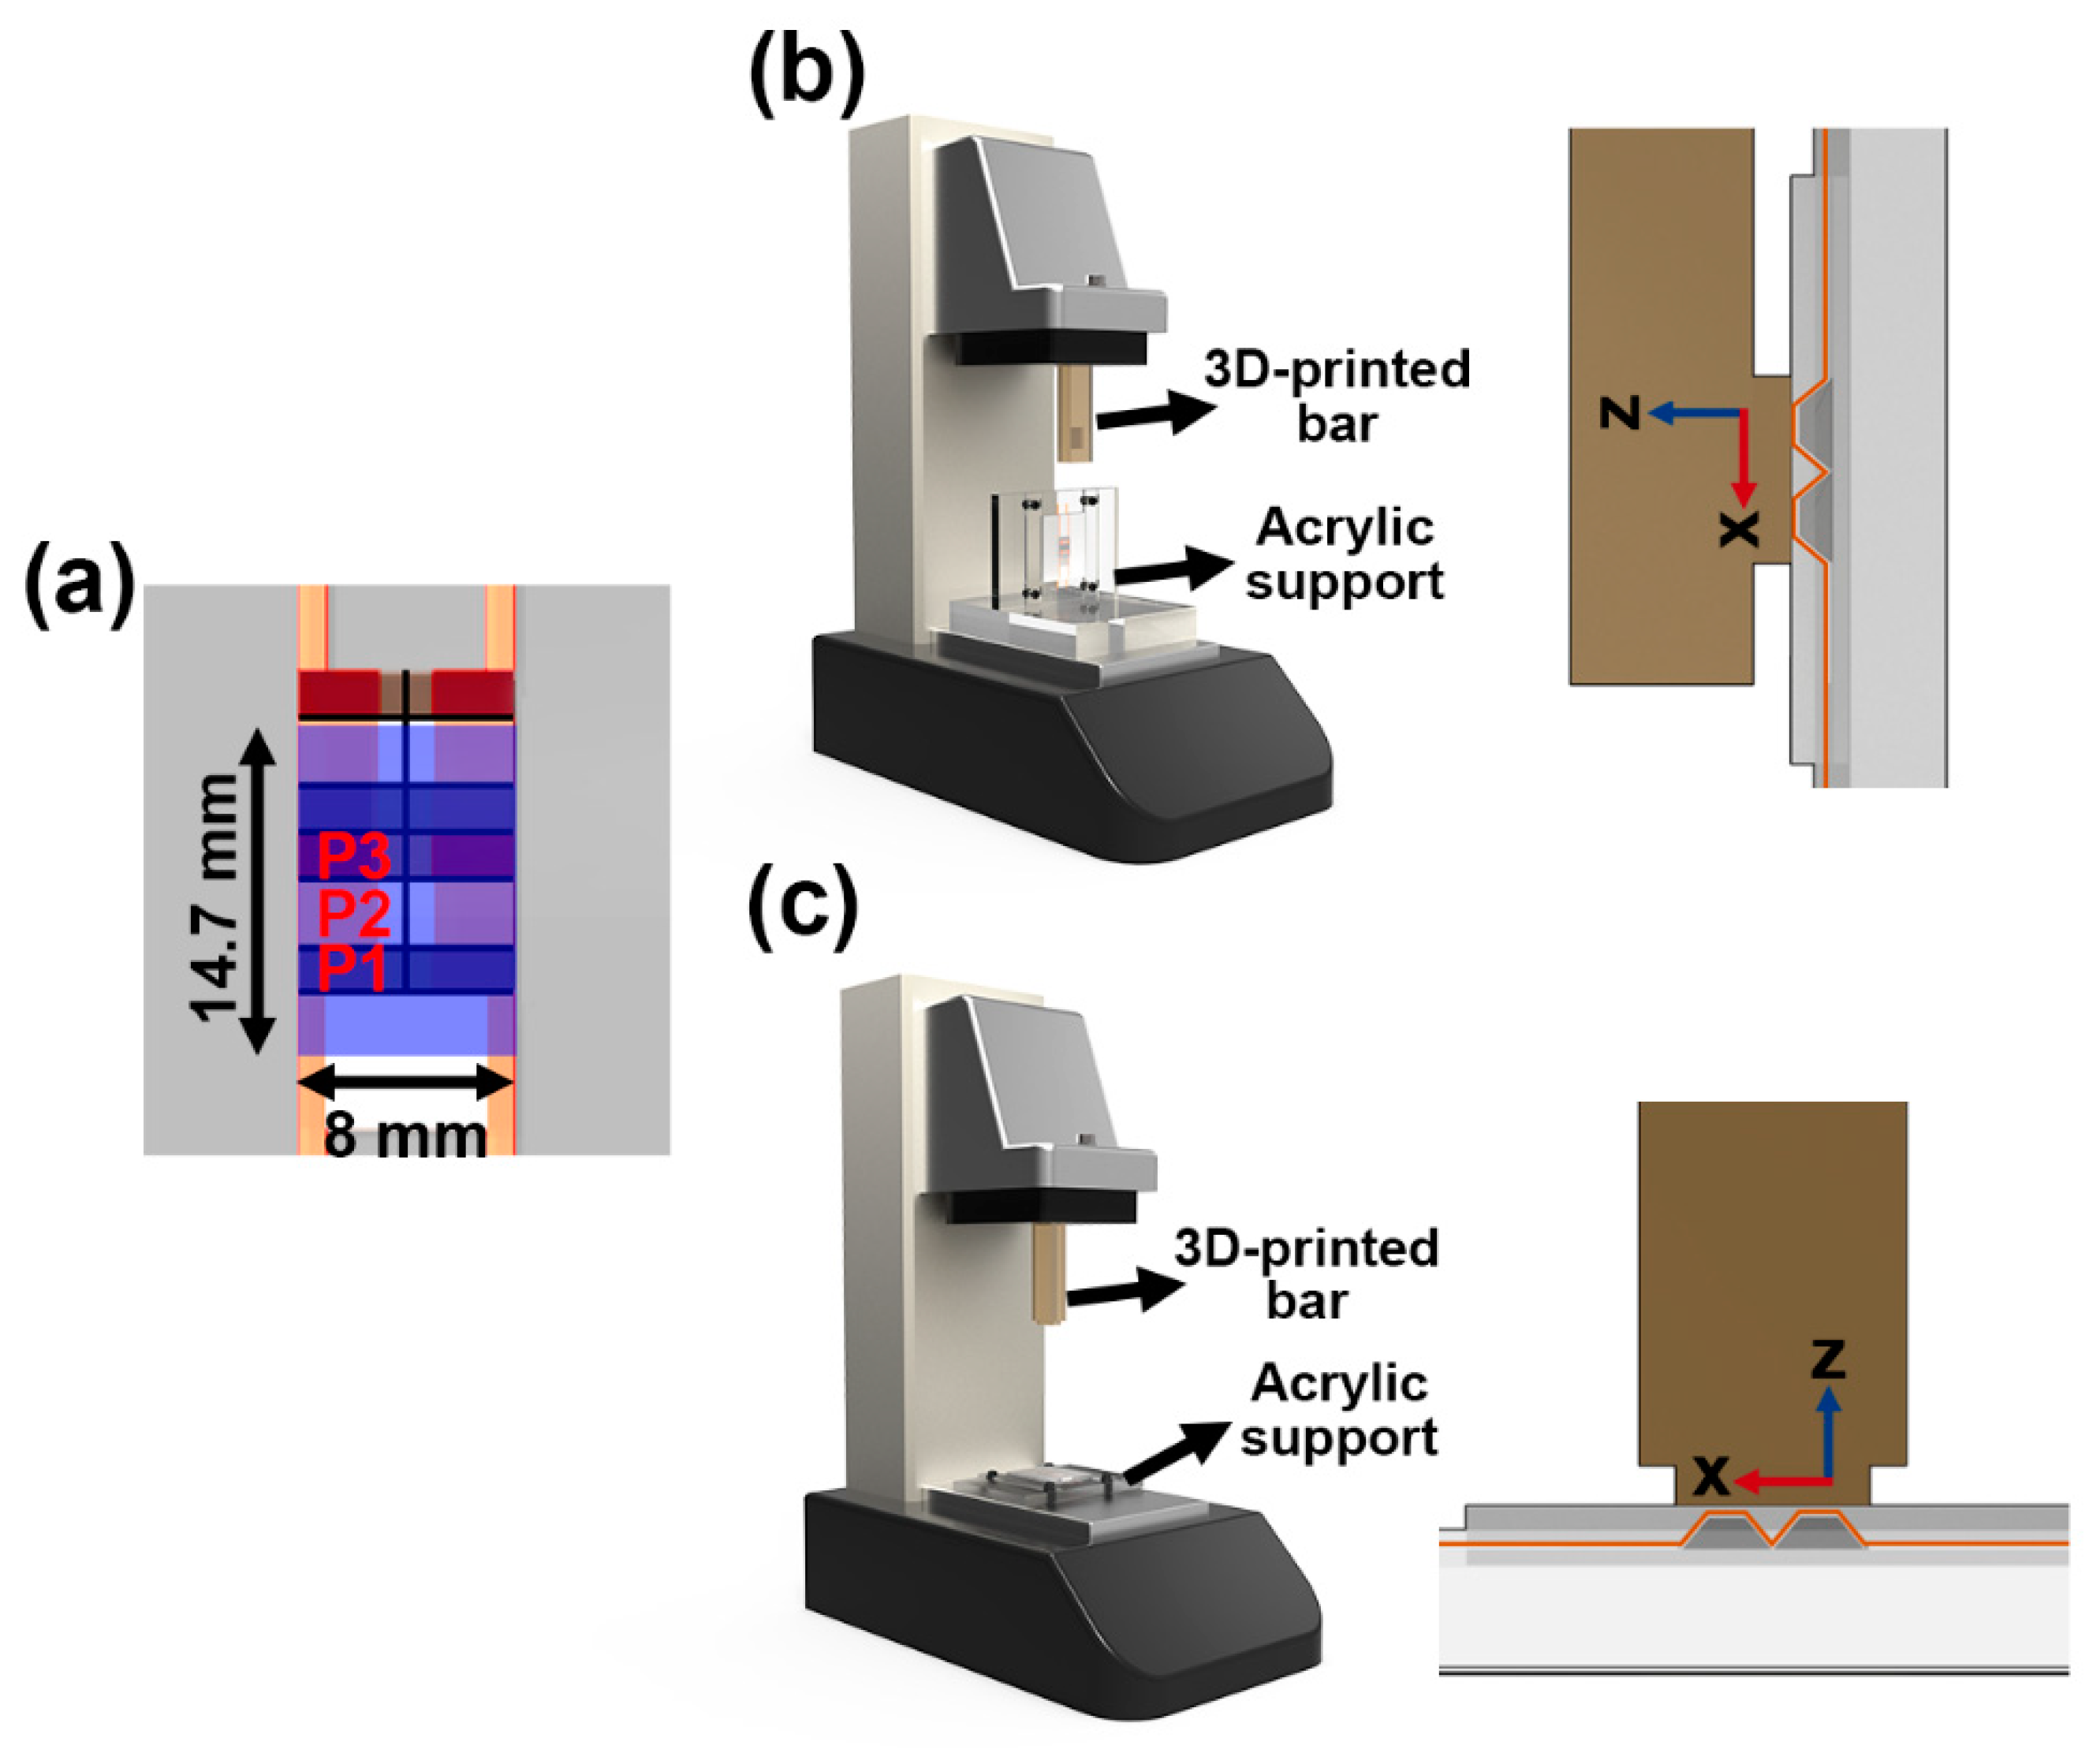
To analyze the performance of the shear and normal force sensor, we used a tensile testing machine (MCT-2150, A&D CO., LTD.) to apply normal and shear loads. By connecting a 3D-printed bar to the tensile testing machine, we were able to apply a force to the blue-colored area (8 × 14.7 mm2) shown in Figure 2a. Moreover, the fabricated sensor array could be fixed on an acrylic support to position the sensor horizontally or vertically. For the shear force tests (Figure 2b), the sample was vertically oriented and the test speed was 300 mm/min. The 3D-printed bar for the shear force was designed as shown in Figure 2b. For the normal force tests (Figure 2c), the sample was horizontally oriented and the test speed was 150 mm/min. When applying a normal force, we used a different bar, shown in Figure 2c, with the shear force tests.
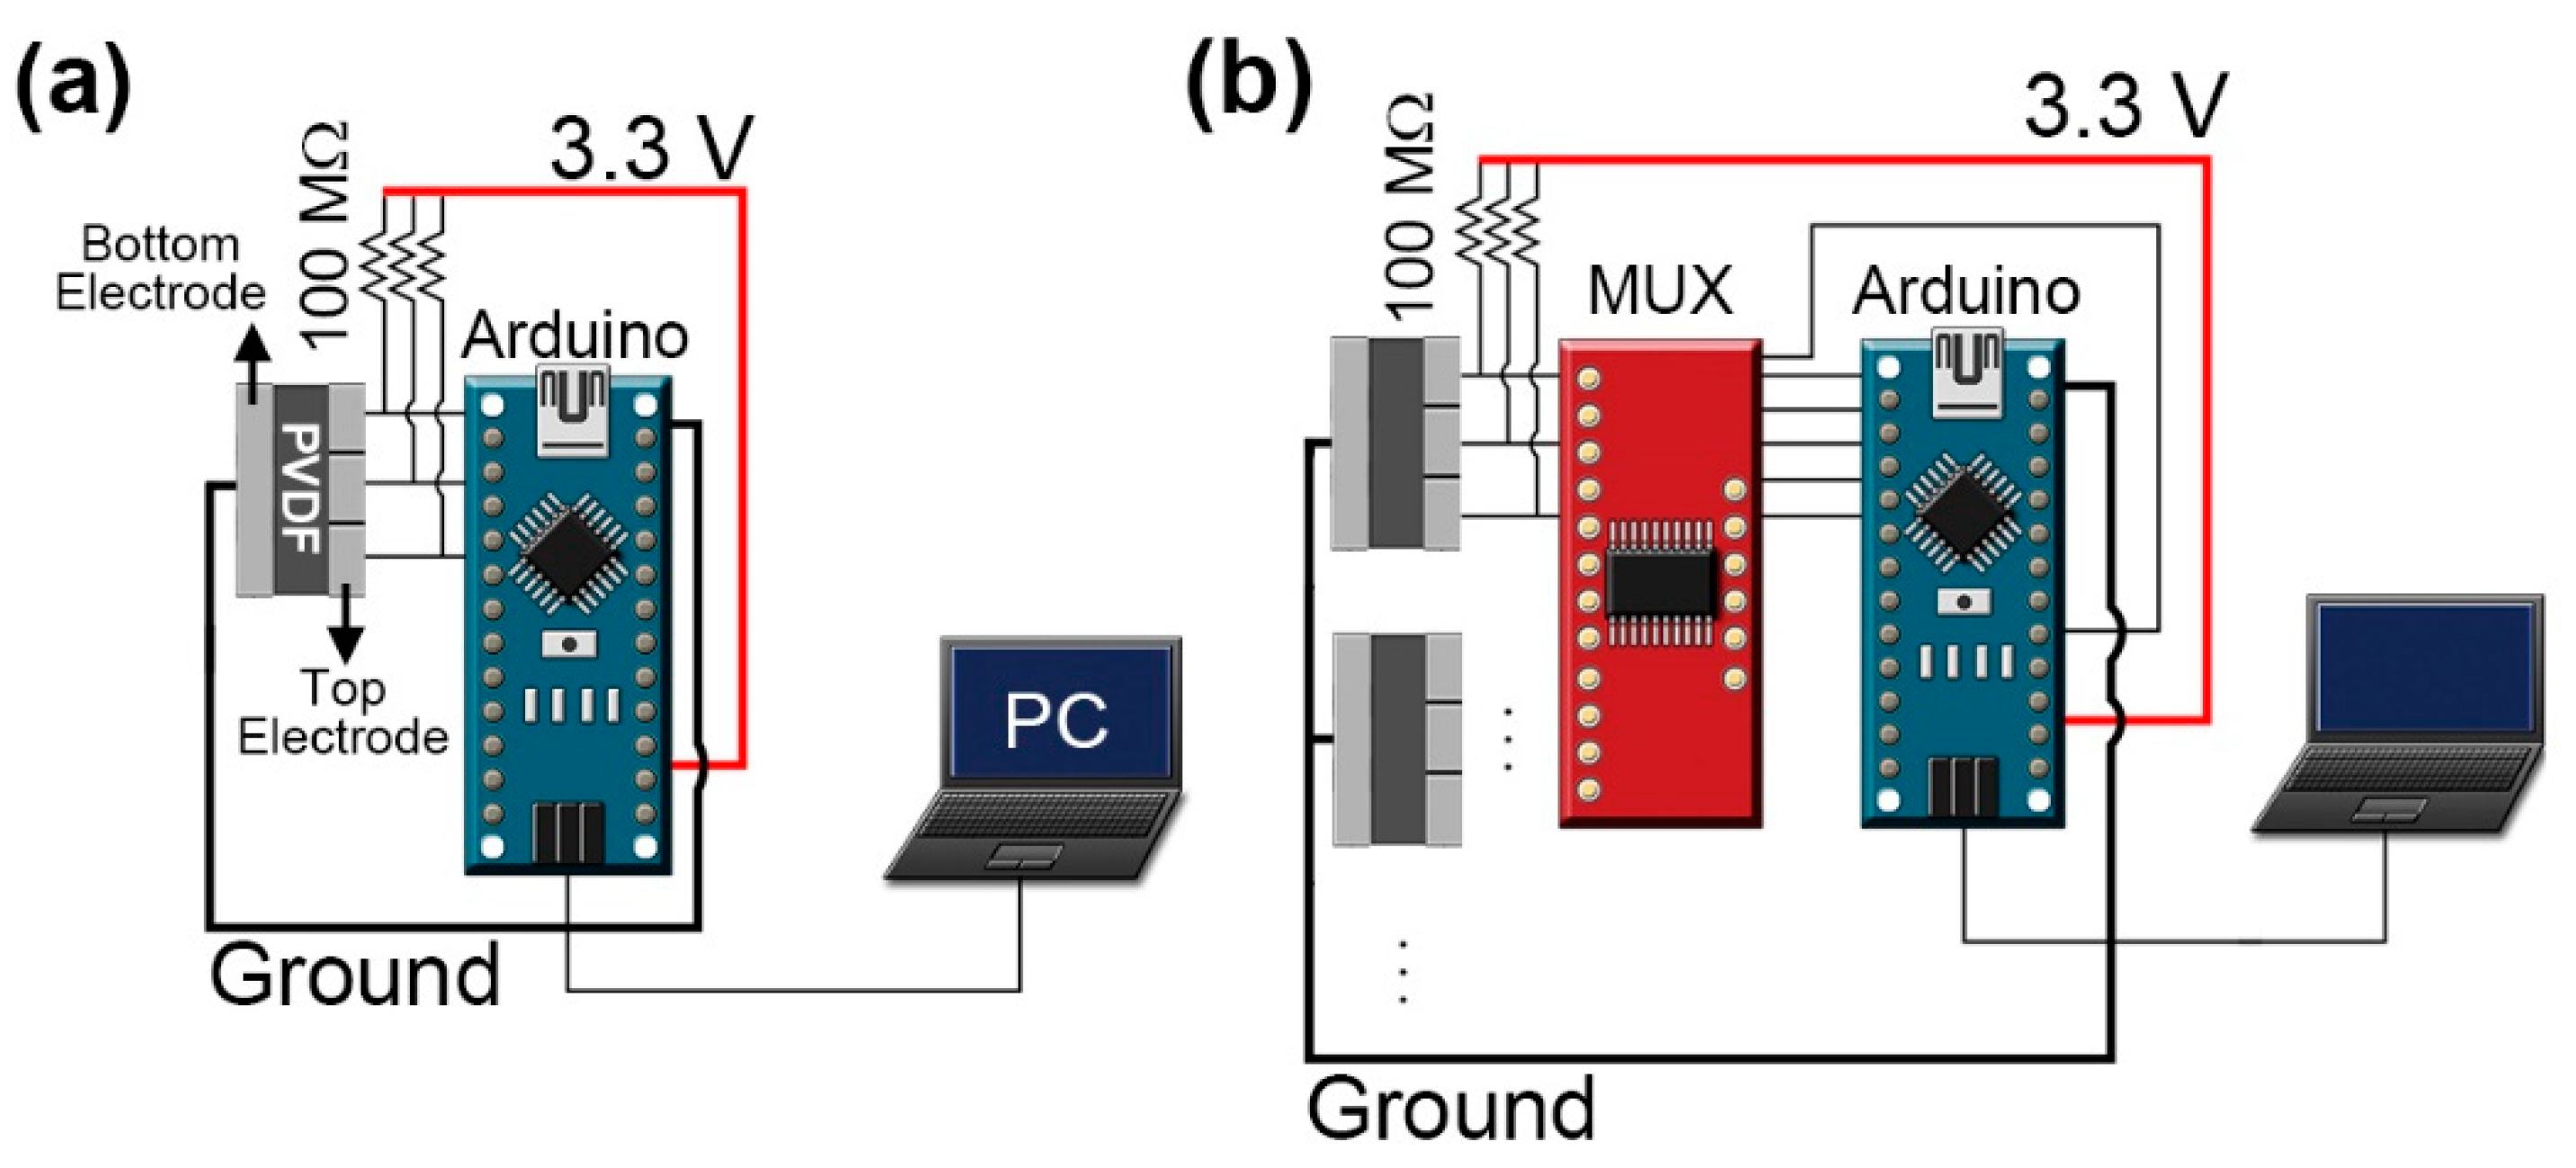
The setup of the sensor output measurement for one module is shown in Figure 3a. Specifically, we only observed signals from the P1, P2, and P3 sensors. The analog voltages were read via the analog-digital converting pins in the Arduino Nano Microcontroller. We connected a load resistor of 100 MΩ to each sensor and applied an offset of 3.3 V to measure the analog voltage output in the positive value region. The sampling rate was 300 Hz. A personal computer (PC) used for data processing was connected to the microcontroller through serial communication. For the full testing of the 2 × 2 sensor array, a 16-channel analog multiplexer (MUX, CD74HC4067) was used to measure 12 signals and was controlled via the microcontroller. The sampling rate was adjusted to 50 Hz since the number of sensors increased.

4. Result and Discussion

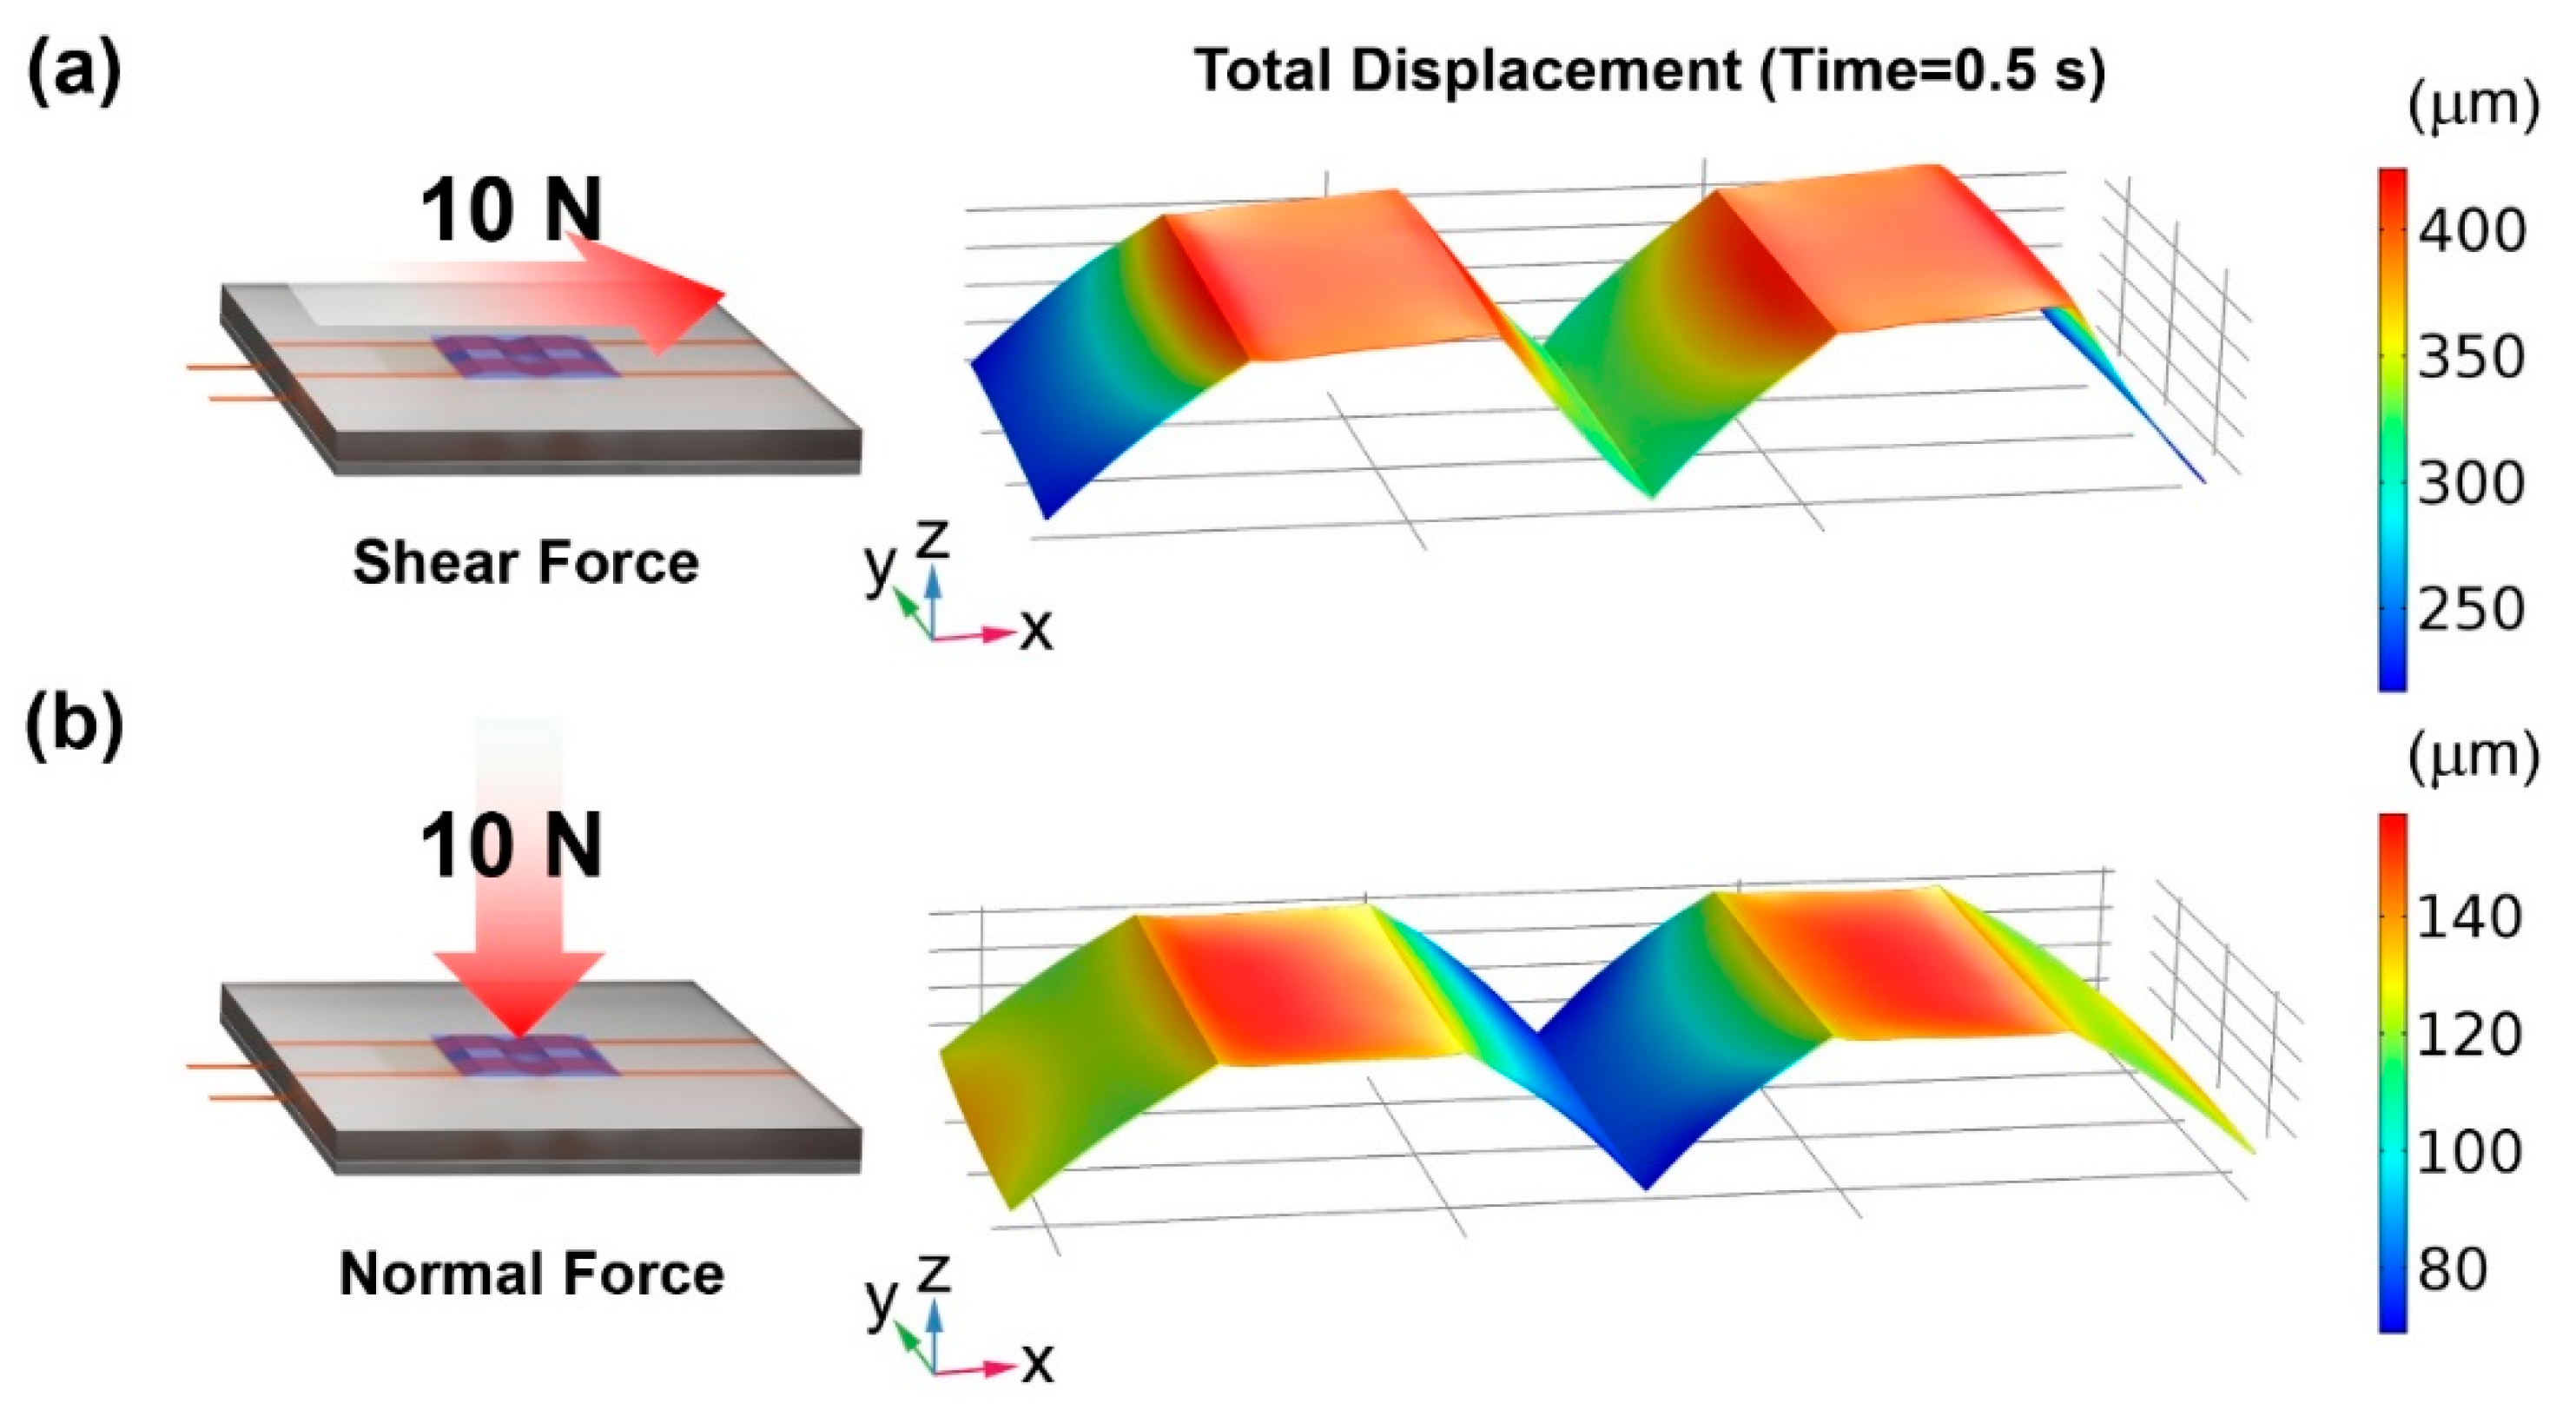
First, to observe the morphology of the film under a shear or normal force, we analyzed the total displacement distributions of the PVDF film by using the FEM procedure in the COMSOL Multiphysics software. The geometry was modeled to be the same as the actual size of the sensor, with the upper PDMS modulus set to 3590 kPa and the lower PDMS modulus set to 980 kPa [37]. In the simulation, shear and normal forces were applied to the sensor modules. The displacement distributions when a shear force and a normal force of 10 N were applied are shown in Figure 4a,b, respectively. At this time, the pressure applied to the sensor was about 85 kPa. Therein, we could observe the morphology of the film consisting of one domain when a force was applied to the sensor. In both cases, the upper bases of the trapezoid had the largest displacement and the displacement distribution was symmetrical with respect to the line MN shown in Figure 1e. Therefore, we were able to predict that the signal pair would be symmetric with respect to the line MN. This result shows that the connection of the two trapezoids affects the symmetric displacement. The connection exists because the sensor is fabricated by using one layer of PVDF film. Moreover, the displacement difference by connection is due to the sensitivity difference between the P1 and P3 sensors.
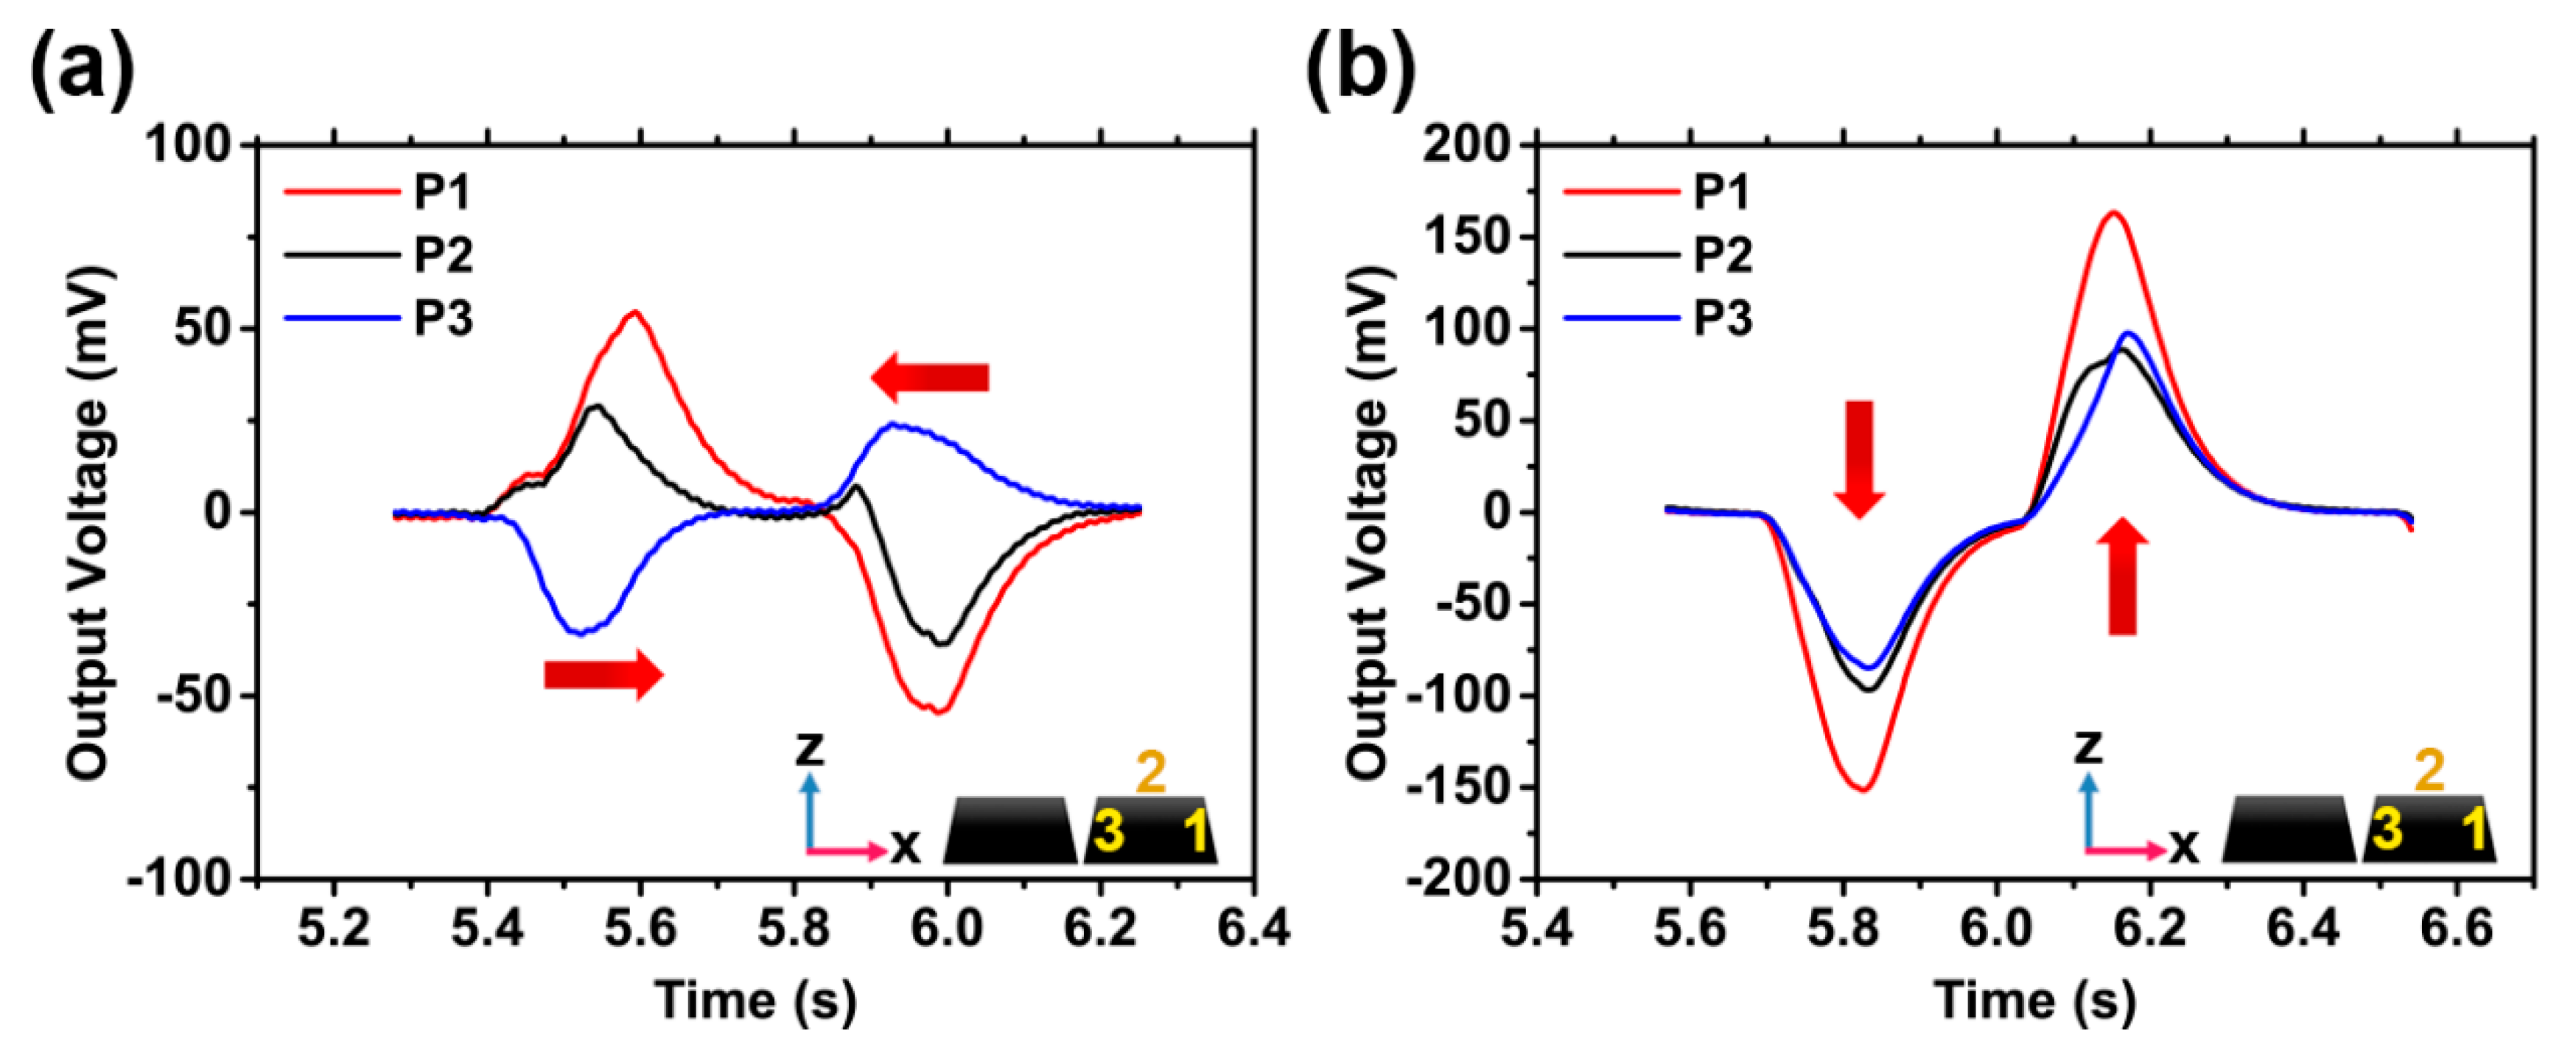
Figure 5 shows the output voltages of the sensor when shear and normal forces were applied and released. Therein, the voltage offsets of the obtained data were removed, and the voltage outputs were filtered by a low-pass filter of 60 Hz to eliminate power source noise. The inset images show the position of the sensor reading the voltage, and the red arrows show the movement direction of the 3D-printed bar for the shear and normal force tests. Figure 5a shows the measurement results when a 75.67 kPa shear force was applied in the +x direction. The phases of the signal of the P1 and P2 sensors appeared in opposition to the that of the P3 sensor. The signals when a normal force in the −z direction were applied are shown in Figure 5b. Therein, the signals had the same phase when a force was applied or released. Therefore, it was possible to distinguish whether the force applied to the sensor was shear or normal by comparing the phase difference of the signals. However, we remark that this PVDF sensor produced a voltage proportional to the change of the strain when the load resistor was under the internal impedance of the sensor [38]. That is, since the peak value of the output voltage depended on the speed at which the force was applied, the magnitude of the force applied to the sensor could not be obtained from the peak value of the output voltage. To obtain the magnitude of the force applied to the sensor, we integrated the output voltages over time according to the following equation:
I n = I n 1 + V n × t ,
where I n is the processed value, V n is the output voltage without an offset, and t is the sensing time interval measured by the microcontroller. We noted that the processed value was the integration value of the output voltage of the sensor over time. Here, the output voltage was proportional to the change of the strain [2], so the processed value after the integration was proportional to the displacement, which was proportional to the applied force. Since the processed value was independent to the speed of the applied force and was only proportional to the magnitude, this value allowed us to directly obtain the magnitude of the force applied to the sensor.
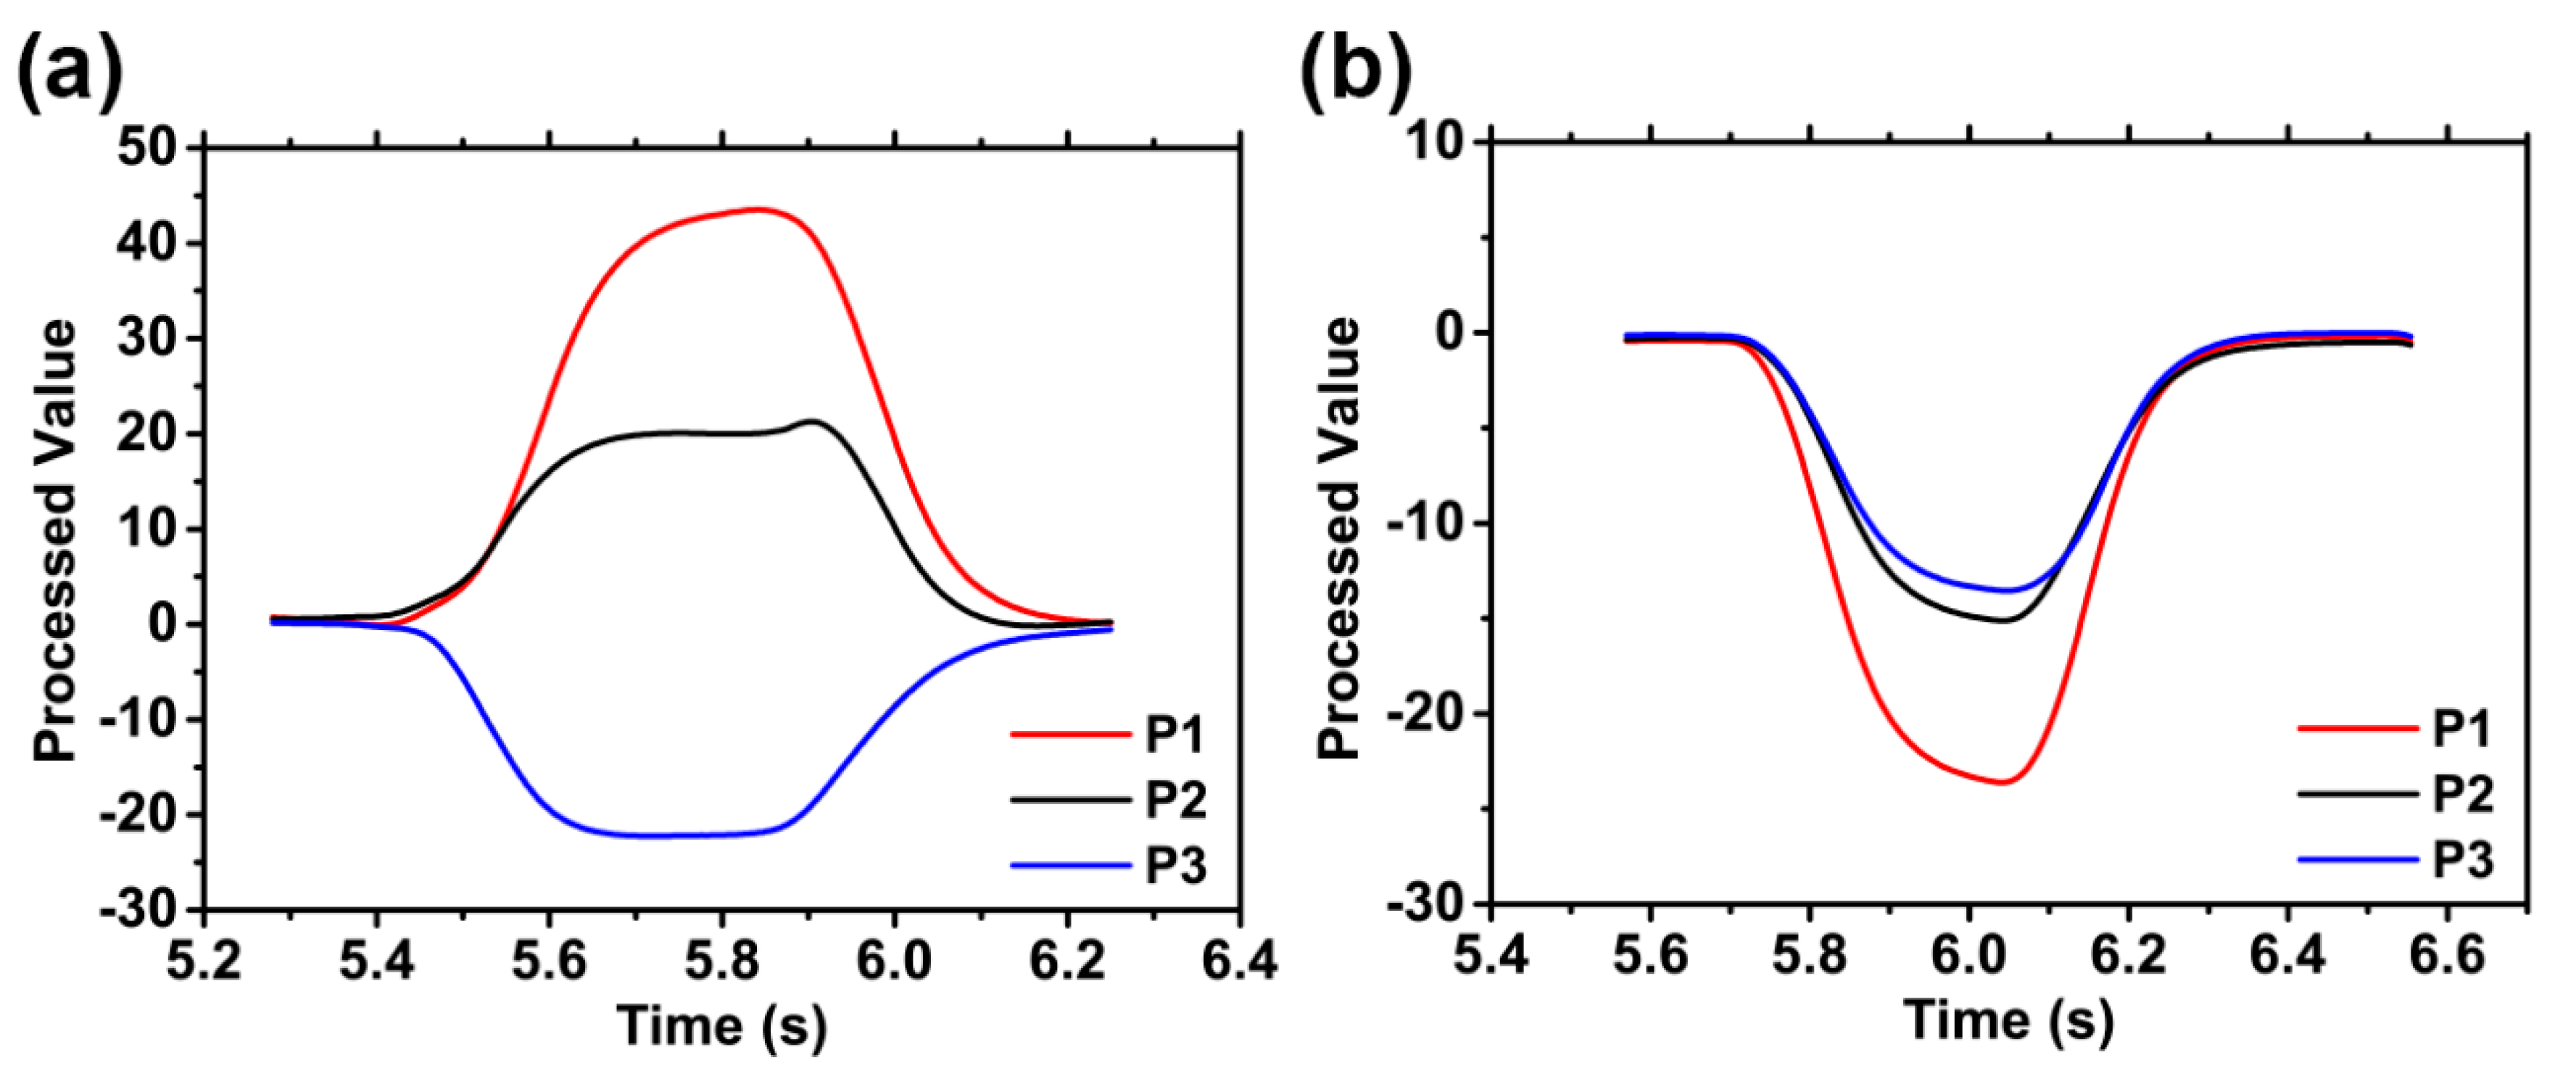
Figure 6 shows the processed value integrated from the sensor output in Figure 6. The peak value of the processed value was proportional to the force applied to the sensor regardless of the speed. When a shear force was applied in the +x direction, the P1 sensor generated a positive value, whereas the P3 sensor generated a negative value (Figure 6a). When a normal force was applied in the −z direction, the P1 and P3 sensors generated negative values (Figure 6b). According to these results, we were able to determine whether the direction of the force applied to the sensor was in the x direction or the z direction only on the basis of the polarity of the processed value of the P1 and P3 sensors. That is, if I 1 × I 3   < 0 , then a shear force was applied; otherwise, if I 1 × I 3   > 0 , then a normal force was applied.
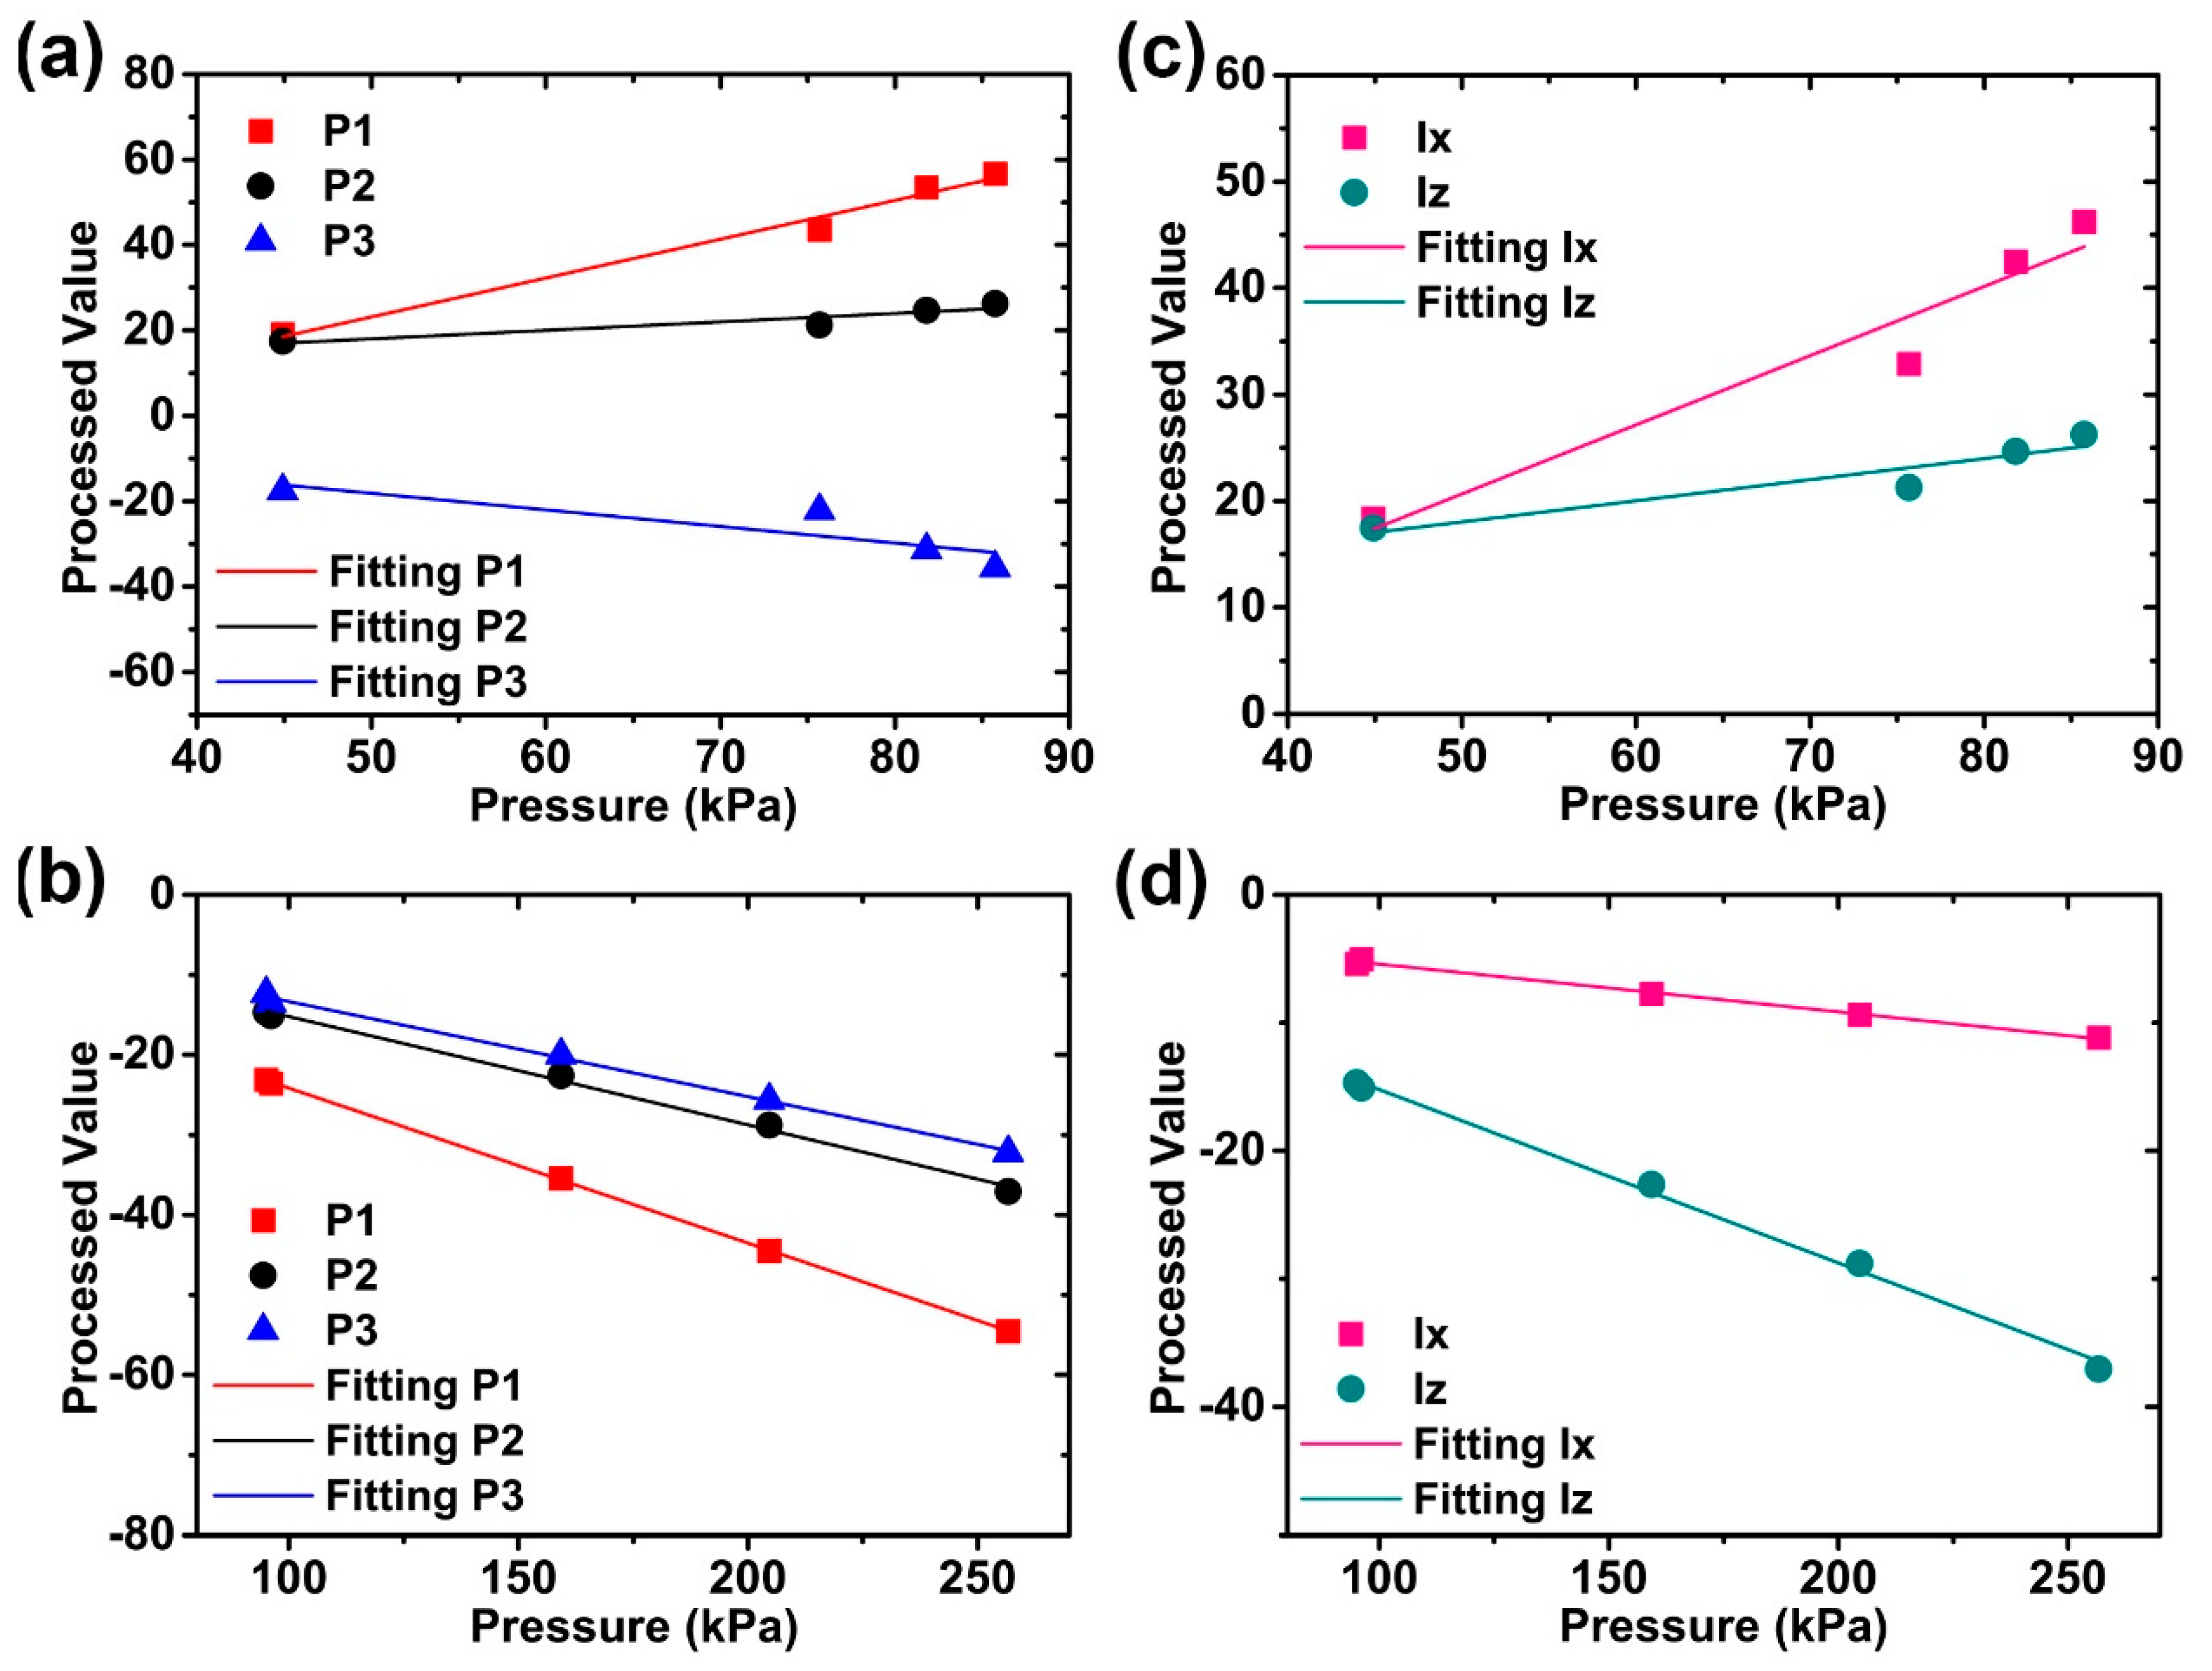
Furthermore, we were able to also estimate the magnitude of the applied force through the peak value of the processed value. Specifically, to study the sensitivity of the applied force through the sensor, we conducted an additional series of experiments using the sensor by applying different shear and normal pressures in the range 45–86 kPa and 100–260 kPa, respectively. The results are plotted as processed value versus pressure in Figure 7a,b. The absolute value of the processed value increased linearly as the applied pressure increased, and the linear fittings were overlapped with these results to compare the sensitivity of each sensor. When a shear force was applied on the sensor, the slopes of the fitting line of the P1, P2, and P3 sensors were 0.910, 0.198, and −0.390, respectively. At this point, it can be seen that the sensors located on the leg of the trapezoid bump (P1 and P3) were relatively more sensitive than the sensor located on the upper base of the trapezoid bump (P2). When a normal force was applied, the slopes of the fitting line were −0.194, −0.119, and −0.135, respectively. Because of the different sensitivities of the sensors, we could utilize the P1 and P3 sensors to detect the shear force with their signals, which were particularly sensitive to shear force, and we used the remaining sensor (P2) for the normal force. In particular, the force applied to the sensor could be decomposed into F z in the normal direction and F x in the shear direction. We expressed F x as a function of I x , which was defined only by the signals of the P1 and P3 sensors, as follows:
I x = I 1 I 3 2
where I 1 and I 3 are the processed values of the P1 and P3 sensors, respectively. Moreover, we expressed F z as a function of I z , which was defined as follows:
I z = I 2
where I 2 is the processed value of the P2 sensor. According to these definitions, I x and I z are plotted in Figure 7c,d, respectively. We observed that I x was mainly affected by a change in the corresponding shear force component F x and had linearity with respect to the shear force (Figure 7c) and that I z also had the same tendency as that of F z (Figure 7d). At this time, the value of I z was comparable to that of I x when the shear force was applied (Figure 7c), whereas the absolute value of I x was very small compared to I z when the normal force was applied (Figure 7d). Therein, the value of I z had considerable magnitude since it was impossible in reality that only the shear force is applied. As a result, we were able to deduce whether the force applied to the sensor by I x and I z was shear or normal as follows: Based on the direction of the inset in Figure 5, (i) if I x > 0 , I z > 0 , then +x direction, (ii) if I x < 0 , I z > 0 , then −x direction, and (iii) if I x < 0 , I z < 0 , then −z direction.
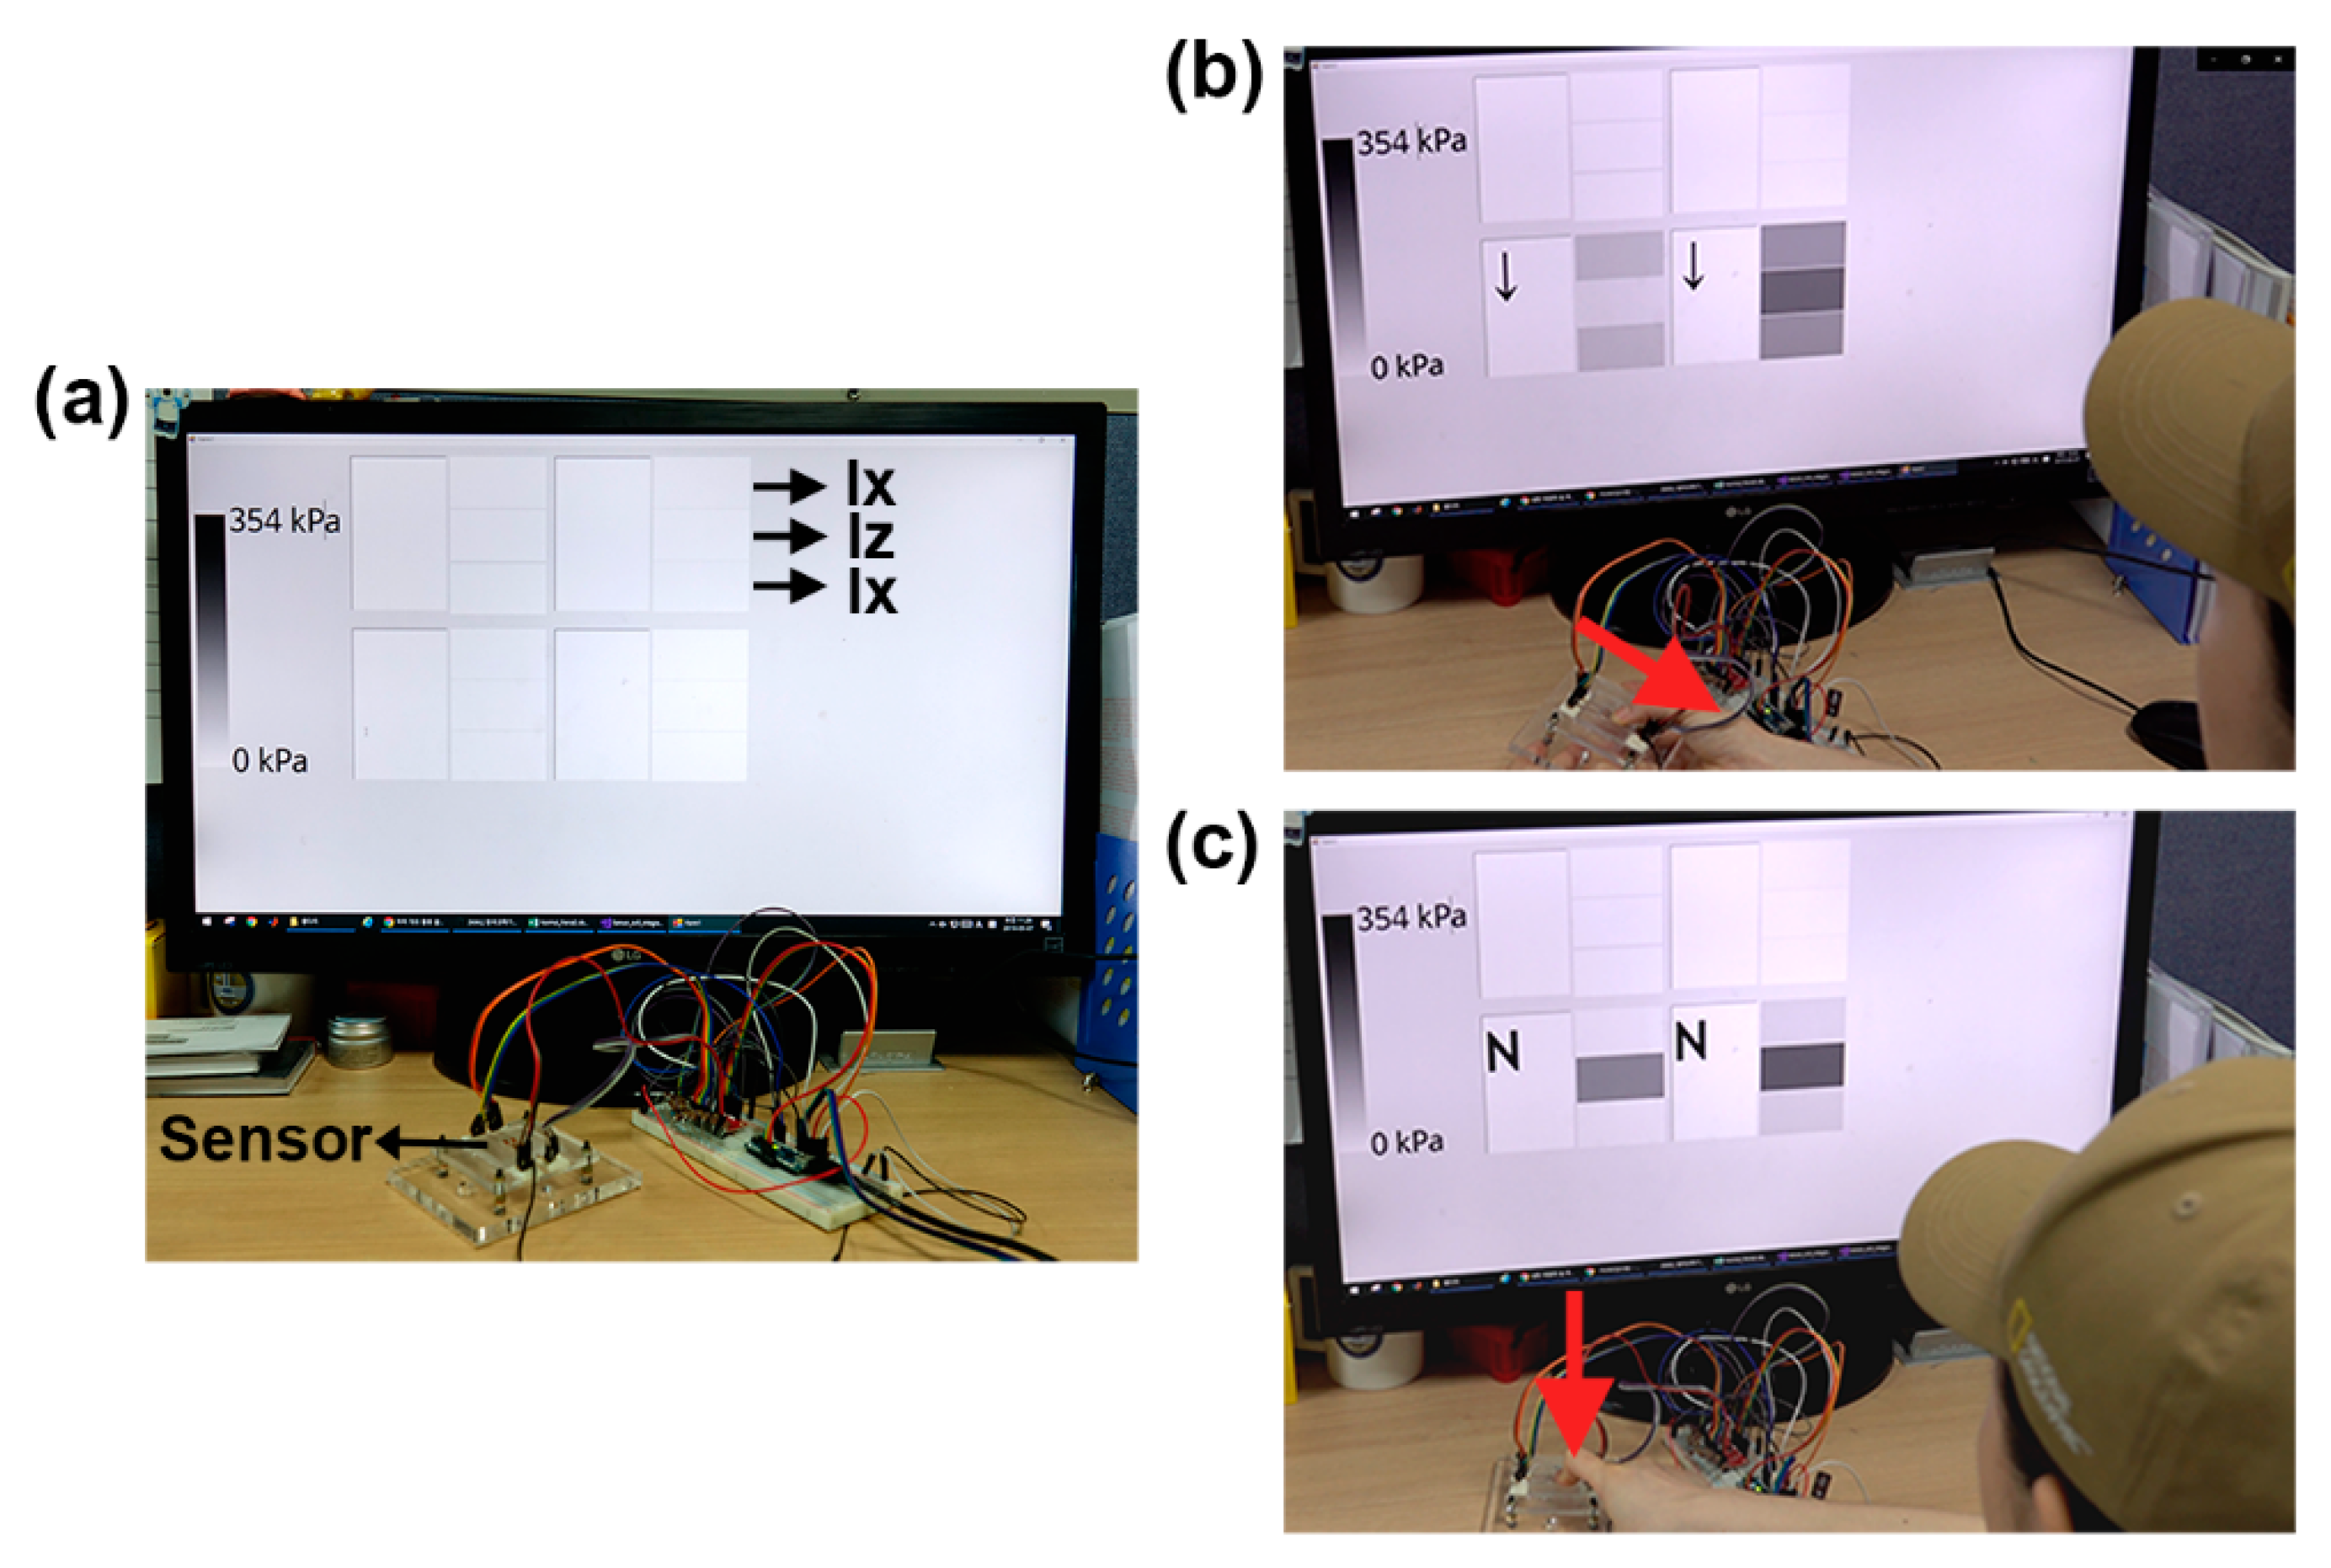
For a practical application, we presented a real-time measurement system for the shear and normal force sensor through the proposed data processing. We applied force to the lower two modules of the four sensor modules. The force components ( F x and F z ) were measured using the sensing system shown in Figure 3b and were displayed on a computer screen. In Figure 8a, each sensor module had a window showing a gray color corresponding to the magnitude of the force, and it also showed the direction of the applied force. Specifically, one module had three windows that indicated the magnitude of the applied force. The window for the two sensors located on the leg of the trapezoid bump represented the magnitude of F x , whereas the window for the sensor located on the upper base of the trapezoid bump represented the size of F z . Figure 8b shows the system results of the shear force test, whereas Figure 8c shows those of the normal force test. When a shear force was applied by a user, we also observed the normal force. It showed that a normal force component existed when a shear force was applied. Conversely, when a normal force was applied by a user, F x significantly reduced and F z became dominant. In addition, in both cases, because the forces were applied by a human finger, we could observe the difference in the force applied to each module. Supplementary Video S1 shows this experiment.

5. Conclusions

We have developed a flexible piezoelectric sensor that can sense shear and normal forces and can be fabricated using only one layer of PVDF film. This sensor with a 2 × 2 array consists of a PVDF film sealed with a 3D structured PDMS. In particular, this sensor is advantageous in terms of the fabrication process because it can be fabricated by simply patterning the electrode with a laser cutting machine on a commercial PVDF film without any complicated processes. Through the results of the data processing of the sensor output voltages, we obtained a value proportional to the magnitude of the applied force. In particular, the signals generated by the three sensors (P1, P2, and P3) in a single module exhibited different phases, and, therefore, the direction of the applied force could be derived. In addition, since the peak value of the processed value was proportional to the pressure applied to the sensor, the magnitude of the force could also be derived using the peak value after calibrating the sensor. Moreover, we studied the morphology of the PVDF film of one domain by using a finite element method when a force was applied, and the results showed that the difference in sensitivity between the P1 and P3 sensors was due to the connection by one domain of the PVDF film. Furthermore, we presented a system using this sensor array to sense the force applied to the sensor in real time. When unknown forces were applied to the sensor, the system displayed the direction and magnitude of the force in real time on a computer screen. We demonstrated how to make piezoelectric force sensors in a very simple fabrication process that can detect not only the normal but also the shear forces. Previous studies have been able to detect three-axis forces, but electrode patterning is essential, which involves complex processes such as lithography and sputtering [21,25,26]. In our method, this work makes it possible to detect biaxial forces simply by embedding a commercial piezoelectric film into the PDMS. Therefore, the main contributions of this work are: (i) developing a design of flexible piezoelectric force sensors capable of detecting shear and normal forces; and (ii) developing a very simple fabrication method for the shear and normal force sensor.

Supplementary Materials

The following are available online at https://www.mdpi.com/2076-3417/9/20/4339/s1, Video S1: Test of the real time force sensing system.

Author Contributions

Y.R.L. performed the experiment. J.C. programmed the real time sensing system. Y.O. contributed to the setup of the experiment. Y.R.L. and Y.C. analyzed the data and wrote the paper.

Funding

This research was supported by the Technology Innovation Program for Development of robotic work control technology capable of grasping and manipulating various objects in everyday life environment based on multimodal recognition and using tools funded by the Ministry of Trade, Industry and Energy under grant number 20001856.

Conflicts of Interest

The authors declare no conflict of interest.

References

  1. Kappassov, Z.; Corrales, J.-A.; Perdereau, V. Tactile sensing in dexterous robot hands—Review. Robot. Auton. Syst. 2015, 74, 195–220. [Google Scholar] [CrossRef]
  2. Cha, Y.; Nam, K.; Kim, D. Patient Posture Monitoring System Based on Flexible Sensors. Sensors 2017, 17, 584. [Google Scholar] [CrossRef] [PubMed]
  3. Cha, Y.; Seo, J.; Kim, J.-S.; Park, J.-M. Human–computer interface glove using flexible piezoelectric sensors. Smart Mater. Struct. 2017, 26, 057002. [Google Scholar] [CrossRef]
  4. Kim, J.-O.; Kwon, S.Y.; Kim, Y.; Choi, H.B.; Yang, J.C.; Oh, J.; Lee, H.S.; Sim, J.Y.; Ryu, S.; Park, S. Highly Ordered 3D Microstructure-Based Electronic Skin Capable of Differentiating Pressure, Temperature, and Proximity. ACS Appl. Mater. Interfaces 2019, 11, 1503–1511. [Google Scholar] [CrossRef]
  5. Sarwar, M.S.; Dobashi, Y.; Preston, C.; Wyss, J.K.M.; Mirabbasi, S.; Madden, J.D.W. Bend, stretch, and touch: Locating a finger on an actively deformed transparent sensor array. Sci. Adv. 2017, 3, e1602200. [Google Scholar] [CrossRef]
  6. Oh, J.; Yang, J.C.; Kim, J.-O.; Park, H.; Kwon, S.Y.; Lee, S.; Sim, J.Y.; Oh, H.W.; Kim, J.; Park, S. Pressure Insensitive Strain Sensor with Facile Solution-Based Process for Tactile Sensing Applications. ACS Nano 2018, 12, 7546–7553. [Google Scholar] [CrossRef]
  7. Pinto, T.; Cai, L.; Wang, C.; Tan, X. CNT-based sensor arrays for local strain measurements in soft pneumatic actuators. Int. J. Intell. Robot. Appl. 2017, 1, 157–166. [Google Scholar] [CrossRef]
  8. Chen, Z.; Wang, Z.; Li, X.; Lin, Y.; Luo, N.; Long, M.; Zhao, N.; Xu, J.-B. Flexible Piezoelectric-Induced Pressure Sensors for Static Measurements Based on Nanowires/Graphene Heterostructures. ACS Nano 2017, 11, 4507–4513. [Google Scholar] [CrossRef]
  9. Joo, Y.; Byun, J.; Seong, N.; Ha, J.; Kim, H.; Kim, S.; Kim, T.; Im, H.; Kim, D.; Hong, Y. Silver nanowire-embedded PDMS with a multiscale structure for a highly sensitive and robust flexible pressure sensor. Nanoscale 2015, 7, 6208–6215. [Google Scholar] [CrossRef]
  10. Drimus, A.; Kootstra, G.; Bilberg, A.; Kragic, D. Design of a flexible tactile sensor for classification of rigid and deformable objects. Robot. Auton. Syst. 2014, 62, 3–15. [Google Scholar] [CrossRef]
  11. Ponraj, G.; Kirthika, S.K.; Thakor, N.V.; Yeow, C.; Kukreja, S.L.; Ren, H. Development of flexible fabric based tactile sensor for closed loop control of soft robotic actuator. In Proceedings of the 13th IEEE Conference on Automation Science and Engineering (CASE), Xi’an, China, 20–23 August 2017; pp. 1451–1456. [Google Scholar]
  12. Culjat, M.O.; King, C.; Franco, M.L.; Lewis, C.E.; Bisley, J.W.; Dutson, E.P.; Grundfest, W.S. A tactile feedback system for robotic surgery. In Proceedings of the 30th Annual International Conference of the IEEE Engineering in Medicine and Biology Society, Vancouver, BC, Canada, 20–25 August 2008; pp. 1930–1934. [Google Scholar]
  13. Dobrzynska, J.A.; Gijs, M.A.M. Polymer-based flexible capacitive sensor for three-axial force measurements. J. Micromech. Microeng. 2012, 23, 015009. [Google Scholar] [CrossRef]
  14. Liang, G.; Wang, Y.; Mei, D.; Xi, K.; Chen, Z. Flexible Capacitive Tactile Sensor Array With Truncated Pyramids as Dielectric Layer for Three-Axis Force Measurement. J. Microelectromech. 2015, 24, 1510–1519. [Google Scholar] [CrossRef]
  15. Viry, L.; Levi, A.; Totaro, M.; Mondini, A.; Mattoli, V.; Mazzolai, B.; Beccai, L. Flexible Three-Axial Force Sensor for Soft and Highly Sensitive Artificial TouchAdvanced Materials. Adv. Mater. 2014, 26, 2659–2664. [Google Scholar] [CrossRef] [PubMed]
  16. Vogt, D.M.; Park, Y.; Wood, R.J. Design and Characterization of a Soft Multi-Axis Force Sensor Using Embedded Microfluidic Channels. IEEE Sens. J. 2013, 13, 4056–4064. [Google Scholar] [CrossRef] [Green Version]
  17. Yang, J.; Li, X.; Lü, X.; Bao, W.; Chen, R. Three-Dimensional Interfacial Stress Sensor Based on Graphene Foam. IEEE Sens. J. 2018, 18, 7956–7963. [Google Scholar] [CrossRef]
  18. Thanh-Vinh, N.; Binh-Khiem, N.; Takahashi, H.; Matsumoto, K.; Shimoyama, I. High-sensitivity triaxial tactile sensor with elastic microstructures pressing on piezoresistive cantilevers. Sens. Actuators A 2014, 215, 167–175. [Google Scholar] [CrossRef]
  19. Kim, M.-S.; Ahn, H.-R.; Lee, S.; Kim, C.; Kim, Y.-J. A dome-shaped piezoelectric tactile sensor arrays fabricated by an air inflation technique. Sens. Actuators A 2014, 212, 151–158. [Google Scholar] [CrossRef]
  20. Lu, K.; Huang, W.; Guo, J.; Gong, T.; Wei, X.; Lu, B.-W.; Liu, S.-Y.; Yu, B. Ultra-Sensitive Strain Sensor Based on Flexible Poly(vinylidene fluoride) Piezoelectric Film. Nanoscale Res. Lett. 2018, 13, 83. [Google Scholar] [CrossRef]
  21. Ting, Y.; Nugraha, A.; Chiu, C.W.; Gunawan, H. Design and characterization of one-layer PVDF thin film for a 3D force sensor. Sens. Actuators A 2016, 250, 129–137. [Google Scholar] [CrossRef]
  22. Kim, M.-O.; Pyo, S.; Oh, Y.; Kang, Y.; Cho, K.-H.; Choi, J.; Kim, J. Flexible and multi-directional piezoelectric energy harvester for self-powered human motion sensor. Smart Mater. Struct. 2018, 27, 035001. [Google Scholar] [CrossRef]
  23. Li, Z.; Wang, Z.L. Air/Liquid-Pressure and Heartbeat-Driven Flexible Fiber Nanogenerators as a Micro/Nano-Power Source or Diagnostic Sensor. Adv. Mater. 2011, 23, 84–89. [Google Scholar] [CrossRef] [PubMed]
  24. Xie, M.; Zhang, Y.; Kraśny, M.J.; Bowen, C.; Khanbareh, H.; Gathercole, N. Flexible and active self-powered pressure, shear sensors based on freeze casting ceramic–polymer composites. Energy Environ. Sci. 2018, 11, 2919–2927. [Google Scholar] [CrossRef] [PubMed]
  25. Yu, P.; Liu, W.; Gu, C.; Cheng, X.; Fu, X. Flexible Piezoelectric Tactile Sensor Array for Dynamic Three-Axis Force Measurement. Sensors 2016, 16, 819. [Google Scholar] [CrossRef] [PubMed]
  26. Chen, X.; Shao, J.; Tian, H.; Li, X.; Tian, Y.; Wang, C. Flexible three-axial tactile sensors with microstructure-enhanced piezoelectric effect and specially-arranged piezoelectric arrays. Smart Mater. Struct. 2018, 27, 025018. [Google Scholar] [CrossRef]
  27. Cha, Y.; You, H. Torsion sensing based on patterned piezoelectric beams. Smart Mater. Struct. 2018, 27, 035010. [Google Scholar] [CrossRef]
  28. Zizys, D.; Gaidys, R.; Dauksevicius, R.; Ostasevicius, V.; Daniulaitis, V. Segmentation of a Vibro-Shock Cantilever-Type Piezoelectric Energy Harvester Operating in Higher Transverse Vibration Modes. Sensors 2016, 16, 11. [Google Scholar] [CrossRef]
  29. Yi, J.; Liang, H. A PVDF-Based Deformation and Motion Sensor: Modeling and Experiments. IEEE Sens. J. 2008, 8, 384–391. [Google Scholar] [CrossRef]
  30. Tanaka, M.; Tanaka, Y.; Chonan, S. Measurement and Evaluation of Tactile Sensations using a PVDF Sensor. J. Intell. Mater. Syst. Struct. 2007, 19, 35–42. [Google Scholar] [CrossRef]
  31. Chen, Z.; Shen, Y.; Xi, N.; Tan, X. Integrated sensing for ionic polymer–metal composite actuators using PVDF thin films. Smart Mater. Struct. 2007, 16, S262–S271. [Google Scholar] [CrossRef]
  32. Wang, Y.R.; Zheng, J.M.; Ren, G.Y.; Zhang, P.H.; Xu, C. A flexible piezoelectric force sensor based on PVDF fabrics. Smart Mater. Struct. 2011, 20, 045009. [Google Scholar] [CrossRef]
  33. Cha, Y.; Hong, J.; Lee, J.; Park, J.-M.; Kim, K. Flexible Piezoelectric Energy Harvesting from Mouse Click Motions. Sensors 2016, 16, 1045. [Google Scholar] [CrossRef] [PubMed]
  34. Akaydin, H.D.; Elvin, N.; Andreopoulos, Y. Energy Harvesting from Highly Unsteady Fluid Flows using Piezoelectric Materials. J. Intell. Mater. Syst. Struct. 2010, 21, 1263–1278. [Google Scholar] [CrossRef]
  35. Wang, F.; Tanaka, M.; Chonan, S. Development of a PVDF Piezopolymer Sensor for Unconstrained In-Sleep Cardiorespiratory Monitoring. J. Intell. Mater. Syst. Struct. 2003, 14, 185–190. [Google Scholar] [CrossRef]
  36. Glick, C.C.; Srimongkol, M.T.; Schwartz, A.J.; Zhuang, W.S.; Lin, J.C.; Warren, R.H.; Tekell, D.R.; Satamalee, P.A.; Lin, L. Rapid assembly of multilayer microfluidic structures via 3D-printed transfer molding and bonding. Microsyst. Nanoeng. 2016, 2, 16063. [Google Scholar] [CrossRef] [Green Version]
  37. Wang, Z.; Volinsky, A.A.; Gallant, N.D. Crosslinking effect on polydimethylsiloxane elastic modulus measured by custom-built compression instrument. J. Appl. Polym. Sci. 2014, 131. [Google Scholar] [CrossRef] [Green Version]
  38. Cha, Y.; Hong, S. Experimental Usage of Humanoid Robot for Energy Harvesting Study From Walking Motion. In Proceedings of the Conference on Smart Materials, Adaptive Structures and Intelligent Systems, Stowe, VT, USA, 28–30 September 2016; p. V002T007A001. [Google Scholar]
Figure 1. Schematic diagram showing the fabrication process of the shear and normal force sensor. (a) Formation of the top and bottom PDMS. (b) Electrode patterning of a silver-coated PVDF film. (c) Assembly of the PDMS, PVDF film, and FPCB. (d) Photograph of the fabricated sensor array with (e) the sensor numbers. (f) Schematic of a cross-section view of the sensor. The length unit is millimeters (mm). (g) Electrode pattern of the FPCB.
Applsci 09 04339 g001
Figure 2. Schematic of the experimental setup for studying the sensing performance. (a) Area where the shear and normal forces were applied to the sensor array. (b) Schematic of the experimental setup with the sensor positioned vertically (left) and the 3D-printed bar (right) during the shear force test. (c) Schematic of the experimental setup with the sensor positioned horizontally (left) and the 3D-printed bar (right) during the normal force test.
Applsci 09 04339 g002
Figure 3. Schematic of the sensing system (a) for single unit measurement and (b) for sensor array measurement in real time.
Applsci 09 04339 g003
Figure 4. Result of the finite element method simulation for the displacement distribution of the PVDF film. (a) Schematic of the sensor (left) and displacement distribution (right) when a shear force was applied. (b) Schematic of the sensor (left) and displacement distribution (right) when a normal force was applied.
Applsci 09 04339 g004
Figure 5. Output voltages of a sensor module when (a) a shear stress of 75.67 kPa and (b) a normal stress of 96.17 kPa were applied. The red arrows indicate the direction of the applied force.
Applsci 09 04339 g005
Figure 6. Processed values from the output voltages of a sensor module when (a) a shear stress of 75.67 kPa and (b) a normal stress of 96.17 kPa were applied.
Applsci 09 04339 g006
Figure 7. Processed values of a sensor module as a function of the applied pressure. (a) Processed value under different pressures in the +x direction. (b) Processed value under different pressures in the −z direction. (c) Calculated I x and I z versus pressure in the +x direction. (d) Calculated I x and I z versus pressure in the −z direction. The points indicate the experimental data, whereas the lines indicate the fitting results.
Applsci 09 04339 g007
Figure 8. Test of the real time force sensing system. (a) Configuration of the window indicating the magnitude and direction of the applied force. Measured direction and magnitude of the force components ( F x and F z ) when (b) a shear force and (c) a normal force is applied. The red arrows indicate the direction of the applied force.
Applsci 09 04339 g008