1. Introduction
Congestion on freeways and the resulting social and economic costs are significant problems that trouble everyday life in almost every modern society [
1]. Congestion is known to reduce the nominal capacity of the freeway infrastructure with serious impacts on travel times, traffic safety, fuel consumption, and environmental pollution [
2]. Congestioncan hurt both quality of life and the environment due to the loss of time and the probability of accidents [
3]. Among many causes of congestion, high travel demand with insufficient road infrastructure and inefficient traffic control can easily be pointed out [
4].
Freeway on-ramp merging is one of the main factors that cause traffic congestion. This is because drivers merging from the on-ramp need to adjust vehicle speeds and positions to enter the freeway. At the same time, drivers already on the freeway should also accommodate vehicle speeds and positions to avoid colliding with merging vehicles from the on-ramp, which heavily affects upstream traffic flows.
Riyadh, the capital of Saudi Arabia, suffers from congestion not only during peak hours but also almost all day long, even without any incidents [
5]. This problem is largely concentrated on the freeway, but the majority of road users cannot avoid it to save travel time during their daily commutes.
A simple solution to the growing traffic congestion would be adding new roads or expanding the network to increase capacity. However, many countries currently could not easily choose this option due to the limited space and the high cost in urban areas. Another option is to use Traffic System Management (TSM) techniques, which are known to provide a wide variety of possibilities for a government to improve the capacity and efficiency of its transportation systems. One special technique of the TSM is Ramp Metering (RM), which uses a traffic signal usually installed halfway down the ramp on freeway on-ramps. As with a normal traffic light, RM controls the vehicle entrance to the flow of traffic on the freeway by switching between red and green lights. It is considered to reduce overall freeway congestion by controlling merging vehicles onto the freeway, to improve safety, and to provide a better level of service to motorists without any additional lanes on the freeway [
6].
RM has not been thoroughly studied and implemented in Saudi Arabia so far, although police officers are manually breaking up the merging vehicle queues on the on-ramps in freeways every morning and night. Saudi Arabia has not implemented the globally-accepted RM due to lack of research in local conditions. Without actual, concrete research to show how RM may improve local traffic situations, government officials in Saudi Arabia have not yet been convinced of the positive impact RM could have on local freeways. Therefore, this study aims to assess the applicability of RM in improving the current traffic conditions in Riyadh and to find the best RM operation plan among several workable plans using a microscopic traffic simulation model (VISSIM). From the scientific contribution point of view, this case study may appear as non-innovative. However, from the societal impact, this will add value to the RM topic since this is the very first scientific research in Saudi Arabia.
For this study, the necessary parameters of VISSIM will be calibrated to reflect driving behaviors in a weaving area in Makkah Road, one of the most heavily congested freeways in Riyadh. Several scenarios will be constructed to consider different operational options of RM and will then be analyzed to identify the best scenario for RM application to the study area. Finally, the overall efficiency and effectiveness of RM implemented in the study area during the simulations will be evaluated.
General explanations on active traffic management and RM will follow with the study results on the effectiveness of RM. After data collection and the preparation process (including parameter calibrations) are discussed, the scenario analysis and results will be summarized. The conclusions and recommendations based on the results of this study will be presented at the end of this paper.
2. Traffic Management and Ramp Metering
In the last few years, traffic management techniques have been improved, tested and deployed. Based on those successes, the Highway Capacity Manual [
7] defined the Active Traffic Management (ATM) as “a comprehensive approach optimizing the operational performance of the roadway system through monitoring and control of systems operations.” This approach can be described with RM, dynamic lane use or shoulder control, dynamic speed limits, queue warning, dynamic rerouting, dynamic junction control, and adaptive traffic signal control. What’s more, these can influence both the nature of the facility’s demand and ability to deliver the capacity to serve the demand. Therefore, ATM measures can improve facility performance, sometimes significantly.
ATM practices are not widespread in Saudi Arabia. However, some traffic management technologies have been recently featured in a few freeways and arterials in Riyadh. These are dynamic speed limits, queue warnings and dynamic reroutings on King Abdullah Road, Abu Bakr Al-Siddiq Road, and Al-Urubah Road. There is also a SAHER system used to enforce speed limits and red lights at signalized intersections.
Among the various applications of ATM, RM was proven to maximize the capacity of freeway systems by a safe and efficient movement of traffic [
8]. Simply put, RM is the use of a traffic signal installed on an on-ramp to control the entrance rate of vehicles onto the freeway. Since multiple vehicles attempt to merge onto the mainline at once, drivers on the freeway mainline tend to reduce their speed to allow vehicles to enter the freeway and a succession of these involuntary yields may cause lines. However, if vehicles enter the mainline at controlled intervals, they are less likely to disrupt the traffic flow on the mainline and more likely to increase average speed and shorten overall travel time on the freeway. RM also reduces the number of collisions, which are often caused by several vehicles merging from the on-ramp [
8].
There are two types of controls in RM. The first is fixed-time control, where meter rates are based on historical conditions and are fixed according to the time of the day. Ramp meters work based on pre-set schedules. The pre-set metering is a fixed metering rate that is not influenced by current mainline traffic conditions. This rate is usually set based on historical data. This RM is generally operated with a two—(red and green) or a three—(red, yellow and green) signal displayed by a local controller that can change metering rates by the time of the day and accept detector inputs. Although the ramp signal operates with a constant cycle length, the timing of the green, yellow, and red intervals varies on the type of metering: single-entry metering or platoon metering. Compared with single-entry metering, platoon metering is more complex in operation and may cause some driver confusion, which may lead to disruptions of ramp flow. What’s more, platoon metering has been successfully implemented in several locations.
The second control type of RM is a traffic-responsive control, which requires real-time mainline traffic data to determine the control parameters. This data collection needs more detectors than the fixed time RM. Based on real-time traffic data measurements, the maximum RM rate at which vehicles can be permitted to enter the freeway is determined. Lane occupancy (a surrogate measure for density) and flow rate (volume) are two important traffic variables (control parameters) in deciding an operational strategy in the traffic-responsive RM. Various algorithms are available for the traffic-responsive RM, such as demand-capacity algorithm, percent-occupancy algorithm, ALINEA algorithm, speed control algorithm, and gap occupancy algorithm. Three widely referenced local metering algorithms are demand-capacity, percent-occupancy, and ALINEA algorithms. This research uses the ALINEA algorithm since it is the most popular algorithm for the traffic-responsive RM [
9,
10,
11,
12,
13].
The first RM was implemented in Chicago, Illinois on the Eisenhower Expressway in 1963 [
14]. In 1967, the first two fixed-time RMs were installed in Los Angeles on the northbound Hollywood Freeway (Route 101). Two years later, they were upgraded to a traffic-responsive system [
8]. In the United States, more than 2200 ramp meters have been deployed by 1995 [
14]. According to a federal report in 2014, various types of RM have been deployed across the US [
15]. In Europe, the implementation and utilization of RM have been much more recent. In 1986, England installed its first RM devices on the M6 freeway. In 1989, the Netherlands began experiments with the RM concept near Amsterdam. France installed fixed-time traffic lights onto the thirty-five ramps of the Paris freeway network in 1970 [
16,
17].
Regarding the evaluation of RM, the Kansas Department of Transportation and Missouri Department of Transportation proved that RM is beneficial to traffic flow by decreasing overall accidents on the freeway by 64% in their 2011 study conducted on I-435 Road between Metcalf Avenue and the Three Trails Memorial Crossing [
18]. Washington State Department of Transportation, Georgia Department of Transportation, and the California Department of Transportation also experienced a reduced risk of merging accidents due to RM on their highways and freeways.
Furthermore, the case of Minnesota’s Twin Cities was very interesting. After turning off the active 430 RMs during the fall of 2000, they decreased through-traffic by 14%, doubled travel time unpredictability, and increased crashes by 26% [
19]. Zhang and Levinson [
20] determined that RM increased the capacity of freeway bottlenecks, after observing traffic flow characteristics at twenty-seven active bottlenecks in the Twin Cities for seven weeks with RM and seven weeks without RM. Before the observation, they tested the effectiveness of RM for several representative freeways in the Twin Cities. They then concluded that RM is more helpful for long-distance trips than for short trips [
21]. Lee et al. [
22] applied a real-time crash prediction model (CPM) to investigate the safety benefits of a local traffic-responsive ALINEA RM control on a freeway. From their simulation study, they concluded that ALINEA RM control could reduce crash potentials by 5–37%, compared with the no-control case.
In Saudi Arabia, especially in Riyadh, the concept of RM is utilized by dispatching police officers to freeway on-ramps. Relying on his own judgment, the police officer manually controls the entrance flow rate, based on the congestion on the freeway and the service road. Implementation of RM, with the help of sensors and traffic lights, will also relieve the police officers from the hard work they are doing.
3. Data Collection and Preparation
Data collection is both the most important step and the hardest-hitting job in the microscopic simulation. VISSIM has complicated data input requirements and parameters that need to be calibrated to reflect the local traffic conditions. In this study, data on network geometry, traffic volumes, turning movements, vehicle characteristics and types, travel demands, vehicle mix, stop signs, and traffic control systems are used for network coding, parameter calibration, and model running.
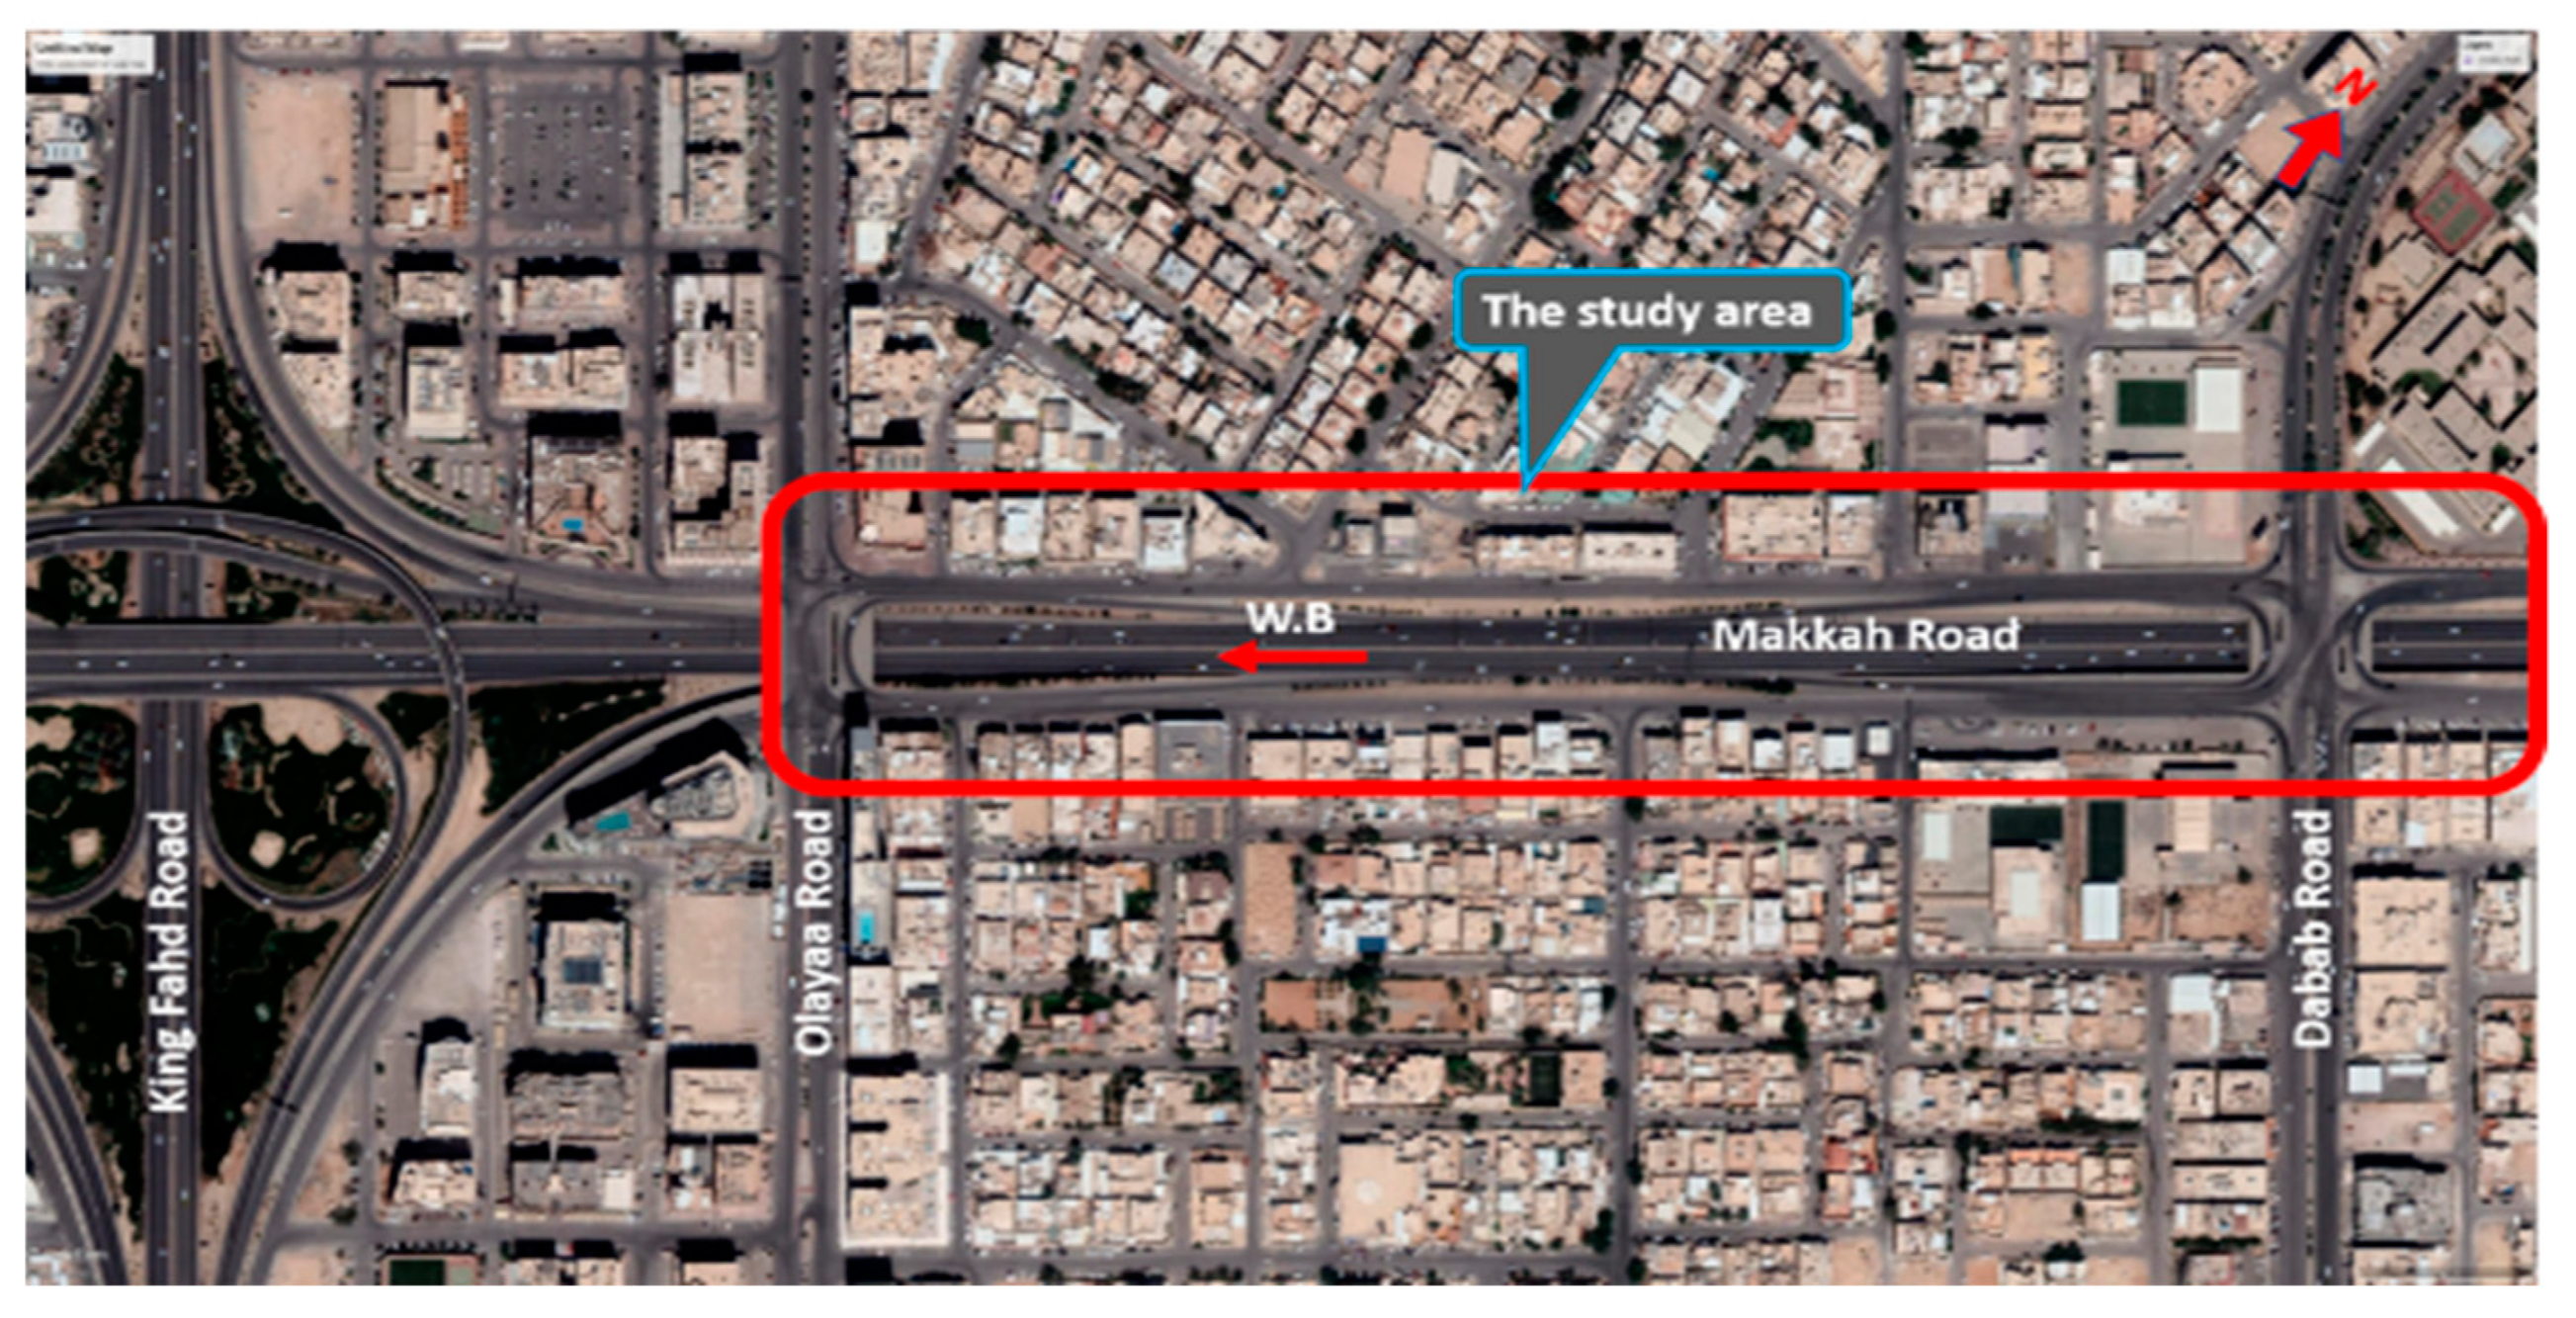
The study area is located in the westbound section of Makkah Road between Dabab Street and Olaya Street, which is a three-lane arterial. It has one on-ramp with two lanes, one off-ramp with two lanes, an auxiliary lane which connects the two ramps, and an adjacent intersection.
Figure 1 simply shows the area. Balke et al. [
23] established site selection criteria as follows: (i) Peak-period speeds less than 48 km/h, (ii) vehicle flows between 1200 and 1500 veh/h/ln, (iii) high accident rates, and (iv) significant merging problems. According to the Ministry of Transport (MOT) and Arriyadh Development Authority (ADA), this area suffers from significant merging problems that result in LOS F at the weaving segment. Moreover, the average speed is lower than 48 km/h and the flow rate of the right lane of freeway is 1546 veh/h/ln, which is near the criterion from Balke et al. [
23].
3.1. Data Collection
Geometric data for the area was available from the Ministry of Transport as well as from shop drawings, Google Maps, and survey work. Field visits were required to verify this data.
Figure 2 describes the layout of the study area. The geometric details are summarized in
Table 1. A single-point urban interchange is also taken into account in the data collection because all vehicles entering the highway come from it.
According to the traffic data for the site that was collected by ADA in 2015, the peak hours were divided into three time periods: A.M. peak (07:45–09:00) with maximum volume of 7707 veh/h, mid-day peak (12:15–13:45) with 7363 veh/h, and P.M. peak (16:00–17:00) with 7106 veh/h.
Based on this information, this study concentrated on A.M. peak. The vehicle counting started at 6:30 A.M. and ended at 10:00 A.M. As well, it was repeated from 14:45 to 17:30. Per the study, vehicle movements were recorded for two days (4 October 2017 and 9 October 2017). In the first survey, the A.M. peak was 08:00–09:00 with the volume of 7969 veh/h and the P.M. peak hour was 15:15–16:15 with 6887 veh/h. However, in the second survey, the A.M. peak hour slightly shifted to 07:00–08:00 with 8005 veh/h and P.M. peak hour was the same as the first survey with 7027 veh/h. Ultimately, the A.M. peak hour was chosen as 07:00–08:00 with 8005 veh/h to deal with the worse-case scenario.
The peak hour factor (PHF) was calculated as 0.97, which reflects that the volumes in the area do not fluctuate much throughout the peak hour.
Figure 3 shows the traffic volumes during the peak hour and that the three movements coming from the nearby interchange account for the volume of 3131 veh/h. Also, it may be noted that 2588 veh/h of high traffic volume enter the freeway using the on-ramp, which is the main target of this study. From capacity analysis, this weaving area was proved to have the LOS F.
According to the FWHA (Federal Highway Administration) vehicle classification, the vehicle compositions in the study area are: 99.25% of class 2 (passenger car) and class 3 (SUV and small buses); 0.55% of class 4 (buses); and 0.2% of class 5 (single unit track). No other vehicle types are allowed to enter the freeway during peak hours [
24].
Travel speed of a vehicle is one of the most important measures to describe the given state of traffic flow. The speed limit of the freeway section in the study area is 100 km/h. In this study, two types of speed were used. The time mean speed from 182 random samples for the A.M. peak hour was 84.16 km/h. This was used as the desired speed required in VISSIM as an input. The space mean speed was calculated from the field data which was captured from the recorded video using two parallel and 37 m apart imaginary lines. It was used as a measure of effectiveness in the VISSIM simulation process.
3.2. Parameter Calibration
For the model calibration, the GEH (Geoffrey E. Havers) statistic was used following VISSIM protocol [
25]. Model verification was also done as part of a process pertaining to the model calibration. Three parameters (CC0, CC1, and CC2) for car following model, nine parameters for lane change model, and lane change distance were calibrated until the traffic volumes from the simulation fell within an acceptable range of convergence (GEH < 3.0) with the observed volumes from the field (5417 veh/h).
The calibration started after the first simulation ran with the default values, which were given in the VISSIM software, for car following model, lane change model, and lane change distance. The next step was to calibrate only the three parameters of car following model: CC0, CC1, and CC2 [
25].
The car following model, Wiedenmann 99, in VISSIM, has ten parameters from CC0 to CC9. However, the VISSIM protocol [
25] recommends calibrating only three of them. They are standstill distance (CC0), headway time (CC1), and following variation (CC2). For the parameters from CC3 to CC9, the protocol recommends using the default values given in the VISSIM software. Moreover, the CC0, CC1, and CC2 cannot be calibrated separately. Since the following distance between two successive vehicles in VISSIM consists of desired safety distance and following variation (CC2), of which the desired safety distance is the summation of the standstill distance (CC0) and the headway distance (CC1 × Speed), the combination of three parameters affect the resultant traffic flow in simulation.
Therefore, the sensitivity analysis method based on the suggested range from VISSIM was applied to the calibration of the combination of the three parameters. From this calibration, the best combination of the three parameters was chosen which returned the highest traffic flow near to the real traffic flow from the field: 1.6 m of CC0, 0.9 s of CC1, 12 m of CC2, and resultant maximum traffic flow of 4567 veh/h.
After the calibration of three parameters for the car following model, similar sensitivity analyses were conducted for the calibration of the nine parameters of lane change model one by one, as well as for the lane change distance, starting at a given default of 200 m and in 100 m increments tested up to 700 m. The compulsory lane-changing behavior of VISSIM was specifically considered, focusing on the maximum and accepted deceleration rates for the merging and trailing vehicles. The best-calibrated values for the lane change model were chosen, shown in
Table 2. Through these second and third calibration processes, the VISSIM returned the maximum traffic flow of 5447 veh/h, which would fall within an acceptable range of convergence (GEH < 3.0).
4. Scenario Analysis
A base model was created first and calibrated to best resemble the current conditions experienced during the data collection phase. The measured volume and routing decisions were input at incremented 5-minute intervals. The routing decisions were entered as a proportion of all approaching vehicles selecting a certain route. These routing proportions were assumed to be static through each scenario in this research. After building the road network within the simulation model, the model was run for 4500 simulation-seconds, including the first 900 s for warming-up to the 3600 s of observation from the field. Eleven replications were run for each scenario with the simulation resolution of 10 time-steps per simulation-second and with random seeds from 25 to 35 by one-unit increments.
4.1. Preparation of Scenarios
Four main scenarios and eight sub-scenarios were constructed for the simulations to evaluate the applicability of RM in the study. Each scenario was modeled based on the calibrated VISSIM network and evaluated independently from the others.
Base scenario (current condition, BS)—the initially calibrated model is simulated without RM application. The results from this scenario serve as a reference for all other scenarios to evaluate the effectiveness of RM implementation.
Alternative scenario 1 (on-ramp closure, AS-1)—although an RM signal is provided, it will be red during the simulation period. Therefore, vehicles from the adjacent roads are not allowed to merge into the freeway. This situation seems illogical, but this assumption is necessary to calculate the maximum values of the freeway speed.
Alternative scenario 2 (off-ramp closure, AS-2)—since the off-ramp is closed in this scenario, vehicles on the freeway cannot use it to exit. Therefore, this scenario can reveal the effect of weaving around the area. If this scenario can return positive results, then this can also be considered a temporary solution to traffic congestion during peak hours.
Alternative scenario 3 (fixed time RM, AS-3)—the signal on the ramp operates with minimum red time, following a metering rate prescribed for the particular control period. This pre-timed operation is known as the simplest and least expensive form of RM for construction and installation, as well as the most rigid approach [
8]. In this scenario, the red signal will always be active unless at least one vehicle is detected upstream of the signal. The signal has two detection loops, as shown in
Figure 4: the first detector (presence detector) senses vehicle access to the signal and the second detector (counting detector) counts the number of vehicles that pass the signal.
Under this scenario, eight sub-scenarios were designed by changing the number of vehicles that the RM signal can serve during the green time and the minimum red time, as shown in
Table 3, to find the most recommended combination of them.
Alternative scenario 4 (traffic responsive RM, AS-4)—the traffic condition of the freeway directly influences the metering rate the ramp in this traffic responsive RM. Although there are more costs, such as freeway loop detectors or other surveillance systems, this alternative is more easily adoptable to change current conditions. Furthermore, this is known to provide better results than the pre-timed options [
8].
This research uses three detectors. The first detector (occupancy detector) is located on the freeway downstream of the merging area to calculate the occupancy rate in the mainline. The second detector (presence detector) is located right before the signal to sense vehicle approach. The third detector (queue detector) is located at the beginning of the on-ramp to check the vehicle queue length.
For building the traffic-responsive RM, the vehicle actuated programming (VAP) in VISSIM is utilized to realize the ALINEA algorithm, which is the most popular and widely used RM control algorithm for keeping occupancy under a static and pre-defined value of critical occupancy [
26]. Depending on the mainline density, the signal logic would vary the length of red time, thus changing the operating cycle time and ramp capacity. It also includes a queue-spillback correction detector (queue detector), where the ramp meter is set to green if the queue on the on-ramp spills back to the frontage roads.
In
Figure 5, the on-ramp length is measured as 145 m, and the length of the auxiliary lane is equal to 194 m. If it is assumed that the vehicles merge onto the freeway around in the middle of the auxiliary lane, the RM signal installed at a distance of 50 m from the end of the on-ramp will allow enough distance for the merging vehicles to accelerate from zero at the stop line to 60–70 km/h at merging point [
27].
4.2. Analysis Results and Findings
The simulation results of the base scenario represent the reality and the differences from the other scenarios compared together. Based on the three time-dependent performance measures, all scenario results are compared: Volume, speed, and queue length.
Volume–the throughput of traffic is counted at three locations: on the freeway, on-ramp, and off-ramp.
Table 4 shows the total volume throughput results of each scenario and the difference of it from the base scenario as a percentage. In the mainline of the freeway, no recognizable difference exists in volumes because the input of the total volume into the program is fixed. Therefore, the change will appear in the on-ramp or off-ramp in general, as shown in the table. Aside from the AS-3-5V4R scenario, all scenarios show a decrease in the total volume around the study area. Since a large decrease in volume is not good in this area from an operational point of view, AS-3 and AS-4 look reasonable. However, AS-3-3V2R, AS-3-4V3R, AS-3-5V3R, and AS-3-5V4R produced reasonable results with less than 1% of reduction in total volume.
Speed—for the average speed comparisons among scenarios in the VISSIM simulations, the Space Mean Speed (SMS) is calculated and presented in
Table 5. The speed improvement of each scenario is given as percentage change from the base scenario. From the results, it is clear that all scenarios have shown improvement in the average speed from the base scenario, but the AS-1, AS-2, AS-3-2V2R, AS-3-3V3R, and AS-3-4V4R show more significant improvements (over 50%) than others.
Queue length–maximum and average queue lengths are collected at the stop line of the on-ramp. In VISSIM, the queue on the freeway is defined by speed and headway (spacing) as shown in
Figure 6. It starts if the speed decreases to 5 km/h and ends if speed recovers to 10 km/h with a maximum headway (spacing) between successive vehicles being 10 m. Since the maximum available storage length of the queue from the signal in on-ramp to the interchange is 310 m in the study area, the simulation results, which exceed this value, are unrealistic. The results in
Table 6 show that only five scenarios have the queue length not exceeding the maximum storage length on the frontage road. They are AS-2, AS-3-4V3R, AS-3-5V3R, AS-3-5V4R, and AS-4; except for the AS-3-5V3R, they also have reductions in the queue length on the freeway.
5. Conclusions
Merging is considered one of the main factors that cause traffic congestion on freeways. Makkah Road, the study area for this research, also has operational problems with a reduction in speed to less than 40 km/h because of consecutive on and off-ramps. Therefore, this research evaluated the applicability of implementing RM in one on-ramp.
For this base scenario (current situation), four additional main scenarios with eight sub-scenarios under scenario three were chosen and compared using a microsimulation model, VISSIM. To determine the best scenario, or to recommend that a certain scenario is better than the base scenario, the four criteria below were applied:
The scenario must work for all current volume on the on-ramp in the study area;
In the scenario, the average queue length of the on-ramp must not exceed the maximum storage length (310 m);
The average queue length on the freeway must be less than the current situation;
The average speed must be higher than the current one.
However, considering the time value of the local drivers, total benefits gained from the changes in traffic volume and average speed (travel time) must be compared alongside the total costs for the installation, operation, and maintenance of the RM on the site. Through this economic analysis, the agreeable criteria on the volume and average speed will be determined.
From the scenario analysis using the microsimulation model, only four scenarios satisfied the first two criteria. They are 4V3R, 5V3R, 5V4R sub-scenarios of the third main scenario (fixed time RM operation, AS-3), and the fourth main scenario (traffic responsive RM operation using ALINEA model, AS-4). Three out of the four (AS-3-4V3R, AS-3-5V4R and AS-4) were better than the current situation (base scenario) even with the third and fourth evaluation criteria. However, when compared to the base scenario, from the viewpoint of average queue length on the freeway, the 4V3R scenario showed the biggest drop (236.2 m→41.0 m) among the three. From the average speed point of view, the AS-4 had the greatest improvement (36.7 km/h→49.4 km/h). However, the 4V3R scenario also indicated an improved result (36.7 km/h→45.0 km/h).
Based on the goal and objectives of this study, a summary of the research results is listed as follows:
In this study, the fixed time RM operation scenarios showed better performances than others overall;
The sub-scenario 4V3R of the AS-3 was the best in the average queue length reduction;
The AS-4 was the best in the average speed improvement.
This study presents the most simplified and isolated application of RM. Therefore, future research should focus on the following:
By using simulation, switch the locations of the on-ramp and off-ramp, so that the off-ramp becomes first, followed by the on-ramp, which would reduce the weaving on the freeway as well as giving large storage capacity for queues so traffic at the intersection is unaffected;
Coordinate the signal timing in an adjacent intersection with RM operation in an interchange, with the expansion of such a system to different locations of Makkah, Khurais, and King Fahad Roads, which are considered the most congested in Riyadh, based on the information provided by MOT and RDA;
Perform an economic analysis with total costs for deploying the RM to freeways as well as the benefits from the RM in terms of the positive return to the country, including pollution, transportation, and safety costs;
Contemplate the methods of applying RM and its operation in reality, the extent to which the drivers accept this system and the appropriate ways to guide drivers to comply with this system, especially aggressive drivers;
Adopt fusion data collection methods to improve the process of the description of traffic flow conditions. For example, the Automatic Vehicle Location (AVL) system of public transportation can ease the collection of locational data and enhance its data accuracy in the traffic flow modeling process.
Recently the Saudi Arabian Ministry of Interior (MOI), which is in charge of the traffic operation and management, began to consider deploying RM to the main urban arterials that chronically suffer from traffic congestions. King Fahad Road is to be one of the targets for deployment. This will be the best chance to continue future research focusing on the five points indicated diretly above. We expect there will be more feasibility research about the implementation of RM in Saudi Arabia very soon. Lastly, we believe that this paper will guide their directions and shed light on their future work.


