Abstract
Biochar has been presented as a multifunctional material with short- and long-term agro-environmental benefits, including soil organic matter stabilization, improved nutrient cycling, and increased primary productivity. However, its turnover time, when applied to soil, varies greatly depending on feedstock and pyrolysis temperature. For sewage sludge-derived biochars, which have high N contents, there is still a major uncertainty regarding the influence of pyrolysis temperatures on soil carbon mineralization and its relationship to soil N availability. Sewage sludge and sewage sludge-derived biochars produced at 300 °C (BC300), 400 °C (BC400), and 500 °C (BC500) were added to an Oxisol in a short-term incubation experiment. Carbon mineralization and nitrogen availability (N-NH4+ and N-NO3−) were studied using a first-order model. BC300 and BC400 showed higher soil C mineralization rates and N-NH4+ contents, demonstrating their potential to be used for plant nutrition. Compared to the control, the cumulative C-CO2 emissions increased by 60–64% when biochars BC300 and BC400 were applied to soil. On the other hand, C-CO2 emissions decreased by 6% after the addition of BC500, indicating the predominance of recalcitrant compounds, which results in a lower supply of soil N-NH4+ (83.4 mg kg−1) in BC500, being 67% lower than BC300 (255.7 mg kg−1). Soil N availability was strongly influenced by total N, total C, C/N ratio, H, pore volume, and specific surface area in the biochars.
1. Introduction
Advanced thermal treatments employing pyrolysis are being more frequently used in an effort to find safer solutions for the disposal and utilization of wastewater sludge. The pyrolysis of sewage sludge (SS) results in an SS-derived biochar, which is free of pathogens and of other hazardous organic compounds [1,2], enabling its use for agricultural purposes. Biochar produced from essentially domestic SS could present a heavy metal concentration below the maximum limits allowed in several countries [3]. One of the main drawbacks of biochars could be the presence of polycyclic aromatic hydrocarbons (PAHs), which have been increasingly studied in several laboratories across the world [4]. Due to the high concentration of several plant nutrients, SS-derived biochars have been increasingly studied [5], and their benefits include nutrient supply (mainly P, N, and Ca) for short-cycle crops, such as radish [6], and grain crops, such as maize [2], in highly weathered soils. The application of 15 Mg ha−1 of SS-derived biochar to an Oxisol was able to fully replace mineral fertilization for maize production [7].
In addition to the nutritional benefits of SS biochar for crop production, it may also reduce soil greenhouse gas emissions [8,9]. According to Woolf et al. [10], the use of biochar can potentially reduce soil annual net emissions by a 1.8 Pg of C-CO2 equivalent per year, which represents 12% of current anthropogenic C-CO2 equivalent emissions. The carbon (C) sequestration potential of biochar is related to its recalcitrant pyrogenic-C, which is resistant to degradation [11]. This recalcitrant fraction of biochar is basically influenced by the feedstock and formation conditions under which biochar is produced [12,13]. Depending on biochars’ chemical and physical characteristics, their degradation rates may vary enormously [13,14]. Finding ways to obtain biochars that are both capable of sequestering C and releasing nutrients in the soil for food security and production is still a challenge for science. An appropriate combination of feedstock and production temperature is a strategy that could allow for the development of “designed” biochars for specific environmental and/or agricultural purposes.
The land application of either SS or SS-derived biochar causes changes to soil structure and to the functioning of agroecosystems, with the soil microbial community being the most sensitive component [15]. Applying these products to soil may either increase microbial biomass activity due to increases in soil C and nutrients or inhibit it due to the presence of heavy metals and other toxic compounds [16]. Therefore, microbial biomass will respond positively or negatively depending on the quality and quantity of the amendment. For example, the application of biochar with low available nitrogen (N) to soil may increase the half-life of C in soil due to a decrease in C mineralization rates [17]. Moreover, if the objective of applying biochar to soil is to increase soil fertility, then low pyrolysis temperature biochar may be more suitable because of its higher rates of C and nutrient mineralization in soil [17,18].
To better understand the behavior of labile and recalcitrant fractions of biochars produced by different pyrolysis temperatures, soil incubation tests are extremely useful [19,20]. The information obtained from incubation tests enables the inference of the relationship between the more labile fraction of biochar, its pyrolysis temperature, and the feedstock used for production [14,21]. In the last two decades, several studies have found that biochars produced at higher pyrolysis temperatures are highly resistant to decomposition and have the potential to store C in soil [13,22]. However, because of their high stability, these same biochars have low capacity to release nutrients in a short-term period. Moreover, some biochars have the potential to be a source of N, whereas others may immobilize N due to the mineralization process of the biochar labile fractions [23], which mainly occurs during the first few years after applying biochar to soil [13]. Therefore, it is important to better understand the dynamics of SS and derived biochars (produced at different pyrolysis temperatures) on C and N mineralization. Furthermore, the use of kinetics of C mineralization represents an important tool to describe the behavior of these materials when applied to the soil [20].
A highly significant relationship between C-CO2 evolution and gross N mineralization has been shown for a range of organic amendments, such as poultry manure, green waste–based compost, and a straw-based compost [24]. However, there is still a lack of information on how N availability in soils occurs from the mineralization of carbonized SS.
In this study, the SS-derived biochars obtained at different temperatures were applied to a representative weathered tropical soil in an incubation experiment. The objectives of the present study were (1) to evaluate the kinetics of C mineralization of biochars and (2) investigate the biochars’ contributions to C stability and N availability in the soil.
2. Materials and Methods
2.1. Soil Characteristics
Samples of a clayey Oxisol (Typic Haplustox) [25] or Gibbsic Ferralsol [26] were collected at the 0.00–0.20 m soil layer (15° 56′ 45″ S, 47° 55′ 43″ W; 1095 m elevation). The soil chemical and physical properties were determined according to Teixeira et al. [27], and are shown in Table 1. In summary, the pH was determined in CaCl2 using a 1:2.5 (w/v) soil:solution ratio suspension; 0.5 mol L−1 KCl was used as an extractant for the determination of calcium (Ca+2), magnesium (Mg+2), and exchangeable aluminum (Al+3) contents. This solution was left for overnight equilibration. Subsequently, Ca+2 and Mg+2 were determined by atomic absorption spectrometry (Shimadzu AA-6300, Shimadzu Scientific Instruments, Columbia, USA), and Al+3 by titration with a 0.01 mol L−1 NaOH solution; potassium and phosphorus contents were determined using the Mehlich-1 (0.05 M HCl + 0.025 M H2SO4) extraction procedure. Available K was analyzed by flame spectrophotometry, and available P was determined using a spectrophotometer (UV-5100, Tecnal, São Paulo, Brazil) at an 882 nm wavelength after reaction with molybdovanadate phosphoric acid. Before starting the incubation experiment, the soil was air-dried, sieved to 2 mm, and water was added to maintain humidity around 20% water holding capacity, obtained from the van Genuchten model measured by centrifuge method [28].

Table 1.
Soil chemical and physical properties a.
2.2. Biochar Production
Biochars were produced from SS samples collected at the wastewater treatment plant (WWTP) belonging to the Environmental Sanitation Company of the Federal District, Brasília, DF, Brazil. This WWTP utilizes a tertiary treatment system. The SS was air dried (approximately to 20% moisture content), passed through an 8 mm sieve, and then pyrolyzed at 300 °C (BC300), 400 °C (BC400), and 500 °C (BC500). Pyrolysis was conducted in a muffle furnace (Linn Elektro Therm, Eschenfelden, Hirschbach, Germany) at a mean temperature increase rate of 2.5 °C min−1 and residence time of 30 min. The samples were placed in a metal container adapted to the internal space of the furnace containing a gas and bio-oil exit system, with a mechanism to prevent oxygen flow and a digital thermostat for temperature control. Table 2 shows the chemical and physical characteristics of the SS and biochars used in the present study.
Table 2.
Chemical, physical, and microbiological characteristics of the sewage sludge and biochars.
2.3. Physicochemical Characterization of Biochars
The sewage sludge biochar (SSB) specific surface areas and pore volumes were determined by N2 adsorption isotherms at −196.2 °C in a surface area analyzer, NOVA 2200. The sample was degassed under vacuum at 300 °C for three hours before the measurement. Total C, N, and H contents in SS and SSB were determined using a CHN Elemental analyzer (model PE 2400, series II CHNS/O, PerkinElmer, Norwalk, CT, USA). Organic carbon (OC) was determined following Mebius [29]. According to this method, the digestion mixture of potassium dichromate with sulfuric acid was submitted to external heating on an electric plate at 100 °C for 30 min under reflux. OC was also determined according to Walkley–Black procedure with no external heating. The pH was determined in a 0.01 M CaCl2 solution, using a 1:5 (w/v) biochar:solution ratio suspension. Electrical conductivity (EC) was measured in a 1:10 (g mL−1) ratio using a conductivity meter. After drying, grounding, and sieving through a 0.50 mm mesh sieve, samples were subjected to acid digestion with concentrated HCl/HNO3 according to USEPA 3050B [30], and the elements were quantified according to the following procedures: phosphorus was determined by the molybdovanadate phosphoric acid method, potassium by flame photometry. Calcium, magnesium, sulfur, and heavy metals were analyzed by ICP-OES (ICPE-9000, Shimadzu, Kyoto, Japan). Nitrate and ammonium were determined by the Kjeldhal method [31]. Moisture was determined by calculating the weight loss after heating samples at 105 °C in porcelain crucibles until constant weight. Ash was determined as the residual remaining after heating to 600 °C and held at this temperature until the sample weight stabilized. The yield was calculated by the ratio between the mass of biochar and the feedstock.
2.4. Incubation Experiment
The incubation experiment was implemented in a completely randomized design with four replicates. The treatments were the following: (1) control soil without amendments (S); (2) soil with SS (S + SS); (3) soil with biochar produced at pyrolysis temperature of 300 °C (S + BC300); (4) soil with biochar produced at pyrolysis temperature of 400 °C (S + BC400); (5) soil with biochar produced at pyrolysis temperature of 500 °C (S + BC500). Five grams of each material (biochars and SS) were added and mixed with 50 g of soil, corresponding to 10% of biochar per soil weight (w/w). The mixture was then placed in 1.0 L glass pots and sealed. The C-CO2 released from the mixture was captured with a solution of 1.0 mol L−1 NaOH, which was changed periodically. C-CO2 was measured by removing the alkaline trap, adding BaCl2 (20%) and titrated with 0.1 mol L−1 HCl [32]. The incubation experiment lasted for 127 days in the dark at 23 ± 2 °C, and the alkaline trap was collected, titrated, and renewed fifteen times. Deionized water was used to bring all soils to 75% water holding capacity, and this was adjusted weekly. In the first 10 days, the trap was collected every two days, whereas, after that period, the trap was exchanged every seven days. The C mineralization rate (CMR) was determined during the sample incubation period.
2.5. Chemical Analyses of Available Nitrogen
At the end of the incubation trial (127 days after implementation), soil samples were collected from the pots and analyzed for nitrate (N-NO3−) and ammonium (N-NH4+) contents. These were determined using the semi-micro Kjeldahl method. N-NO3− and N-HH4+ were extracted with a 1.0 mol L−1 KCl solution overnight. A total of 10 mL of the extracted solution was distilled with Devarda alloy (for N-NO3−) and MgO (for N-NH4+). Nitrogen from these mineral forms was quantified using an H2SO4 (0.0025 mol L−1) solution.
2.6. Carbon Mineralization Kinetics Model
A model [33] was used to describe C-CO2 evolution in the treatments. This equation uses a generalization of the first order model containing an additional parameter (C1), which is the intercept of the function and represents a separate pool of labile carbon, leading to a mineralization flush during the initial incubation period (Equation (1)):
where Ct represents the amount of C-CO2 evolved/mineralized after time (t); C0 represents the amount of total C that can evolve (potentially) (mg kg−1), C1 is the most easily mineralizable C; k is the rate constant, representing the velocity of decomposition (day−1), and t is the incubation period (days).
Ct = C0 (1 − e−kt) + C1
2.7. Statistical Analyses
A non-linear regression analysis was performed for cumulative data and C mineralization decay. The models were tested for statistical significance and for the adjusted coefficients (R2), considering the levels of convergence (status) for each model. Differences in available N and the rate of C mineralization between treatments were checked using a one-way ANOVA, followed by Tukey test (P < 0.05). The analyses were performed using SAS software [34].
The cumulative C-CO2 efflux, available N (NO3− and NH4+), and physical-chemical properties of SS and SS-derived biochars were subjected to Principal Component Analysis (PCA), based on linear combinations of the original variables on independent orthogonal axes, and was performed by XLSTAT [35].
3. Results and Discussion
3.1. General Properties of the Soil, Sewage Sludge, and Biochars
The soil chemical and physical properties are presented in Table 1. In general, the clayey soil (580.8 g clay kg−1) showed low nutrient contents (Ca+2, Mg+2, P, and K+) and low cation exchange capacity (CEC). This is a representative tropical acidic Oxisol (pH value of 5.1) from the Central Region of Brazil.
The chemical, physical, and microbiological characteristics of the sewage sludge (SS) and the biochars are shown in Table 2. The biochar produced at pyrolysis temperature of 300 °C (BC300) showed higher C (total and organic) and N contents compared to biochar produced at pyrolysis temperature of 500 °C (BC500) and SS. A decrease in the C and N contents was observed from BC 300 to BC 500. Increasing the pyrolysis temperature gradually reduced the percentage of H and the H/C ratio, and increased the C/N ratio. The pyrolysis of SS increased pH values, shifting from an acidic condition (pH = 4.8 in SS) to near neutrality (pH = 6.5 in BC500). Higher pH values in BC500 may be related to increased concentrations of alkali elements, such as Ca and Mg oxides, and their alkaline reactions.
In general, except for the nitrate and ammonium concentrations, the pyrolysis of sewage sludge enriched the macro- and micronutrients in the biochars. Phosphorus and potassium were higher in the biochars compared to SS, and this enrichment increased with pyrolysis temperature. In addition, the surface area and the pore volume increased with increasing pyrolysis temperature. Increasing the pyrolysis temperature gradually increased the total heavy metal contents. Nevertheless, recently, Figueiredo et al. [3] concluded that heavy metals availability decreases with increasing pyrolysis temperature.
3.2. The Dynamics of C Mineralization
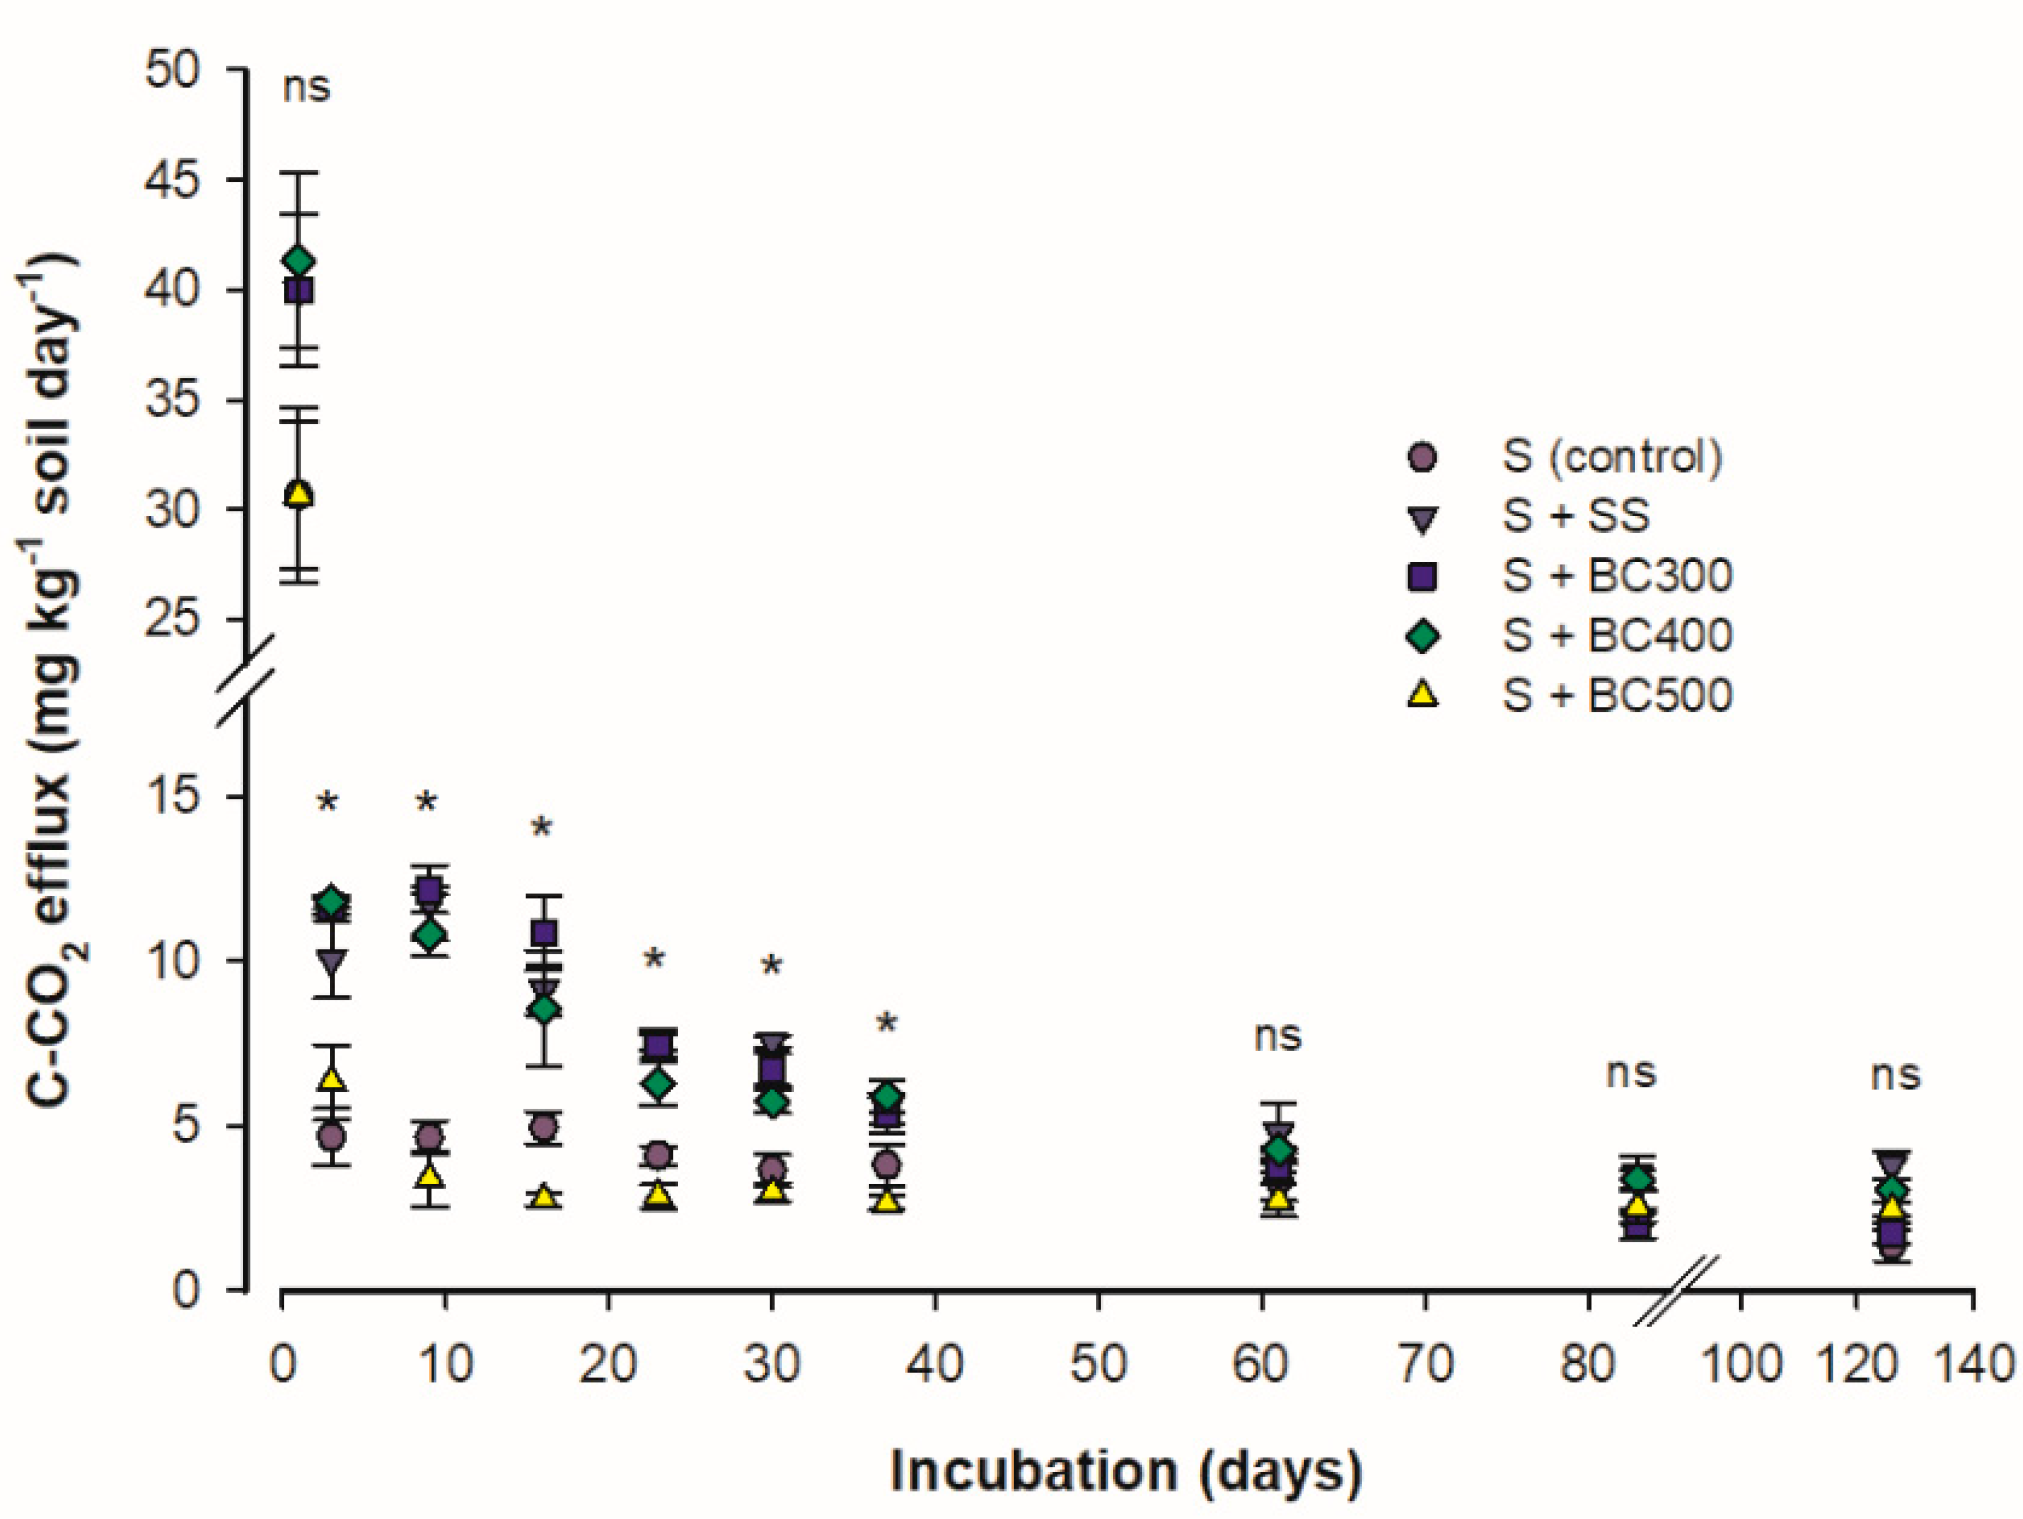
The C mineralization rate (CMR) was higher at the beginning of the incubation period and gradually decreased. CMR bottomed after day 60 (Figure 1). The higher CMR at the beginning of the incubation period is due to the decomposition of the labile C compounds present in the biochars [19], which can be found in water soluble fractions [36]. When the more labile fraction is degraded, the fractions that are more resistant to microbial attack start to slowly decompose and mineralize at a lower and more constant rate [37].
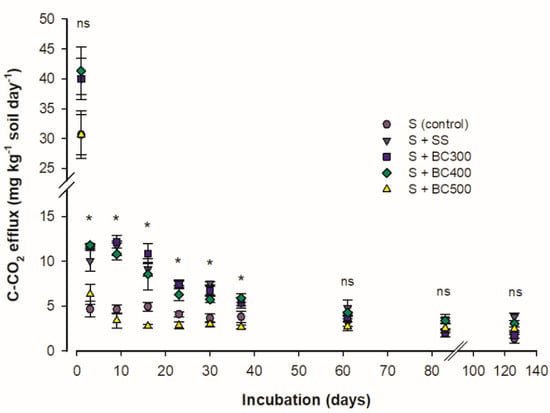
Figure 1.
Carbon mineralization rate (CMR) of soil and sewage sludge (S + SS), soil and SS-derived biochars obtained at 300 °C (S + BC300), 400 °C (S + BC400), and 500 °C (S + BC500) pyrolysis temperature and soil (S) as the control treatment. * and ns: significative and non-significative using the Tukey test (P < 0.05), respectively.
Among the samples studied, two distinct groups were observed: one composed of SS, S + BC300, and S + BC400 and another one represented by the S + BC500 and the S (control). The first group showed higher CMR, from 3 to 37 days after the beginning of the incubation period than the second group. From this period on, all samples showed no differences in CMR values (P > 0.05). These results demonstrate that SS biochars produced under pyrolysis temperatures above 400 °C have a reduced amount of easily oxidizable compounds [2], higher C/N ratio, and higher H/C ratio (Table 1). The H/C ratio is suggested as a stability indicator, which decreases linearly with increasing pyrolysis temperatures, and thus, reflects increased C stability in soil [10]. As the readily oxidizable compounds are depleted, the remaining recalcitrant organic materials are decomposed by a specialized population of fungi and bacteria, which synthesize the enzymes necessary for such decomposition [38]. At this stage, the CMR is slow and more constant. Therefore, the lower CMR found for S + BC500 (due to higher pyrolysis temperature) indicates that this material represents an excellent option for soil C sequestration and to decrease C-CO2 emissions to the atmosphere.
Similarly to our results, in a previous study by Abdulrazzaq et al. [39], the pyrolysis temperatures had a great influence on the biochar’s stability, which was indicated by the nature of the C structures. The low CMR was attributed to increasing aromatic C (benzene-like rings), which have extra stability in the soil, to an effective structural change that favors the appearance of turbostratic-C crystallites molecules [40], and to the higher silica content (Si-O stretching instead of organic C-OH stretching of carbohydrates) [18] with increasing pyrolysis temperature. Zimmerman [14], studying a range of biochars produced from different feedstocks and at several temperatures, noted that C-CO2 release from abiotic incubations was 50–90% of that of inoculated (biotic) incubations, and both generally decreased with increasing pyrolysis temperatures. Such findings were similar to our results. Therefore, the less condensed pyrogenic-C, and, thus, the more available oxidizable-C found in the biochars produced at lower pyrolysis temperatures (BC300 and BC400), stimulate soil microbial activity and induce a positive priming effect [40].
3.3. Kinetics of C-CO2 Efflux
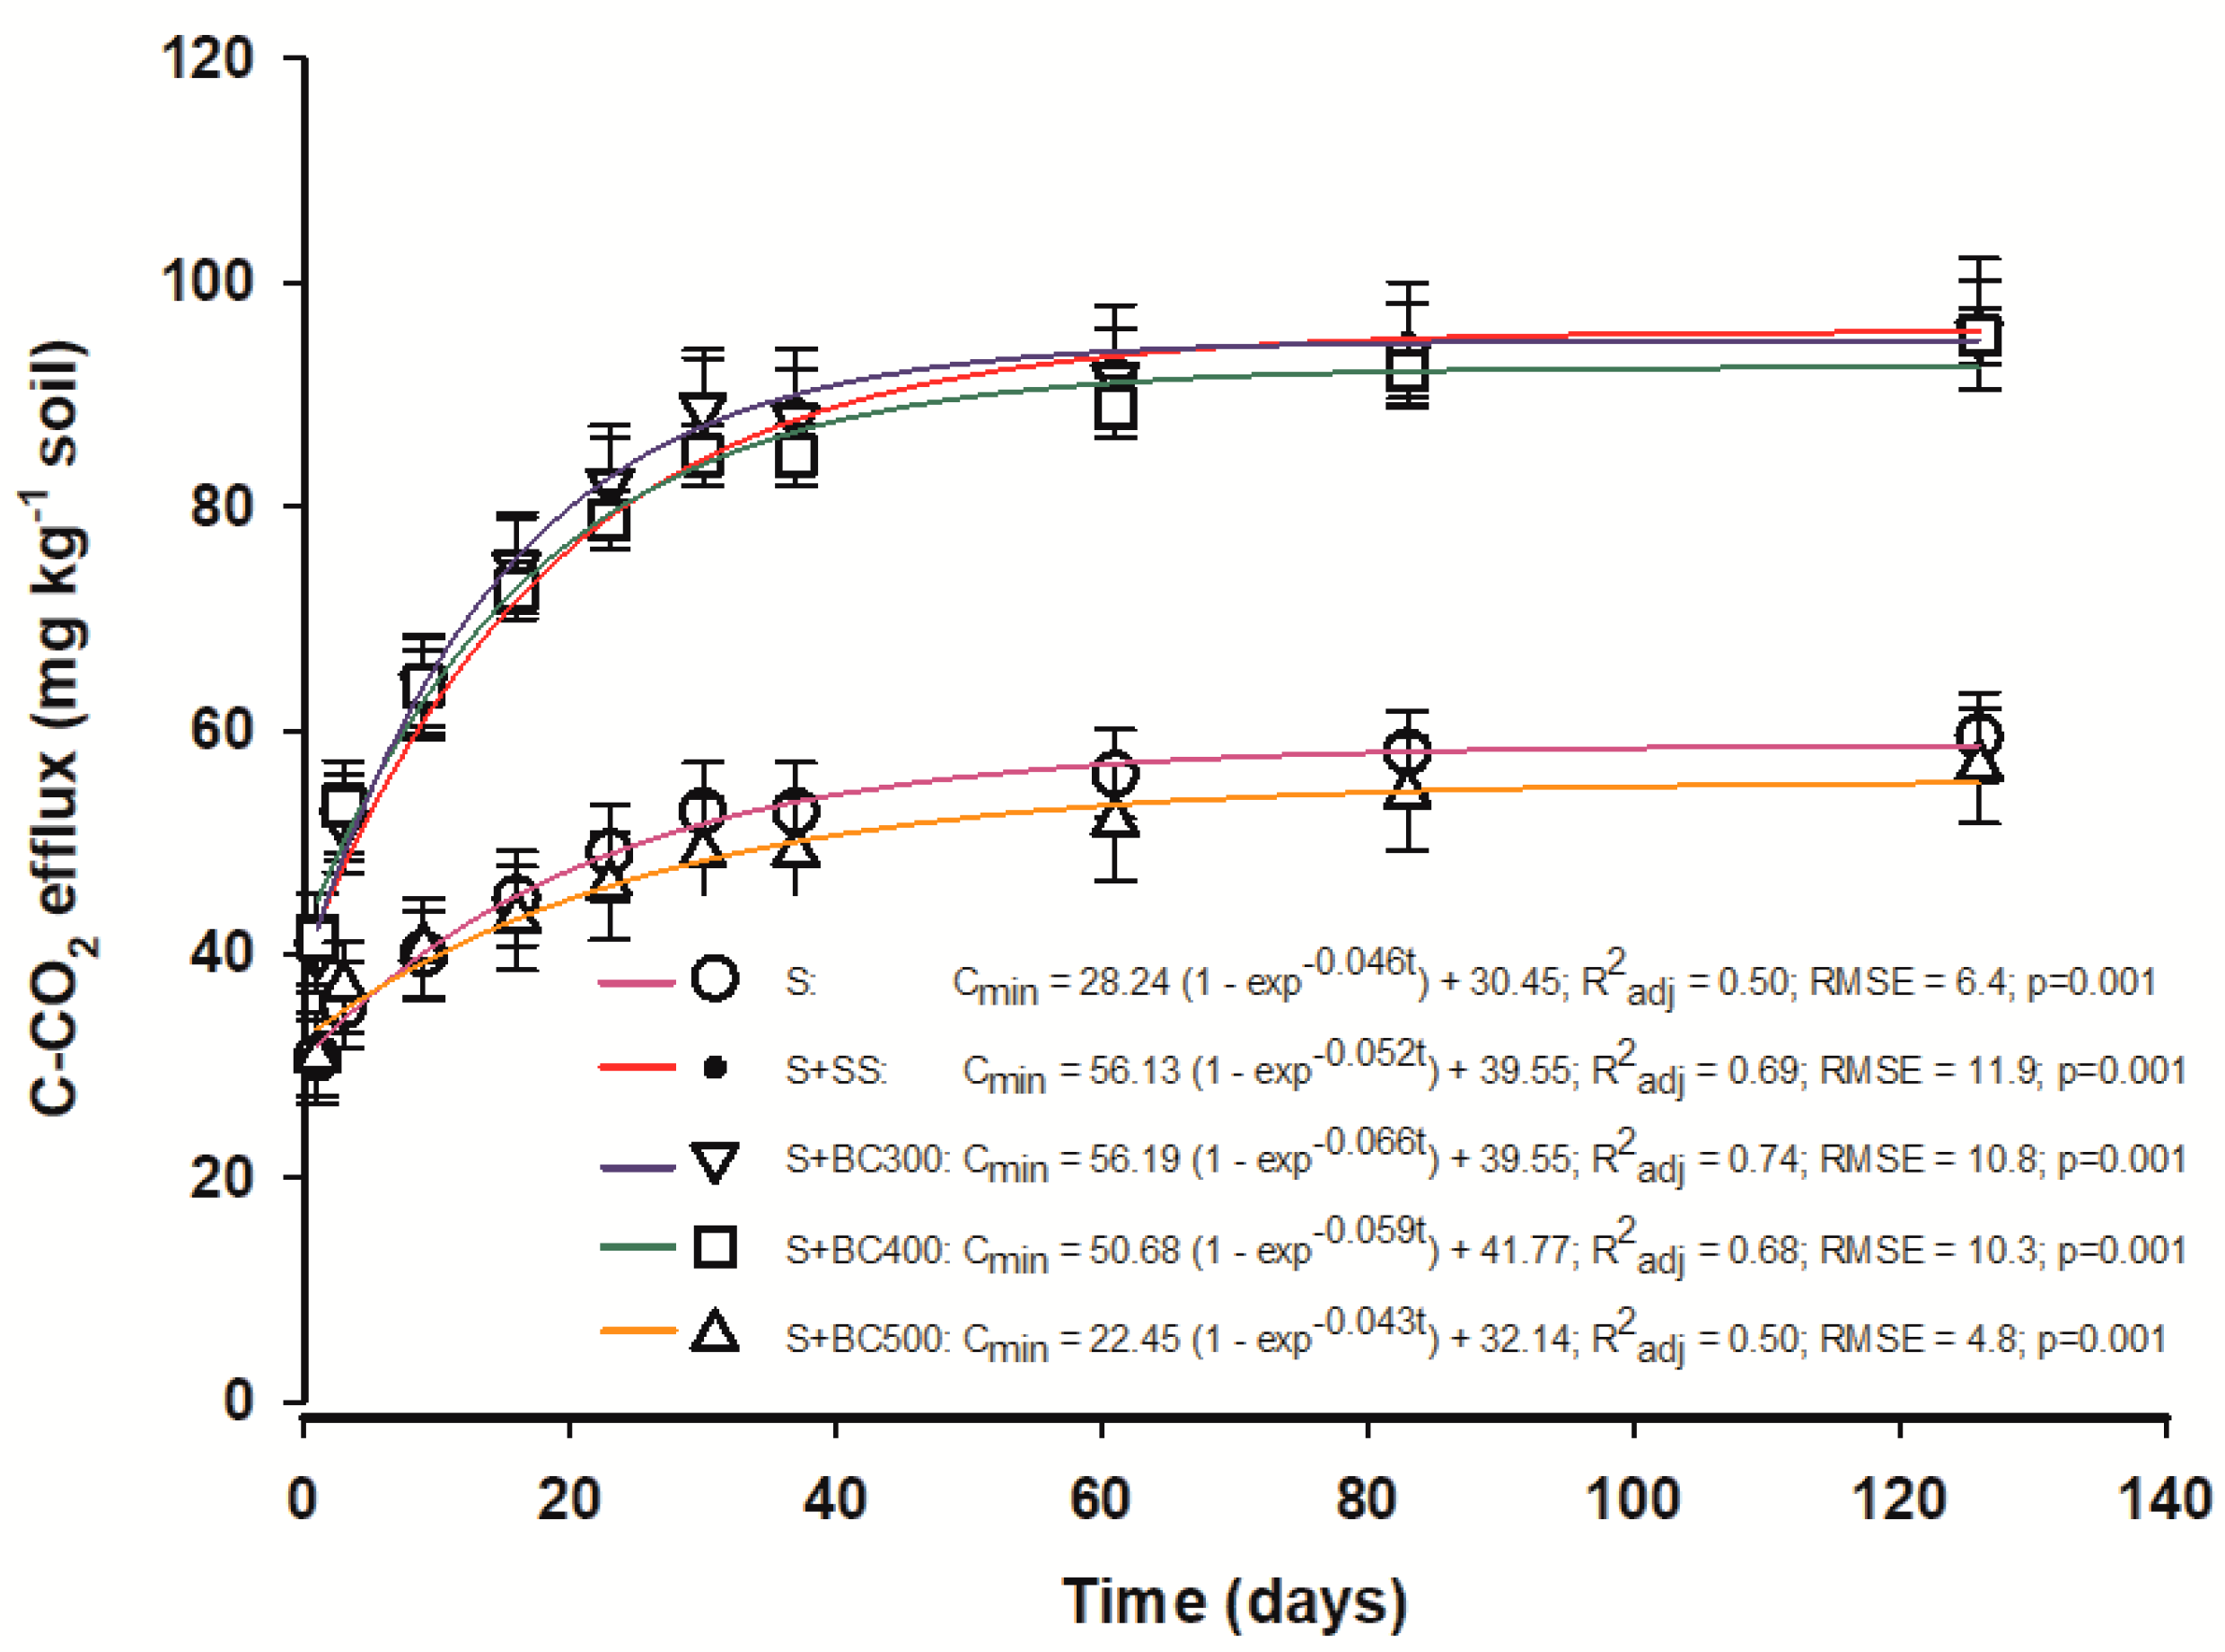
The results from C-CO2 efflux from the different biochars, SS, and the control (S) are presented in Figure 2. The E-first order model presented high R2 values indicating adequate adjustment (model fit) to describe the dynamics of C mineralization from the biochars. Additionally, the kinetics of C-CO2 evolution from soil amended with BC300 was well fit to this model with a determination coefficient of 0.74 (Figure 2).
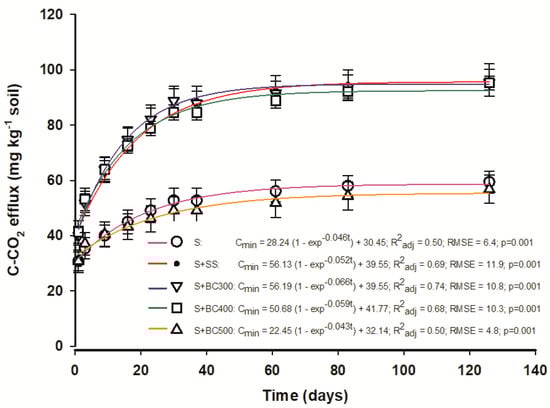
Figure 2.
Kinetics of the E-first order model describing C-CO2 efflux (C mineralization) from soil and sewage sludge (S + SS), soil and sewage sludge-derived biochars produced under different pyrolysis temperatures of 300 °C (S + BC300), 400 °C (S + BC400), and 500 °C (S + BC500) and soil (S) as the control.
Microbial activity was higher in the first 20 to 25 days after the beginning of the incubation period and decreased over time. The higher mineralization at the beginning may be attributed to the available readily oxidizable organic C, found in the biochars produced at temperatures lower than 500 °C [20]; C-CO2 effluxes are positively correlated to SS labile fractions [41]. Once this fraction is depleted, C-CO2 effluxes are maintained constant. In general, C-CO2 effluxes were higher when the soil was mixed with biochars produced at lower temperatures (BC300 and BC400) and with SS, where there was a stimulus to C mineralization, particularly during the initial incubation phase. Differently, the biochar produced at a higher temperature (BC500) produced a similar C-CO2 efflux from the control, showing the low capacity of degradation of this biochar.
In a study by Zavalloni et al. [42], the C-CO2 effluxes were also similar between the control (S) and the soil mixed with the biochar (hardwood-derived) produced at a higher temperature (500 °C). Therefore, our results show that the SS biochar (produced at 500 °C) application to soil and agricultural systems is a strategy to mitigate C-CO2 emissions from soil, in contrast with the direct application of SS or low-temperature-derived biochars. Although BC500 did not alter the microbial activity, changes in the microbial composition may occur, as suggested by Thies and Rillig [43]. Microorganisms that colonize fresh biochars, which contain more volatile post-pyrolysis compounds on their surfaces, differ from those microorganisms that colonize it afterward when these compounds have been metabolized [43]. Therefore, future studies should focus on evaluating these different microorganisms involved in the degradation of biochar with time. Such studies are important to achieve a better understanding of the effects of adding different feedstock-biochars to various soil types and their interactions with plant growth.
The kinetic model shows two types of behavior: one containing a labile phase and the other a more stable phase. The chemical character of the two sets are the following: (1) an aliphatic portion found mainly in the outer surfaces of particles and that occurs in higher amounts in biochars produced under lower pyrolysis temperatures, and (2) another portion composed of highly condensed or condensed aromatic structures within protective inner pores, which are more abundant in the biochars produced at higher temperatures [14,39]. These results suggest that, in the long term, the interaction of biochar-soil increases soil C storage through the sorption processes of organic matter and biochar, in addition to physical protection.
The C-CO2 effluxes measured in this study are very similar to those found in previous studies, although they differ in several aspects, such as the type of feedstocks and temperatures used to produce the biochars, the incubation time, and the measurement (technique) used to determine the C-CO2 evolution. Although the C-CO2 soil evolution is usually measured in a time scale of a few months or years, estimates of the long-term stability of biochar are necessary to determine the ability of biochars to sequester C and mitigate global warming [23].
The cumulative C-CO2 effluxes (CCE) are shown in Table 3. Compared to the control (S), the cumulative C-CO2 emissions increased by 60–64% when biochars BC300 and BC400 were applied to the soil and decreased by 6% after the addition of BC500. Among all biochars, total N concentration decreased with increasing pyrolysis temperature (Table 2). This shows that the degradation of these biochars in soil or their priming effect may be N-dependent [44]. It is well known that the pyrolysis process promotes gaseous losses of certain elements such as nitrogen [2].
Table 3.
Cumulative C-CO2 efflux (CCE) from soil amended with sewage sludge and biochar.
3.4. Nitrogen Availability
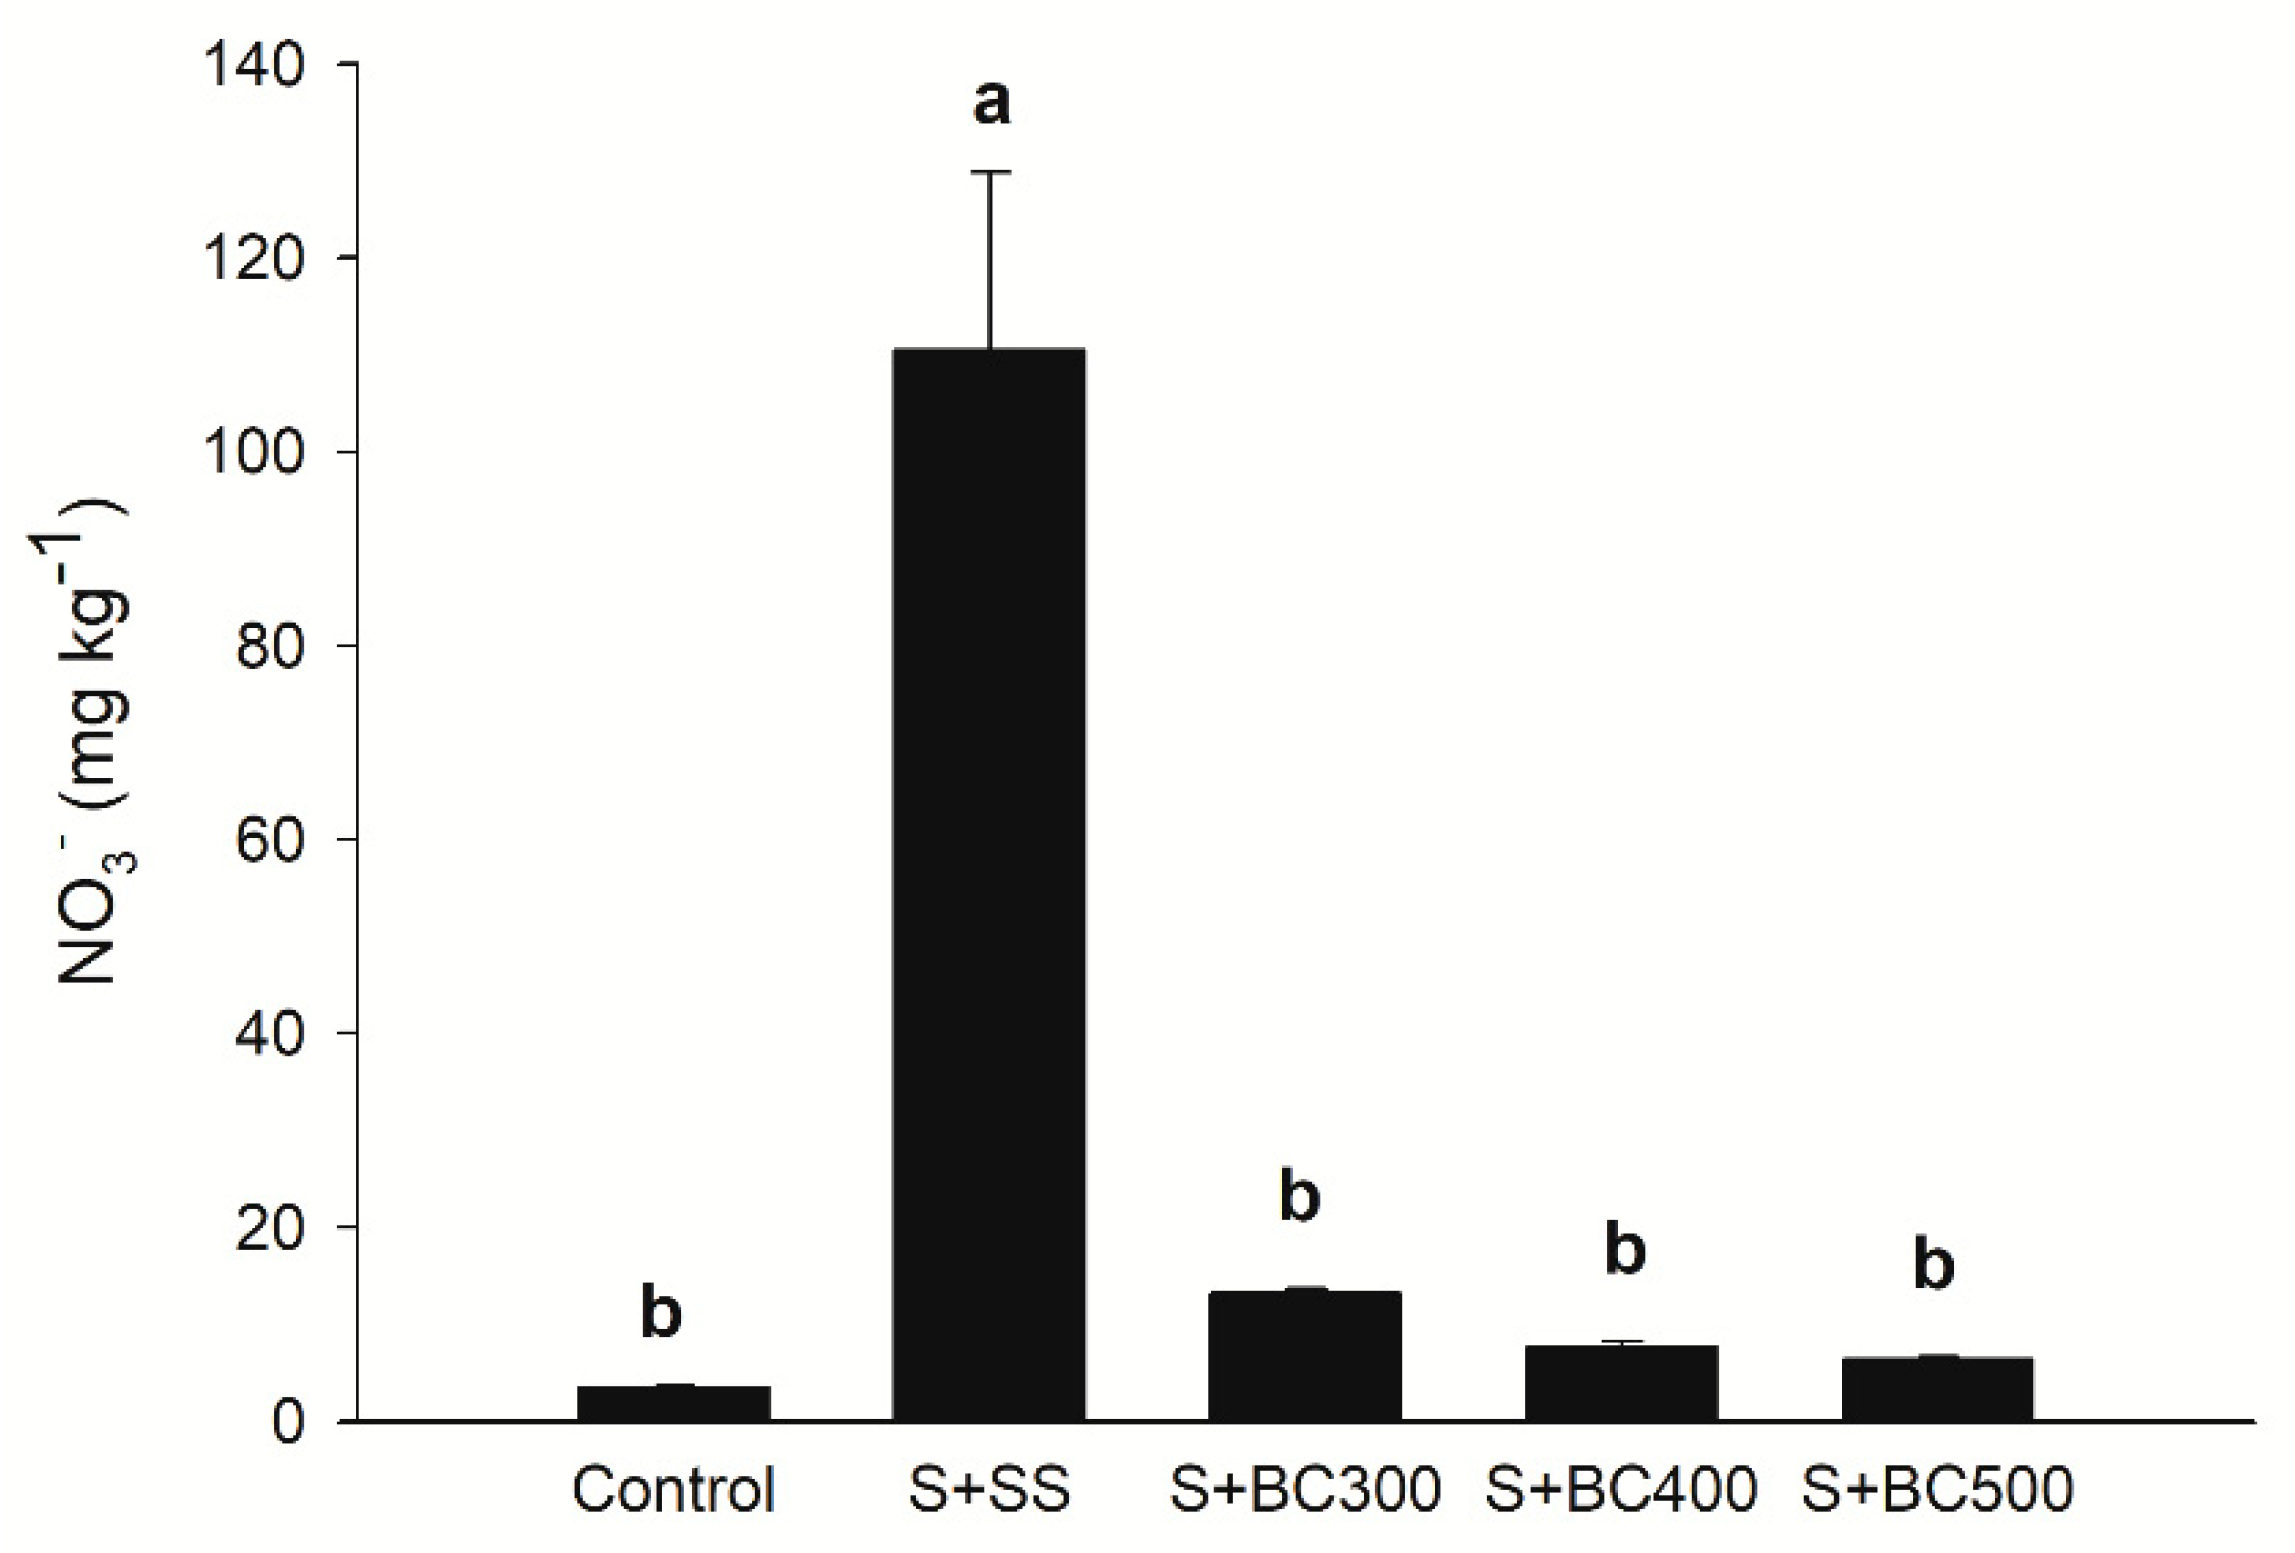
The highest nitrate (N-NO3−) levels were observed in S + SS, whereas the other treatments did not increase N-NO3− in comparison to the control (Figure 3). N-NO3− concentration decreased in the biochars with increasing pyrolysis temperature (Table 2), as a consequence of the volatilization process [2]. Although the application of biochars did not increase N-NO3− levels (available N form), total nitrogen may have not been fully available for plant absorption due to organic binding in recalcitrant compounds [45]. It is believed that biochars have the potential to render nitrates unavailable and decrease its leaching, whereas N fertilizer application to biochars and co-composting of biochars increases N-NO3− availability to plants and microbial activity [46]. Furthermore, Haider et al. [47] suggest that current N-NO3− extraction methods underestimate N-NO3− availability to microbial activity and/or immobilization.
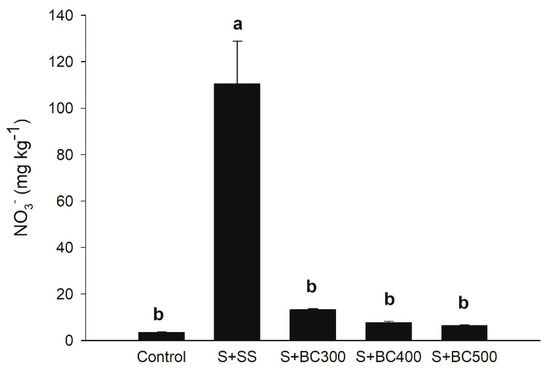
Figure 3.
Soil nitrate (N-NO3−) contents after incubation (127 days) with sewage sludge (S + SS), sewage sludge-derived biochars produced under different pyrolysis temperatures of 300 °C (S + BC300), 400 °C (S + BC400), and 500 °C (S + BC500) and soil (S – control). Means followed by the same letters do not differ by the Tukey test (P < 0.05). Vertical bars represent the standard errors.
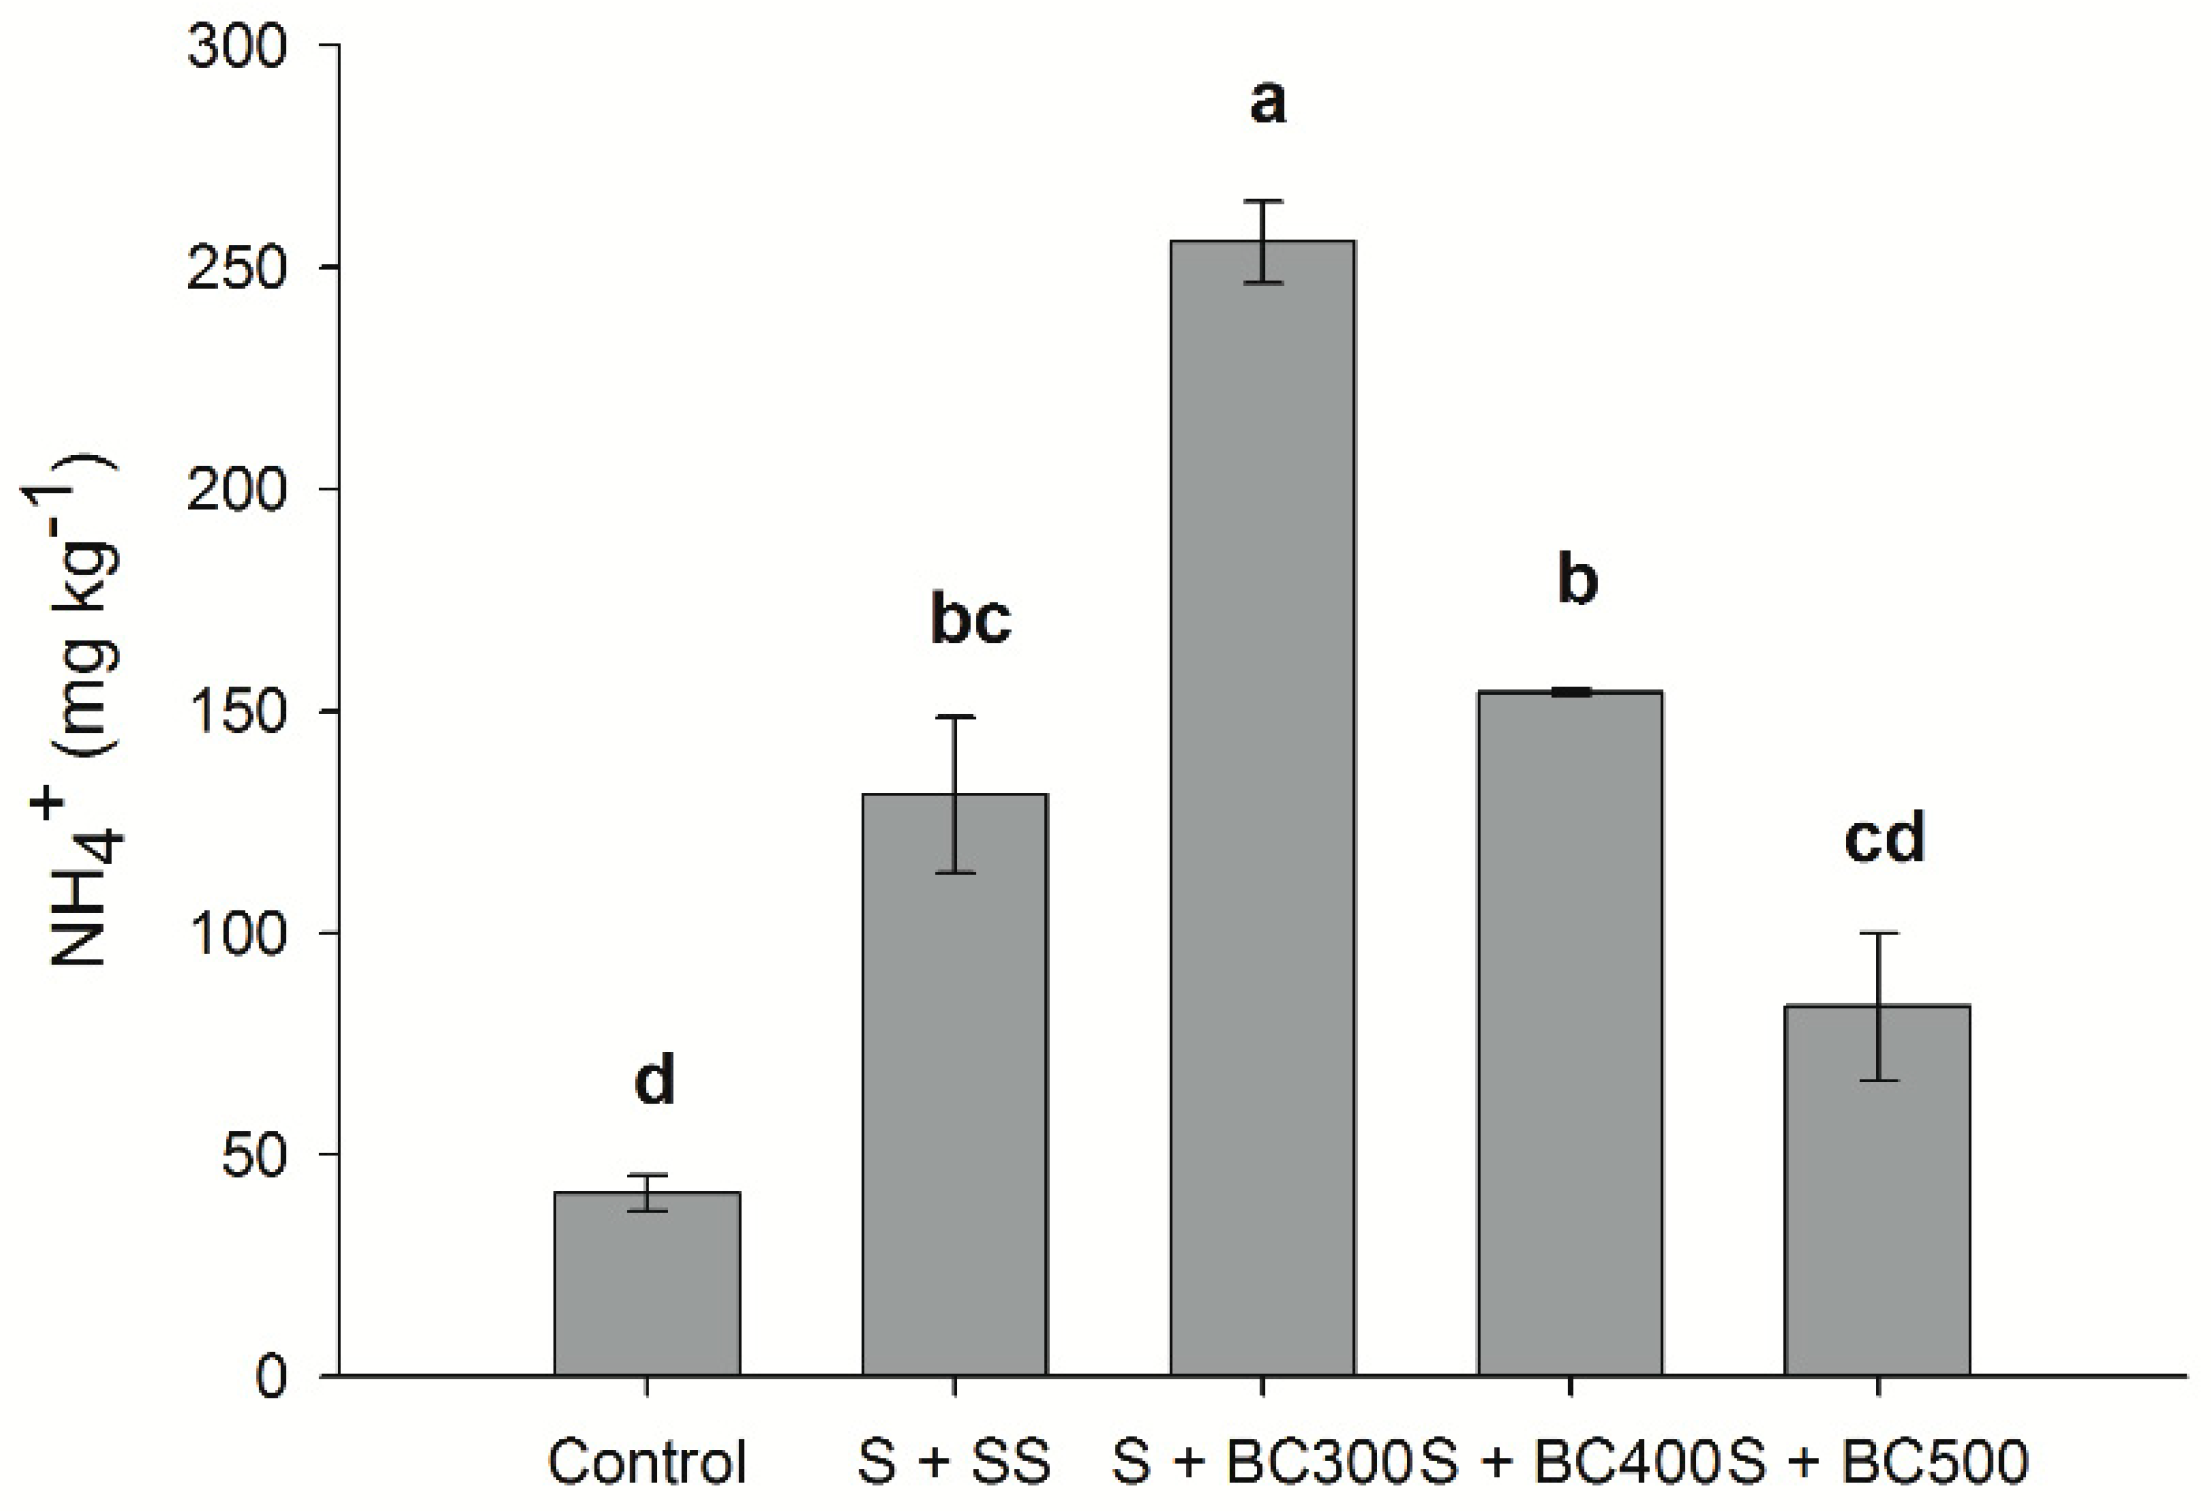
The amount of N-NH4+ in soil was found to be higher than N-NO3− contents, for all treatments. Total N-NH4+ contents were higher for the low temperature biochars, following the decreasing order: S + BC300 > S + BC400 > S + SS > S + BC500 > S (Figure 4). Total N-NH4+ increased approximately 450%, 311%, and 150% when BC300, SS, and BC500 were applied to soil compared to the control (S), respectively (Figure 4). These results indicate that, unlike N-NO3−, biochar is able to supply N-NH4+ to the soil over the short term. Biochar produced at a lower temperature (BC300) had the highest capacity to supply N-NH4+ to soil compared to BC500. N is removed in the forms of N-NH4+ and N-NO3− and through volatile matter containing N during the pyrolysis process [48]. However, with increasing pyrolysis temperatures, N forms are gradually transformed into a pyridine-like structure or converted to more stable compounds, like pyrrole-type N [49]. Similarly to our study, Hossain et al. [50] found that increasing pyrolysis temperatures from 300 °C to 700 °C decreases total N content by 55% due to the volatilization of N during the pyrolysis process. Our results also indicate that the relatively high proportion of N is conserved at lower pyrolysis temperatures; increasing pyrolysis temperature from 300 °C to 500 °C decreased N-NH4+ and N-NO3− contents by approximately 64% and 91% when applied to soil, respectively.
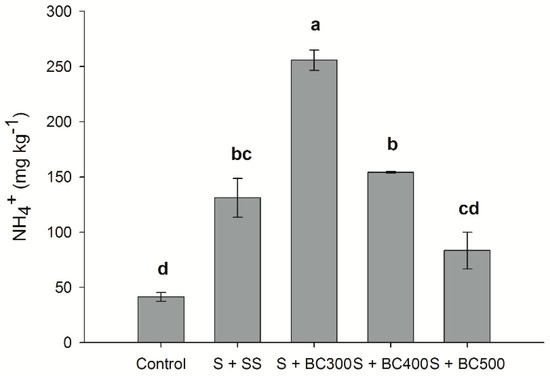
Figure 4.
Soil ammonium (N-NH4+) contents after incubation (127 days) with sewage sludge (S + SS), sewage sludge-derived biochars produced under different pyrolysis temperatures of 300 °C (S + BC300), 400 °C (S + BC400), and 500 °C (S + BC500) and soil (S – control). Means followed by the same letters do not differ by the Tukey test (P < 0.05). Vertical bars represent the standard errors.
Contrasting results regarding the effects of biochar N mineralization may be related to the different feedstocks used to produce the biochars and their impacts on soil microbial biomass C and N. Biochars with low amounts of N and with high C/N ratio may limit N use by microorganisms [13], leading to N-NH4+ microbial immobilization and a decrease of available N-NH4+ in soil [51]. On the other hand, N-rich biochars with a low C/N ratio (e.g., maize and manure-wood-derived biochars) limit C use by microorganisms, leading to soil N mineralization and an increase of available N-NH4+ [52,53].
Biochars produced at lower temperatures may contain significant amounts of labile C, which can be promptly used by soil microorganisms [54]. However, these biochars, when added to soil, may, in a short-term period, result in soil available-N microbial immobilization. As such, Bruun et al. [23] showed that wheat straw-derived biochar produced under rapid pyrolysis (low residence time) results in biochar containing more labile hydrogenated C fractions, leading to N immobilization by soil microorganisms in an incubation experiment of 65 days. The opposite behavior is observed when the biochar is produced under slower pyrolysis conditions, leading to N mineralization. Therefore, further studies on N mineralization from biochars should consider other relevant pyrolysis variables, such as heating rate and residence time.
Therefore, biochars may release N to soil depending on their derived feedstock, N-containing compounds and recalcitrance, C/N ratio, and on edaphoclimatic conditions. This could be better elucidated by investigating the dynamics of N from biochars and/or N fertilizers using the labeled 15N techniques and observing if higher N mineralization rates occur in the long or short-term. Such understanding would be important to couple the N mineralization rate from biochars and/or SOM and N-fertilizer application.
3.5. Relationship between C Mineralization and Available N in Soil Amended with Biochar
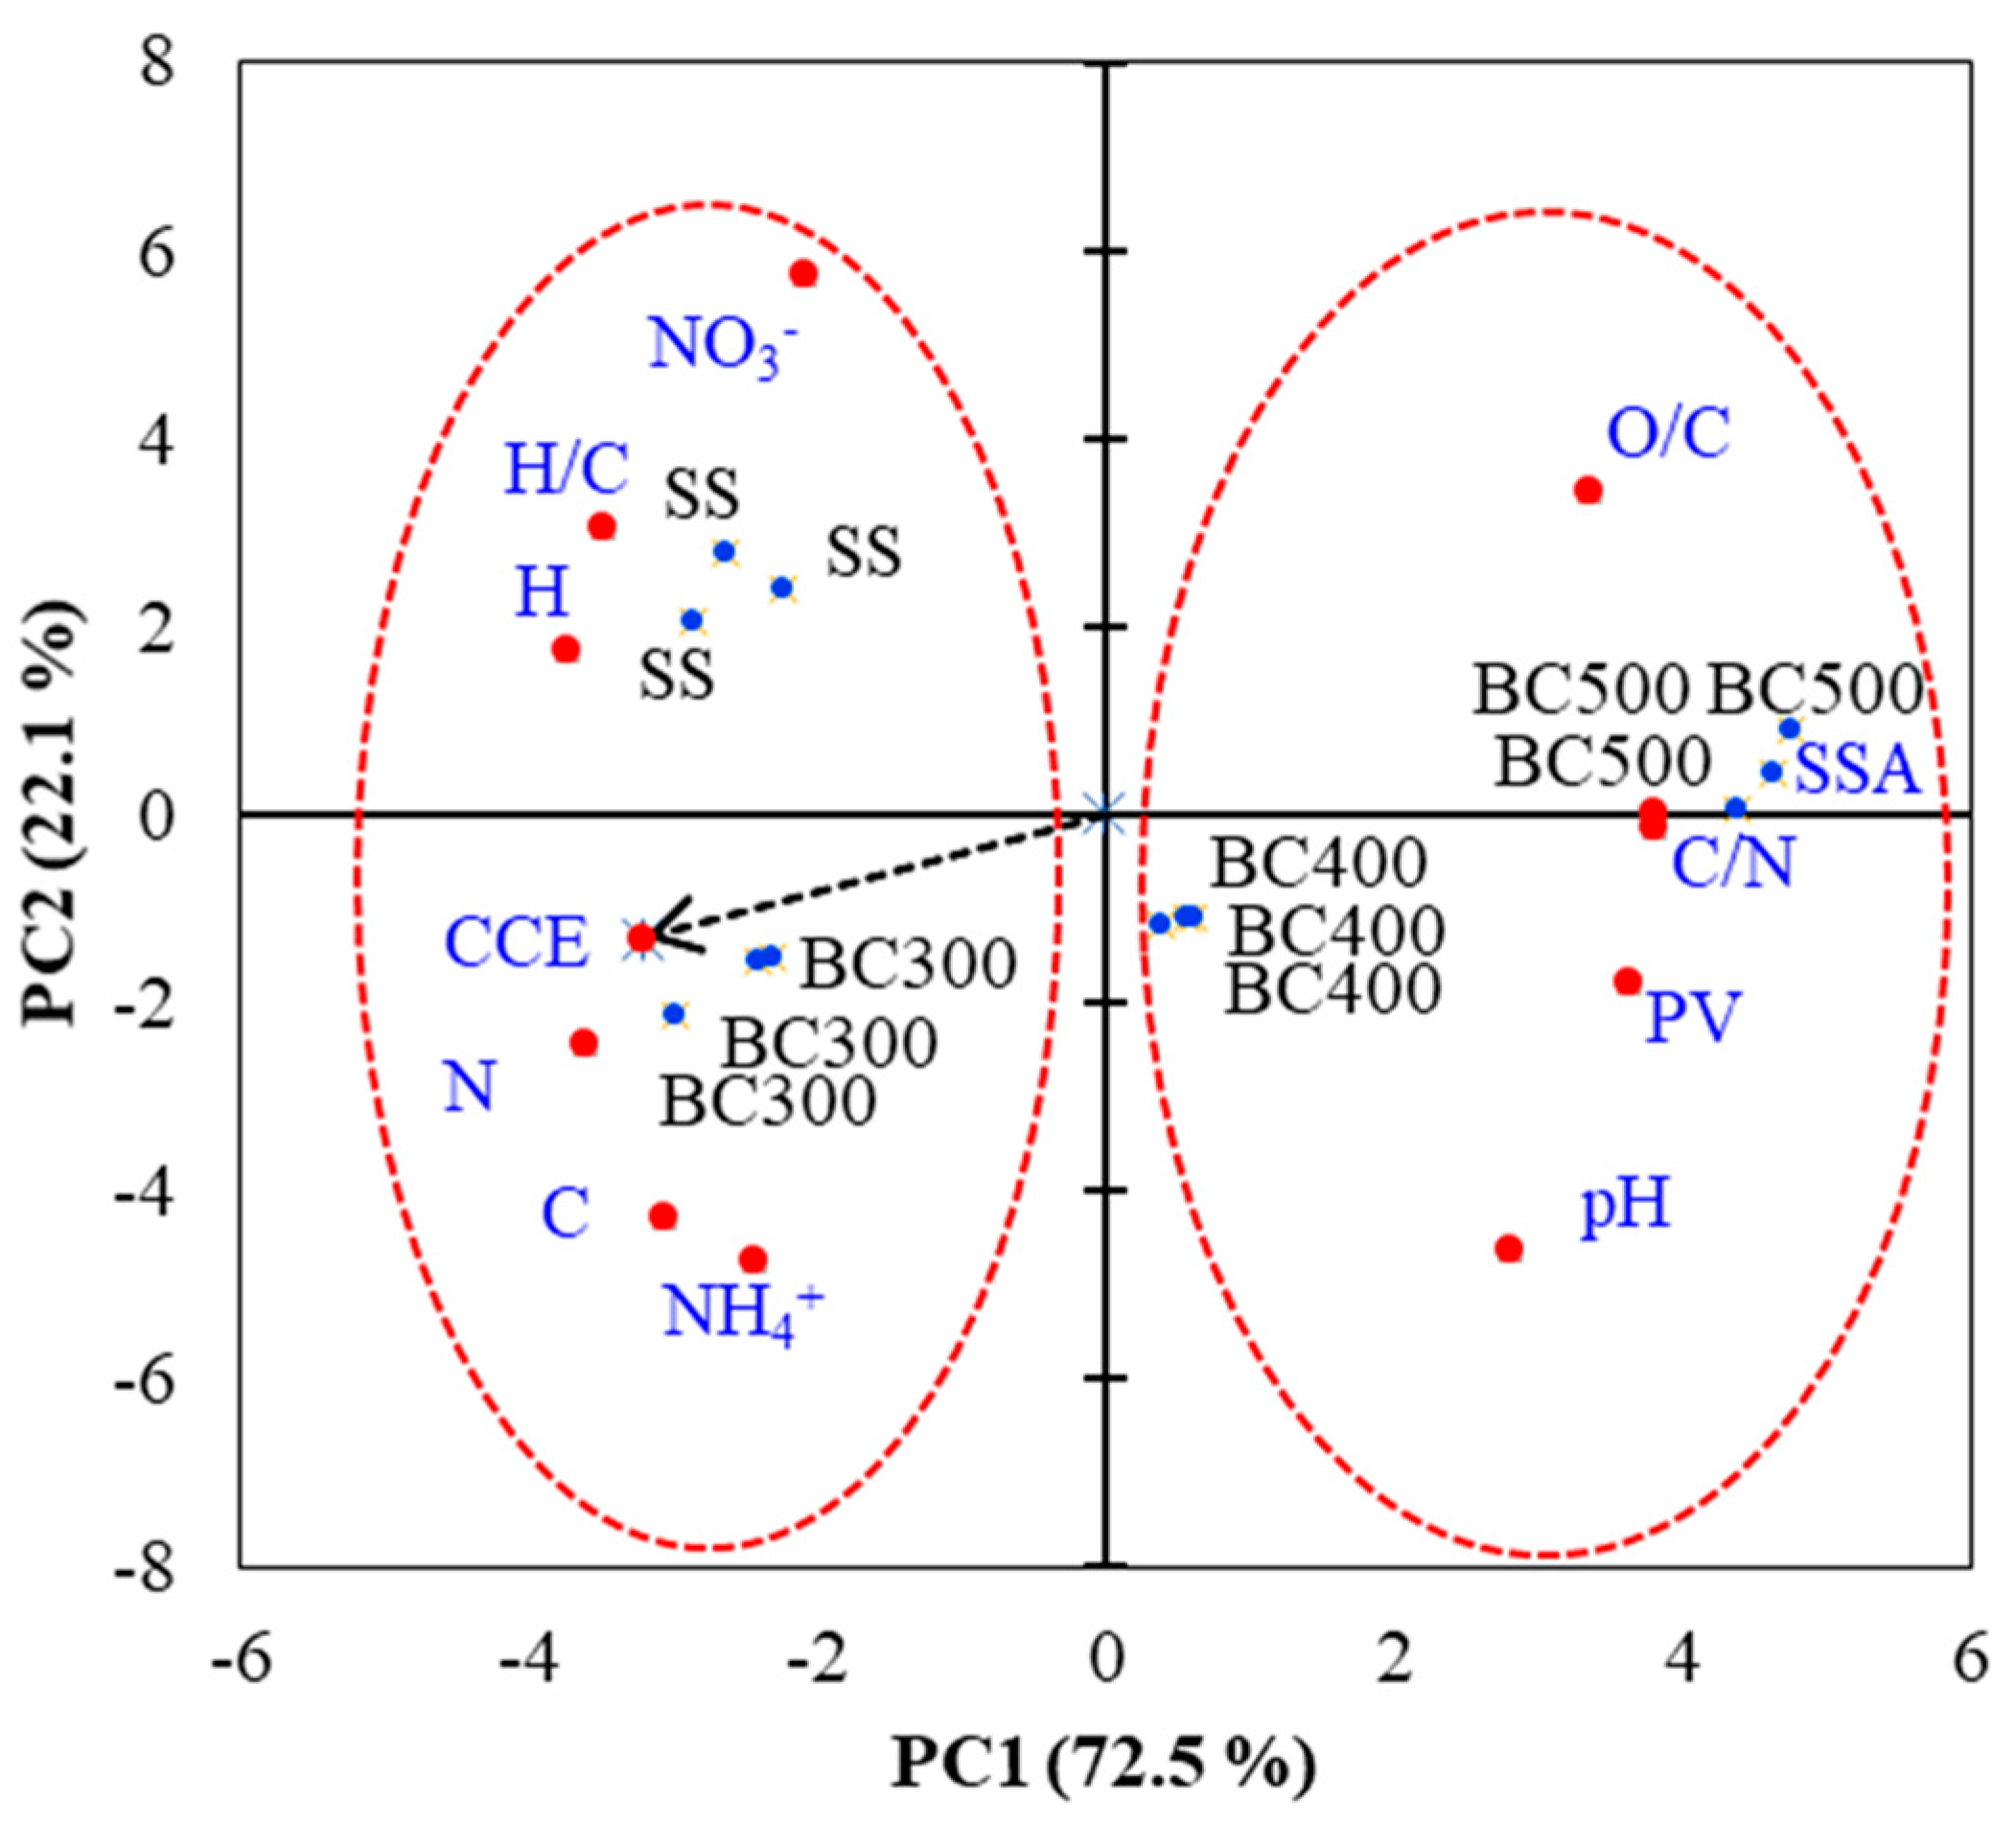
A principal component analysis (PCA) was conducted to determine the relationships between the SS physicochemical properties and the SS-derived biochar’s CCE and N-NO3−, N-NH4+ contents after applying it to soil. The following properties were used for PCA: total C (C) and total N (N), H, C/N ratio, H/C ratio, pH, N-NO3−, N-NH4+, specific surface area (SSA), pore volume (PV), and CCE (Figure 5). In general, along the first PC axis (PC1), a clear separation between two groups was observed: SS and BC300 (group 1) and BC400 and BC500 (group 2), as indicated in Figure 5. By means of PCA, it was possible to demonstrate that the higher values of CCE presented by the SS and the SS-derived biochar produced at 300 °C (BC300) were related to their following properties: N, C, H, and H/C ratio. Therefore, these materials increased soil N-NO3− and N-NH4+ availability compared to BC400 and BC500. On the other hand, increasing pyrolysis temperatures were associated with losses of organic matter and N, a decrease of H/C, and higher pH, C/N, PV, and SSA. Thus, BC400 and BC500, after 127 days of incubation, showed low soil N (NO3−, NH4+) availability. In general, the greatest contrast (highest PC1 score variations) was observed among SS and BC300 compared to BC500.
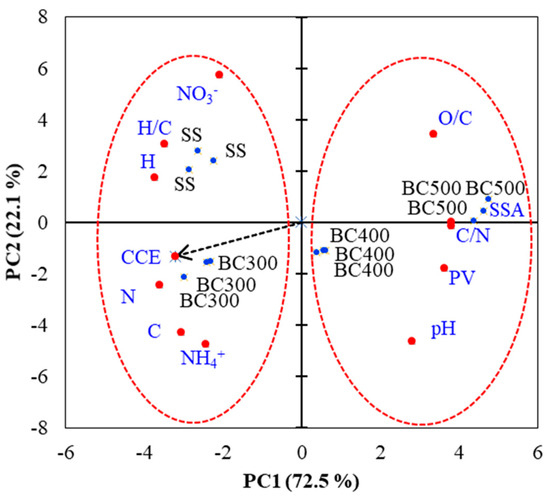
Figure 5.
Principal Component Analysis (PCA) ordination diagrams from the scores of soils with sewage sludge (SS) and with SS-derived biochars produced under different pyrolysis temperatures of 300 °C (BC300), 400 °C (BC400), and 500 °C (BC500). CCE: Cumulative C-CO2 efflux.
Overall, multivariate analysis (PCA) enabled a combined evaluation of all the studied variables, thus showing the properties of SS-derived biochars that were mostly influenced at different pyrolysis temperatures. Among such properties, five variables presented a correlation coefficient higher than 0.9 with PC1 (Table 4). Total N, C/N, H, PV, and SSA were the variables that were mostly affected by the increase in pyrolysis temperature. Therefore, these properties were the ones underpinning the changes in CCE and N availability observed when different materials were added to the soil. Our work can provide guidance to select the most appropriate pyrolysis temperature and to future studies on SS biochar production for agro-environmental purposes.
Table 4.
Correlation coefficients between the soil with sewage sludge and with biochar sewage sludge-derived biochars variables and the principal components (PC1 and PC2).
4. Conclusions
In general, two distinct behaviors were observed in relation to the dynamics of C mineralization: (1) soil mixed with BC300, BC400, and SS increased mineralization rates, and (2) soil mixed with BC500 resembled the same C mineralization dynamics as the soil alone (control), with low CMR. The first order model was adequate to represent the dynamics of C mineralization in sewage sludge-derived biochar obtained at different pyrolysis temperatures. Pyrolysis temperature strongly influenced soil N availability. The SS and SS-derived biochars properties that mostly influenced soil C mineralization and N availability were N, C/N ratio, H, PV, and SSA. After the incubation period (127 days), BC300 and SS showed very similar behaviors; both increased soil N availability, especially in the N-NH4+ form. Lower pyrolysis temperatures (up to 300 °C) yield biochars that are more capable of releasing soil nutrients to plants in a short-term period. In addition, our results highlight the environmental benefits of using higher pyrolysis-temperature biochars to achieve lower C-CO2 emission from soils. Overall, pyrolysis can increase both carbon sequestration and nutrient availability in soils, depending on the temperature adopted. Our results reinforce the idea that tradeoffs between a number of environmental benefits of biochar exist for different temperatures of pyrolysis.
Author Contributions
All authors contributed to the intellectual input and provided assistance in the study and manuscript preparation. Conceptualization, C.C.d.F.; formal analysis, C.C.d.F., T.N.M., A.T.d.V. and T.R.C.; writing–original draft, C.C.d.F., T.R.C., T.P.L. and J.P.-F.
Funding
This research was funded by Fundação de Pesquisa do Distrito Federal grant number 00193.00002099/2018-65.
Conflicts of Interest
The authors declare no conflict of interest.
References
- Caballero, J.A.; Front, R.; Marcilla, A.; Conesa, J.A. Characterization of sewage sludges by primary and secondary pyrolysis. J. Anal. Appl. Pyrolysis 1997, 40–41, 433–450. [Google Scholar] [CrossRef]
- DeLuca, T.H.; Gundale, M.F.; MacKenzie, M.D.; Gundale, M.J. Bio-char effects on soil nutrient transformation. In Biochar for Environmental Management: Science and Technology; Lehmann, J., Stephen, J., Eds.; Earthscan: London, UK, 2009; pp. 251–270. [Google Scholar] [CrossRef]
- Figueiredo, C.C.; Chagas, J.K.M.; Silva, J.; Paz-Ferreiro, J. Short-term effects of a sewage sludge biochar amendment on total and available heavy metal content of a tropical soil. Geoderma 2019, 344, 31–39. [Google Scholar] [CrossRef]
- Bachmann, H.J.; Bucheli, T.D.; Dieguez-Alonso, A.; Fabbri, D.; Knicker, H.; Schmidt, H.P.; Ulbricht, A.; Becker, R.; Buscaroli, A.; Buerge, D.; et al. Toward the standardization of biochar analysis: The cost action TD1107 interlaboratory comparison. J. Agric. Food Chem. 2016, 64, 513–527. [Google Scholar] [CrossRef]
- Paz-Ferreiro, J.; Nieto, A.; Méndez, A.; Askeland, M.; Gascó, G. Biochar from biosolids pyrolysis: A review. Int. J. Environ. Res. Public Health 2018, 15, 956. [Google Scholar] [CrossRef]
- Sousa, A.A.T.C.; Figueiredo, C.C. Sewage sludge biochar: Effects on soil fertility and growth of radish. Biol. Agric. Hortic. 2016, 32, 127–138. [Google Scholar] [CrossRef]
- Faria, W.M.; Figueiredo, C.C.; Coser, T.R.; Vale, A.T.; Schneider, B.G. Is sewage sludge biochar capable of replacing inorganic fertilizers for corn production? Evidence from a two-year field experiment. Arch. Agron. Soil Sci. 2018, 64, 505–519. [Google Scholar] [CrossRef]
- Aguilar-Chávez, Á.; Díaz-Rojas, M.; del Rosario Cárdenas-Aquino, M.; Dendooven, L.; Luna-Guido, M. Greenhouse gas emissions from a wastewater sludge-amended soil cultivated with wheat (Triticum spp. L.) as affected by different application rates of charcoal. Soil Biol. Biochem. 2012, 52, 90–95. [Google Scholar] [CrossRef]
- Grutzmacher, P.; Puga, A.P.; Bibar, M.P.S.; Coscione, A.R.; Packer, A.P.; de Andrade, C.A. Carbon stability and mitigation of fertilizer induced N2O emissions in soil amended with biochar. Sci. Total Environ. 2018, 625, 1456–1466. [Google Scholar] [CrossRef]
- Woolf, D.; Amonette, J.E.; Street-Perrott, F.A.; Lehmann, J.; Joseph, S. Sustainable biochar to mitigate global climate change. Nat. Commun. 2010, 1, 1–9. [Google Scholar] [CrossRef]
- Spokas, K.A. Review of the stability of biochar in soils: Predictability of O:C molar ratios. Carbon Manag. 2010, 1, 289–303. [Google Scholar] [CrossRef]
- Bird, M.I.; Wynn, J.G.; Saiz, G.; Wurster, C.M.; McBeath, A. The pyrogenic carbon cycle. Annu. Rev. Earth Planet. Sci. 2015, 43, 273–298. [Google Scholar] [CrossRef]
- Bakshi, S.; Banik, C.; Laird, D.A. Quantification and characterization of chemically-and thermally-labile and recalcitrant biochar fractions. Chemosphere 2018, 194, 247–255. [Google Scholar] [CrossRef] [PubMed]
- Zimmerman, A.R. Abiotic and microbial oxidation of laboratory- produced black carbon (biochar). J. Environ. Sci. 2010, 44, 1295–1301. [Google Scholar] [CrossRef]
- Giller, K.E.; Witter, E.; McGrath, S.P. Toxicity of heavy metals to microorganisms and microbial processes in agricultural soils: A review. Soil Biol. Biochem. 1998, 30, 1389–1414. [Google Scholar] [CrossRef]
- Trannin, I.C.D.B.; Siqueira, J.O.; Moreira, F.M.D.S. Biological characteristics indicators of soil quality after two years of application of an industrial biosolid and corn cultivation. Revista Brasileira de Ciência do Solo 2007, 31, 1173–1184. [Google Scholar] [CrossRef]
- Qayyum, M.F.; Steffens, D.; Reisenauer, H.P.; Schubert, S. Kinetics of carbon mineralization of biochars compared with wheat straw in three Soils. J. Environ. Qual. 2012, 41, 1210–1220. [Google Scholar] [CrossRef]
- Figueiredo, C.; Lopes, H.; Coser, T.; Vale, A.; Busato, J.; Aguiar, N.; Novotny, E.; Canellas, L. Influence of pyrolysis temperature on chemical and physical properties of biochar from sewage sludge. Arch. Agron. Soil Sci. 2018, 64, 881–889. [Google Scholar] [CrossRef]
- Calvelo Pereira, R.; Kaal, J.; Camps Arbestain, M.; Pardo Lorenzo, R.; Aitkenhead, W.; Hedley, M.; Macías, F.; Hindmarsh, J.; Maciá-Agulló, J.A. Contribution to characterisation of biochar to estimate the labile fraction of carbon. Org. Geochem. 2011, 42, 1331–1342. [Google Scholar] [CrossRef]
- Méndez, A.; Tarquis, A.M.; Saa-Requejo, A.; Guerrero, F.; Gascó, G. Influence of pyrolysis temperature on composted sewage sludge biochar priming effect in a loamy soil. Chemosphere 2013, 93, 668–676. [Google Scholar] [CrossRef]
- Leng, L.; Xu, X.; Wei, L.; Fan, L.; Huang, H.; Li, J.; Lu, Q.; Li, J.; Zhou, W. Biochar stability assessment by incubation and modelling: Methods, drawbacks and recommendations. Sci. Total Environ. 2019, 664, 11–23. [Google Scholar] [CrossRef]
- Jiang, X.; Denef, K.; Stewart, C.E.; Cotrufo, M.F. Controls and dynamics of biochar decomposition and soil microbial abundance, composition, and carbon use efficiency during long-term biochar-amended soil incubations. Biol. Fertil. Soils 2016, 52, 1–14. [Google Scholar] [CrossRef]
- Bruun, E.W.; Hauggaard-Nielsen, H.; Ibrahim, N.; Egsgaard, H.; Ambus, P.; Jensen, P.A.; Dam-Johansen, K. Influence of fast pyrolysis temperature on biochar labile fraction and short-term carbon loss in a loamy soil. Biomass Bioenergy 2011, 35, 1182–1189. [Google Scholar] [CrossRef]
- Flavel, T.C.; Murphy, D.V. Carbon and nitrogen mineralization rates after application of organic amendments to soil. J. Environ. Qual. 2006, 35, 183–193. [Google Scholar] [CrossRef]
- Soil Survey Staff. Keys to Soil Taxonomy; USDA: Washington, DC, USA, 2004. [Google Scholar]
- IUSS Working Group WRB. World Reference Base for Soil Resources 2014. International Soil Classification System for Naming Soils and Creating Legends for Soil Maps Update 2015; FAO: Rome, Italy, 2015; 192p. [Google Scholar]
- Teixeira, P.C.; Dobagemma, G.K.; Fontana, A.; Teixeira, W.G. Manual de Métodos de Análise do Solo, 3rd ed.; Embrapa: Brasília, Brazil, 2017; 573p. [Google Scholar]
- Reatto, A.; da Silva, E.M.; Bruand, A.; Martins, E.S.; Lima, J.E.F.W. Validity of the centrifuge method for determining the water retention properties of tropical soils. Soil Sci. Soc. Am. J. 2008, 72, 1547–1553. [Google Scholar] [CrossRef]
- Mebius, L.J. A rapid method for the determination of organic carbon in soil. Anal. Chim. Acta 1960, 22, 120–124. [Google Scholar] [CrossRef]
- USEPA. Method 3050B—Acid Digestion of Sediments, Sludges, and Soils. 1996. Available online: https://www.epa.gov/hw-sw846/sw-846-test-method-3050b-acid-digestion-sediments-sludges-and-soils (accessed on 10 October 2018).
- Bremner, J.M. Nitrogen-total. In Methods of Soil Analysis; Sparks, D.L., Page, A.L., Helmke, P.A., Loeppert, R.H., Soltanpour, P.N., Tabatabai, M.A., Johnston, C.T., Sumner, M.E., Eds.; Soil Science Society America Inc.: Madison, WI, USA, 1996; Volume 5, pp. 1085–1121. [Google Scholar]
- Alef, K.; Nannipieri, P. Methods in Applied Soil Microbiology and Biochemistry, 1st ed.; Academic Press: London, UK, 1995; 576p. [Google Scholar]
- Jones, C.A. Estimation of an active fraction of soil nitrogen. Commun. Soil Sci. Plant Anal. 1984, 15, 23–32. [Google Scholar] [CrossRef]
- Little, R.C.; Milliken, G.A.; Stroup, W.W.; Wolfinger, R.D.; Schabenberger, O. SAS System for Mixed Models; SAS Institute: Cary, NC, USA, 1996; 633p. [Google Scholar]
- Addinsoft. XLSTAT: Statistical Software for Microsoft Excel. 2013. Available online: https://www.xlstat.com/en (accessed on 10 December 2018).
- Saviozzi, A.; Levi-Minzi, R.; Riffaldi, R.; Vanni, G. Role of chemical constituents of wheat straw and pig slurry on their decomposition in soil. Biol. Fertil. Soils 1997, 25, 401–406. [Google Scholar] [CrossRef]
- Coppens, F.; Garnier, P.; De Gryze, S.; Merckx, R.; Recous, S. Soil moisture, carbon and nitrogen dynamics following incorporation and surface application of labelled crop residues in soil columns. Eur. J. Soil Sci. 2006, 57, 894–905. [Google Scholar] [CrossRef]
- Anderson, C.R.; Condron, L.M.; Clough, T.J.; Fiers, M.; Stewart, A.; Hill, R.A.; Sherlock, R.R. Biochar induced soil microbial community change: Implications for biogeochemical cycling of carbon, nitrogen and phosphorus. Pedobiologia 2011, 54, 309–320. [Google Scholar] [CrossRef]
- Abdulrazzaq, H.; Jol, H.; Husni, A.; Abu-Bakr, R. Characterization and stabilisation of biochars obtained from empty fruit bunch, wood and rice husk. Bioresources 2014, 9, 2888–2898. [Google Scholar] [CrossRef]
- Maestrini, B.; Nannipieri, P.; Abiven, S. A meta-analysis on pyrogenic organic matter induced priming effect. GCB Bioenergy 2015, 7, 577–590. [Google Scholar] [CrossRef]
- Andrade, C.A.; Oliveira, C.D.; Cerri, C.C. Degradation kinetics of biosolids organic matter after soil application and its relationship with initial chemical composition. Bragantia 2006, 65, 659–668. [Google Scholar] [CrossRef]
- Zavalloni, C.; Alberti, G.; Biasiol, S.; Vedove, G.D.; Fornasier, F.; Liu, J.; Peressotti, A. Microbial mineralization of biochar and wheat straw mixture in soil: A short-term study. Appl. Soil Ecol. 2011, 50, 45–51. [Google Scholar] [CrossRef]
- Thies, J.E.; Rillig, M.C. Characteristics of biochar: Biological properties. In Biochar for Environmental Management: Science and Technology; Lehmann, J., Stephen, J., Eds.; Earthscan: London, UK, 2009; pp. 85–105. [Google Scholar]
- Bai, M.; Wilske, B.; Buegger, F.; Esperschütz, J.; Kammann, C.I.; Eckhardt, C.; Koestler, M.; Kraft, P.; Bach, M.; Frede, H.G.; et al. Degradation kinetics of biochar from pyrolysis and hydrothermal carbonization in temperate soils. Plant Soil 2013, 372, 375–387. [Google Scholar] [CrossRef]
- Chan, K.Y.; Xu, Z. Biochar: Nutrient properties and their enhancement. In Biochar for Environmental Management: Science and Technology; Lehmann, J., Stephen, J., Eds.; Earthscan: London, UK, 2009; pp. 67–84. [Google Scholar]
- Kammann, C.I.; Schmidt, H.P.; Messerschmidt, N.; Linsel, S.; Steffens, D.; Müller, C.; Koyro, H.W.; Conte, P.; Stephen, J. Plant growth improvement mediated by nitrate capture in co-composted biochar. Sci. Rep. 2015, 5, 1–13. [Google Scholar] [CrossRef]
- Haider, G.; Steffens, D.; Müller, C.; Kammann, C.I. Standard extraction methods may underestimate nitrate stocks captured by field-aged biochar. J. Environ. Qual. 2016, 45, 1196–1204. [Google Scholar] [CrossRef]
- Bagreev, A.; Bandosz, T.J.; Locke, D.C. Pore structure and surface chemistry of adsorbents obtained by pyrolysis of sewage sludge-derived fertilizer. Carbon 2001, 39, 1971–1979. [Google Scholar] [CrossRef]
- Novak, J.M.; Lima, I.; Xing, B.; Gaskin, J.W.; Steiner, C.; Das, K.C.; Schomberg, H. Characterization of designer biochar produced at different temperatures and their effects on a loamy sand. Ann. Environ. Sci. 2009, 3, 195–206. [Google Scholar]
- Hossain, M.K.; Strezov, V.; Chan, K.Y.; Ziolkowski, A.; Nelson, P.F. Influence of pyrolysis temperature on production and nutrient properties of wastewater sludge biochar. J. Environ. Manag. 2011, 92, 223–228. [Google Scholar] [CrossRef]
- Schimel, J.P.; Bennett, J. Nitrogen mineralization: Challenges of a changing paradigm. Ecology 2004, 85, 591–602. [Google Scholar] [CrossRef]
- Nelissen, V.; Rütting, T.; Huygens, D.; Staelens, J.; Ruysschaert, G.; Boeckx, P. Maize biochars accelerate short-term soil nitrogen dynamics in a loamy sand soil. Soil Biol. Biochem. 2012, 55, 20–27. [Google Scholar] [CrossRef]
- Wang, T.; Camps-Arbestain, M.; Hedley, M.; Bishop, P. Predicting phosphorus bioavailability from high-ash biochars. Plant Soil 2012, 357, 173–187. [Google Scholar] [CrossRef]
- Smith, J.L.; Collins, H.P.; Bailey, V.L. The effect of young biochar on soil respiration. Soil Biol. Biochem. 2010, 42, 2345–2347. [Google Scholar] [CrossRef]
© 2019 by the authors. Licensee MDPI, Basel, Switzerland. This article is an open access article distributed under the terms and conditions of the Creative Commons Attribution (CC BY) license (http://creativecommons.org/licenses/by/4.0/).