Abstract
A facile and controllable route for fabricating multilayered graphene was provided using CO2 as a carbon source. A typical multilayered graphene structure was obtained with the reaction between CO2 and magnesium metal. The reaction was carried out under different CO2 gas flows, reaction temperatures, and reaction times with two types of metal Mg (Mg powder and Mg ribbon). Moreover, the effect of different concentrations of HCl solution for sample post-processing was discussed in this study. The results of transmission electron microscopy (TEM), energy dispersive spectrometer (EDS), Raman spectroscopy and X-ray powder diffraction (XRD) confirm the formation of multilayered graphene. This work proposed a new method for a controllable way to produce multilayered graphene with gaseous CO2 as a carbon source.
1. Introduction
Graphene, the two-dimensional sp2-hybridized carbon, has undoubtedly become one of the most exciting current topics of research. It is widely considered to have a series of unusual characteristics, especially its thermal conductivity (–3000 Wm−1K−1) and mechanical stiffness (−1060 GPa), which may rival the remarkable in-plane values of graphite [1,2,3,4,5,6,7]. Moreover, their fracture strength should be comparable to that of carbon nanotubes for similar types of defects [8]. In addition, some studies have shown that individual graphene sheets have outstanding electronic transport characteristics [9].
Since the monolayer graphene was first obtained by Andre Geim and co-workers using the tape method [10], there has been increasing attention towards methods of such material preparation. The commonly applied methods include the micromechanical or chemical exfoliation of graphite, epitaxial growth on silicon carbide (SiC), chemical vapor deposition (CVD), as well as reduction of graphene oxide (GO) via chemical, electrochemical, thermal, or photocatalytic methods [11,12,13,14,15,16,17,18]. Among the above methods, a major focus of experimental research has been concentrated on the development of low-pollution preparation routes, enabling environmentally friendly production. More and more reports involve graphene preparation with a particular emphasis on a low energy cost and less pollution. For example, Sierra et al. [19] developed a method consuming less energy by introducing pregraphitic materials, new alternatives to graphite, for producing graphene, which exhibited similar characteristics to those obtained from graphite, but with less energy consumption as their production required lower temperatures (not higher than 1100 °C). After that, Lian and co-workers [20] reported a facile and mild route to synthesize free-standing and monolithic 3D functionalized graphene with biomass source-glucose as the carbon source, which is environmentally benign and low cost. In summary, much progress has been made on graphene preparation with an environmentally friendly and low resource-consuming route.
At present, carbon dioxide, mainly generated by fuel combustion, is the major gas blamed for causing the greenhouse effect. Nevertheless, stopping fuel combustion completely may not be achieved in the short-term. Therefore, rational utilization of carbon dioxide in the atmosphere is quite real and is of great importance. If it can be used as a carbon source for products with high value, it can not only reduce CO2 emissions, but also obtain materials with high value. Some researchers have already worked on exploiting CO2 for high-value products, such as carbon fibers [21], lithium battery [22], and formic acid [23]. Among them, Chakrabarti et al. [24] produced multilayered graphene with carbon dioxide, which has achieved much attention.
Multilayered graphene, which can be produced on a large scale, shows excellent performance, especially on thermal conductivity and mechanical stiffness [25,26,27,28]. It is widely used in sensors [29], electrodes [30,31], and other areas [32,33]. For example, Johnson et al. reported a fabrication method for hydrogen sensing using a multilayered graphene, which opened up the possibility of using multilayered graphene in molecular sensing applications [29]. Mohanty et al. used multilayered graphene to prepare electrodes by using in-situ exfoliation of graphite, considering that multilayered graphene is easier to be obtained at a large scale by exfoliation methods than graphene monolayer [31]. Qiao et al. demonstrated an epidermal electronic skin with good sensitivity and stability based on multilayered graphene [33]. In summary, multilayered graphene has indispensable applications in many fields and to some extent, it is superior to the graphene monolayer.
As Chakrabarti reported, multilayered graphene was produced with magnesium metal and carbon dioxide, following Equation (1):
2Mg(s) + CO2(g) → 2MgO(s) + C(s).
The multilayered graphene produced was cost effective and high in yield. It proved that carbon dioxide can be used as a carbon source to produce high-value graphene, which provided an alternative route to utilize carbon dioxide.
Based on their work, in this study, a controllable route for fabricating multilayered graphene by using gaseous CO2 as a feed gas was presented and a multilayered graphene was produced in a high-temperature tubular resistance furnace with Mg and CO2. Gaseous CO2 is easily obtained, like the exhaust from power stations [34]. Moreover, it does not require high pressure and low temperature during its preparation process like dry ice. Meanwhile, gaseous CO2 is more controllable for monitoring its velocity during the reaction process. Due to this, gaseous CO2 was used in this study. In order to strictly control the amount and velocity of CO2 in the reaction process, a gas flow meter was obtained in a CO2 piping system. Thus, it can not only control the extent of reaction accurately, but also effectively monitor the amount of CO2 consumed. This method was considered to be more convenient for large-scale production.
2. Materials and Methods
2.1. Materials
2.1.1. Raw Materials
The following raw materials were used as supplied: Mg ribbon (99%, 5 mm in width, 1 mm thickness) and Mg powder (99%), ethanol (95%), and HCl (36%) from Sinopharm Chemical Reagent Co. (Taiyuan, Shanxi, China). The alumina combustion boat (100 × 15 × 10mm) was from Wuxi Dalmon Technology Co. (Wuxi, Jiangsu, China).
2.1.2. Experiment Equipment
A high-temperature tubular resistance furnace (0–1300 °C) was purchased from Taisite Instrument Co. (Tianjin, China). A glass rotameter (0–1000 mL/min) was purchased from Yinhuan flow meter Co. (Yuyao, Zhejiang). A centrifuge (0–5000 rpm/min) was purchased from Kaida Instrument Co. (Changsha, Hunan, China). A vacuum drying oven was purchased from Kewei Instrument Co. (Beijing, China). A ultrasonic cleaner (KQ2200E) was purchased from Kun Shan Ultrasonic Instruments Co. (Kunshan, Jiangsu, China) with an operating frequency of 40 kHz and a power of 100 W. Transmission electron microscopy (TEM) was performed with a JSM 2100 high-resolution transmission electron microscope (JEOL, Kyoto, Japan). An energy dispersive spectrometer (EDS) was performed with JSM 2100 high-resolution transmission electron microscopy (JEOL, Kyoto, Japan) with a beam acceleration voltage of 200.0 kV. The X-ray powder diffraction (XRD) analysis was recorded with a Rigaku D/max-2500 diffractometer (Germany), with the Cu Kα radiation. The angle (2θ) was from 5° to 60° in 0.02° steps with a scanning rate of 4°/min. The Raman spectra was recorded on a LabRam HR800 (Horiba Jobin-Yvon, Paris, France), with a 514 nm Ar+ laser.
2.2. Pretreatment of Materials
The material (metal Mg) should be pretreated prior to use because the surface of Mg can be easily oxidized to form a layer of dense MgO layer in the air. In addition, MgO is difficult to be removed from the surface of Mg metal due to its high melting point (2850 °C). To observe the effect of different contact forms between Mg and CO2 interfaces on the reaction, Mg ribbon, and Mg powder, two types of metal Mg, were used. First, 3 g of Mg ribbon, with a width of 5 mm and a thickness of 1 mm, wrapped with an extremely thin oxide coat was polished with fine abrasive paper until it appeared brilliant white. Subsequently, the polished Mg ribbon was immersed into a beaker containing 100 mL of 1.0 M HCl for 2 min at room temperature to remove the rest metal oxides on the surface. After that, the Mg ribbon was rinsed with deionized water and ethanol and dried in a nitrogen flow at room temperature. Thus, the pretreated Mg ribbon can be used as a raw material.
Mg powder was first screened with an 80-meshes sieve and Mg powder with diameter below 0.2 mm was obtained. Then 3 g Mg powder was immersed into a beaker with ethanol solution and the beaker was placed in ultrasonic cleaner with an operating frequency of 40 kHz and a power of 100 W for 5 min in order to clear up the surface impurity of Mg powder. Subsequently, the Mg was transferred into a beaker containing 100 mL of 1.0 M HCl for 2 min to remove the oxide scales at room temperature, then rinsed with deionized water and ethanol, and dried in a nitrogen flow at room temperature. Thus, the pretreated Mg powder can be used as raw material.
2.3. Synthesis of Multilayered Graphene
2.3.1. Synthesis Process
The Mg ribbon, pretreated as above, was first settled in the quartz tube of a high-temperature tubular resistance furnace with a quartz combustion boat. In order to make sure that no oxygen existed in the furnace, a 30-min vacuum-pumping was done before CO2 (99.99%) atmosphere was given. After that, CO2 was injected into the furnace at a certain speed (20 mL/min to 120 mL/min) to ensure that enough CO2 filled the furnace at room temperature and atmospheric pressure. Note that the injected CO2 cannot react with Mg at room temperature, so there is no graphene produced under such conditions. Meanwhile, the tubular furnace was heated to the desired reaction temperature (600–1200 °C) by a temperature program. First, the tube furnace was heated from room temperature to the desired reaction temperature at a heating rate of 10 °C min−1 and kept for 30 min. Then, the reaction finished and the tube furnace was cooled down to room temperature. A constant CO2 flow was provided at a normal pressure during the whole reaction process. The reaction of the Mg powder was the same as the Mg ribbon.
After the reaction finished, the products were collected for post-processing to remove the oxidation product (MgO) and the remaining metal Mg that had not reacted. First, the samples were transferred to the solution of HCl (with a range of concentrations of 0.5 M, 1.0 M, and 2.0 M) and stirred at room temperature for 10 h. After that, the product was separated by centrifuge at 4500 rpm for 3 min, then deposited in deionized water accompanied by the ultrasonic field and washed with ethanol. At last, the as-prepared product was dried in the vacuum drying oven at 80 °C for 10 h.
2.3.2. Yield Rate and Yield of Multilayered Graphene
The yield rate of multilayered graphene can be calculated with the following formula:
where Y is the yield rate of multilayered graphene (%); m1 is the actual output mass of multilayered graphene for per gram Mg (mg/g Mg); m2 is the theoretical output mass of multilayered graphene for per gram Mg (mg/g Mg). The yield here equals to m1.
2.3.3. Conversion between the Amount of Substance and Velocity of CO2
The conversion between the amount of substance and the velocity of CO2 can be calculated with the following formula:
where n is the amount of substance of CO2 (mol); M is relative molecular mass of CO2 (44.01); ρ is the density of CO2 (1.7738 kg/m3, 300 K, 100 kPa); v is the velocity of CO2 atmosphere (mL/min); t is the reaction time (min).
3. Results
3.1. Mg Ribbon and Mg Powder
Figure 1 shows the microstructure of the Mg ribbon and powder. Figure 1a,b show the microstructure of Mg ribbon, and Figure 1c,d show that of Mg powder. From Figure 1a, it can be observed that a compact Mg layer presented with a regular distribution. Mg particles in Figure 1b connected with each other closely. In Figure 1c, a flower structure is revealed gathering together with the diameter ranging from hundreds of nanometers to several microns. In addition, Figure 1d shows the magnified nanoflower structure clearly.
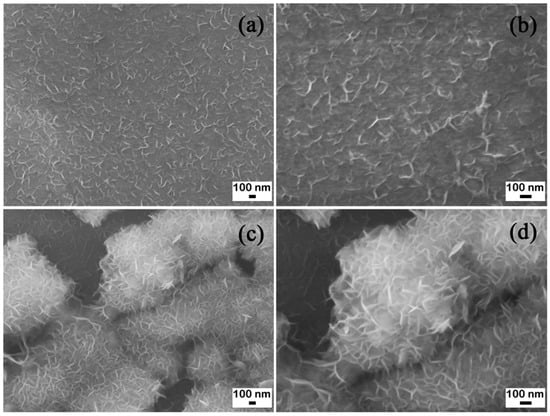
Figure 1.
Scanning electron microscope (SEM) images of the Mg ribbon and Mg powder. (a) and (b) Mg ribbon; (c) and (d) Mg powder.
Therefore, it can be obviously seen that the structure of Mg powder was more looser than that of the Mg ribbon. In this study, the two kinds of metal Mg were used to study the effects of different velocities of CO2 flow, different reaction temperatures, and different reaction times on the reaction of CO2 with Mg.
3.2. Multilayered Graphene under Different Velocities of CO2 Flow
In order to study the effect of different velocities of CO2 flow, a range of velocities of CO2 (20, 40, 60, 80, 100, and 120 mL/min) were used at a reaction temperature of 600 °C with a reaction time of 30 min and 1.0 M HCl solution for sample post-processing. Figure 2 shows the yield of the multilayered graphene prepared from the Mg ribbon and Mg powder under different velocities of CO2, respectively. It can be seen that both Mg ribbon and Mg powder demonstrate a similar trend: the yield increased distinctly with velocity when the velocity of CO2 was below 60 mL/min and it stayed constant with the increase of velocity when the velocity was above 60 mL/min. Therefore, a velocity of 60 mL/min seems to be the optimum condition for multilayered graphene production.
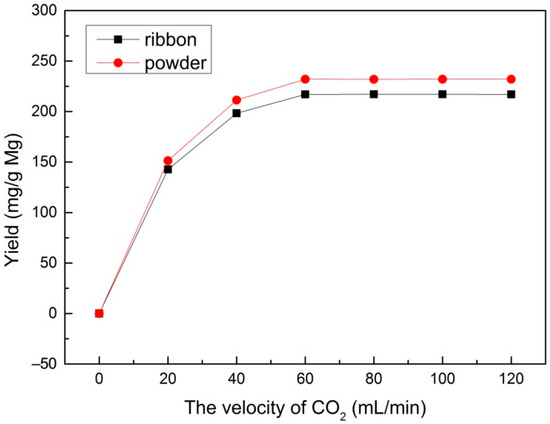
Figure 2.
The yield under different velocities of CO2 prepared with an Mg ribbon and Mg powder.
According to Equation (1), 3 g Mg can react with 6.17 × 10⁻² mol CO2 (51.03 mL/min of CO2 for 30 min, according to Equation (3)). Therefore, the amount of CO2 is not enough to react with metal Mg when the velocity is below 40 mL/min. As the velocity of CO2 increases, excess CO2 can react with Mg adequately. Thus, the yield remains steady after the velocity reaches 60 mL/min.
Moreover, given the same gas velocity of CO2, the reaction of Mg powder always presents a higher yield than that of the Mg ribbon. This phenomenon can be illustrated by the interface model in a gas-solid noncatalytic reaction proposed by P.A. Ramachandran et al. [35] According to this model, the solid pellet is visualized as consisting of a number of small particles or grains. Surrounding these grains are macropores, through which the gas has to diffuse to reach the various grains. The reaction occurs at the surface of each grain, and a product layer forms with time in the outer regions of each grain. As the time is prolonged, the product layer becomes too thick for gas to diffuse to reach the various grains in turn, so the reaction ceases. In this case, the metal Mg can be served as small particles. Surrounding the small particles of metal Mg are macropores through which gaseous CO2 can diffuse to reach the small particles of metal Mg and react with Mg on the surface to form multilayered graphene. With the reaction’s progress, multilayered graphene prepared on the surface of metal Mg becomes too dense for CO2 to diffuse, so in turn, the reaction ceases. Compared with the Mg ribbon, Mg powder had much more macropores for CO2 to diffuse and react with metal Mg because the structure of Mg powder was more looser (as Figure 1 shows). Consequently, a higher yield was obtained from Mg powder. This agrees well with the SEM result, which implies that Mg powder has a higher specific surface area than that of Mg ribbon because of the sphere-like structure of Mg powder. Hence, it is easier for Mg powder to react with CO2 when given the same amount of metal Mg in such conditions.
3.3. Multilayered Graphene under Different Reaction Temperatures
In order to study the effect of different reaction temperatures, a range of reaction temperatures (100–1200 °C) was used under the velocity of 60 mL/min for CO2 with a reaction time of 30 min and 1.0 M HCl solution for sample post-processing. The result show that a reaction did not take place below 600 °C. From 600 to 700 °C, the yields of both Mg ribbon and Mg powder increased obviously, as shown in Figure 3. When the temperature exceeded 700 °C, the yields of both Mg ribbon and Mg powder did not increase, but instead slightly decreased.
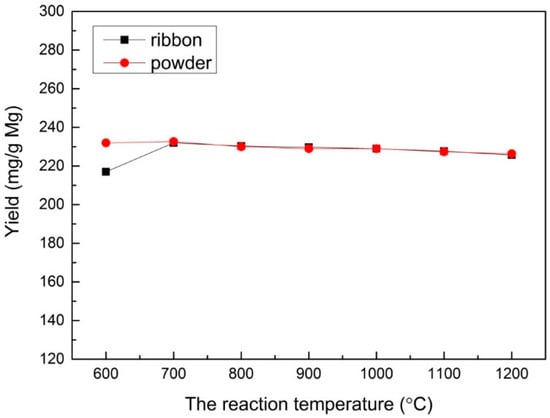
Figure 3.
The yield under different reaction temperatures prepared with an Mg ribbon and Mg powder.
The increasing yields at 600 to 700 °C indicates that the rising temperature could improve the reaction activity when the reaction temperature was at the range of 600–700 °C. Meanwhile, the yields no longer increased but instead slightly decreased at a temperature higher than 700 °C, which can be illustrated by the reaction of CO2 with C. It was reported that CO2 would react with C and form carbon monoxide when the temperature reached exceeded 700 °C [36,37], leading to a decrease in the multilayered graphene produced. Moreover, when the temperature was higher than 1107 °C (the boiling point of Mg), the metal Mg began to evaporate, resulting in a decreasing amount of the products that could be collected.
3.4. Multilayered Graphene under Different Reaction Times
In order to study the effect of different reaction times, a range of reaction times (10–60 min) was used under a velocity of 60 mL/min for CO2 at a reaction temperature of 700 °C and 1.0 M HCl solution for sample post-processing, which is shown in Figure 4. It can be seen that the yield of multilayered graphene increased when the reaction time increased during the reaction time of 10–30 min. As the reaction time exceeded 30 min, the yield no longer increased, which indicates that the reaction of Mg and CO2 completely finished.
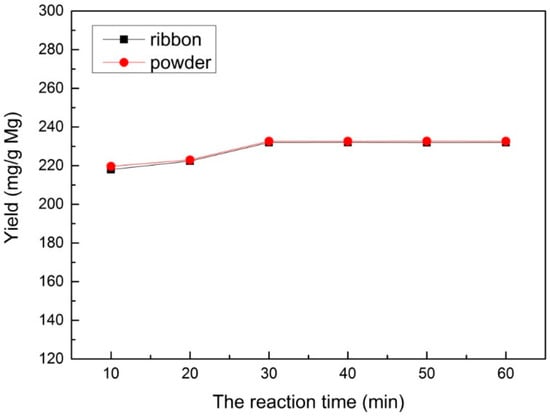
Figure 4.
The yield under different reaction times prepared with an Mg ribbon and Mg powder.
3.5. Multilayered Graphene under Different Concentrations of HCl Solution for Sample Post-Processing
Note that the sample should be treated with HCl solution to remove the reaction products MgO and the remaining metal Mg that did not react with CO2. In order to study the effect of different concentrations of HCl solution for sample post-processing, a range of concentrations of the HCl solution (0.5 M, 1.0 M, and 2.0 M) were used in the post-processing process. TEM was performed to observe the morphology of the carbon-based sample produced. EDS was also performed to determine the content of Mg in the multilayered graphene sample. The results are shown in Figure 5, Figure 6, Figure 7 and Figure 8.
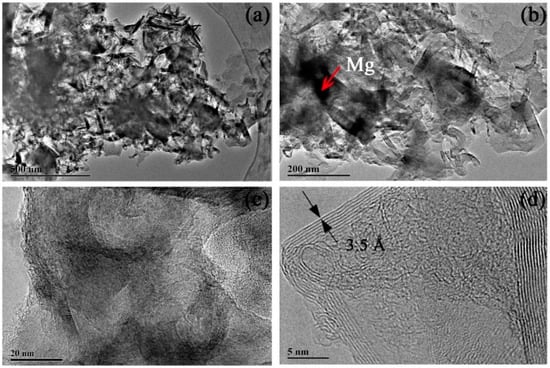
Figure 5.
Transmission electron microscopy (TEM) images of multilayered graphene treated with 0.5 M concentration of HCl. (a) Thin graphene sheets aggregates. (b) The composition of multilayered graphene. (c) Typical stripe structures that occurred on the surface of the sample. (d) A high-resolution TEM image of multilayered graphene.
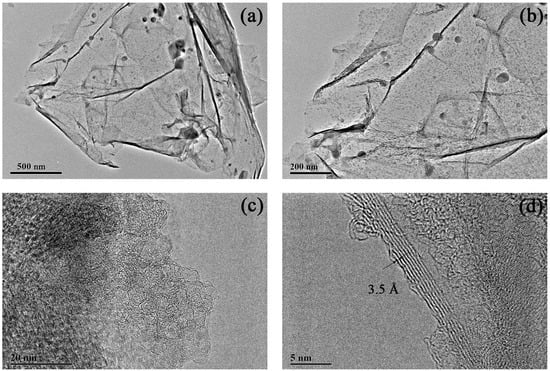
Figure 6.
TEM images of multilayered graphene treated with 1.0 M concentration of HCl. (a) Thin graphene sheets with occasional folding. (b) The composition of multilayered graphene. (c) Typical graphene structures occurred on the surface of the sample. (d) High-resolution TEM image of multilayered graphene.
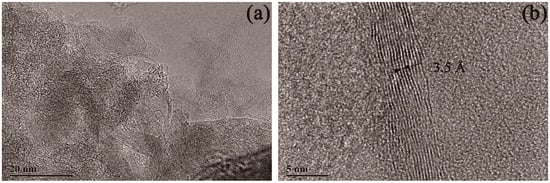
Figure 7.
TEM images of multilayered graphene treated with a 2.0 M concentration of HCl. (a) Typical stripe structures that occurred on the surface of the sample. (b) A high-resolution TEM image of multilayered graphene.
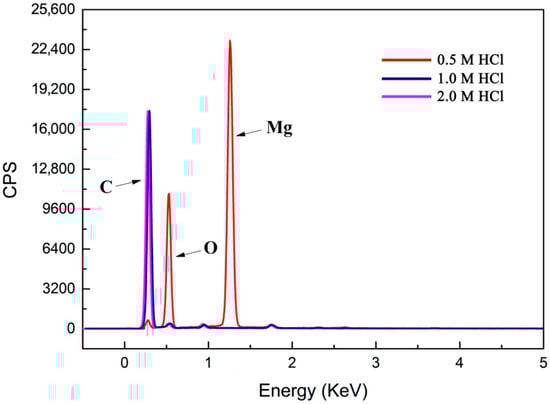
Figure 8.
X-ray spectroscopy (EDS) spectra of multilayered graphene sheets treated with different concentrations of HCl (0.5 M, 1.0 M, and 2.0 M). EDS spectra of multilayered graphene sheets treated with 0.5 M HCl, 3.21 (norm wt%) C, 56.52 (norm wt%) Mg, 40.27 (norm wt%) O; EDS spectra of multilayered graphene sheets treated with 1.0 M HCl, 98.61 (norm wt%) C, 0.01 (norm wt%) Mg, 1.38 (norm wt%) O; EDS spectra of multilayered graphene sheets treated with 2.0 M of HCl, 98.58 (norm wt%) C, 0.01 (norm wt%) Mg, and 1.41 (norm wt%) O.
The morphology of the sample treated with 1.0 M concentration of HCl solution is shown in Figure 6. The image in Figure 6a reveals a silky-smooth satin ribbon dotted with some obstacles with the scale ranging from ten to a hundred nanometers (Figure 6b). As seen from the magnified TEM images in Figure 6c, a typical graphene structure with graphitic lattices occurred on the surface of the sample. The image in Figure 6d indicates a three-to-nine-layer graphene with a lattice space of about 3.5 Å.
The morphology of the sample treated with a 2.0 M concentration of HCl solution is shown in Figure 7. Compared with the sample treated with 1.0 M HCl, a similar morphology was obtained with the sample treated by 2.0 M HCl. From Figure 7, a typical strips pattern can be seen and proved to be multilayered graphene with the lattice space of 3.5 Å.
To determine the content of Mg in the samples, the result of EDS is shown in Figure 8. It can be observed that the sample treated with 0.5 M HCl solution showed a high Mg content (the Mg was 56.52 (norm wt%) and O was 40.27 (norm wt%)), which proved that Mg atoms were left in the sample after 0.5 M HCl treatment. This further demonstrated that the 0.5 M concentration of HCl could not remove the Mg atoms in the sample. This is consistent with the result of TEM mentioned above. The sample treated with 1.0 M HCl solution showed a rare Mg existence (0.01 norm wt%), and the purity of the carbon-based materials obtained reached up to 98.61 (norm wt%). Therefore, it can be deduced that almost no Mg atoms existed in the sample treated with 1.0 M HCl. Moreover, the EDS pattern of the sample treated with the 2.0 M HCl solution demonstrated that the amounts of C were nearly 98.6% (norm wt%), which showed a similar trend with that of the 1.0 M HCl solution. Therefore, 1.0 M HCl as the optimal concentration can be selected for sample post-processing.
As stated above, 1.0 M HCl can be selected for post-processing of the samples. Hence, the optimum experimental condition used in this study was as follows: velocity of CO2 of 60 mL/min, reaction temperature of 700 °C, reaction time of 30 min, and a sample post-processing solution of 1.0 M HCl. In the above conditions, the product prepared was 233 mg/g Mg. This showed that the yield rate almost reached 94.2% according to Equation (2).
The sample was also prepared under the above conditions for further characterization by Raman spectroscopy and XRD image.
3.6. Raman Spectroscopy Characterization
Raman spectroscopy is a rapid, sensitive, and non-destructive tool for the characterization of carbon-based materials. This technique is a mature method for investigating the properties of graphene, providing useful information on the defects (D band), in-plane vibration of sp2 carbon atoms (G band) as well as the stacking order (G’ band or 2D band) [38]. From Figure 9, the three major components of the spectrum consisted of peaks at 1354, 1575, and 2700 cm−1, which are commonly designated as the D-band, G-band, and the G’-band, respectively. This agrees well with other reports about graphene [39,40,41]. For example, Jibrael and co-workers [39] prepared multilayered graphene with electrochemical exfoliation and found the D-band of Raman spectrum at 1354 cm−1; Banerjee et al. [40] deposited multilayered graphene onto flexible substrates and obtained the G-band of Raman spectrum at 1575 cm−1; and Reina et al. [41] reported the large scale transfer and quick identification of single- and multilayered graphene sheets and for multilayered graphene, the G’-band of Raman spectrum was found at around 2700–2720 cm−1.
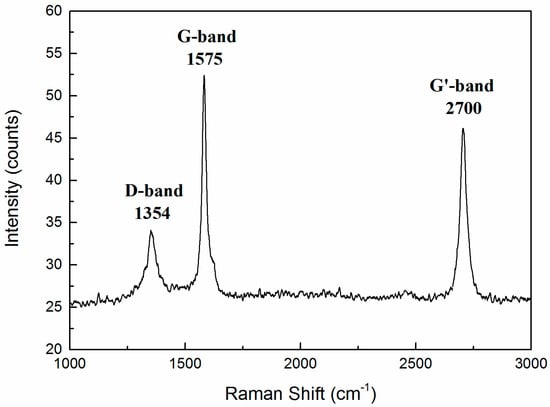
Figure 9.
Raman spectra (wavelength λL = 514 nm) of the carbon species exhibiting a D-band at 1354 cm−1, G-band at 1575 cm−1, and G’-band at 2700 cm−1.
It should be noted that the peak of the G-band was higher than that of the G’-band, which is different from that of monolayer graphene [42,43,44,45,46]. In fact, the peak height of the G-band was higher than that of the G’-band for multilayer graphene. This phenomenon was also found by Wang et al. [42], who showed the G-band is higher than the G’-band in three-layer and four-layer graphene. Ferrari et al. [46] also proved the result mentioned above. Therefore, the peaks in Figure 9 imply that multilayered graphene was prepared successfully in this study.
3.7. XRD Characterization
In Figure 10, it can be seen clearly that the prominent peaks of graphene for (002), the crystal plane was positioned at 2θ = 26.4° and (101) the crystal plane was positioned at 2θ = 43.0°, which is consistent with other studies reported previously [47,48,49]. Thus, it was confirmed by XRD spectrum that multilayered graphene structure was obtained.
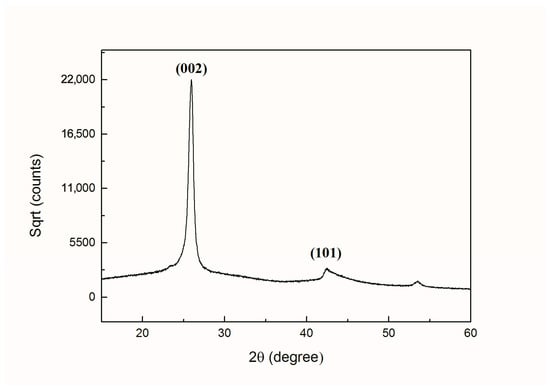
Figure 10.
XRD patterns of graphene with multilayers.
4. Conclusions
In conclusion, we presented a facile and controllable approach to prepare multilayered graphene with CO2 as a carbon source. It is a facile and controllable route for fabricating multilayered graphene, which demonstrates that greenhouse gas can be utilized as a source of carbon for fabricating multilayered graphene. The optimum condition for the production of multilayered graphene in this study was obtained by investigating the effect of the velocity of CO2, reaction temperature, reaction time, and sample post-processing conditions on the reaction of metal Mg (Mg ribbon and Mg powder) with CO2. The results show that with the increasing of velocity of CO2, the yield of multilayered graphene first increased and then remained at a certain level. Owing to the sphere-like structure, Mg powder is easier to react with CO2, and has a higher yield compared with Mg ribbon in the above conditions. Simultaneously, below 600 °C, the reaction of metal Mg with CO2 did not take place; from 600 to 700 °C, the reaction of metal Mg with CO2 did take place, and the yield increased obviously due to the fact that the rising temperature can improve the reaction activity; over 700 °C, the yield did not increase, but slightly decreased for the reaction of CO2 with C, while the metal Mg even evaporated at a temperature of 1107 °C. Meanwhile, with the increase of the reaction time, the yield of multilayered graphene first increased and then remained at a certain level. Finally, the optimum solution of 1.0 M HCl was obtained in this study for sample post-processing. Based on the above study, the yield rate of multilayered graphene almost reached 94.2%. Therefore, this research provides a new method for a controllable way to produce multilayered graphene with gaseous CO2 as a carbon source, and we believe that this work may provide a new proof-of-principle that can be applied in large-scale preparation of multilayered graphene.
Author Contributions
Validation, L.Z.; Writing—original draft, H.D.; Writing—review & editing, S.G.
Funding
This research received no external funding.
Acknowledgments
This work was supported by Science and Technology Major Project of Shanxi (20181101018) and Key R & D Project of Shanxi Province (201703D111008).
Conflicts of Interest
The authors declare no conflict of interest.
References
- Li, X.; Cai, W.; An, J.; Kim, S.; Nah, J.; Yang, D.; Piner, R.; Velamakanni, A.; Jung, I.; Tutuc, E.; et al. Large-area synthesis of high-quality and uniform graphene films on copper foils. Science 2009, 324, 1312–1314. [Google Scholar] [CrossRef] [PubMed]
- Bae, S.; Kim, H.; Lee, Y.; Xu, X.; Park, J.S.; Zheng, Y.; Balakrishnan, J.; Lei, T.; Kim, H.R.; Song, Y.I.; et al. Roll-to-roll production of 30-inch graphene films for transparent electrodes. Nat. Nanotechnol. 2010, 5, 574–578. [Google Scholar] [CrossRef] [PubMed]
- Bai, J.; Zhong, X.; Jiang, S.; Huang, Y.; Duan, X. Graphene nanomesh. Nat. Nanotechnol. 2010, 5, 190–194. [Google Scholar] [CrossRef] [PubMed]
- Cataldi, P.; Athanassiou, A.; Bayer, I.S. Graphene nanoplatelets-based advanced materials and recent progress in sustainable applications. Appl. Sci. 2018, 8, 1438. [Google Scholar] [CrossRef]
- Geim, A.K.; Novoselov, K.S. The rise of graphene. Nat. Mater. 2007, 6, 183–191. [Google Scholar] [CrossRef]
- Georgakilas, V.; Otyepka, M.; Bourlinos, A.B.; Chandra, V.; Kim, N.; Kemp, K.C.; Hobza, P.; Zboril, R.; Kim, K.S. Functionalization of graphene: Covalent and non-covalent approaches, derivatives and applications. Chem. Rev. 2012, 112, 6156–6214. [Google Scholar] [CrossRef]
- Kashif, M.F.; Bianco, G.V.; Stomeo, T.; Vincenti, M.A.; de Ceglia, D.; de Vittorio, M.; Scalora, M.; Bruno, G.; D’Orazio, A.; Grande, M. Graphene-based cylindrical pillar gratings for polarization-insensitive optical absorbers. Appl. Sci. 2019, 9, 2528. [Google Scholar] [CrossRef]
- Yu, M.F.; Lourie, O.; Dyer, M.J.; Moloni, K.; Kelly, T.F.; Ruoff, R.S. Strength and breaking mechanism of multiwalled carbon nanotubes under tensile load. Science 2000, 287, 637–640. [Google Scholar] [CrossRef]
- Zhang, Y.B.; Tan, Y.W.; Stormer, H.L.; Kim, P. Experimental observation of the quantum Hall effect and Berry’s phase in graphene. Nature 2005, 438, 201–204. [Google Scholar] [CrossRef]
- Novoselov, K.S.; Geim, A.K.; Morozov, S.V.; Jiang, D.; Zhang, Y.; Dubonos, S.V.; Grigorieva, I.V.; Firsov, A.A. Electric field effect in atomically thin carbon films. Science 2004, 306, 666–669. [Google Scholar] [CrossRef]
- Lotya, M.; Hernandez, Y.; King, P.J.; Smith, R.J.; Nicolosi, V.; Karlsson, L.S.; Blighe, F.M.; De, S.; Wang, Z.; McGovern, I.T.; et al. Liquid phase production of graphene by exfoliation of graphite in surfactant/water solutions. J. Am. Chem. Soc. 2009, 131, 3611–3620. [Google Scholar] [CrossRef] [PubMed]
- Park, S.; Ruoff, R.S. Chemical methods for the production of graphenes. Nat. Nanotechnol. 2009, 4, 217–224. [Google Scholar] [CrossRef] [PubMed]
- Gomez, C.V.; Tene, T.; Guevara, M.; Usca, G.T.; Colcha, D.; Brito, H.; Molina, R.; Bellucci, S.; Tavolaro, A. Preparation of few-layer graphene dispersions from hydrothermally expanded graphite. Appl. Sci. 2019, 9, 2539. [Google Scholar] [CrossRef]
- Si, Y.; Samulski, E.T. Synthesis of water soluble graphene. Nano Lett. 2008, 8, 1679–1682. [Google Scholar] [CrossRef] [PubMed]
- Zhao, M. Direct synthesis of graphene quantum dots with different fluorescence properties by oxidation of graphene oxide using nitric acid. Appl. Sci. 2018, 8, 1303. [Google Scholar] [CrossRef]
- Liao, G.; Gong, Y.; Zhang, L.; Gao, H.; Yang, G.-J.; Fang, B. Semiconductor polymeric graphitic carbon nitride photocatalysts: The “holy grail” for the photocatalytic hydrogen evolution reaction under visible light. Energy Environ. Sci. 2019, 12, 2080–2147. [Google Scholar] [CrossRef]
- Hu, T.; Liu, X.; Ma, D.; Wei, R.; Xu, K.; Ma, F. Formation of micro-and nano-trenches on epitaxial graphene. Appl. Sci. 2018, 8, 2518. [Google Scholar] [CrossRef]
- Kun, P.; Weber, F.; Balazsi, C. Preparation and examination of multilayer graphene nanosheets by exfoliation of graphite in high efficient attritor mill. Cent. Eur. J. Chem. 2011, 9, 47–51. [Google Scholar] [CrossRef]
- Sierra, U.; Alvarez, P.; Blanco, C.; Granda, M.; Santamaria, R.; Menendez, R. New alternatives to graphite for producing graphene materials. Carbon 2015, 93, 812–818. [Google Scholar] [CrossRef]
- Lian, P.; Liu, H.; Li, H.; Zhang, Y.; Mei, Y. A facile and mild route to synthesize ultralight and flexible 3D functionalized graphene. J. Porous Mater. 2018, 25, 905–911. [Google Scholar] [CrossRef]
- Ryu, S.K.; Jin, H.; Gondy, D.; Pusset, N.; Ehrburger, P. Activation of carbon-fibers by steam and carbon-dioxide. Carbon 1993, 31, 841–842. [Google Scholar] [CrossRef]
- Yang, S.; Qiao, Y.; He, P.; Liu, Y.; Cheng, Z.; Zhu, J.-J.; Zhou, H. A reversible lithium-CO2 battery with Ru nanoparticles as a cathode catalyst. Energy Environ. Sci. 2017, 10, 972–978. [Google Scholar] [CrossRef]
- Bai, X.; Chen, W.; Zhao, C.; Li, S.; Song, Y.; Ge, R.; Wei, W.; Sun, Y. Exclusive formation of formic acid from CO2 electroreduction by a tunable Pd-Sn alloy. Angew. Chem. Int. Ed. 2017, 56, 12219–12223. [Google Scholar] [CrossRef] [PubMed]
- Chakrabarti, A.; Lu, J.; Skrabutenas, J.C.; Xu, T.; Xiao, Z.; Maguire, J.A.; Hosmane, N.S. Conversion of carbon dioxide to few-layer graphene. J. Mater. Chem. 2011, 21, 9491–9493. [Google Scholar] [CrossRef]
- Li, N.; Wang, Z.; Zhao, K.; Shi, Z.; Gu, Z.; Xu, S. Large scale synthesis of N-doped multi-layered graphene sheets by simple arc-discharge method. Carbon 2010, 48, 255–259. [Google Scholar] [CrossRef]
- Reina, A.; Jia, X.; Ho, J.; Nezich, D.; Son, H.; Bulovic, V.; Dresselhaus, M.S.; Kong, J. Large area, few-layer graphene films on arbitrary substrates by chemical vapor deposition. Nano Lett. 2009, 9, 30–35. [Google Scholar] [CrossRef]
- Price, R.J.; Ladislaus, P.I.; Smith, G.C.; Davies, T.J. A novel ‘bottom-up’ synthesis of few-and multi-layer graphene platelets with partial oxidation via cavitation. Ultrason. Sonochem. 2019, 56, 466–473. [Google Scholar] [CrossRef]
- Kim, H.Y.; Dawood, O.M.; Monteverde, U.; Sexton, J.; Li, Z.L.; Britnell, L.; Migliorato, M.A.; Young, R.J.; Missous, M. Multilayer stacking and metal deposition effects on large area graphene on GaAs. Carbon 2016, 96, 83–90. [Google Scholar] [CrossRef]
- Johnson, J.L.; Behnam, A.; Pearton, S.J.; Ural, A. Hydrogen sensing using Pd-functionalized multi-layer graphene nanoribbon networks. Adv. Mater. 2010, 22, 4877–4880. [Google Scholar] [CrossRef]
- Biswas, S.; Drzal, L.T. Multi layered nanoarchitecture of graphene nanosheets and polypyrrole nanowires for high performance supercapacitor electrodes. Chem. Mater. 2010, 22, 5667–5671. [Google Scholar] [CrossRef]
- Mohanty, A.; Janowska, I. Tuning the structure of in-situ synthesized few layer graphene/carbon composites into nanoporous vertically aligned graphene electrodes with high volumetric capacitance. Electrochim. Acta 2019, 308, 206–216. [Google Scholar] [CrossRef]
- Maffucci, A.; Miano, G. Electrical properties of graphene for interconnect applications. Appl. Sci. 2014, 4, 305–317. [Google Scholar] [CrossRef]
- Qiao, Y.; Wang, Y.; Tian, H.; Li, M.; Jian, J.; Wei, Y.; Tian, Y.; Wang, D.-Y.; Pang, Y.; Geng, X.; et al. Multilayer graphene epidermal electronic skin. ACS Nano 2018, 12, 8839–8846. [Google Scholar] [CrossRef] [PubMed]
- Khurram, A.; He, M.F.; Gallant, B.M. Tailoring the discharge reaction in Li-CO2 batteries through incorporation of CO2 capture chemistry. Joule 2018, 2, 2649–2666. [Google Scholar] [CrossRef]
- Ramachandran, P.A.; Doraiswamy, L.K. Modeling of non-catalytic gas-solid reactions. AlChE J. 1982, 28, 881–900. [Google Scholar] [CrossRef]
- Gadsby, J.; Long, F.J.; Sleightholm, P.; Sykes, K.W. The mechanism of the carbon dioxide-carbon reaction. Proc. R. Soc. Lond. Ser. A Math. Phys. Sci. 1948, 193, 356–376. [Google Scholar]
- Reif, A.E. The mechanism of the carbon dioxide carbon reaction. J. Phys. Chem. 1952, 56, 785–788. [Google Scholar] [CrossRef]
- Cancado, L.G.; Jorio, A.; Ferreira, E.H.M.; Stavale, F.; Achete, C.A.; Capaz, R.B.; Moutinho, M.V.O.; Lombardo, A.; Kulmala, T.S.; Ferrari, A.C. Quantifying defects in graphene via Raman spectroscopy at different excitation energies. Nano Lett. 2011, 11, 3190–3196. [Google Scholar] [CrossRef]
- Jibrael, R.I.; Mohammed, M.K.A. Production of graphene powder by electrochemical exfoliation of graphite electrodes immersed in aqueous solution. Optik 2016, 127, 6384–6389. [Google Scholar] [CrossRef]
- Banerjee, I.; Faris, T.; Stoeva, Z.; Harris, P.G.; Chen, J.; Sharma, A.K.; Ray, A.K. Graphene films printable on flexible substrates for sensor applications. 2D Mater. 2017, 4, 015036. [Google Scholar] [CrossRef]
- Reina, A.; Son, H.; Jiao, L.; Fan, B.; Dresselhaus, M.S.; Liu, Z.; Kong, J. Transferring and identification of single-and few-layer graphene on arbitrary substrates. J. Phys. Chem. C 2008, 112, 17741–17744. [Google Scholar] [CrossRef]
- Wang, Y.Y.; Ni, Z.H.; Yu, T.; Shen, Z.X.; Wang, H.M.; Wu, Y.H.; Chen, W.; Wee, A.T.S. Raman studies of monolayer graphene: The substrate effect. J. Phys. Chem. C 2008, 112, 10637–10640. [Google Scholar] [CrossRef]
- Ni, Z.; Wang, Y.; Yu, T.; Shen, Z. Raman spectroscopy and imaging of graphene. Nano Res. 2008, 1, 273–291. [Google Scholar] [CrossRef]
- Wang, Y.Y.; Ni, Z.H.; Shen, Z.X.; Wang, H.M.; Wu, Y.H. Interference enhancement of Raman signal of graphene. Appl. Phys. Lett. 2008, 92, 043121. [Google Scholar] [CrossRef]
- Zhong, J.-H.; Zhang, J.; Jin, X.; Liu, J.-Y.; Li, Q.; Li, M.-H.; Cai, W.; Wu, D.-Y.; Zhan, D.; Ren, B. Quantitative correlation between defect density and heterogeneous electron transfer rate of single layer graphene. J. Am. Chem. Soc. 2014, 136, 16609–16617. [Google Scholar] [CrossRef]
- Ferrari, A.C.; Basko, D.M. Raman spectroscopy as a versatile tool for studying the properties of graphene. Nat. Nanotechnol. 2013, 8, 235–246. [Google Scholar] [CrossRef]
- Seehra, M.S.; Geddam, U.K.; Schwegler-Berry, D.; Stefaniak, A.B. Detection and quantification of 2H and 3R phases in commercial graphene-based materials. Carbon 2015, 95, 818–823. [Google Scholar] [CrossRef]
- Seehra, M.S.; Narang, V.; Geddam, U.K.; Stefaniak, A.B. Correlation between X-ray diffraction and Raman spectra of 16 commercial graphene-based materials and their resulting classification. Carbon 2017, 111, 380–385. [Google Scholar] [CrossRef]
- Andonovic, B.; Grozdanov, A.; Paunovic, P.; Dimitrov, A.T. X-ray diffraction analysis on layers in graphene samples obtained by electrolysis in molten salts: A new perspective. Micro Nano Lett. 2015, 10, 683–685. [Google Scholar] [CrossRef]


© 2019 by the authors. Licensee MDPI, Basel, Switzerland. This article is an open access article distributed under the terms and conditions of the Creative Commons Attribution (CC BY) license (http://creativecommons.org/licenses/by/4.0/).