Article

Application of Augmented Reality, Mobile Devices, and Sensors for a Combat Entity Quantitative Assessment Supporting Decisions and Situational Awareness Development

by
Mariusz Chmielewski
*,
Krzysztof Sapiejewski
and
Michał Sobolewski
Cybernetics Faculty, Military University of Technology, 01-476 Warsaw, Poland
*
Author to whom correspondence should be addressed.
Appl. Sci. 2019, 9(21), 4577; https://doi.org/10.3390/app9214577
Submission received: 12 March 2019 / Revised: 6 October 2019 / Accepted: 9 October 2019 / Published: 28 October 2019
(This article belongs to the Special Issue Augmented Reality: Current Trends, Challenges and Prospects)

Abstract

:
This paper presents advances in the development of specialized mobile applications for combat decision support utilizing augmented reality technologies used for the production of contextual data delivered to any tactical smartphone. Handhelds and decision support systems have been present in military operations since the 1990s. Due to the development of hardware and software platforms, smartphones are capable of running complex algorithms for individual soldiers and low-level commander support. The utilization of tactical data (force location, composition, and tasks) in dynamic mobile networks that are accessible anywhere during a mission provides means for the development of situational awareness and decision superiority. These two elements are key factors in 21st-century military operations, as they influence the efficiency of recognition, identification, and targeting. Combat support tools and their analytical capabilities can serve as recon data hubs, but most of all they can support and simplify complex analytical tasks for commanders. These tasks mainly include topographical and tactical orientation within the battlespace. This paper documents the ideas for and construction details of mobile support tools used for supporting the specific operational activities of military personnel during combat and crisis management. The presented augmented reality-based evaluation methods formulate new capabilities for the visualization and identification of military threats, mission planning characteristics, tasks, and checkpoints, which help individuals to orientate within their current situation. The developed software platform, mobile common operational picture (mCOP), demonstrates all research findings and delivers a personalized combat-oriented distributed mobile system, supporting blue-force tracking capabilities and reconnaissance data fusion as well as threat-level evaluations for military and crisis management scenarios. The mission data are further fused with Geographic Information System (GIS) topographical and vector data, supporting terrain evaluations for mission planning and execution. The application implements algorithms for path finding, movement task scheduling, assistance, and analysis, as well as military potential evaluation, threat-level estimation, and location tracking. The features of the mCOP mobile application were designed and organized as mission-critical functions. The presented research demonstrates and proves the usefulness of deploying mobile applications for combat support, situation awareness development, and the delivery of augmented reality-based threat-level analytical data to extend the capabilities and properties of software tools applied for supporting military and border protection operations.

1. Introduction

Handhelds, their hardware capabilities, and their software platforms provide new opportunities to support combat mission responsibilities. Exceptional computing power can be successfully applied for complex sensor data processing, instant location monitoring, data fusion, and decision support. This delivers new means for utilizing commercially available platforms integrated with external communication equipment (tactical radios, 5G LTE network systems) as specialized platforms for personal mission assistance. Supporting military individuals and decision-makers with network technology has been deployed since the early 1990s, but only now has the interoperability of hardware platforms, specialized military communication systems, and mobile devices delivered the means for the development of smartphone-integrated specialized applications. Network-enabled capabilities or network-centric warfare [1] are doctrines implementing communication and information technologies in warfare to achieve higher efficiency in combat. In recent years, information technology development in the military has been aimed at formulating, standardizing, and integrating decision support and weapon control systems organized into several classes of systems [1,2,3] (C4ISR). The idea behind such tools is to collect and distribute the operational data of a conducted mission utilizing GIS functionalities [4,5] and augmenting the data with additional information on terrain and hostile and friendly forces. The range of processed data and produced tactical information depends on the level of command and the battlespace dimensions but most of all on available data sources [6,7]. The difficulty (while developing operational rendering environments) comes from the variety of formal NATO standards [2] and the specificity of tactical symbology (e.g., Std-2525, APP-6C) [2,3,8]: on top of this, a set of map data standards needs to be integrated. Geoinformation varies depending on the battlespace dimensions: in the case of cyberspace, such a relationship can even be limited. tactical common operational picture (tCOP) and mCOP [6,9] products deliver functionality for all battlespace dimensions and crisis management due to their target audience–territorial defense units and land forces. The software needs to be secure and easily configurable to be rapidly deployed on soldiers’ and commanders’ handhelds (mCOP) and in lower-level command centers (tCOP). The mCOP platform delivers software (it is not a hardware platform), and therefore it utilizes the existing communication infrastructure intentionally. This research documents the construction of novel augmented reality mechanisms that have been implemented in mobile software and are capable of instantly presenting mission data to individual soldiers, thus supporting the efficiency of an operation. The novelty of these mechanisms is connected to sensor and mission data fusions, which construct tactically augmented views accessible in combat smart devices. The utilization of augmented reality views with such an analytical load of information (on units, battlespace actors, and their potential military characteristics) is being documented as one of the first, especially in terms of constructing the view and its properties to achieve responsiveness and readability. Considering the operational background of territorial defense, such a feature can also be an advantage as software that can operate in the civilian and military communications environment. Hidden combat actions performed by military units disguised as ordinary civilians using such software platforms (mCOP) can deliver operational capabilities integrated within commercial smartphones, which can be seamlessly used in combat or intelligence operations. The presented research concentrates on developing specialized combat functionality that directly supports battlespace data acquisition, processing, and distribution between friendly side assets (gaining decision superiority). This task is performed using handheld devices connected to secured tactical networks through the application of specialized network interfaces.

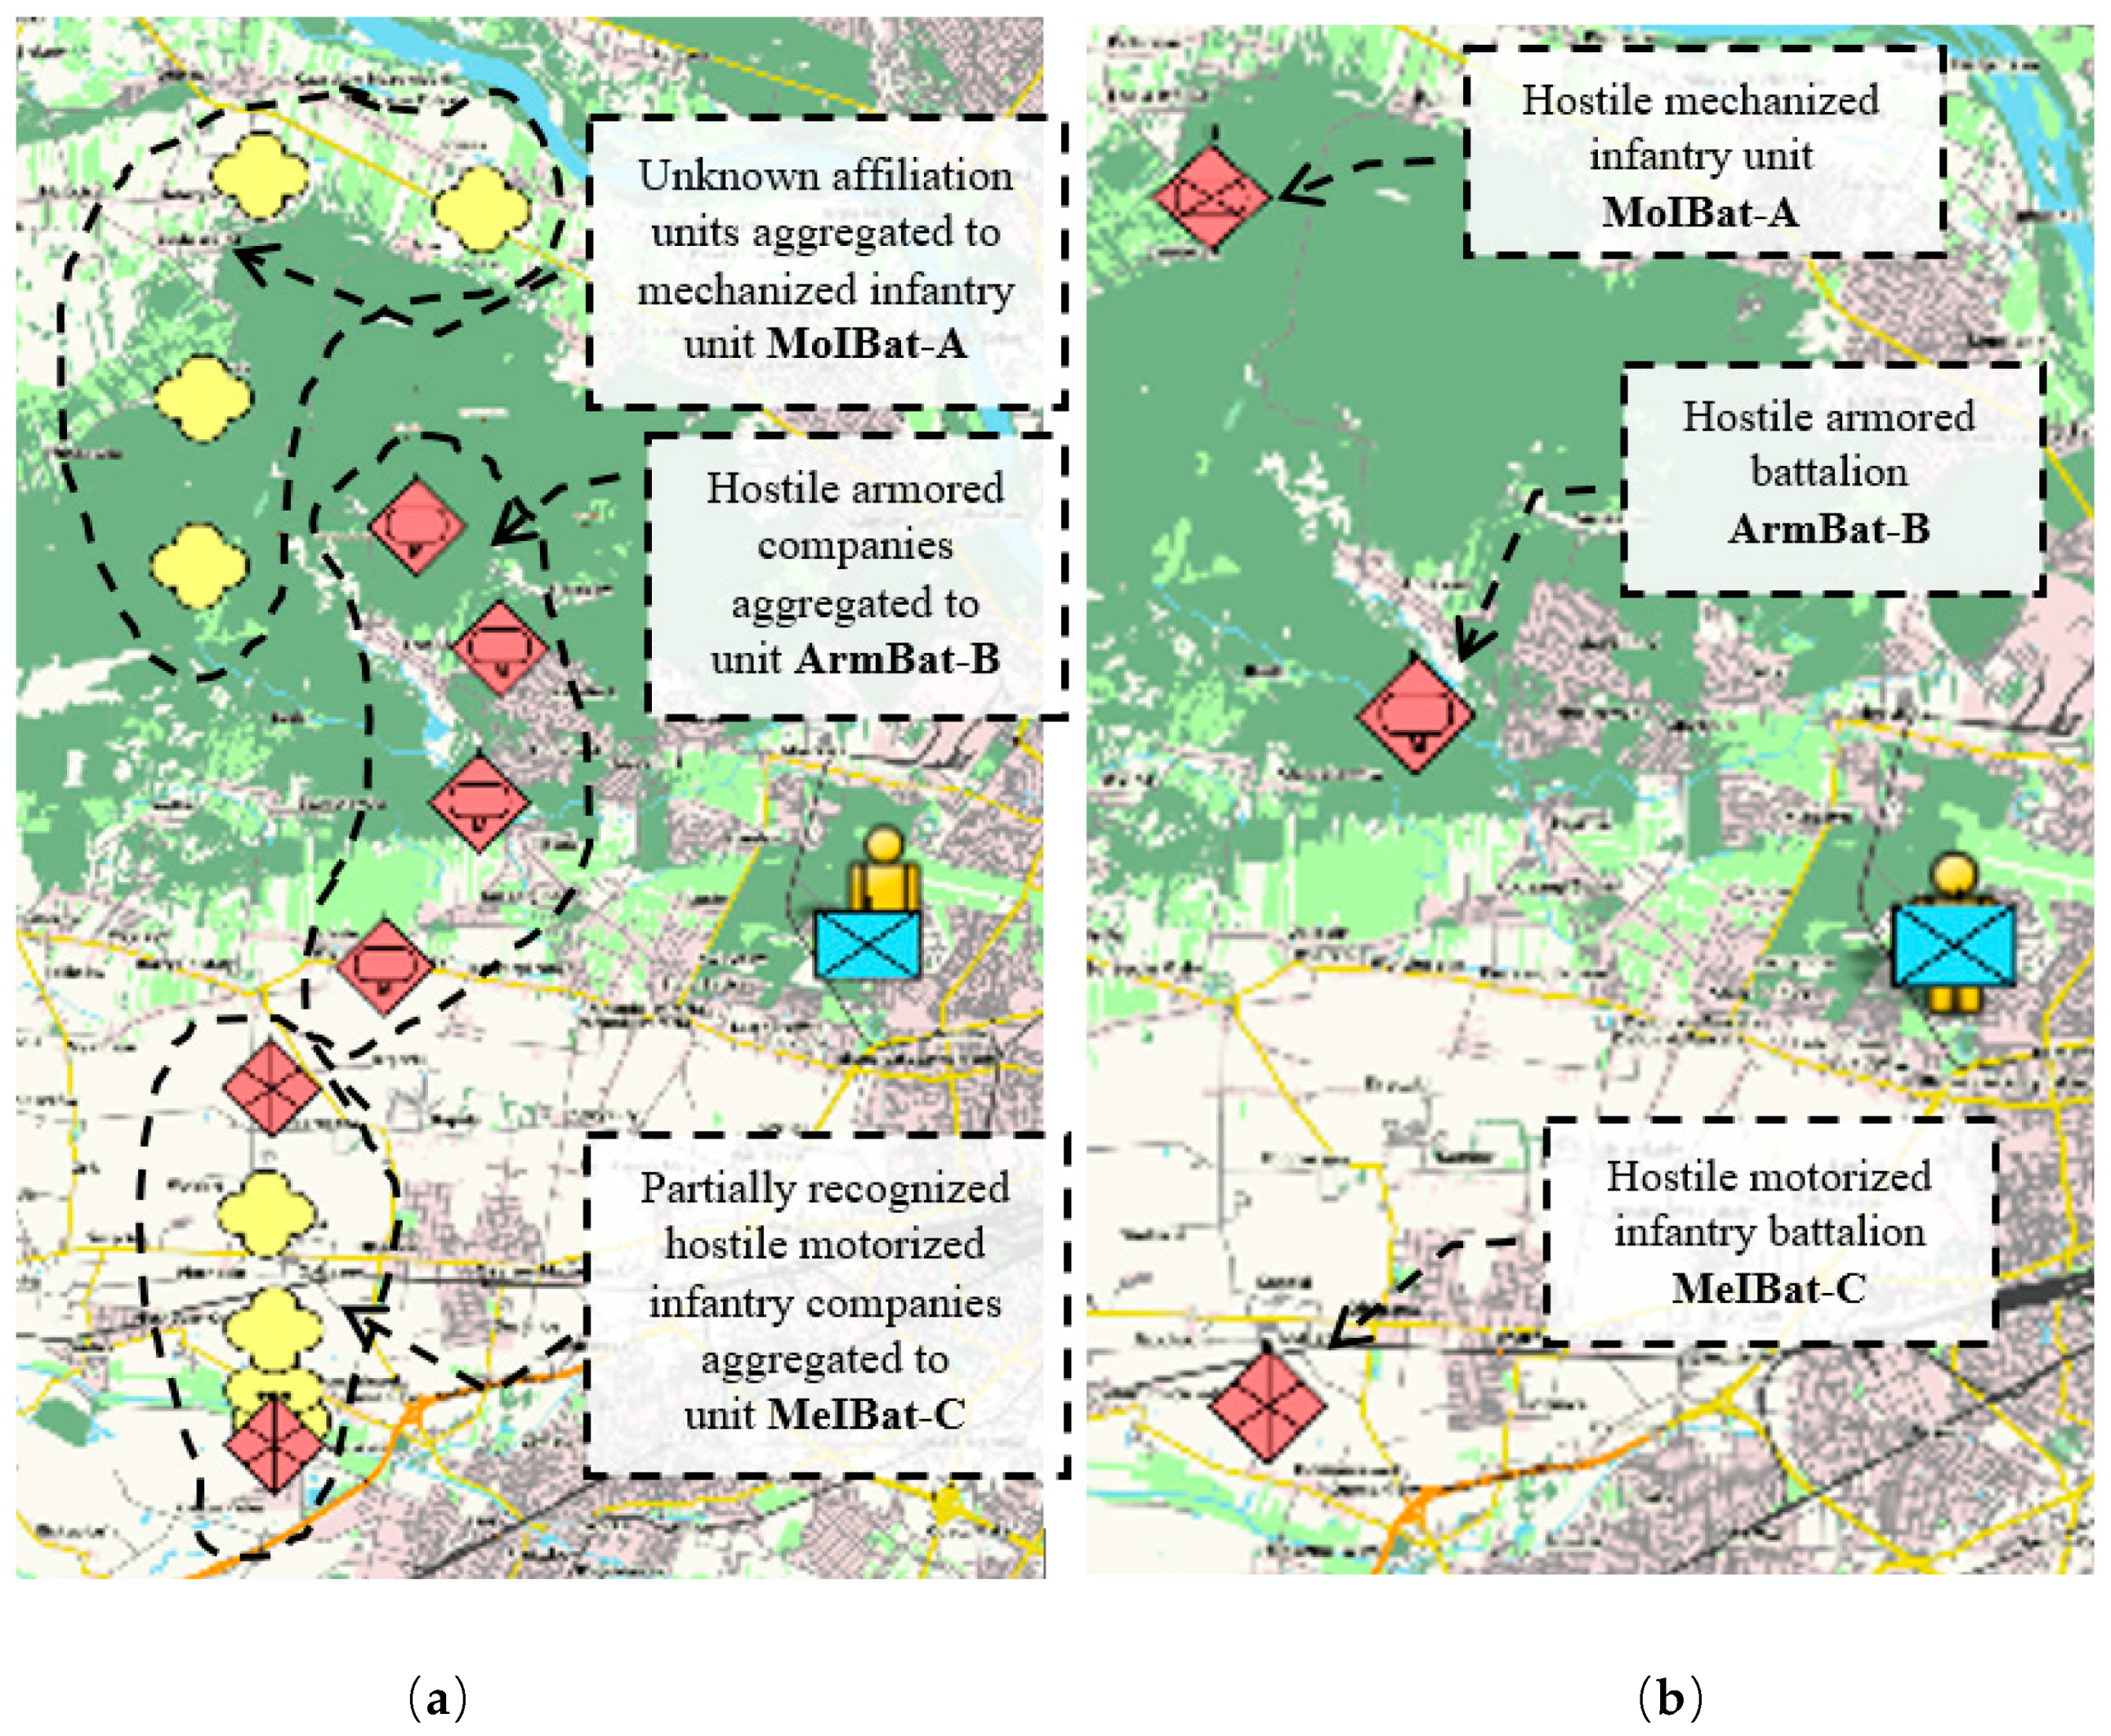
2. Introduction to Analytical Scenario

The presented research on utilizing Augmented Reality (AR) technology and analytical products concentrates on developing specialized combat functionality, which directly supports battlespace data acquisition, processing, and distribution between friendly side assets (gaining decision superiority). This task is performed using handheld devices connected to secured tactical networks through the application of specialized network interfaces. Figure 1 and Figure 2 present a test scenario that presents the reporting and recon aggregation capabilities of the mCOP toolkit. The presented figures document the combat scenario time snapshots reported and registered by separate reconnaissance elements, which during a mission are supplemented with detailed unit information [5,6]. Each recon report contains a marked enemy or unknown elements’ estimated placements, any equipment recognized, and personnel. Using intelligence knowledge about an enemy unit’s doctrinal composition, a system can recognize and determine unit templates (also considering different aggregation levels).
To support the type of recon data reported in each mCOP application, mCOP is able to register an individual or group of equipment/vehicles, marking their warfare type or specific model or utilizing IoT-based sensors [5]. The fusion of such data is performed automatically in the tCOP [10] server and is further distributed to lower-level mCOP node applications. The fusion algorithm utilizes the reliability of the reporting source and the correlating data of individual military equipment and groups. Utilizing doctrinal patterns, the algorithms identify and recognize specific unit types and their affiliations based on the numbers and types of equipment supplemented with communications and command system parameters. The mCOP application contains an editable and configurable equipment database (internal), which can be updated and extended through server service or manual interactions. However, to fully utilize Tactical Augmented Reality View (TARV) battle space object annotations and evaluations (Figure 3), it is required that the operator provide equipment data as an outcome of the performed reconnaissance tasks.
A database of military equipment is further used to determine the full composition of recognized units, formulating military unit potentials, which can be further used for tactical calculations utilizing Lanchester’s model [2,11]. With detailed scenario data stored in its combat database, mCOP is capable of calculating the combat outcomes of the selected enemy and the friendly units in various dynamic tack configurations. This delivers to tactical commanders a powerful tool for current situation evaluation. The described situation is the basis for further studies and presentations on the implementation of battlespace evaluation algorithms. To demonstrate such capabilities, we will consider a scenario composed of Table 1 and Table 2 elements (infantry battalion vs three enemy battalions).

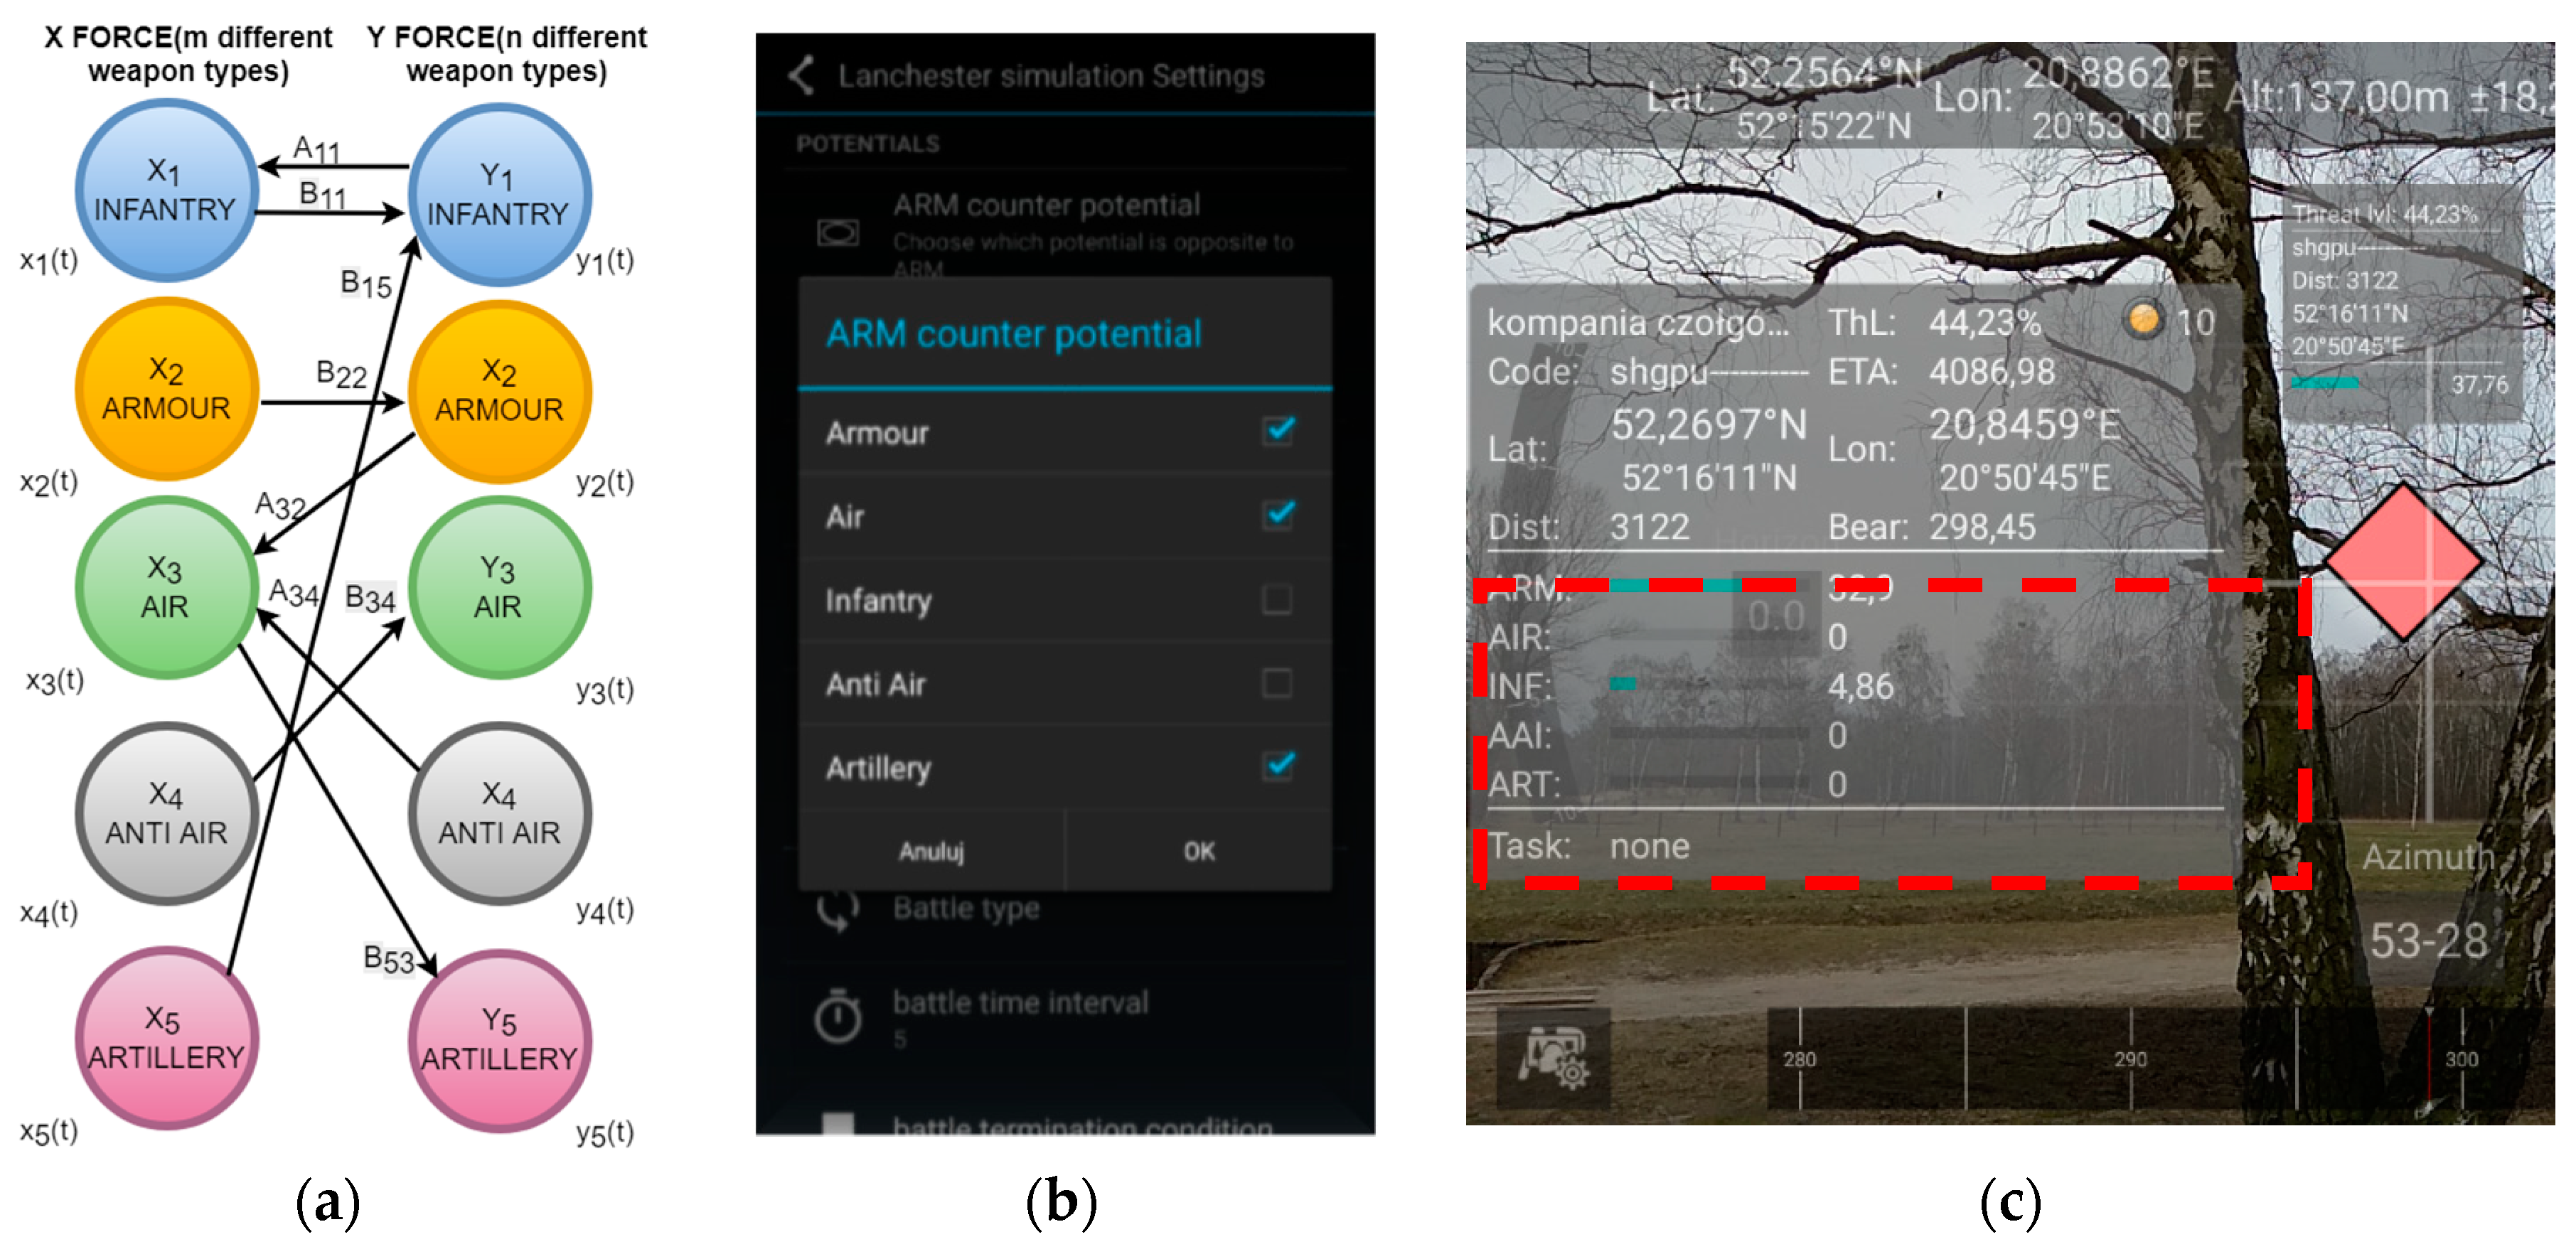
3. Tactical Calculation Methodology and Situational Awareness Evaluation Algorithms

Timely delivered information and prepared decisions are crucial for individual soldiers and commanders, as this delivers the means for achieving decision superiority [1,12,13]. In order to achieve the required situational awareness [14], battlespace information must be accessible in real time. Therefore, mCOP was developed to render tactical information with respect to a current user’s location (supporting current combat situation recognition) using an augmented reality view of the surrounding combat environment (Figure 3, Figure 4 and Figure 5). All acquired data are fused and then used to estimate some major characteristics of the combat situation. Combat situational awareness in a real-world combat situation cannot be easily developed using a traditional 2D map view, as it does not provide direct spatial orientation, an enriched view of units, or threat-level semantics. Therefore, a tactical augmented reality view (TARV) was proposed and constructed. A TARV provides sensor data fusion products (location, azimuth, distance, and threat-level calculations) in the form of one picture, upon which the application evaluates the positions of allied and enemy forces and projects them onto the current camera view, presenting location and orientation data (Figure 4). Elements of TARV are calculated based on Global Positioning System (GPS) and magnetometer data that determine the observer’s viewport and location, which additionally can present (Figure 4) the following: (1) location and GPS data precision, (2) altitude, (3) compass and current direction, (4) viewport angle, and (5) an overview map compass. This information can be further semantically processed to recommend the most efficient course of action or movement route. TARV is a construct developed through the usage of battlefield data, a user’s location, and data derived from handheld device sensor fusions and the camera view. To create an AR view, there is a need to describe the vertical and horizontal field of the camera’s view, calculated as a visible angle one meter away from the camera. When the viewing angles are specified, a maximum visible distance of units, POIs, and measurement points supplemented with Head-Up Display (HUD) controls and environmental data produce TARV.
Algorithms [15,16,17] evaluate the visibility and characteristics of a rendered battlespace entity based on the formula v i s i b l e = b e a r i n g T o ( u n i t ) a z i m u t h 2     d i s t a n c e T o ( u n i t ) m a x , which can be adjusted using the max distance parameter and viewing criteria (threat factor, distance, and entity potential). The position of the battlespace entity marker is calculated using the following formulas: x = w i d t h 2 + b e a r i n g T o ( u n i t ) a z i m u t h h o r i z o n t a l F O V w i d t h , y = h e i g h t 2 + p i t c h T o ( u n i t ) p i t c h v e r t i c a l F O V h e i g h t . In order to stabilize the position of each and every entity and to compensate for projection movement, a linear filter is applied to process the orientation data. The orientation measurements are stored in a configurable 20-element buffer using a weighting strategy to determine correction for the new value inserted into the buffer.
Tactical orientation (which is aimed at identifying and calculating the locations of any blue or red forces and their spatial relation to the mCOP user) is crucial for effective mission planning and execution and therefore for the application of threat-level evaluation algorithms [5]. The first method used for that purpose is a threat-level evaluation [18], which is based on a model of comparison of two homogeneous forces, which requires the selection of factors that can be measured and assessed for their impact and association with the locally performed combat. Therefore, with this in mind and considering the functionality of mCOP, for this mathematical operation, there is a unit’s aggregated combat potential. This is useful because it gives a sense of requirements for the unit’s size to achieve the desired effectiveness in a specified military action. The definition of combat potential can be found in Reference [4]. Linear interpolation in conjunction with the tables from Reference [19] is a necessary means to acquire the values that can be quickly and easily interpreted by the soldier on the battlefield. The function of the threat level based on the unit’s combat potential is defined in Reference [4].
One of the limitations of this method is that it can be used only as a reference. To improve calculation reliability, mCOP provides an additional method for combat situation evaluation: an attrition model based on Lanchester-type models of warfare [10,14,20].
The unit recognition and threat evaluation model provides configurable parameters, thus providing complex analytic capabilities. It delivers information about estimated combat times and some predictions about who may win the fight. This heterogeneous model better reflects the actual battlefield as opposed to the first method, which is homogeneous. It comprises five categories of a weapon’s potential: armor, air, anti-air, infantry, and artillery (Figure 5). A more detailed description of the implemented Lanchester model can be found in References [4,10,18].

4. Threat-Level Assessment Methods

Implementation of the two methods mentioned above is mainly associated with an AR view in which a soldier can in real time see on his/her device screen important information about the enemy unit, which can be come upon at any moment. That prospect brings into consideration the necessity of a fast and easy way of acquiring this information (Figure 6). An AR component provides two types of unit labels: a compact one serving as general information, which is limited to the most important information, and a second one that is more detailed (Figure 3) and that demonstrates all available characteristics with evaluated analytical data. There exists a mental restriction of data consumed by an individual during an SA [1,2,3] presentation in AR view (this was tested during the project). Such a large amount of data must be interpreted, but most of all accurately absorbed. To prevent that, a detailed data label is displayed only when required. In order to facilitate such functionality, a user can use touch interactions or aim the center of the device at desired assets. Each selected unit can be inspected using an advanced view of its details and potential characteristics (Figure 3). The AR view uses colors (Figure 3, no. 8), which change depending on the threat level value: green is mission success, yellow is an unknown risk level, and red is defeat. Furthermore (Figure 3, no. 9), the application evaluates aggregated potential. Reconnaissance requires speed. All updates (reports) must be swiftly forwarded to higher command. Therefore, there is an urgent need for instant access to vital data for potential computation (Figure 7). These needs are met by a local database that is filled with information about military equipment and predefined templates of units and their equipment, along with the quantity and type of equipment and the potential value of a given equipment type.
Thanks to access to templates, a soldier does not have to manually type in all data about an identified target. This local database is very important, especially in the case of Electromagnetic interference (which is very likely) and interrupted connection to the server. Data downloaded from a server are cached within it, which yields the possibility of usage in spite of the circumstances. Moreover, in such cases, as mentioned above, when a server is down, another mechanism is implemented. The scenario can be saved locally in the device memory as an xml file. This gives an option to send the actual situation using e-mail, not using the service of the damaged server.
The main measure of effectiveness is the time measurement of selected activities conducted using the mCOP application and standard topographical methods. Tests on the efficiency of mCOP situation awareness development were carried out on a population of 39 officer cadets in three groups based on their technology proficiency and tactical training level. Each group consisted of 13 cadets that were pretrained in mCOP mobile application usage and efficient tactical and topographical orientation. All test participants were trained to operate the mCOP application, performing a topographical (spatial) orientation, an assessment of tactical situations, and selected test cases. All tests were conducted on a user’s Android device with an installed and configured mCOP application. Each trial participant performed a series of 10 iterations from each group of tools with different tactical scenarios. For all testing groups, the results indicated that the mCOP application significantly improved scenario orientation by achieving situational awareness, as shown in Table 3. The trial results were implemented using breakpoint time measurements inside mCOP software, and delays were manually checked in the case of analog map activities. An analysis demonstrated that all test cases were considerably better when mCOP mechanisms were used than when traditional manual methods utilizing a map were used. As a result, commanders under the intensity and stress of a combat mission may benefit from AR-based views of a tactical situation and the potential assessments of the developed mCOP software.
To show explicitly the degree of improvement in time needed to complete certain tasks, Table 4 contains the calculated percentage values of how much less time the action took using mCOP than using a map. In two cases (denoted by the “+” sign), mCOP turned out to be not as effective as a traditional method, but both of the presented schemes were performed by a group of operators with a low level of experience. This could have been the main reason for the registered delays and resulting inefficiency. However, operator efficiency improvement was particularly noticeable during complex activities in which a terrain evaluation and fusion (the coordination of actions aimed at map and compass usage) followed by merging the scenario data with mission-assessing data could be maximally supported by the device.

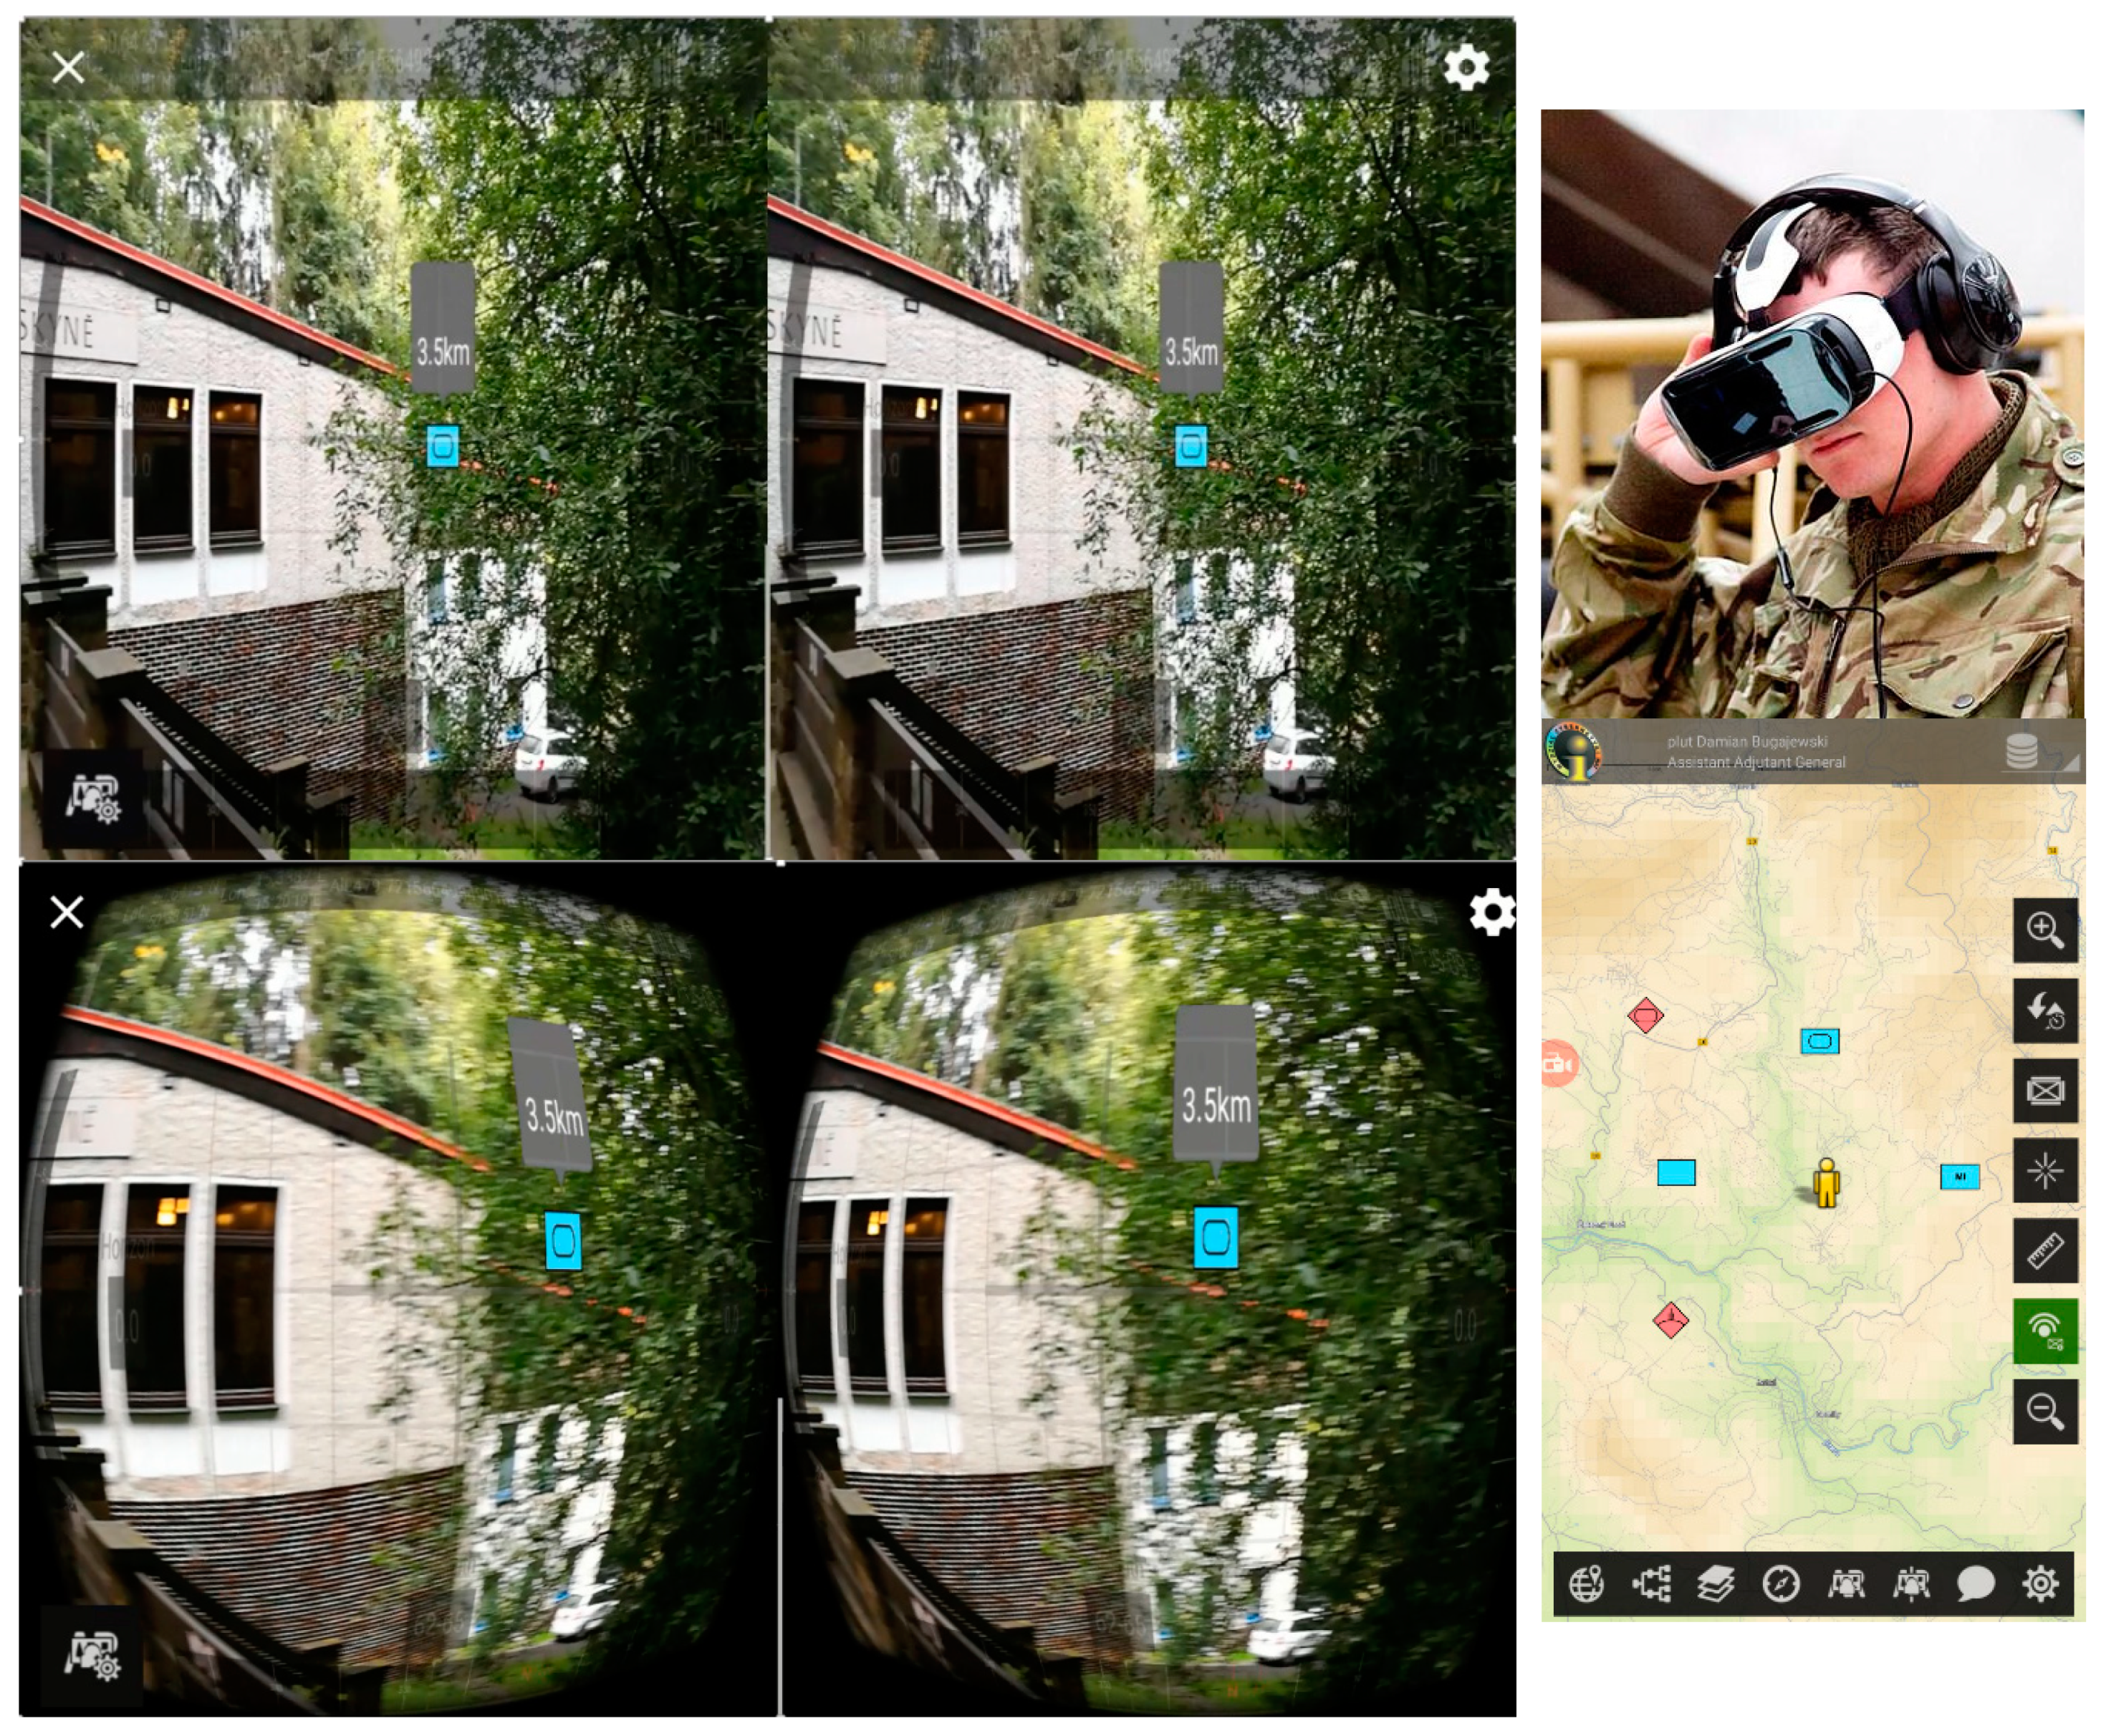
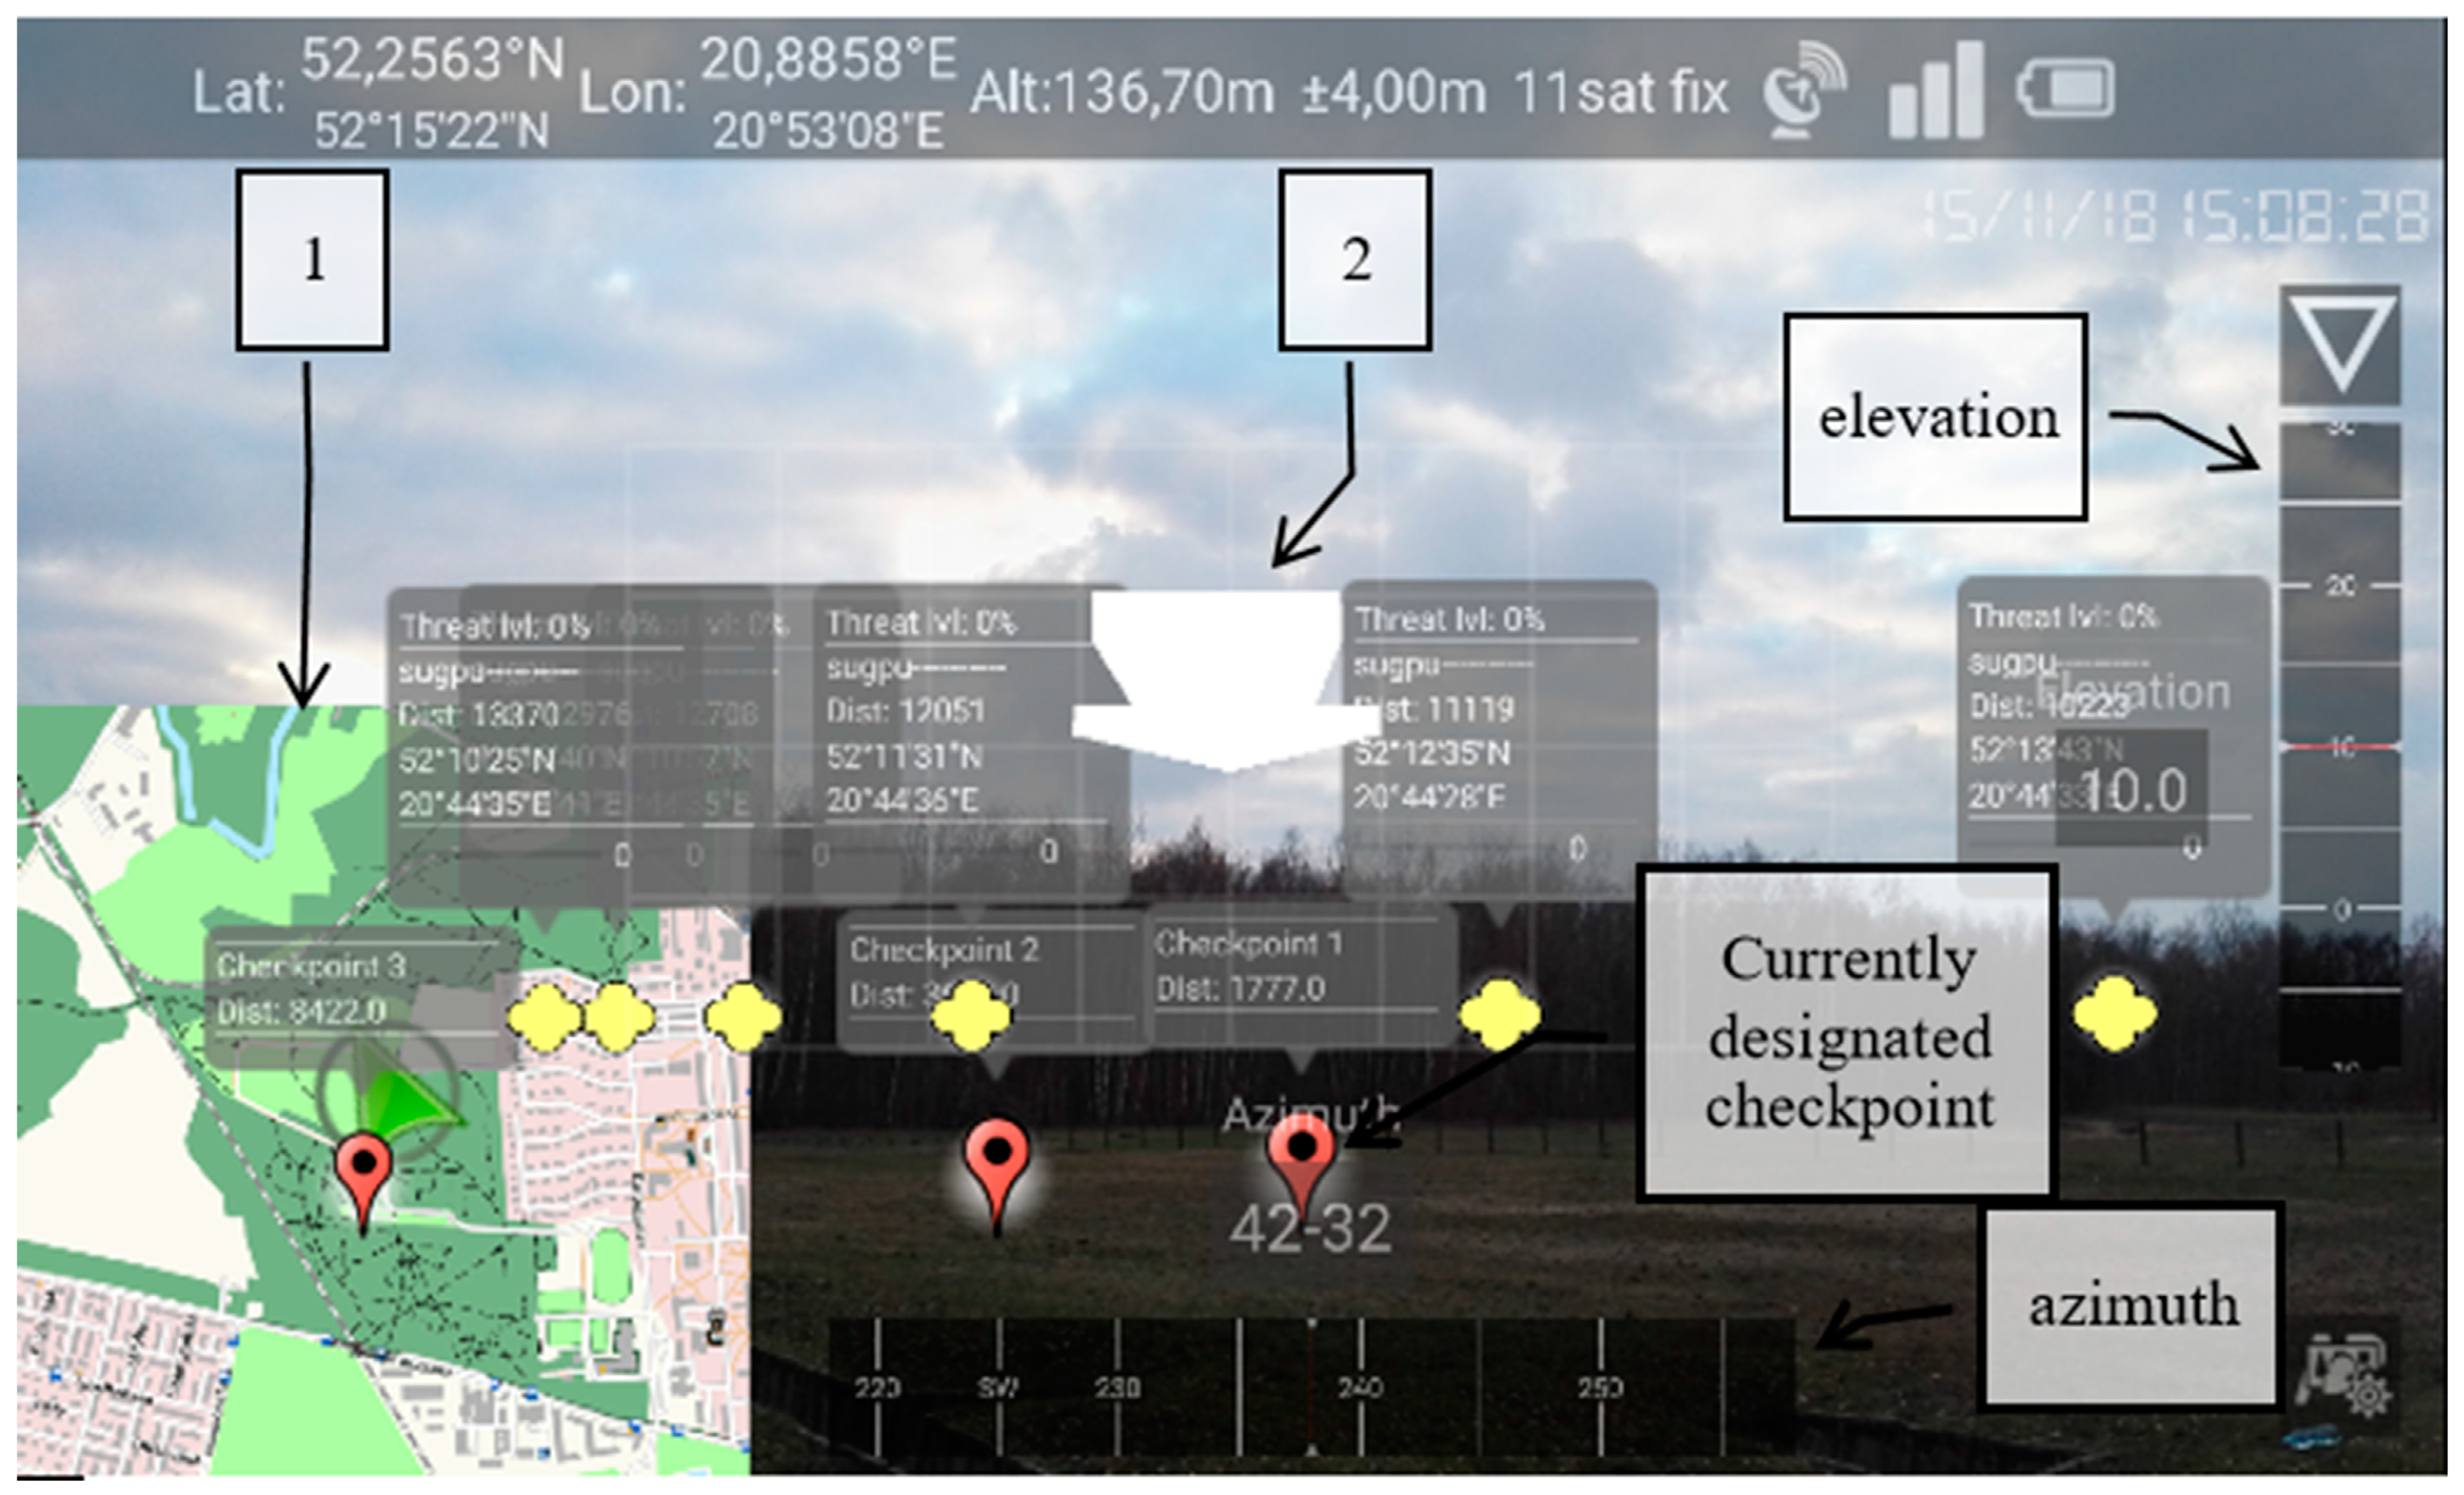
5. Task Guidance and Location Monitoring

Situational awareness on the battlefield can be obtained by utilizing the mCOP application to assess elements of tactical situations in real time. This also considers topographical information that is similar to the exact location (terrain and azimuth) of the given location or object (Figure 8).
Such a feature can be especially useful for reconnaissance units to know where they are and where Blueland and Redland forces are. The capabilities described provide for mCOP activity with an AR view (Figure 3, Figure 5 and Figure 8). The main computations of data derived from a device’s sensors are made through a route trace component. This component is strictly associated with the activity mentioned above. The arrow that indicates the direction and azimuth of a given point in the terrain is painted on the screen of the device through an OpenGL ES component, which is also responsible for calculating the rotation of this arrow. These calculations are based on data obtained from the device’s position as well as motion sensors (mainly magnetometer and accelerometers). The combined components deliver functionality for route management and guidance. In a real scenario, the user-soldier determines the required (preferred) checkpoints on the map as characteristic mission points. The coordinates are input data for an algorithm that determines the azimuth arrow’s direction, which is additionally corrected by the tilt of the handheld. In addition, the component (android activity) contains a map overview, which indicates the exact location of the soldier, and compass data merged with the map view. Such a functionality composition delivers simplified actions for the recon soldiers to track their route and determine mission-related objects. The route tracking and topographical orientation can be easily accessed in TARV, which also fuses tactical data and is able to modify the route and characteristic points accordingly to recognize enemy threats, increasing situational awareness but most of all providing decision support. Moreover, the fusion of mission guidance (Figure 8 and Figure 9) and instant object reporting (Figure 10 is able to significantly decrease time delays during movement and recon missions.

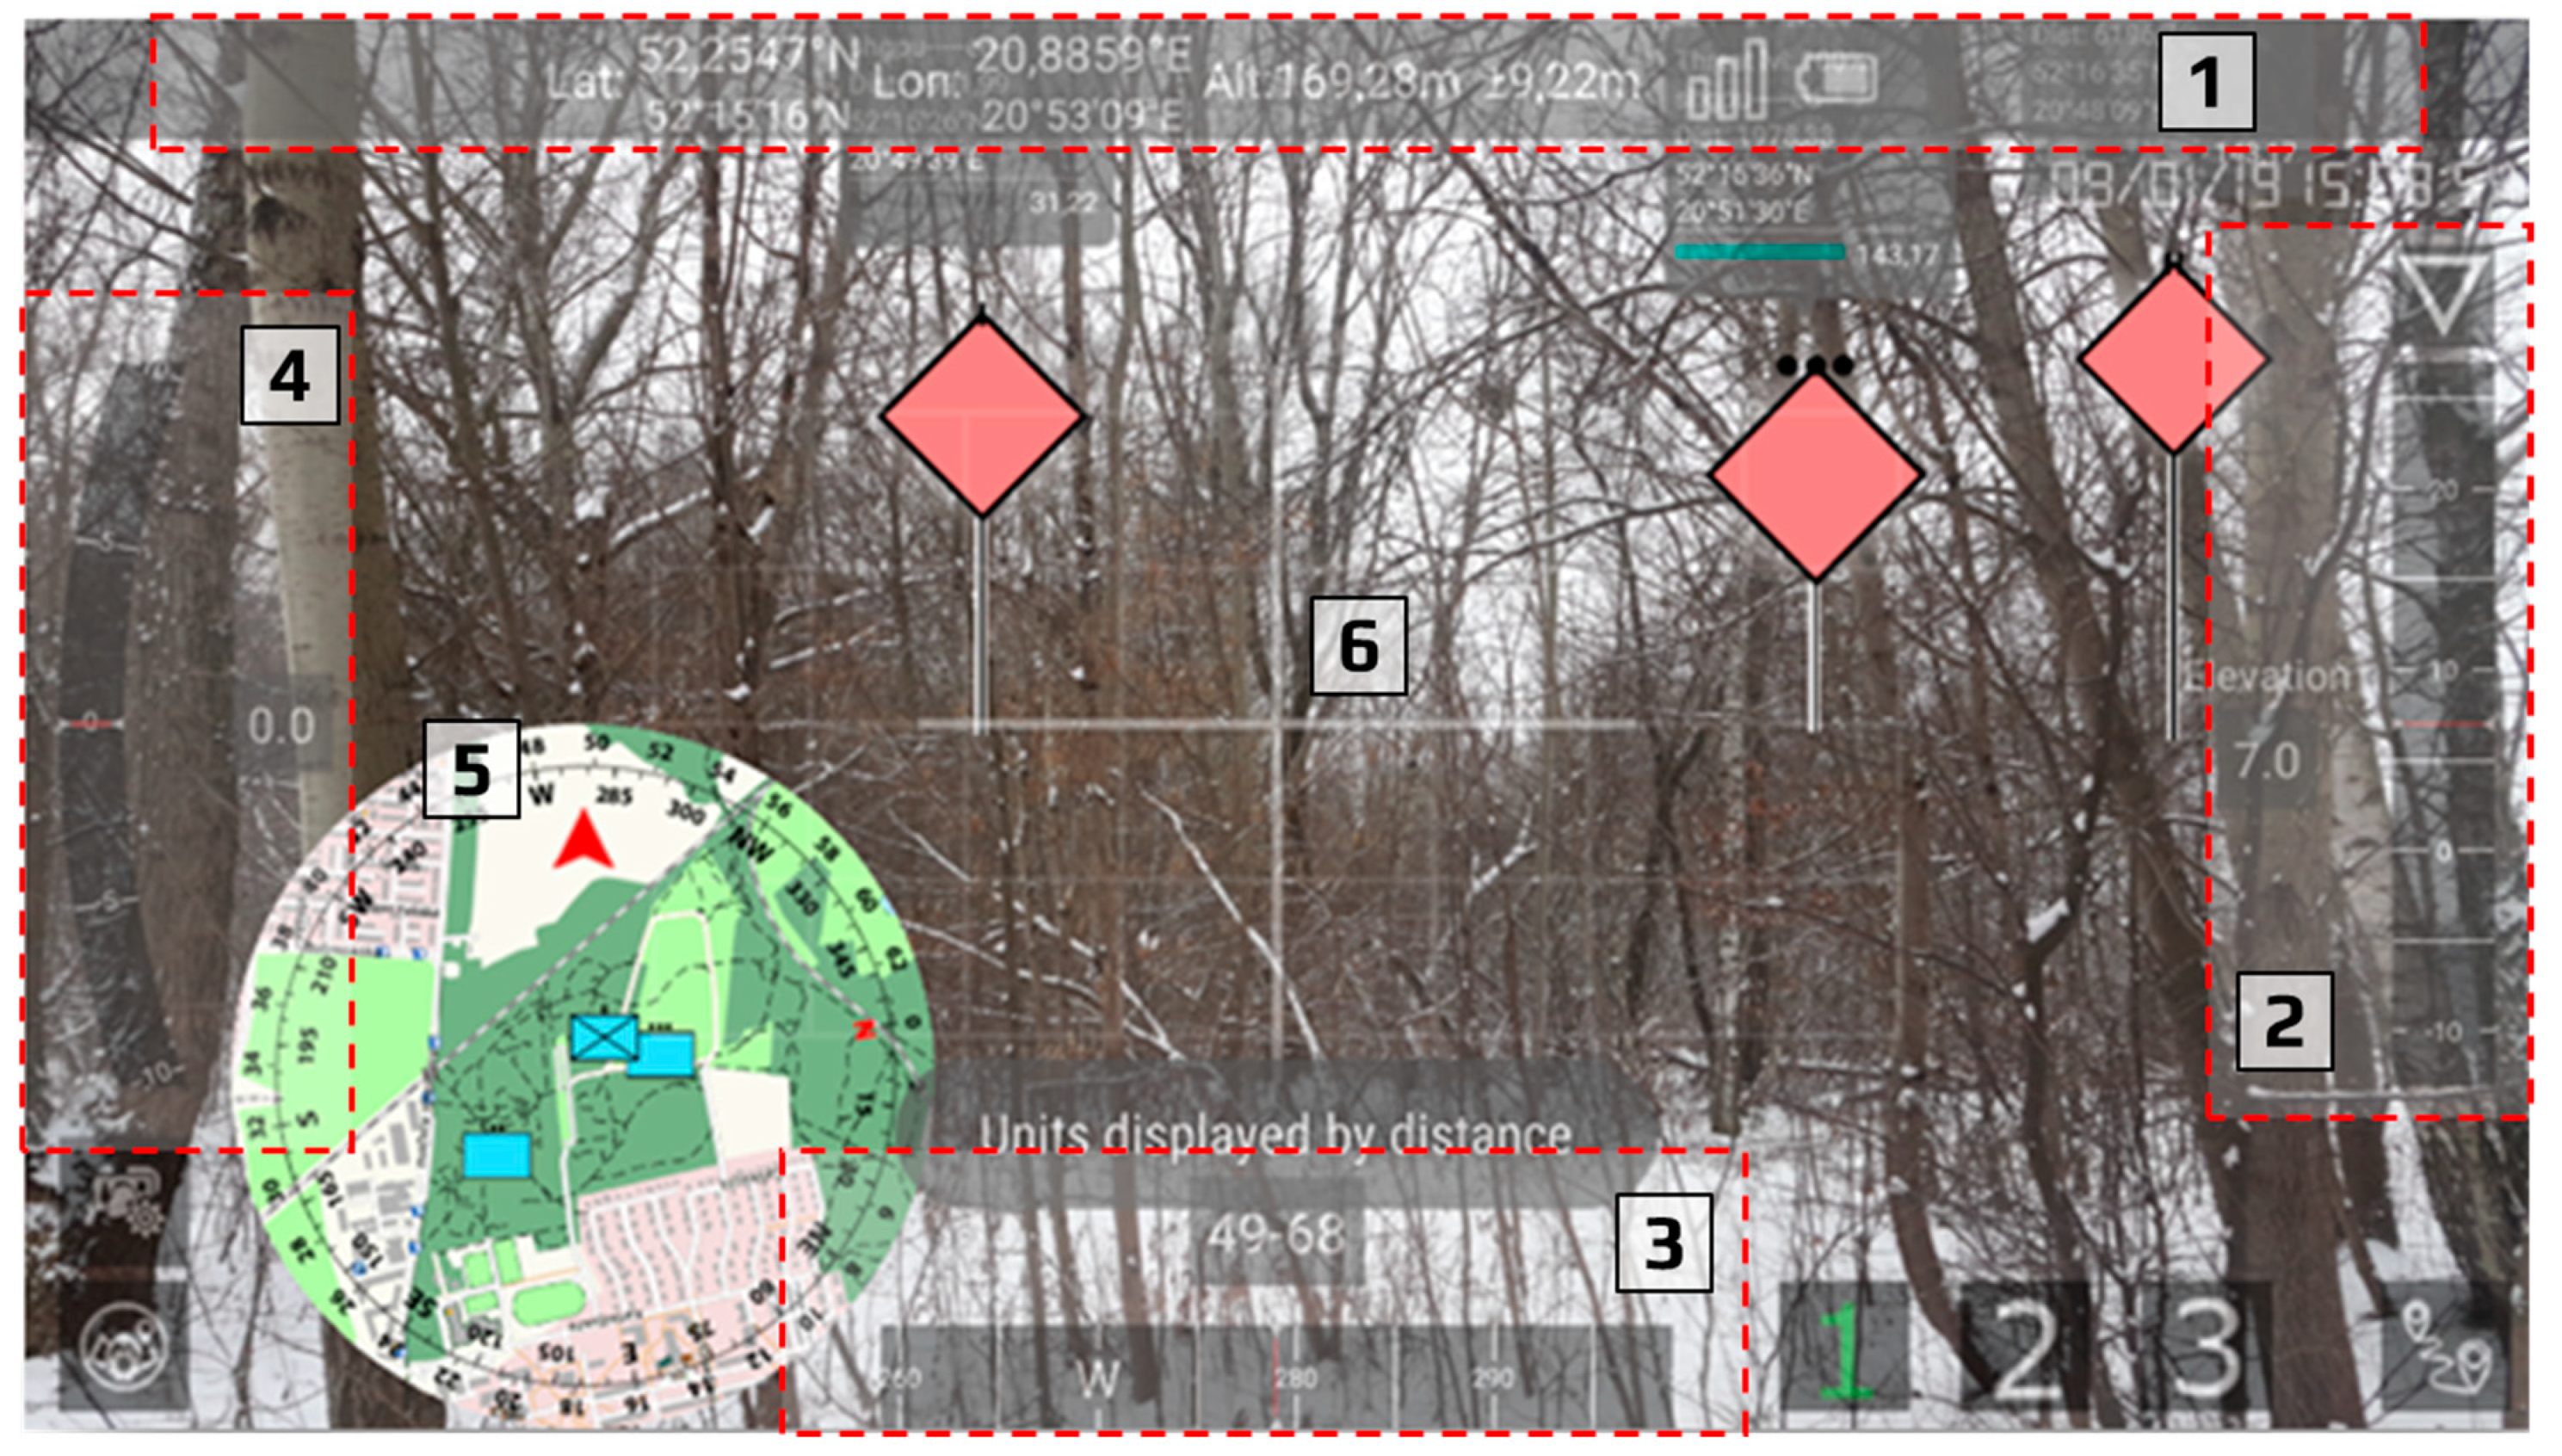
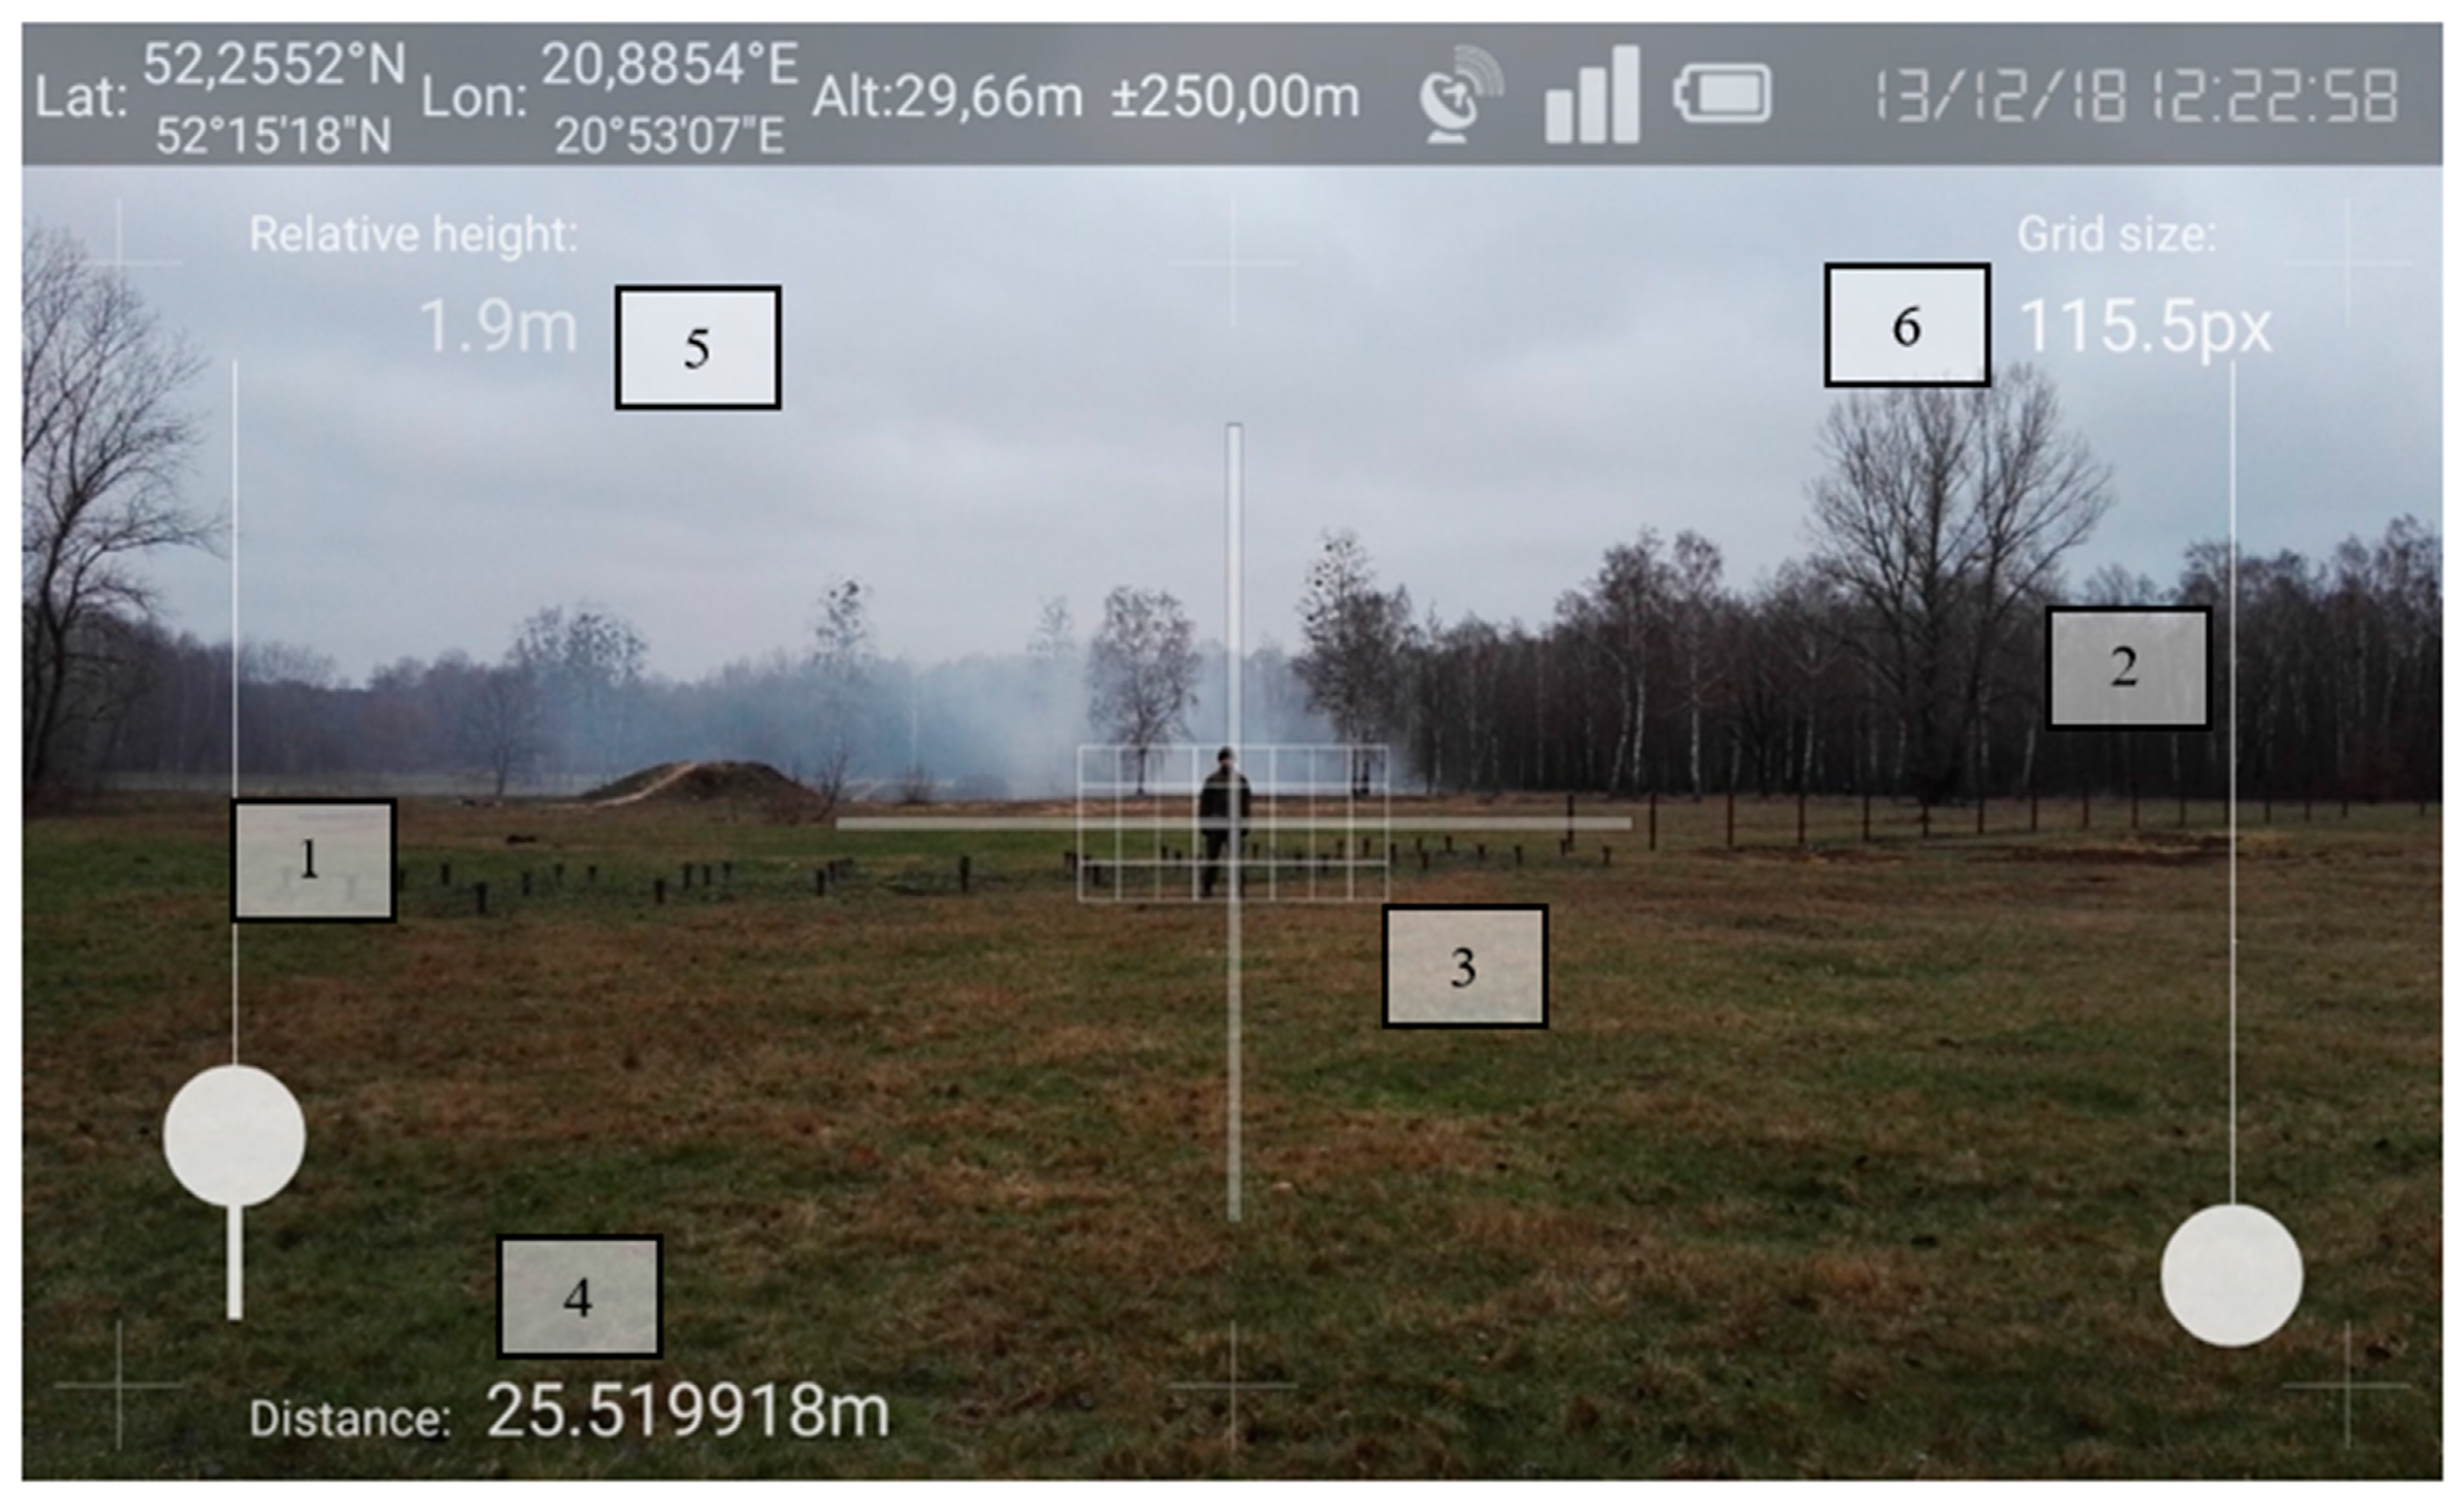
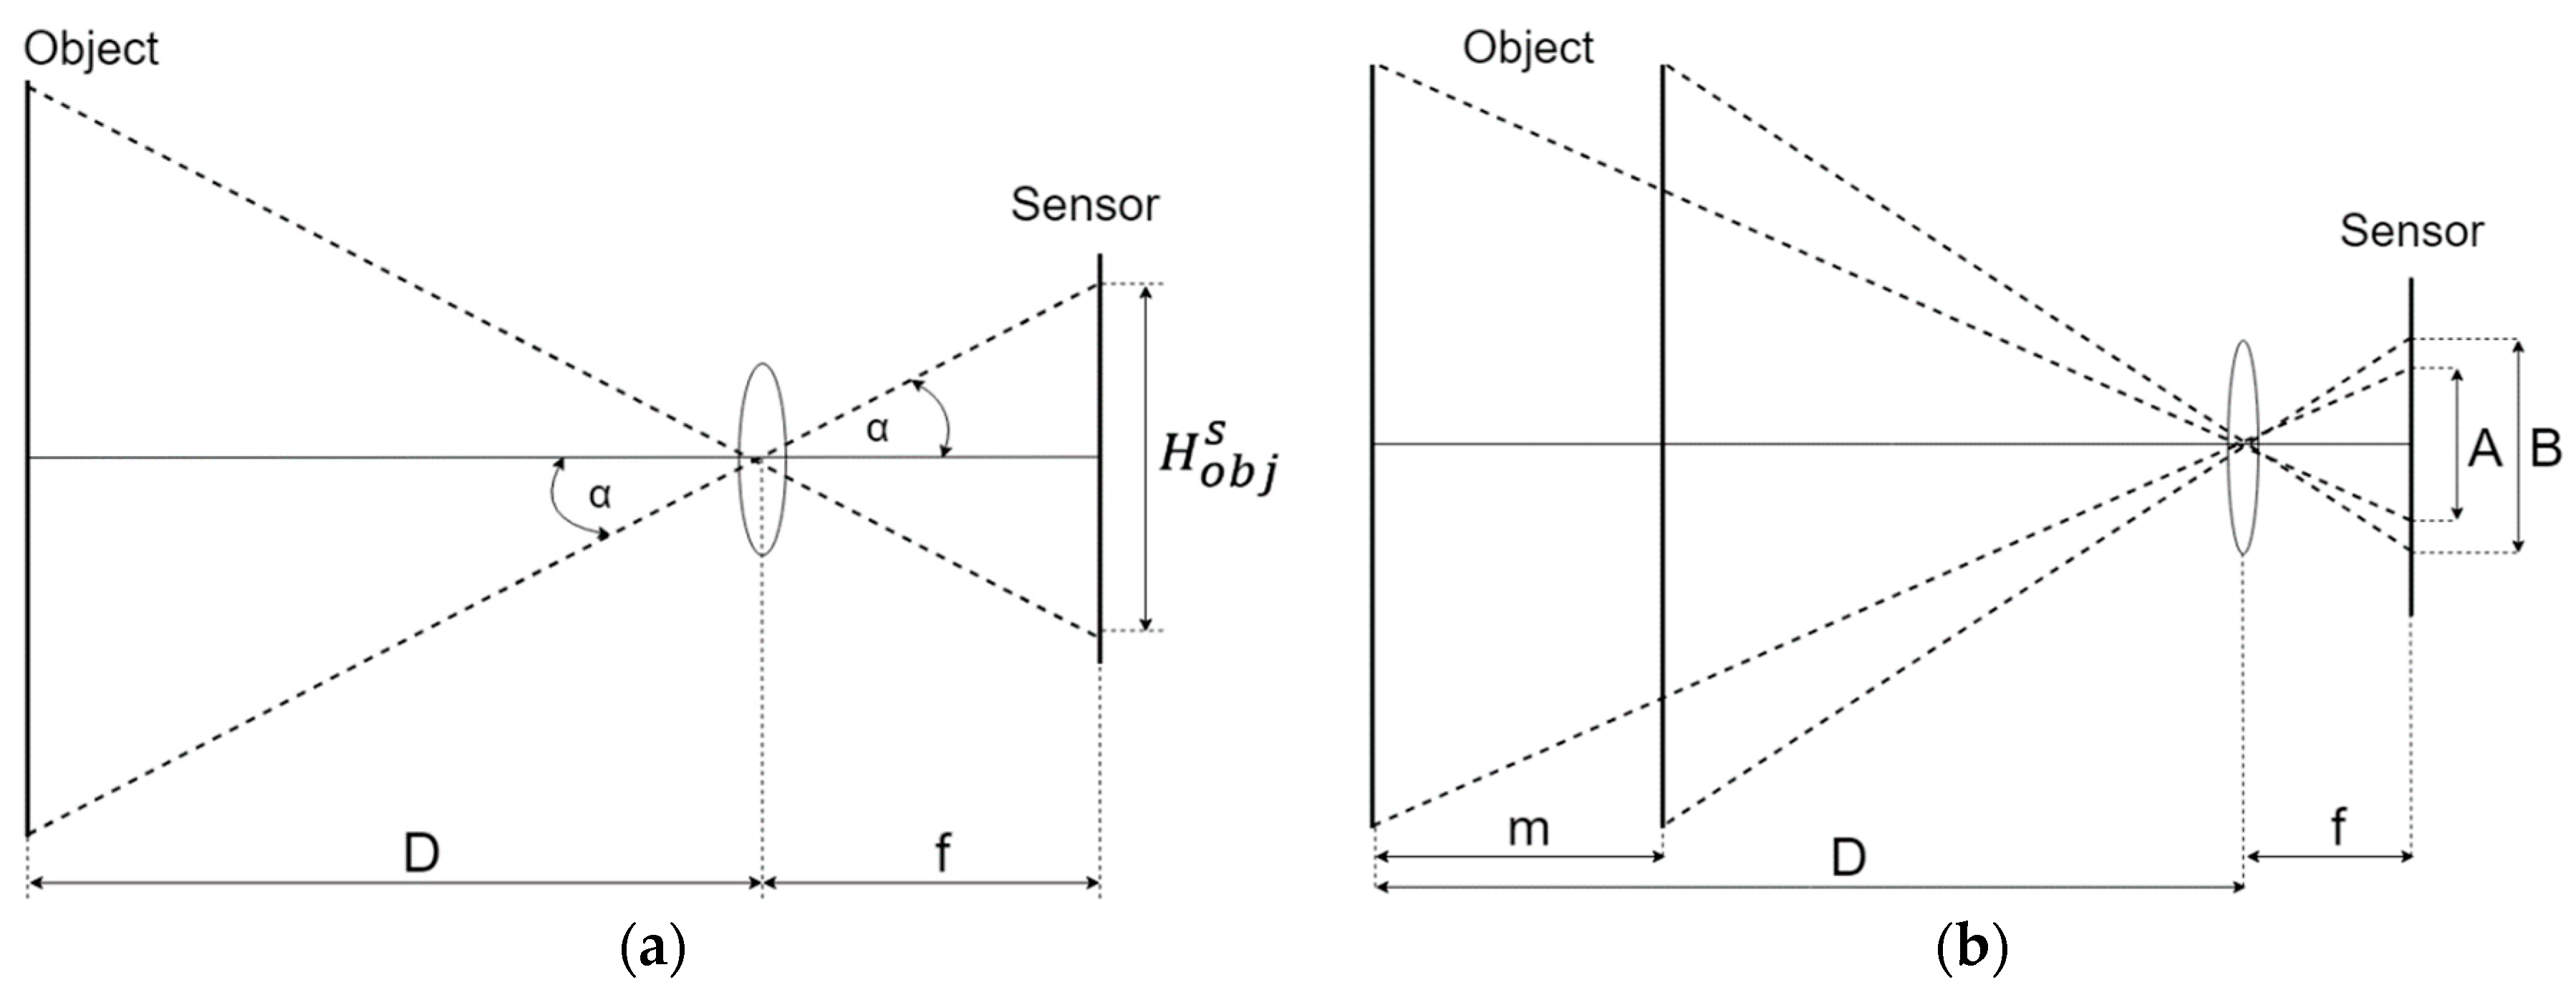
6. Methods for Reconnaissance Support

A smartphone’s camera, besides having the ability to capture images and record video, enables the possibility of measuring the relative distance between a designated target and an operator. Estimation of the distance is possible with the use of basic calculations supported with specific camera parameters in a constructed recon augmented reality view (RARV). The presented research is a case study on the development of algorithms utilizing a smartphone’s camera for the purpose of automatic object detection and location calculation. A mobile tool is perfect and is tuned to perform stealthy picture and sensor-based measurements. The application of augmented reality mechanisms can extend the capabilities of manually taken pictures by assisting the operator with picture adjustment options, instant measurement annotations, and error estimates. Augmenting the view of a reported object with tactical surroundings or other battlespace objects can increase the decision superiority of higher levels of command. Reported pictures are supplemented with metadata and are processed in original form, and layered GIS, sensor, and tactical layers are separately rendered onto the screen. The advantage of this approach is that the C2 unit receives a compendium of the current situation and the reported (identified) object. This utility may be used, for example, by territorial defense forces, civilians, or soldiers, who use mobile devices to support their actions during military operations. It is necessary to provide a security layer to secure mobile applications from violating security rules during operations. The usefulness of reconnaissance executed through a mobile tool is achieved through the possibility of performing quick measurements (three interactions/screen touches) and then sending asynchronously derived data to the servers of command centers. The mCOP tool, which is based on geolocation data, azimuth, and the distance to an object, may determine the position of the reported object. This article presents two techniques used to calculate an object’s distance. Method A utilizes Thale’s theorem and the known object height, and alternatively, Method B uses the object size difference projected onto a digital sensor gathered from separate snapshots (Figure 11). These methods can measure the distance of two dimensions of an object: width and height. For the purpose of this article, the authors used height. In Method A, the proportion of focal length and the height of the object on the image sensor is the same as the proportion of the distance to the object’s real height: H o b j D = H o b j s f , where H o b j denotes the real height of an object, D denotes distance to this object, H o b j s denotes the object height on the digital sensor, and f denotes the focal length. After transformation, we can get a formula to calculate distance: d = H f H o b j s . It is possible to read the value of focal length from the camera parameters provided by Camera API. In this case, where the distance measurement is used on a smartphone, the focal length value is constant. Real object height can be entered manually or can be automatically detected (OpenCV). The object’s height (projected in the sensor) can be computed. In this case, it is necessary to fit a grid to the object seen in the preview. The discrepancy between the sensor format (4:3) and the preview format (16:9) must be included in the calculations due to the Android system transforming the image taken from the sensor into the image projected in the preview. Consequently, the image in the preview has another dimension. The transition of the image on the sensor into the image in the preview consists of the software cropping the top and bottom of this image: H o b j s H S = H o b j p H p + H d , where H S denotes the height of the sensor, H o b j p denotes the object height in the preview of the mCOP application, H p denotes the height of this preview, and H d denotes the difference in height between format 4:3 and format 16:9. The formula after calculating the described transitions, D = f H o b j ( H p + H d ) H S H o b j p , considers image sensor height. This is rarely specified in the documentation provided by the smartphone producer. Android version 5.0 (API 21) [21] (and above) delivers a new version of Camera API (Camera2), providing information about camera sensor size. However, on Android devices with software below API 21, the sensor size must be entered manually or calculated. The crop factor parameter describes a camera sensor size compared to a reference format. This concept refers to digital cameras (located in smartphones) relative to a 35-mm film format (43.3-mm diagonal) and is an important parameter in the calculations, as it describes the size of projected pictures. The most commonly used definition of a crop factor is the ratio of a 35-mm frame: C F = d 35 m m d s , where C F denotes the crop factor, d 35 m m denotes the diagonal of a 35-mm film format, and d s denotes the diagonal size of the sensor. Another definition of CF is C F = E q f 35 m m f , where E q f 35 m m denotes the 35-mm equivalent focal length. From the relation between the focal length and the 35-mm equivalent focal length, we can obtain the CF value.
As a result of previous assumptions, we can obtain a diagonal measure of the image camera sensor: d s = d 35 m m C F . In order to calculate sensor dimensions (format 4:3), we apply given relationships, ( 4 x ) 2 + ( 3 x ) 2 = d s 2 , W S = 4 d s 5 , H S = 3 d s 5 , where W S denotes the width of a sensor. Information about the camera angle of the view is located in the Camera API parameters. The angle of a view can be computed from the effective focal length and chosen dimension, and thus we obtain the height of the sensor: α = 2 a r c t a n ( S 2 f ) , H s = t a n ( A O V h o r 2 ) 2 f . The proposed alternative Method B uses the additional measurement of the object and the distance taken from a location where the distance is known or has been previously evaluated. In the case where the height of the object cannot be determined, there are methods to utilize the proportion or relative size comparison. As a result, Method B requires two separate measurements (surveys) taken from two different locations (distance from each other more than 5 m). The proportion between heights of an object on a sensor and the distance difference obtained from these two measurements is equivalent. Thus, Method B calculations determine that A f = tan θ 1 = H D , B f = tan θ 2 = H D m , m D = 1 A B , D = m 1 A B , where m denotes the distance difference between two measurements, A denotes the object height on the sensor from the first measurement, and B denotes the object height on the sensor from the second measurement.

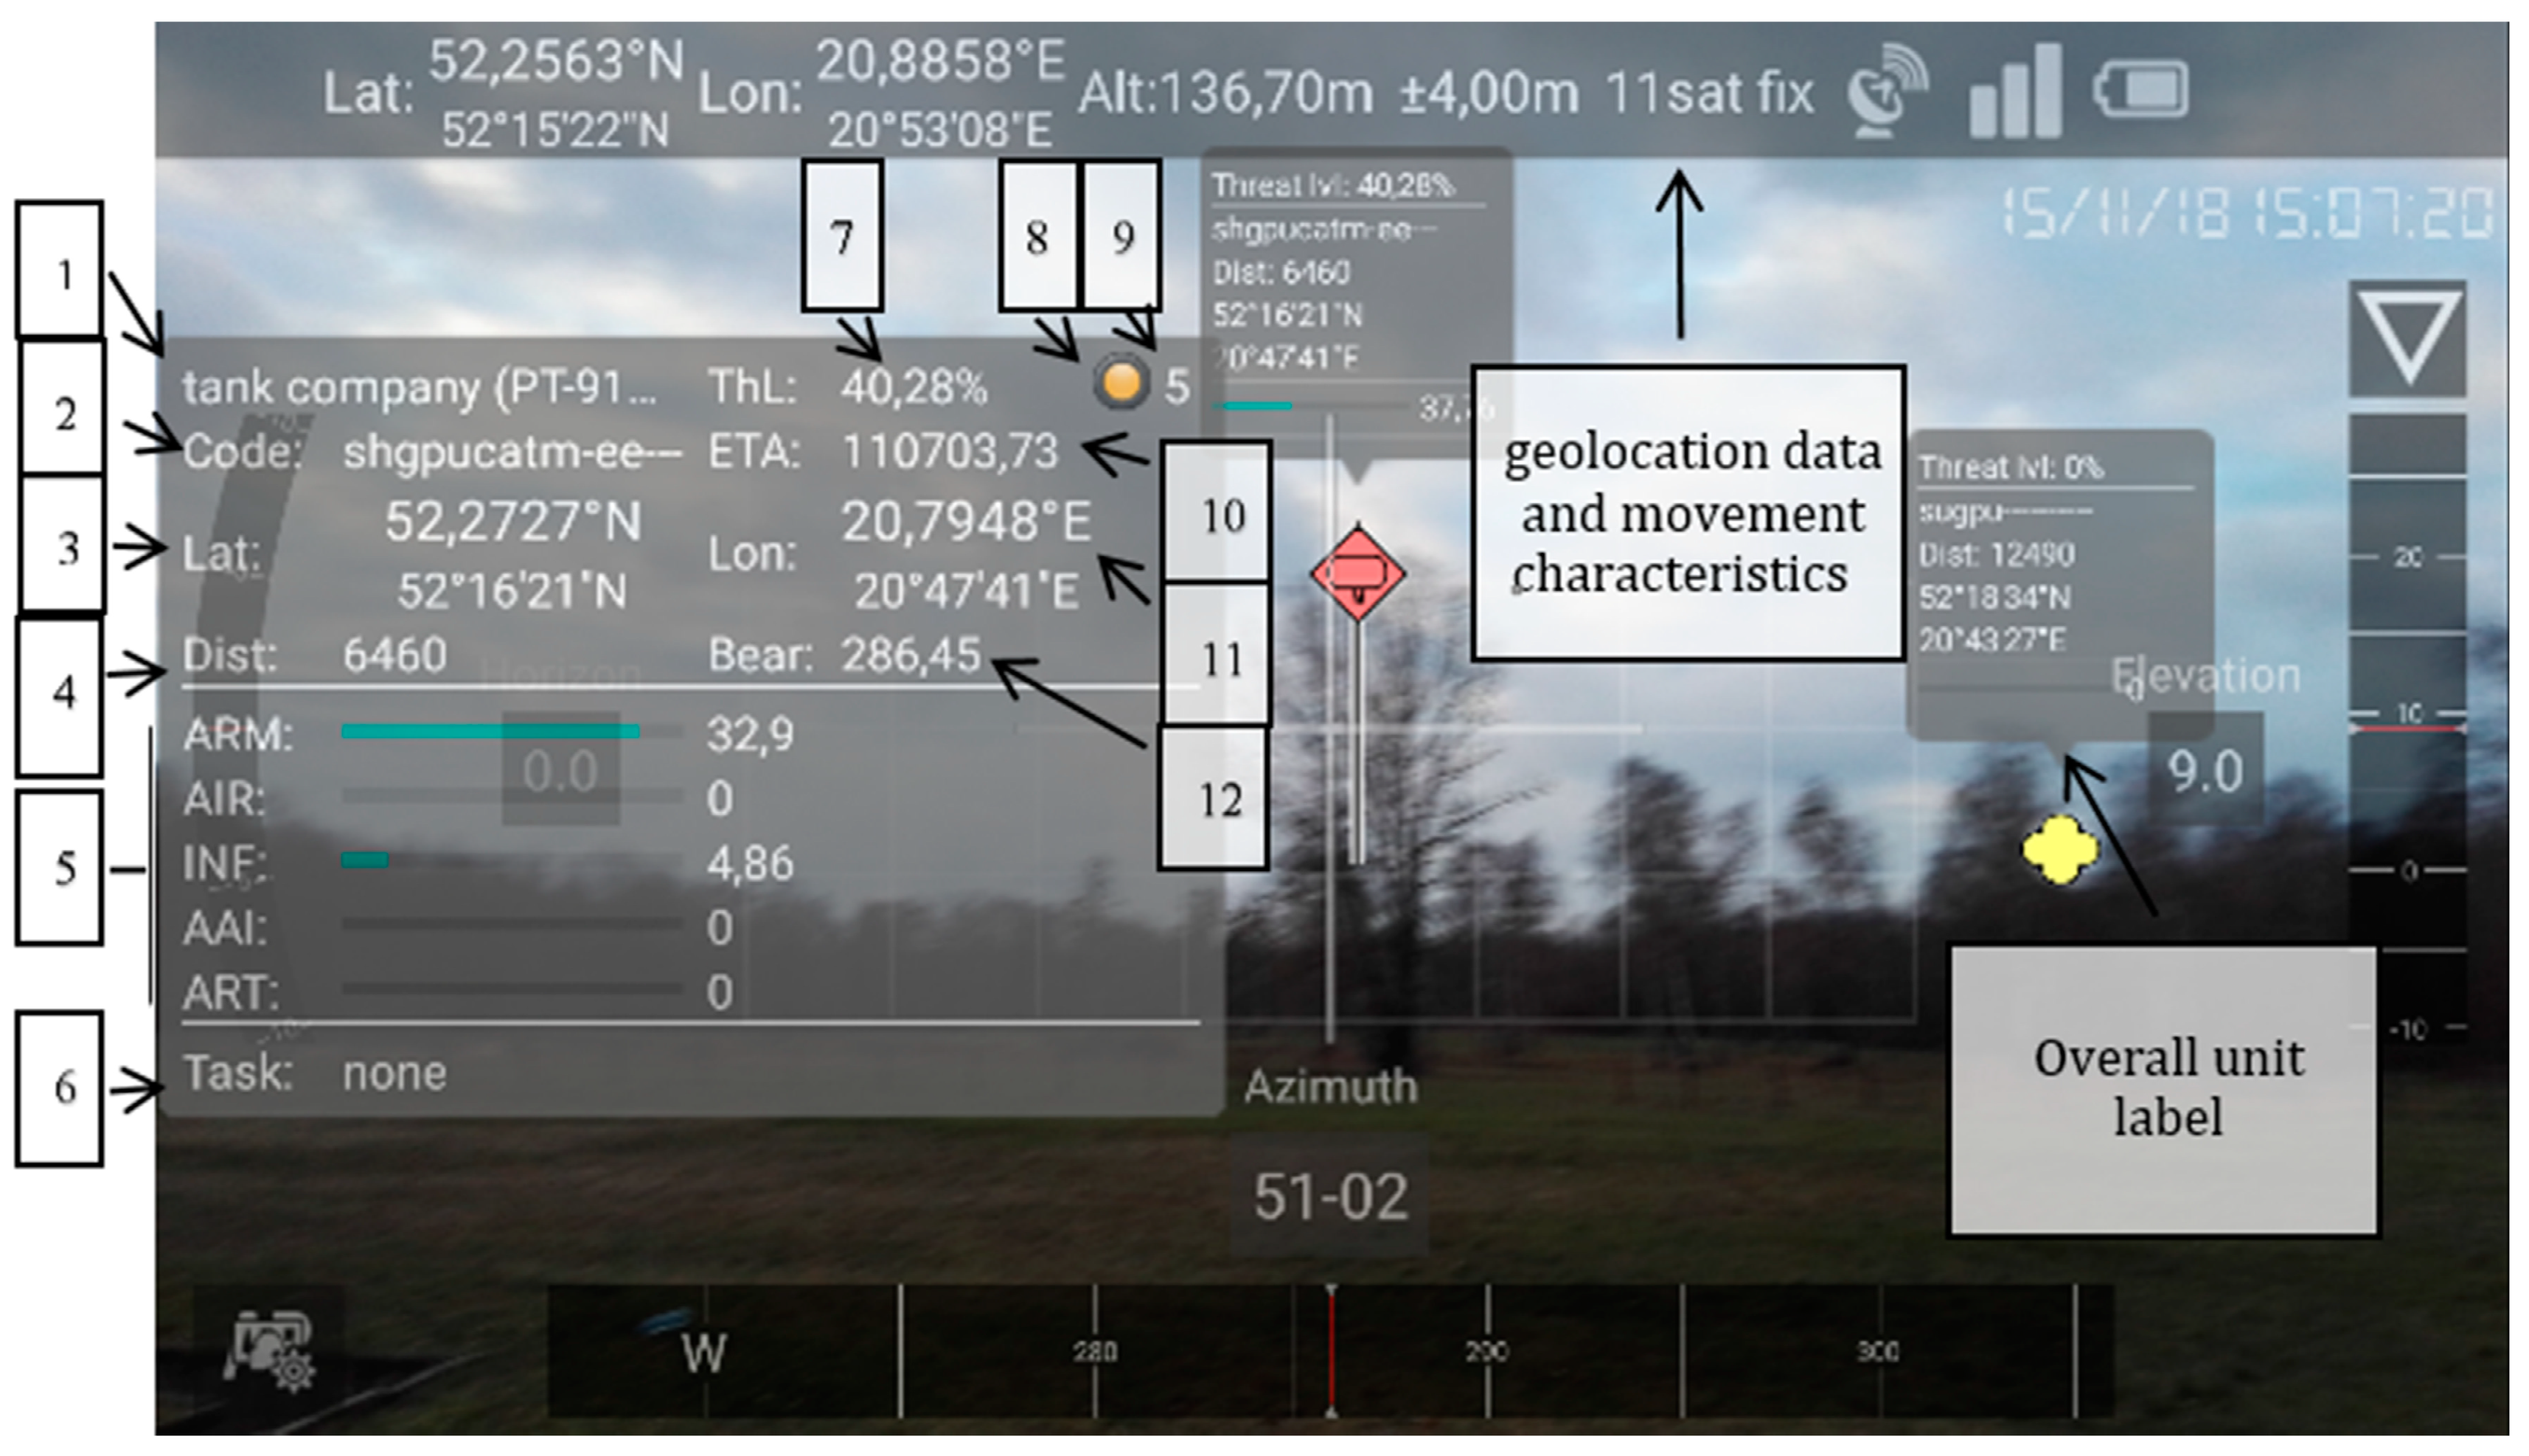
7. Measurement Data Reports

Measurements was carried out on several devices with the following characteristics: focal length 2,38 (mm), image height 3120 (px), and sensor height 2,21 (mm). Presented in Table 5, the measurements (1–6) were conducted under field conditions where camouflaged soldier recognition and identification was performed.
The device was held by an operator 1.80 m in height at his eye level. As can be seen, Method A had much more accuracy in studies 1–6. This was due to the inaccurate identification of distance difference between two measurements, which is generally hard to do in field conditions. The confirmation for this was the difference in accuracy between the results obtained in measurement 4 and the others. In this case (4), the distance difference was accurately measured, but in other cases it was only estimated. Measurements 7–8 were conducted under laboratory conditions at small distances, and the observed object’s size was 10 × 10 cm.
The reference measurements were taken with a stabilized smartphone and measuring tape. In those tests, a similar level of precision was obtained (Table 6). The inaccuracy of the field studies was mainly caused by the imprecise representation of introduced (reference) parameters such as distance difference (for Method B). Another factor that increased the measurement error was the imprecise cropping of the reported object (performed by the application’s operator). The operator was required to capture the reported object on the measuring grid: the more accurate this procedure is when performed, the better the resolution of measurements that are achieved will be. Moreover, the size of the measuring grid is a key component of the calculations and thus the distortion evaluation and mechanisms for serial snapshots. An additional solution for the problem of inaccurate boxing of an object is the application of image processing libraries, which can automatically create and measure a bounding box over a central object. The utilization of machine learning methods can support automatic object detection and capture in order to provide accurate battlespace object identification and measurement. In order to measure objects over 30 m away, image stabilization is necessary. Simulation was carried out with Sigma 150–600 f/5-6.3 DG OS HSM lens: focal length: 600 [mm], image height [px] 3120 [px], sensor height 4.62 [mm], object height 4 [m]. In order to maximize precision of measurement, it is proposed to use coupled with smartphone optical system.
In the case of deviations in measurements, to resolve the problem of inconsistent data, the authors propose a triangulation method, which can be developed also on a smartphone. This method uses triangle properties, particularly the method that allows for calculating the height of a triangle based on its angles. Processing a few measurements allows for creating a triangle. On the basis of the azimuth to which the phone is directed and the precise distance of the measurement points, it is possible to calculate the angles and distance to the object. The following formula describes the triangulation method: d = l s i n α s i n β sin ( α + β ) , where d denotes the distance to the object (triangle height), and l denotes the distance between points where the measurements were taken. The obtained value of the distance to the detected object is transferred to the headquarters, where it is applied to the actual tactical or operational situational image and then resent to all subordinates. This common knowledge is the essence of the situational awareness required on the battlefield. The responsibility of each commander is raising the situational awareness of their subordinates by all means (Figure 12 and Figure 13). As already shown, this article presented mechanisms that provide for the ability to realize such requirements.

8. Conclusions

The presented algorithms and applied augmented reality views deliver quantitative methods for combat entity evaluation to support decision-makers and individual soldiers in the development of their situational awareness. Such compositions of features incorporate understanding of the environment and the combat situation. The demonstrated characteristics of the mCOP application provide an information infrastructure for military and civilian crisis operation support delivered as a handheld tool integrated with a tactical network. The developed algorithms and software utilize mission-critical element rendering to present an updated image of surrounding units and combat elements. A designed novel approach to utilizing TARV has proven to be an efficient tool to visualize the operational picture and assist combat personnel during a mission by decreasing significantly the required time for topographical and tactical orientation: key combat (decision-maker) responsibilities. Augmented reality has been proven to be a key technological factor that constructs an operational view tailored to a commander’s or soldier’s needs. The fusion of GIS, tactical C4ISR, and handheld sensor data provide new means for interpreting the surrounding environment and can increase the efficiency of performing complex tasks. The wireless integration of handhelds and AR headsets can provide even more immersive presentation for operators, simplifying threat evaluations in rapidly changing environments. The architecture of the mCOP environment has been iteratively verified and validated in several possible communication configurations utilizing WiFi-based tactical networks as well as GSM–LTE solutions. The application of a TARV-based view supplemented with potential calculations and threat-level estimations results in a decrease in tactics development delays, thus increasing decision-making efficiency (only in exercise scenarios).
Tactical and topographical orientation, the key activities during combat, have been significantly shortened, delivering more accurate products. The results show that the time required to perform tasks decreased by ~46% and increased recognized asset reporting with location by ~76%. The trials involved tasks performed outdoors based on simulated data transmitted into the mCOP environment, where the operators (officer cadets) were required to perform a mission based on the projected dynamically changed situation. Each mCOP operator was monitored by auditing an observer assisted with automatic time reporting for SA-related activity time measurement. The presented mechanisms, algorithms, and applications utilizing augmented reality views can be applied not only for military operations but most of all for crisis management and emergency response missions/actions.
The presented capabilities and properties of the constructed software tools demonstrate the applicability of mobile software for operational forces but most of all for territorial defense formations. The mCOP platform utilizes an Android platform, and any commercially available smartphone can be prepared for its deployment after fulfilling all security requirements and configuration procedures.

Author Contributions

M.C. have been responsible for the overall design of the study and formulated research thesis and theme of the manuscript. M.C. Is the architect of the mCOP and tCOP environments, K.S. developed the potential comparison method and components, M.S. contributed the algorithms for image reconnaissance and distance measurements. The experiments have been designed by M.C., K.S. and M.S., specific component related data has been processed by K.S. and M.S. M.C. contributed to the overall text unification, synthesis and results analysis as well as final proofreading of the manuscript. M.S. and K.S. implemented software, gathered and processed experimental data as well as scenario images in contributed materials.

Funding

The project has been partially supported by EDA grant Shared situational awareness in EU-led CMO and research project DOBR/0023/R/ID3/2013/03 founded by the Polish National Center For Research and Development.

Acknowledgments

We gratefully acknowledge the contribution of software components coauthors mCOP, tCOP and SymSG Border Tactics decision support software

Conflicts of Interest

The authors declare no conflicts of interest.

References

  1. US DoD (US Department of Defense). Department of Defense Dictionary of Military and Associated Terms, Joint Publication 1–02; US Department of Defense: Washington, DC, USA, 2009.
  2. Taylor, J.G. Lanchester Type Models of Warfare vol. I, Operations Research, Naval Postgraduate School Monterey. 1980. Available online: http://www.dtic.mil/dtic/tr/fulltext/u2/a090842.pdf (accessed on 16 January 2018).
  3. NC3A. NATO Common Operational Picture (NCOP)—NC3A; NATO Consultation, Command and Control Agency: Brussels, Belgium, 2006. [Google Scholar]
  4. Chmielewski, M. Data fusion based on ontology model for common operational picture using OpenMap and Jena semantic framework. In Proceedings of the Military Communications and Information Systems Conference, Cracow, Poland, 22–24 September 2008. [Google Scholar]
  5. Hall, D.L.; Llinas, J. Handbook of Multisensor Data Fusion; CRC Press: Boca Raton, FL, USA, 2001. [Google Scholar]
  6. Chmielewski, M.; Sapiejewski, K. Augmented reality mechanisms in mobile decision support systems supporting combat forces and terrain calculations-a case study. In Proceedings of the Geographic Information Systems Conference and Exhibition “GIS ODYSSEY 2018”, Perugia, Italy, 10–14 September 2018. [Google Scholar]
  7. Chmielewski, M.; Kukiełka, M.; Gutowski, T.; Pieczonka, P. Handheld combat support tools utilising IoT technologies and data fusion algorithms as reconnaissance and surveillance platforms. In Proceedings of the 2019 IEEE 5th World Forum on Internet of Things (WF-IoT), Limerick, Irleand, 15–18 April 2019. [Google Scholar]
  8. Chmielewski, M.; Gałka, A. Semantic battlespace data mapping using tactical symbology. In Advances in Intelligent Information and Database Systems; Springer: Berlin, Germany, 2010; Volume 283, pp. 157–168. [Google Scholar]
  9. Bonder, S. Army operations research—Historical perspectives and lessons learned. Oper. Res. 2002, 50, 25–34. [Google Scholar] [CrossRef]
  10. Chmielewski, M. Situation awareness tools supporting soldiers and low level commanders in land operations. Application of GIS and augmented reality mechanisms. In Proceedings of the Geographic Information Systems Conference and Exhibition “GIS ODYSSEY 2017”, Trento, Italy, 4–8 September 2017. [Google Scholar]
  11. Caldwell, B.; Hartman, J.; Parry, S.; Washburn, A.; Youngren, M. Aggregated Combat Models. Operations Research Department—Naval Postgraduate School Monterey. 2000. Available online: https://faculty.nps.edu/awashburn/Washburnpu/aggregated.pdf (accessed on 16 January 2018).
  12. UK MoD (UK Ministry of Defence), 2005, Network Enabled Capability, Joint Service Publication 777. Available online: http://barrington.cranfield.ac.uk/resources/papers/JSP777 (accessed on 1 April 2017).
  13. Endsley, M.R.; Garland, D.J. Situation Awareness, Analysis and Measurement; CRC Press: Boca Raton, FL, USA, 2000. [Google Scholar]
  14. CEN. Disaster and Emergency Management—Shared Situation Awareness—Part1: Message Structure; CEN: Brussels, Belgium, 2009. [Google Scholar]
  15. Chmielewski, M.; Kulas, W.; Kukiełka, M.; Frąszczak, D.; Bugajewski, D.; Kędzior, J.; Rainko, D.; Stąpor, I.P. Development of Operational Picture in DSS Using Distributed SOA Based Environment, Tactical Networks and Handhelds; Information Systems Architecture and Technology: Selected Aspects of Communication and Computational Systems; Springer: Berlin, Germany, 2014; ISBN 978-83-7493-856-3. [Google Scholar]
  16. Chmielewski, M.; Kukiełka, M.; Frąszczak, D.; Bugajewski, D. Military and crisis management decision support tools for situation awareness development using sensor data fusion. In International Conference on Information Systems Architecture and Technology; Springer: Cham, Switzerland, 2018; pp. 189–199. [Google Scholar]
  17. Chmielewski, M.; Kukielka, M. Applications of RFID technology in dismounted soldier solution systems—Study of mCOP system capabilities. In MATEC Web of Conferences; Edp Sciences: Les Ulis, France, 2016. [Google Scholar] [CrossRef]
  18. Wołejszo, J. Ways of Calculating Combat Potential of Unit, Formation and Command (Sposoby Obliczania Potencjału Bojowego Pododdziału, Oddziału i Związku Taktycznego); National Defense Academy: Warsaw, Poland, 2000. [Google Scholar]
  19. Polish General Staff. 1299/87, (PGS, 1988), Podstawowe Kalkulacje Operacyjno-Taktyczne (Basic Operational-Tactical Calculations); Polish General Staff: Warszawa, Poland, 1988. [Google Scholar]
  20. Taylor, J.G. Lanchester Type Models of Warfare vol. II, Operations Research, Naval Postgraduate School Monterey. 1980. Available online: http://www.dtic.mil/dtic/tr/fulltext/u2/a090843.pdf (accessed on 16 January 2018).
  21. Codenames, Tags, and Build Numbers. Available online: https://source.android.com/setup/start/build-numbers (accessed on 8 January 2018).
Figure 1. Initial combat situation projected on a 2D map view (map view in mCOP application). Initial report with grouped suspected elements (a). Updated combat situation demonstrating aggregated recon reports detailing reported enemy assets forming combat units (b).
Applsci 09 04577 g001
Figure 2. Recognized combat situation (TOPO map) merged from 10 separate reports (comparative and competitive data fusion strategies) taken from five different recon reports (a). Merged Common Operational Picture product taken from gathered reports rendered at command level (b).
Applsci 09 04577 g002
Figure 3. Here, mCOP AR view with unit-detailed labels (1: unit name, 2: unit APP6C code, 3: latitude of given unit, 4: distance to given unit, 5: unit potential from heterogeneous perspective, 6: unit’s tasks, 7: threat level value, 8: icon representing threat level by color, 9: estimated battle outcome and duration, 10: ETA (estimated time of unit arrival) or time to encounter, 11: longitude of given unit, and 12: bearing of given unit).
Applsci 09 04577 g003
Figure 4. Tactical view of surrounding battlespace objects in tactical augmented reality view (TARV). Handheld devices utilize built-in inertial and geolocation sensors to locate and orientate the operator within the battlespace. Surrounding battlespace objects are projected based on an object’s azimuth and calculated distance. Object annotations data can contain recon data and supplemented potential information.
Applsci 09 04577 g004
Figure 5. Heterogeneous combat potential influence graph [14] (a configurable mechanism for tactical calculations) (a); mCOP view of potential allocation (b); TARV showing battlespace entity details within a tactical scenario (c).
Applsci 09 04577 g005
Figure 6. Augmented reality views of surrounding battlespace objects in head-mount mode. TARV offers normal and stereoscopic projections, integrating a handheld with VR glasses (e.g., Samsung Gear VR). This is an example of a tactical scenario projected onto VR glasses.
Applsci 09 04577 g006
Figure 7. Functional data components diagram demonstrating the sources of data used for generating a tactical augmented reality view (in conclusion, situational awareness) for individual commanders [8,16].
Applsci 09 04577 g007
Figure 8. Mission guidance mode, demonstrating a checkpoint direction indicator supported by a TARV view during combat activity (1: map component; 2: guiding indicator) (battlespace elements). Data layers can be adjusted (switched on/off) and configured (alfa channel).
Applsci 09 04577 g008
Figure 9. Tactical orientation mode demonstrating an operational picture view and a map compass supported by a TARV during combat activity. Additional mechanisms for AR view configuration were introduced (buttons 1–3), allowing the user to preconfigure preferred datasets and HUD functions.
Applsci 09 04577 g009
Figure 10. An mCOP recon view RARV demonstrating the reporting capabilities used by the user-adjustment sliders to input height and object size into the preview (1: slider to input object height; 2: slider to fit grid with viewed object; 3: cropping grid; 4: relative distance to object; 5: object height; 6: size of cropping grid).
Applsci 09 04577 g010
Figure 11. Diagram showing the concept of the Method A (a) and Method B (b) distance measurement techniques.
Applsci 09 04577 g011
Figure 12. Alternative extended mCOP recon view RARV measurement grid with calculated object’s parameters was supplemented by an distortion evaluator (bottom right part of the screen) utilizing a handheld’s accelerometer and gyro sensor data.
Applsci 09 04577 g012
Figure 13. Combat training usage of TARV in mCOP application during tactical and topographical orientation tasks. Trial tests of the application performed by officers and cadets, recorded using a set of handhelds in various environmental conditions.
Applsci 09 04577 g013
Table 1. Red force (enemy unit) military potential and mission information.
Unit (Type) NamePotentialEstimated Time of Arrival (ETA)Threat Level (THL)DistanceBearing
Motorized infantry battalion143.1725 min0%11.821 m236.44
Mechanized infantry battalion130.9332 min0%15.103 m315.25
(Armored) tank battalion138.718 min0%8376 m293.13
Table 2. Hostile unit composition equipment with potential values and type.
NameQuantityPotentialType
Unit Type: Motorized Infantry Battalion
APC KTO Rosomak530.92armor
UKM-2000360.4infantry
PKT Machine gun70.3infantry
sniper rifle130.5infantry
0.50 rifle40.55infantry
Recon Vehicle30.45armor
RPG-7430.12infantry
60-mm Mortar120.56artillery
98-mm Mortar60.58artillery
PPK SPIKE60.75artillery
Mk-19124.0infantry
Unit Type: Mechanized Infantry Battalion
Machine gun410.3infantry
sniper rifle130.5infantry
0.50 rifle40.55infantry
Mk-19124.0infantry
RPG-7530.12infantry
Recon Vehicle30.45armor
BWP-1530.8armor
120-mm Mortar60.97artillery
9P133 malyutka61.0artillery
Unit Type: (Armored) Tank Battalion
machine gun20.3infantry
RPG-750.12infantry
PT-91 tank582.35armor
BWR-1D30.4armor
Table 3. Tactical task activity measurements performed manually with a map or with mCOP assistance. Trials performed (average values/standard deviation).
Finding Distance to the Nearest Unit (s)Finding Closest Allied Unit for Support (s)Topographical Orientation (s)Tactical Situation Orientation (s)Finding Point of Interest (POI) (s)
Group
Experience
MapmCOPMapmCOPMapmCOPMapmCOPMapmCOP
low7.66
1.02
2.18
0.44
3.90
1.16
4.13
0.83
5.99
0.93
2.30
0.52
16.63
0.64
13.59
1.39
3.48
0.97
3.56
0.45
medium10.47
0.68
3.24
0.31
6.14
0.44
5.55
0.32
8.27
0.48
3.25
0.11
18.49
0.56
16.58
0.78
5.53
0.44
5.01
0.40
high12.37
1.02
4.31
0.36
7.89
0.64
7.11
0.68
10.84
1.34
4.10
0.42
21.48
1.53
20.33
1.39
7.22
0.86
6.79
0.66
all10.28
2.24
3.29
0.98
6.07
1.89
5.66
1.43
8.48
2.30
3.28
0.91
19.01
2.39
17.03
3.26
5.49
1.79
5.20
1.49
Table 4. Tactical task activity comparison and registered improvements.
Group
Experience
Finding Distance to the Nearest UnitFinding Closest Allied Unit for SupportTopographical OrientationTactical Situation OrientationFinding POI
low−71.5%+5.9%−61.6%−18.3%+2.3%
medium−69.1%−9.6%−60.7%−10.3%−9.4%
high−65.2%−9.9%−62.2%−5.4%−6%
All−68%−6.8%−61.3%−10.4%−5.3%
Table 5. Measurements for Method A and Method B. MA denotes a Method A survey, MB denotes a Method B survey, X denotes a Method A survey taken from a captured object picture, and Y denotes a Method B survey taken from a captured object picture (sensor data (4160 x 3120 px)).
NoD
(m)
MA
(m)
MB
(m)
m
(m)
X
(m)
Y
(m)
δA
(%)
δB
(%)
123.0522.9023.90~2 [1.96]22.9623.500.65%3.69%
222.3722.3318.99~2 [1.88]22.3521.240.18%9.88%
315.1515.0614.65~2 [2.01]15.0414.870.59%3.30%
414.1213.9512.99213.9714.101.20%8.00%
56.055.985.95~2 [1.95]5.975.961.16%1.65%
66.095.975.95~2 [2.06]5.985.961.97%2.30%
70.500.50 0.50 0.10 0.50 0.50 0%0%
80.30 0.30 0.30 0.10 0.30 0.30 0%0%
Table 6. Measurement-specific data evaluated for measurement delays and distance.
Operation DelaysMeasurement Method A
No. H o b j p   ( px ) Operation
Time (s)
H o b j p   ( px ) Distance
D (m)
19003.028002025.97
28003.169001800.87
37003.4210001620.78
46003.8110011619.16
55004.2410021617.55
64004.9310031615.93
73005.8712001350.65
82007.0815001080.52

