Physiological Control Law for Rotary Blood Pumps with Full-State Feedback Method


1
Department of Medical Equipment Technology, College of Applied Medical Science, Majmaah University, Majmaah City 11952, Saudi Arabia
2
Department of Physics, College of Arts, Sebha University, Traghen City 71340, Libya
Appl. Sci. 2019, 9(21), 4593; https://doi.org/10.3390/app9214593
Submission received: 22 September 2019
/
Revised: 19 October 2019
/
Accepted: 25 October 2019
/
Published: 29 October 2019
(This article belongs to the Special Issue Biomedical Signal Processing: From a Conceptual Framework to Clinical Applications)
Abstract
:One concern about pulsatile rotary blood pumps is their physiological controller reactions when “venous return” changes. When a patient rises from a supine to a standing position, the blood volume in the leg veins is raised, owing to vasodilation, thus venous returns to the right atrium, and consequently, the left atrium is reduced. In this work, a physiological control law using a full-state feedback control method was developed in order to drive mechanical circulatory support. This strategy was used as a validated state-space pump model, to implement the controller and regulate the desired reference flow. The control law was assessed using a software model of the hemodynamical cardiovascular system interacting with the left ventricular assist device in different physiological conditions ranging from rest to exercise scenarios. Under these scenarios, heart failure disease was simulated by changing the hemodynamic parameters of the total blood volume, heart rate, cardiac contractility, and systemic peripheral resistance. The results were numerically observed during the postural changes. The rate of change in the physiological variables showed that the proposed control law can regulate the desired reference pump flow with minimal error within the acceptable clinical range in order to prevent suction and over perfusion.
1. Introduction
Chronic heart failure (HF) has been gradually increasing each year, and it is believed to be one of the most important causes of morbidity and mortality worldwide. Epidemiological studies of most new cases of heart failure in the United Kingdom (UK) have succeeded in clarifying some of the key features of the occurrence [1]. In the late 1990s, it was identified that the occurrence of heart failure was higher in men than in women, probably because of the more probable onset of coronary artery diseases in males rather than females. Moreover, the average age of diagnosis was identified to be in the late 70s [2]. The risk of heart failure in both genders increases by at least 10% each year [3].
The American Heart Association reported that 85.6 million people in the United States suffer from cardiovascular diseases, of which 5.7 million live with HF. In contrast, HF patients can often be left in the hospital, unable to undergo or await heart transplantation, and wishing for a decent quality of life. Also, according to the annual reports of Interagency Registry for Mechanically Assisted Circulatory Support (INTERMACS), more than 13,000 patients received left ventricular assist device (LVAD) in 2014 in the United States [4]. Cardiac assistance technology is now evolving in order to enable these patients to achieve a high standard of living. The advancement of the artificial heart from the original roller pumps to the new revolving blood pumps on today’s drawing panels is a continuous worldwide effort to build a permanently implantable artificial heart that maximizes patients’ quality of life. More than forty ventricular assist device (VAD) brands are now available, in the following three different categories: (1) membrane or volume displacement products, (2) rotary pumps with mechanical contact bearings (axial- and center-level), and (3) rotary pumps, which are free of mechanical contact bearings (axial and central). Hydrodynamic and/or magnetic suspension systems in the third-generation VADs cause the impeller to fail, to produce a device with no mechanical parts and a life expectancy of 10 to 15 years. The magnetic systems are generally larger than the hydrodynamic bearing pumps, resulting in lower shear levels of blood-washed bearings, which reduces the risk of a blood injury. This new generation of VADs is available in axial and centrifugal versions without mechanical touch coils [5].
As also stated above, the introduction of rotary control pumps dates to the earlier period of the 1990s [6]. Rotary blood pumps (RBPs) were started at a steady rotational speed, particularly as left ventricular assist devices (LVADs), according to the patient’s need. Early clinical observations after development showed that the technique had serious health hazards attached to it, including a probable ventricular collapse, and, occasionally, excessive and uncontrolled suction [7]. In this field, several control methods have been identified as being useful for cardiac assist devices [8,9]. These control methods can be designed according to the control variable. Such variables include pressure difference, afterload, preload, and flow [10]. Of all of these variables, only those dealing with preload control have been clinically tested and implemented. Moreover, it is important to note that the flow rate, pulsatility index (PI), and current signal for the motor had been suggested [11,12]. Therefore, these control methods are being clinically practiced in many available RBPs.
In the early periods of operation, RBPs as the LVADs are often needed in order to perform at the maximum flow rate. Several methods tend to meet the criteria by inserting and running the pump at the area closest to the left ventricle, where the most damage tends to occur [13]. However, it should also be noted that the additional unloading of the left ventricle may have an impact on the pumping performance of the right ventricle. This could be the case because of the occurrence of the septum shift. In addition, a logical theory also suggests that recirculation events may occur inside the left ventricle, which is the result of changes in the natural direction of blood flow combined with the decreased movement of the left ventricle wall due to excessive unloading [13].
Currently, there is only limited evidence of thrombus formation in the left ventricle. However, atrial fibrillation may occur in the case of excess unloading of the left ventricle. In this case, thromboembolic complications are common [14]. Complete left ventricular unloading is only considered in those patients believed to have a greater chance of recovery from cardiac assist devices, or those patients eligible for weaning [15]. The preceding points clearly show that it is not always a good decision to operate the rotary blood pump at its peak flow rate. Instead, it is preferable to operate it at a point where the unloading is only done halfway. Thus, the left ventricular volume and the left ventricular wall movement are not restricted, and the left ventricular cavity is at an ideal achievable washout where the occasional opening of the aortic valve also occurs [16]. With this in mind, it is important to note that there is a constant need for a physician to monitor the control method, in terms of adjusting the point at which it operates, regardless of the physiological situation. Such a point chosen for operation may be directly dependent on the therapeutic objectives, such as those being discussed. Moreover, therapeutic devices can also be divided into the following two categories: full assist (FA) devices, which guarantee extreme support with a sealed aortic valve and a margin for safety measures, and partial assist (PA) devices, which offer partial support in the region, where events related to the permanent opening and closing of the aortic valve occur. In addition, in the latter case, the transition occurs with an improved left ventricular washout and moderate left ventricular loading, while the volume of the left ventricle is the most physiologically close as possible [16].
One of the most obvious challenges of the existing control strategies is the various levels of heart failure that need to be addressed. These levels can range from the degrading function of the ventricles, usually without pulsation, to the proper functioning of the ventricles with adequate aortic flow [17]. Some researchers initially claimed, as seen in the literature review, that a constant pressure differential combined with a fixed average speed was appropriate when considering getting used to the different preload levels. However, some researchers claim that rotary pump devices are insensitive to preload. The statement essentially implies that additional sensors are needed for these systems to duplicate a natural Frank–Starling behavior [18].
Each LVAD requires a technique for controlling the implantable LVAD, regardless of the type of control approach involved. This control is essentially responsible for adjusting the speed and flow rate, to keep the heart functioning under artificial conditions as close as possible to its natural physiological functioning. Thus, some control methods make use of the motor current consumption, as reported by Konishi et al. [19]. Using the motor current consumption is a method that can increase the life of the implantable ventricular assist device. This is essential, because the pump itself has the function of a sensor. In addition, it is also important to note that even the pulsatility of the human heart in its natural working form has the role of influencing the waveform of the motor current [19]. Considering all of these observations, it was comparatively easier to estimate the heart rate in its natural physiological working environment, and, in turn, it was also convenient to predict and treat ventricular collapse [20]. However, despite this, the level of control needed for a pulsatile ventricular assist device, better known as a total artificial heart, has not yet been achieved [21].
In this research, a full-state feedback control method is introduced. The method is forced to locate the root locus of the closed-loop system, where the entire state of the system has reflected the input. The position of these poles corresponds directly with the system’s dynamic features, such as rising times, settling times, and overshoot. In fact, one of the most important features of full state feedback, unlike conventional designs, in which the controller’s parameters (the compensator) are iterated to try to achieve good root placement, the full state feedback approach allows us to arbitrarily position the roots at any given location.
2. Materials and Methods
2.1. A Model of Cardiovascular System Environment with a Left Ventricular Assist Device
A software model incorporating a lumped-parameter model of the cardiovascular system (CVS) in conjunction with an RBP model under examination was used to study the physiological interactions of RBPs. As indicated in the literature [11,22], the CVS model consisted of twelve compartments, including the left and right side of the heart, pulmonary, and systemic circulations, and allowed the establishment of ventricular communication through the inter-ventricular septum and pericardium. The model used the hydraulic and electrical features of the pump, as described by the following three differential equations:
- Electrical equation of motor winding:where is the motor terminal voltage, is the electrical speed, is the motor winding resistance, is the motor phase current, is the motor winding inductance, and is the constant.
- Electromagnetic torque equation:where is the input electromagnetic torque, is the pump flow rate; and is the moment of inertia of the impeller.
- Pump hydraulic equation:where is the differential pressure across the pump, and , and are constant.
2.2. Hemodynamic Characteristics of the Model
For the hemodynamic part, each of the heart chambers is described by their corresponding pressure–volume relationship during the cardiac cycle. Here, the blood flow across the valves is given as
where is the tricuspid valve (tv), pulmonary valve (pv), the aortic valve (av), or mitral valve (mt). is the upstream pressure, is the downstream pressure of the corresponding valve, and is the resistance of the corresponding valve.
The blood vessel chambers function can be illustrated as
where is the systemic peripheral vessel (sa), systemic veins (sv), aorta (ao), pulmonary veins (pv), vena cava (vc), and pulmonary peripheral vessel (pa). is the unstressed volume of the corresponding vessel and is the compliance of the corresponding vessel. The blood flow between the chambers is given as follows:
where is the respective chamber resistance. Additionally, each inflow and outflow cannula is modelled in terms of a steady flow resistance ( and ) that creates a decrease in stress, and a serial inductance ( and ) that resists flow rate modifications. Before the intake cannula, a third resistance () is included so as to simulate suction occurrences. A function of the left ventricular pressure (LVP) is the magnitude of this variable resistance. Figure 1 illustrates an equivalent electrical circuit analogous to the mixed model. The key hemodynamic variables of the resulting model are mentioned in Table 1 for both healthy and HF patients.
2.3. Control Strategy with a Pulsatile of Pump Flow
In the cardiovascular system, pulsatile mechanical circulatory support has the benefit of generating physiological pressure and flow [23]. This can be useful for enhancing micro-circulation and preventing gastrointestinal circulation complications. However, the excessively large size and mechanical functioning of such systems are far beyond the advantages of pulsatile flow. These problems are solved by rotary pumps with more reliable devices [24]. The pulsatility index (PI) parameter was used as a control objective in this study. This index was validated to reflect the preload of the left ventricle. When the PI rises, the preload dose also rises, and vice versa [25]. Excessive PI declines can lead to ventricular collapse. The PI index is therefore a useful measure for sustaining the pump’s reaction to changing the HF preload and afterload circumstances by providing the largest feasible suction-prevention flow rate [26]. This study has implemented a feedback control system for a newly proposed Starling controller that we consider clinically intuitive for the physician. The Starling-like controller emulates the Frank–Starling law of the heart, which adjusts the LVAD flow to the LV-filling pressure (or preload).
Figure 2 illustrates the operation of the Starling-like controller. At any time, the operating point is located at the intersection of the target flow preload line (Ln) and the system flow-preload curve (C1 or C2), which is produced by changing the LVAD speed. Increasing the LVAD speed reduces the pulse flow rates and increases the pump’s regular flow, whereas reducing the LVAD speed generates the reverse reaction. The flow curve of this scheme depends on circulatory circumstances (e.g., heart contractility, systemic vascular resistance, and total volume of circulation). For example, increasing the volume of the actual circulatory system changes the flow–preload curve to the right, from C2 to C1, as shown in Figure 2.
Although a single gradient in relation is enough for adjusting the LV output (pumping flow) to the short-term changes in the right ventricular output, and therefore the LV preload (pumping flow pulsatility), migration to different gradients may compensate for LV contractility for long-term variations, and metabolic demands of the body. To modify the control gradient, a series of rules are implemented for the adjustment of the target flow preload line, based on the upper and lower limits for both the average pump flow and the pump flow pulsatility. As long as the operating point is within these limits (the current combination of the pump flow and pulsation), no slope changes are indicated. If the limits are exceeded for a certain period, suitable slope modifications are required. The Starling-like controller is also available in the literature [27] in more detail.
Therefore, to generate and control the desired flow, we chose to regulate the operating point (red) located in the intersection between straight lines (such as L1 and L2) with curves (such as C1 and C2) within the bounded area, as shown in Figure 2. This area represents the acceptable range of movement to prevent suction and over perfusion. The new location of the operating point on the gradient line can be controlled by the following technique:
where , here, is the mean pump flow, is the pump flow pulsatility, and is the gradient angle of straight lines and is calculated as
where and are proportional and integral gains, designed to guarantee that the operating point is automatically adjusted within the acceptable range.
2.4. Pulsatility Controller Design
The dynamic equation that models the LVAD can be written as [9]
where and , here, , where is the pulsatility index of the pump speed (); is the pump control input, which is the pulse width modulation (); is the system noise; and is the system output.
The full-state feedback control is introduced the literature [28] in combination with the pulsatile flow estimator model to design the control law, . The poles of the eigenvalues for the closed-loop system are modified to determine , where S is the Laplace variable. Therefore, the characteristic equation of the closed-loop system in Equation (9) is written as
For a fast-dynamic response, we introduce the linear quadratic regulator optimal control [26]. Therefore, the control input is calculated in such a way that
is minimized subject to the control law , where the and values are selected by the designer, in which their weighs are relative to the significance of the states and controls.
Considering Lagrange’s multipliers method in Equation (6), we can write the equation of the dynamic model of Equation (4) in terms of Equation (6), as follows
The partial derivative of this equation for three quantities of interest leads to
Equations (14)–(16) represent the control, state, and adjoint, respectively, and the solution to these equations under certain boundary conditions results in the following:
where S is calculated by solving the following Riccati equation:
This equation gives a quick convergence to the steady-state value; therefore, Equation (10) for the value, representing the steady-state solution, is as follows:
where is the answer to the Riccati equation of discrete-time, and is given by
This algorithm has been implemented as shown in Figure 3.
2.5. Simulation Protocols
In this research, the model parameters were closely adapted to guarantee a realistic simulation regarding the cardiac output, aortic pressure (Pao), and left atrial/ventricular pressure. As shown in Table 2, the model parameters, such as the left ventricular contractility () and right ventricular contractility (), systemic peripheral resistance (), and total blood volume (), were altered for simulation of the HF situation.
The algorithm evaluated the efficiency under a set of identical simulated conditions representing the wide range of HF conditions that may be encountered, comparing the performance with the variable speed controller as shown in Table 1. The optimal gain matrix was calculated using MATLAB software (The Math-works Inc., Natick, MA, USA), where the solution of the Riccati equation used the state-space matrices and . The design parameters of the state feedback gain in Equation (19) were , and the solution of the Riccati equation
Moreover, simulations for controlling the pump flow as a function of the left atrial or left ventricular end-diastolic pressure were also considered. The immediate responses of the control algorithm were evaluated in both rest and exercise scenarios. In both scenarios, the system parameters were set to work over a period of one cardiac cycle. Within this period, the parameters were linearly changed to induce the system based on the conditions in Table 1.
3. Results
3.1. Immediate Reactions to Short-Term Changes in Circulation
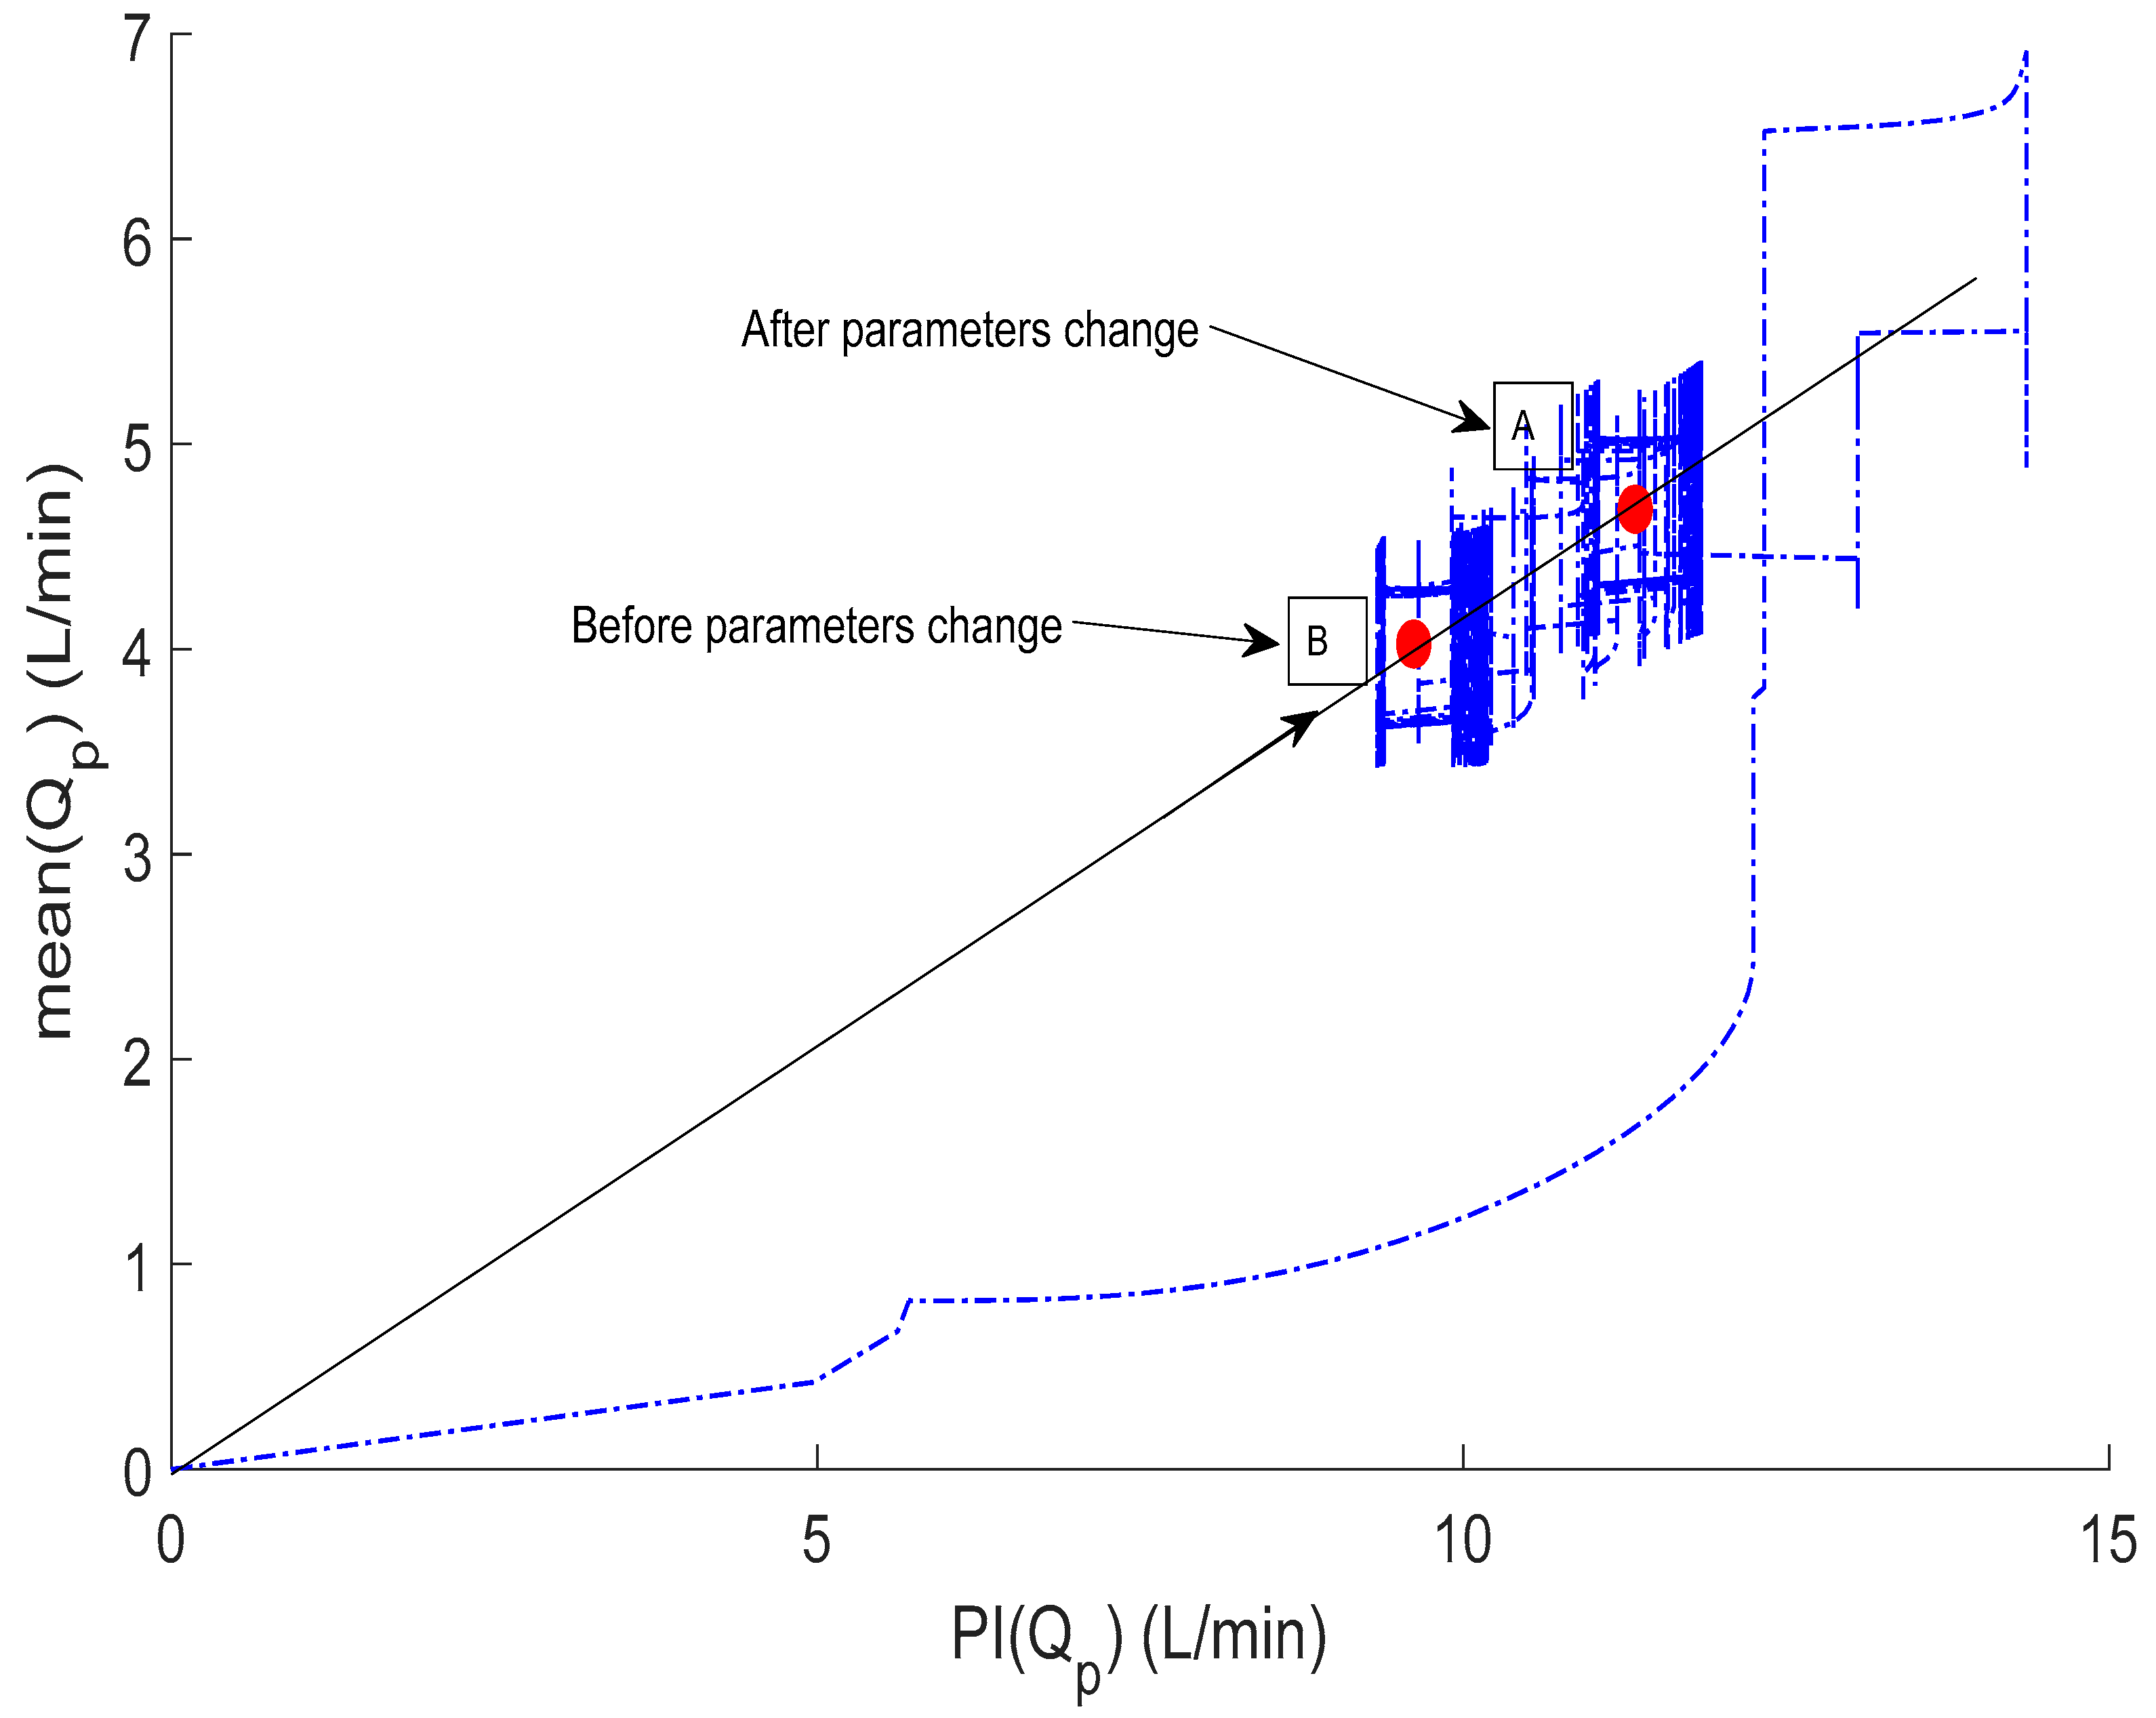
This test represents the volume of blood loss (Rest), and it has been performed to evaluate the performance of the controller and estimator for the immediate response to changes in the hemodynamic characteristics of the system. Figure 4, Figure 5, Figure 6 and Figure 7 show the controller’s instant reaction to the complete circulatory volume decrease. The total circulatory volume has been reduced by 500 mL, this reduction caused a shift of stroke volume (SV) to the left-hand side, as shown in Figure 4. Thus, the control system reacts to increase the systematic (left atrial, left ventricle, and aortic) pressure within a safe mode (Figure 5). Consequently, the pump reduced the flow rate of the systematic part with 2 L/min, while the flow rate was fixed in the pulmonary part (4.2 L/min), as illustrated in Figure 6. In particular, when the flow rate falls below the lower limit of 3 L/min, the control law forces the operation point to migrate to the new control line by increasing the slope (Ln + 1) to increase the mean pump flow (e.g., migrate the operating point from point A to B; Figure 7).
3.2. Controller Adaptive Characteristics
This scenario is representing the transition from rest to exercise. The ability of the controller to adjust the operating point outside the acceptability area for long-term circulatory interruptions is configured. Figure 8, Figure 9, Figure 10 and Figure 11 show the waveforms of SV, systematic pressure, flow rate, and movement of the operating points, respectively. A sever HF initiated by adjusting the parameters in Table 2, is resulted in shifting the SV of the left and right sides in the right direction, as shown in Figure 8. As a result, the control law adjusts the systematic pressure and flow rate to the new values. In Figure 10, it is observed that the control law slightly increased the systematic flow for a few seconds and then decreased to a value of 2.2 L/min to save the patient from the section. The large drop in the LVAD flow and the changes associated with flow pulsatility were initially managed by migrating the operating point upward and to the right, from point B to A, increased by the target flow-preload line, as shown in Figure 11. More results on the hemodynamic model data for both healthy and heart failure patients are presented in Table 2.
4. Discussion
Naturally, as the VAD and the controller are implanted in humans, because their lifespan depends largely on the suitability of the pump control, we must have great certainty in the robustness of the control algorithms [29,30]. Continuous flow for VADs may allow simulated pulses; however, until the date of circulatory assistance, despite tolerance to left ventricular and Pao, the continuous flow rate is traditionally of a medium constant rotation, which always decreases the pressure pulse [31,32].
These types of devices generally require precise control and the use of sensors to measure flow and pressure. These devices are not reliable, owing to clinical issues such as routine calibration and blood clotting [8]. These concerns regarding the reliability of implantable sensors have led to the search for non-invasive, sensorless approaches to identifying analog cardiac preload. We now believe that non-invasive technology has advanced to a level where it can be considered for long-term implantation, combined with sensorless signals, to form a robust control system that provides physiological behavior to RBPs [9].
The pulsatile flow pump is used as a non-invasive substitute for the LV filling pressure, as it has been proven to be closely interrelated. The pump flow pulsation and mean flow pump used in the current controller can be estimated using an algorithm for flow estimation previously established in our laboratory using the pump speed and current that are not measured invasively. The current control approach uses flow pulsatility as a parameter to determine the required flow rate compared to the continuous pulsatility index (PI) control strategy, which regulates PI directly at a specific stage. This allows the left ventricle to automatically adjust the RV output (represented by the increased or decreased pump pulsatility), thereby decreasing the danger of suction or an inefficient pumping aid connected to improperly defined PI target values. The optimal target PI value depends on heart contractility, preload, and afterload [18].
The methodology of this work is proposed to evaluate the merits of a full-state feedback control method involving sensorless and non-invasive approaches in a range of identical simulation scenarios. The results of this method show that the controller has advantages in regulating the reference signal generated with the safe mode at a variable speed, as illustrated in Figure 4, Figure 5, Figure 6, Figure 7, Figure 8, Figure 9, Figure 10 and Figure 11.
The software simulation model currently simulates rest and exercise with changes in HR, cardiac contractility, and systemic vascular resistance. Clinically, it is observed that large changes in pump pulsatility during postural changes cause patients to sometimes feel weak during Valsalva maneuvers (e.g., when coughing or straining) [33]. Therefore, we believe it is important to improve the software model to represent these events. In addition, the aortic valve is observed to be closed in most LVAD patients. However, with a change in posture, cardiac recovery, and during exercise, it may open. We have found that the aortic valve offers a lower resistance pathway than the LVAD bypass route, as the native heart sometimes pumps a significant flow relative to that of the LVAD. Therefore, we believe that this different pumping state could greatly impact our overall control strategy, and therefore requires online detection.
In addition, during use in a clinical setting, it was found that controlling the pulsatility index to a pre-set point did not prevent antagonistic pumping states. On the contrary, occasional suction occurred, which led to the development of algorithms for anti-suction [34,35]. Another drawback is that the pulsatility index (PI) is increasingly dependent on heart rate [36].
For real-time clinical studies, we plan to validate the controller built in the above-mentioned computer simulation studies in a pulsatile mock circulation loop. This will include the design of a LabView/MATLAB system for the implementation of control strategies in the LVAD physical controller. This computer system will then be used in acute animal studies.
5. Conclusions
In this work, a full-state feedback control law was implemented to derive an LVAD-based state-space pump model. The refinement of the non-invasive pump estimation and state identification for detecting the regurgitation pump flow was achieved. Intensive computer simulation studies were conducted to evaluate the merits of the control law by changing the cardiovascular system parameters to induce heart failure cases. The results show that the controller can regulate the generated reference flow with minimal error. In the future, work may be extended to evaluate the controller performance, combined with the estimator in the mock-loop system.
Author Contributions
M.B. modeled the problem, designed the controller, numerically computed and discussed results, and wrote the manuscript.
Funding
The author extends their appreciation to the Deanship of Scientific Research-Majmaah University for supporting this work under project number No. (R-1441-16).
Acknowledgments
The author would like to thank the Deanship of Scientific Research-Majmaah University for their support.
Conflicts of Interest
The author declares no conflict of interest.
References
- Cowie, M.R. The heart failure epidemic: A UK perspective. Echo Res. Pract. 2017, 4, 15–20. [Google Scholar] [CrossRef] [PubMed]
- Cowie, M.R.; Wood, D.A.; Coats, A.J.; Thompson, S.G.; Poole-Wilson, P.A.; Suresh, V.; Sutton, G.C. Incidence and aetiology of heart failure; a population-based study. Eur. Heart J. 1999, 20, 421–428. [Google Scholar] [CrossRef] [PubMed]
- Fox, K.; Cowie, M.; Wood, D.; Coats, A.; Gibbs, J.; Underwood, S.; Turner, R.; Poole-Wilson, P.; Davies, S.; Sutton, G. Coronary artery disease as the cause of incident heart failure in the population. Eur. Heart J. 2001, 22, 228–236. [Google Scholar] [CrossRef] [PubMed]
- Chatterjee, A.; Schmitto, J.D. The evolution of mechanical circulatory support (MCS): A new wave of developments in MCS and heart failure treatment. J. Thorac. Dis. 2018, 10 (Suppl. 15), S1688. [Google Scholar] [CrossRef]
- Frazier, O.H. Mechanical cardiac assistance: Historical perspectives. Semin. Thorac. Cardiovasc. Surg. 2000, 12, 207–219. [Google Scholar] [CrossRef]
- Granegger, M.; Schima, H.; Zimpfer, D.; Moscato, F. Assessment of Aortic Valve Opening During Rotary Blood Pump Support Using Pump Signals. Artif. Organs 2013, 38, 290–297. [Google Scholar] [CrossRef]
- Topilsky, Y.; Pereira, N.L.; Shah, D.K.; Boilson, B.; Schirger, J.A.; Kushwaha, S.S.; Joyce, L.D.; Park, S.J. Left ventricular assist device therapy in patients with restrictive and hypertrophic cardiomyopathy. Circ. Heart Fail. 2011, 4, 266–275. [Google Scholar] [CrossRef]
- AlOmari, A.H.; Savkin, A.V.; Stevens, M.; Mason, D.G.; Timms, D.L.; Salamonsen, R.F.; Lovell, N.H. Developments in control systems for rotary left ventricular assist devices for heart failure patients: A review. Physiol. Meas. 2012, 34, 1. [Google Scholar] [CrossRef]
- Bozkurt, S. Physiologic outcome of varying speed rotary blood pump support algorithms: A review study. Australas. Phys. Eng. Sci. Med. 2016, 39, 13–28. [Google Scholar] [CrossRef]
- Lim, E.; Dokos, S.; Salamonsen, R.; Rosenfeldt, F.; Ayre, P.; Lovell, N. Numerical Optimization Studies of Cardiovascular-Rotary Blood Pump Interaction. Artif. Organs 2012, 36, E110–E124. [Google Scholar] [CrossRef]
- Bakouri, M.A.; Salamonsen, R.F.; Savkin, A.V.; AlOmari, A.H.; Lim, E.; Lovell, N.H. A Sliding Mode-Based Starling-Like Controller for Implantable Rotary Blood Pumps. Artif. Organs 2014, 38, 587–593. [Google Scholar] [CrossRef] [PubMed]
- Vollkron, M.; Schima, H.; Huber, L.; Benkowski, R.; Morello, G.; Wieselthaler, G. Development of a Reliable Automatic Speed Control System for Rotary Blood Pumps. J. Heart Lung Transplant. 2005, 24, 1878–1885. [Google Scholar] [CrossRef] [PubMed]
- Boston, J.; Antaki, J.; Simaan, M. Hierarchical control of heart-assist devices. IEEE Robot. Autom. Mag. 2003, 10, 54–64. [Google Scholar] [CrossRef]
- Fuster, V.; Rydén, L.E.; Cannom, D.S.; Crijns, H.J.; Curtis, A.B.; Ellenbogen, K.A.; Halperin, J.L.; Le Heuzey, J.Y.; Kay, G.N.; Lowe, J.E.; et al. ACC/AHA/ESC 2006 guidelines for the management of patients with atrial fibrillation–executive summary. A report of the American College of Cardiology/American Heart Association Task Force on practice guidelines and the European Society of Cardiology Committee for Practice Guidelines (Writing Committee to Revise the 2001 Guidelines for the Management of Patients with Atrial Fibrillation). Eur. Heart J. 2007, 48, 854–906. [Google Scholar]
- Mueller, J.; Wallukat, G. Patients who Have Dilated Cardiomyopathy Must Have a Trial of Bridge to Recovery (Pro). Heart Fail. Clin. 2007, 3, 299–315. [Google Scholar] [CrossRef] [PubMed]
- Giridharan, G.; Skliar, M. Control Strategy for Maintaining Physiological Perfusion with Rotary Blood Pumps. Artif. Organs 2003, 27, 639–648. [Google Scholar] [CrossRef] [PubMed]
- Wu, Y.; Allaire, P.; Tao, G.; Olsen, D. Modeling, Estimation, and Control of Human Circulatory System with a Left Ventricular Assist Device. IEEE Trans. Control Syst. Technol. 2007, 15, 754–767. [Google Scholar] [CrossRef]
- Salamonsen, R.; Mason, D.; Ayre, P. Response of Rotary Blood Pumps to Changes in Preload and Afterload at a Fixed Speed Setting Are Unphysiological When Compared with the Natural Heart. Artif. Organs 2011, 35, E47–E53. [Google Scholar] [CrossRef]
- Konishi, H.; Antaki, J.F.; Amin, D.V.; Boston, J.R.; Kerrigan, J.P.; Mandarino, W.A.; Litwak, P.; Yamazaki, K.; Macha, M.; Butler, K.C.; et al. Controller for an Axial Flow Blood Pump. Artif. Organs 1996, 20, 618–620. [Google Scholar] [CrossRef]
- Araki, K.; Oshikawa, M.; Onitsuka, T.; Nakamura, K.; Anai, H.; Yoshihara, H. Detection of Total Assist and Sucking Points Based on Pulsatility of a Continuous Flow Artificial Heart: In Vitro Evaluation. ASAIO J. 1998, 44, M708–M711. [Google Scholar] [CrossRef]
- Oshikawa, M.; Araki, K.; Endo, G.; Anai, H.; Sato, M. Sensorless Controlling Method for a Continuous Flow Left Ventricular Assist Device. Artif. Organs 2000, 24, 600–605. [Google Scholar] [CrossRef] [PubMed]
- Bakouri, M.A.; Savkin, A.V.; Alomari, A.H. Nonlinear modelling and control of left ventricular assist device. Electron. Lett. 2015, 51, 613–615. [Google Scholar] [CrossRef]
- Wang, S.; Evenson, A.; Chin, B.J.; Kunselman, A.R.; Ündar, A. Evaluation of conventional nonpulsatile and novel pulsatile extracorporeal life support systems in a simulated pediatric extracorporeal life support model. Artif. Organs 2015, 39, E1–E9. [Google Scholar] [CrossRef]
- Soucy, K.G.; Giridharan, G.A.; Choi, Y.; Sobieski, M.A.; Monreal, G.; Cheng, A.; Schumer, E.; Slaughter, M.S.; Koenig, S.C. Rotary pump speed modulation for generating pulsatile flow and phasic left ventricular volume unloading in a bovine model of chronic ischemic heart failure. J. Heart Lung Transplant. 2015, 34, 122–131. [Google Scholar] [CrossRef]
- Choi, S.; Boston, J.R.; Antaki, J.F. Hemodynamic controller for left ventricular assist device based on pulsatility ratio. Artif. Organs 2007, 31, 114–125. [Google Scholar] [CrossRef] [PubMed]
- Ng, B.C.; Kleinheyer, M.; Smith, P.A.; Timms, D.; Cohn, W.E.; Lim, E. Pulsatile operation of a continuous-flow right ventricular assist device (RVAD) to improve vascular pulsatility. PLoS ONE 2018, 13, e0195975. [Google Scholar] [CrossRef]
- Salamonsen, R.F.; Lim, E.; Gaddum, E.; Alomari, A.H.; Gregory, S.D.; Stevens, M.; Mason, D.G.; Fraser, J.F.; Timms, D.; Karunanithi, M.K.; et al. Theoretical foundations of a Starling-like controller for rotary blood pumps. Artif. Organs 2012, 36, 787–796. [Google Scholar] [CrossRef]
- Franklin, G.F.; Powell, J.D.; Emami-Naeini, A. Feedback Control of Dynamic Systems; Prentice Hall Press: Upper Saddle River, NJ, USA, 2014. [Google Scholar]
- Bakouri, M. Evaluation of an advanced model reference sliding mode control method for cardiac assist device using a numerical model. IET Syst. Biol. 2018, 12, 68–72. [Google Scholar] [CrossRef] [Green Version]
- Bakouri, M. Physiological Control Approach for Heart Pump. In Proceedings of the 2019 18th European Control Conference (ECC), Naples, Italy, 25–28 June 2019; IEEE: Piscataway, NJ, USA, 2019; pp. 221–224. [Google Scholar]
- Shekar, K.; Gregory, S.D.; Fraser, J.F. Mechanical circulatory support in the new era: An overview. Crit. Care 2016, 20, 66. [Google Scholar] [CrossRef]
- Wang, Y.; Koenig, S.C.; Wu, Z.; Slaughter, M.S.; Giridharan, G.A. Sensor-based physiologic control strategy for biventricular support with rotary blood pumps. ASAIO J. 2018, 64, 338–350. [Google Scholar] [CrossRef]
- Pauls, J.P.; Stevens, M.C.; Bartnikowski, N.; Fraser, J.F.; Gregory, S.D.; Tansley, G. Evaluation of physiological control systems for rotary left ventricular assist devices: An in-vitro study. Ann. Biomed. Eng. 2016, 44, 2377–2387. [Google Scholar] [CrossRef] [PubMed]
- Vollkron, M.; Schima, H.; Huber, L.; Benkowski, R.; Morello, G.; Wieselthaler, G. Development of a Suction Detection System for Axial Blood Pumps. Artif. Organs 2004, 28, 709–716. [Google Scholar] [CrossRef] [PubMed]
- Bakouri, M.A.; Savkin, A.V.; Alomari, A.H. A method for physiological control of a cardiac assist device. In Proceedings of the 2015 10th Asian Control Conference (ASCC), Kota Kinabalu, Malaysia, 31 May–3 June 2015; IEEE: Piscataway, NJ, USA, 2015; pp. 1–5. [Google Scholar]
- Endo, G.; Araki, K.; Kojima, K.; Nakamura, K.; Matsuzaki, Y.; Onitsuka, T. The Index of Motor Current Amplitude Has Feasibility in Control for Continuous Flow Pumps and Evaluation of Left Ventricular Function. Artif. Organs 2001, 25, 697–702. [Google Scholar] [CrossRef] [PubMed]
Figure 1.
Schematic diagram of the ventricular assisted circulatory system model. The model consists of the following two main parts: (1) the cardiovascular system (CVS), which consists of ten compartments (left atrium (la); left ventricle (lv); aorta (ao); lateral arteries (sa); lateral veins (s); vena cava (vc); correct atrium (ra); correct ventricle (rv); lateral arteries (pa); lateral veins (pu)) and (2) rotary blood pump and cannula (cannula inlet and outlet resistance (Rin and Rout); cannula inlet and outlet inertia (Lin and Lout)). The capacitive elements (Ci) represent the compliance of the different compartments.
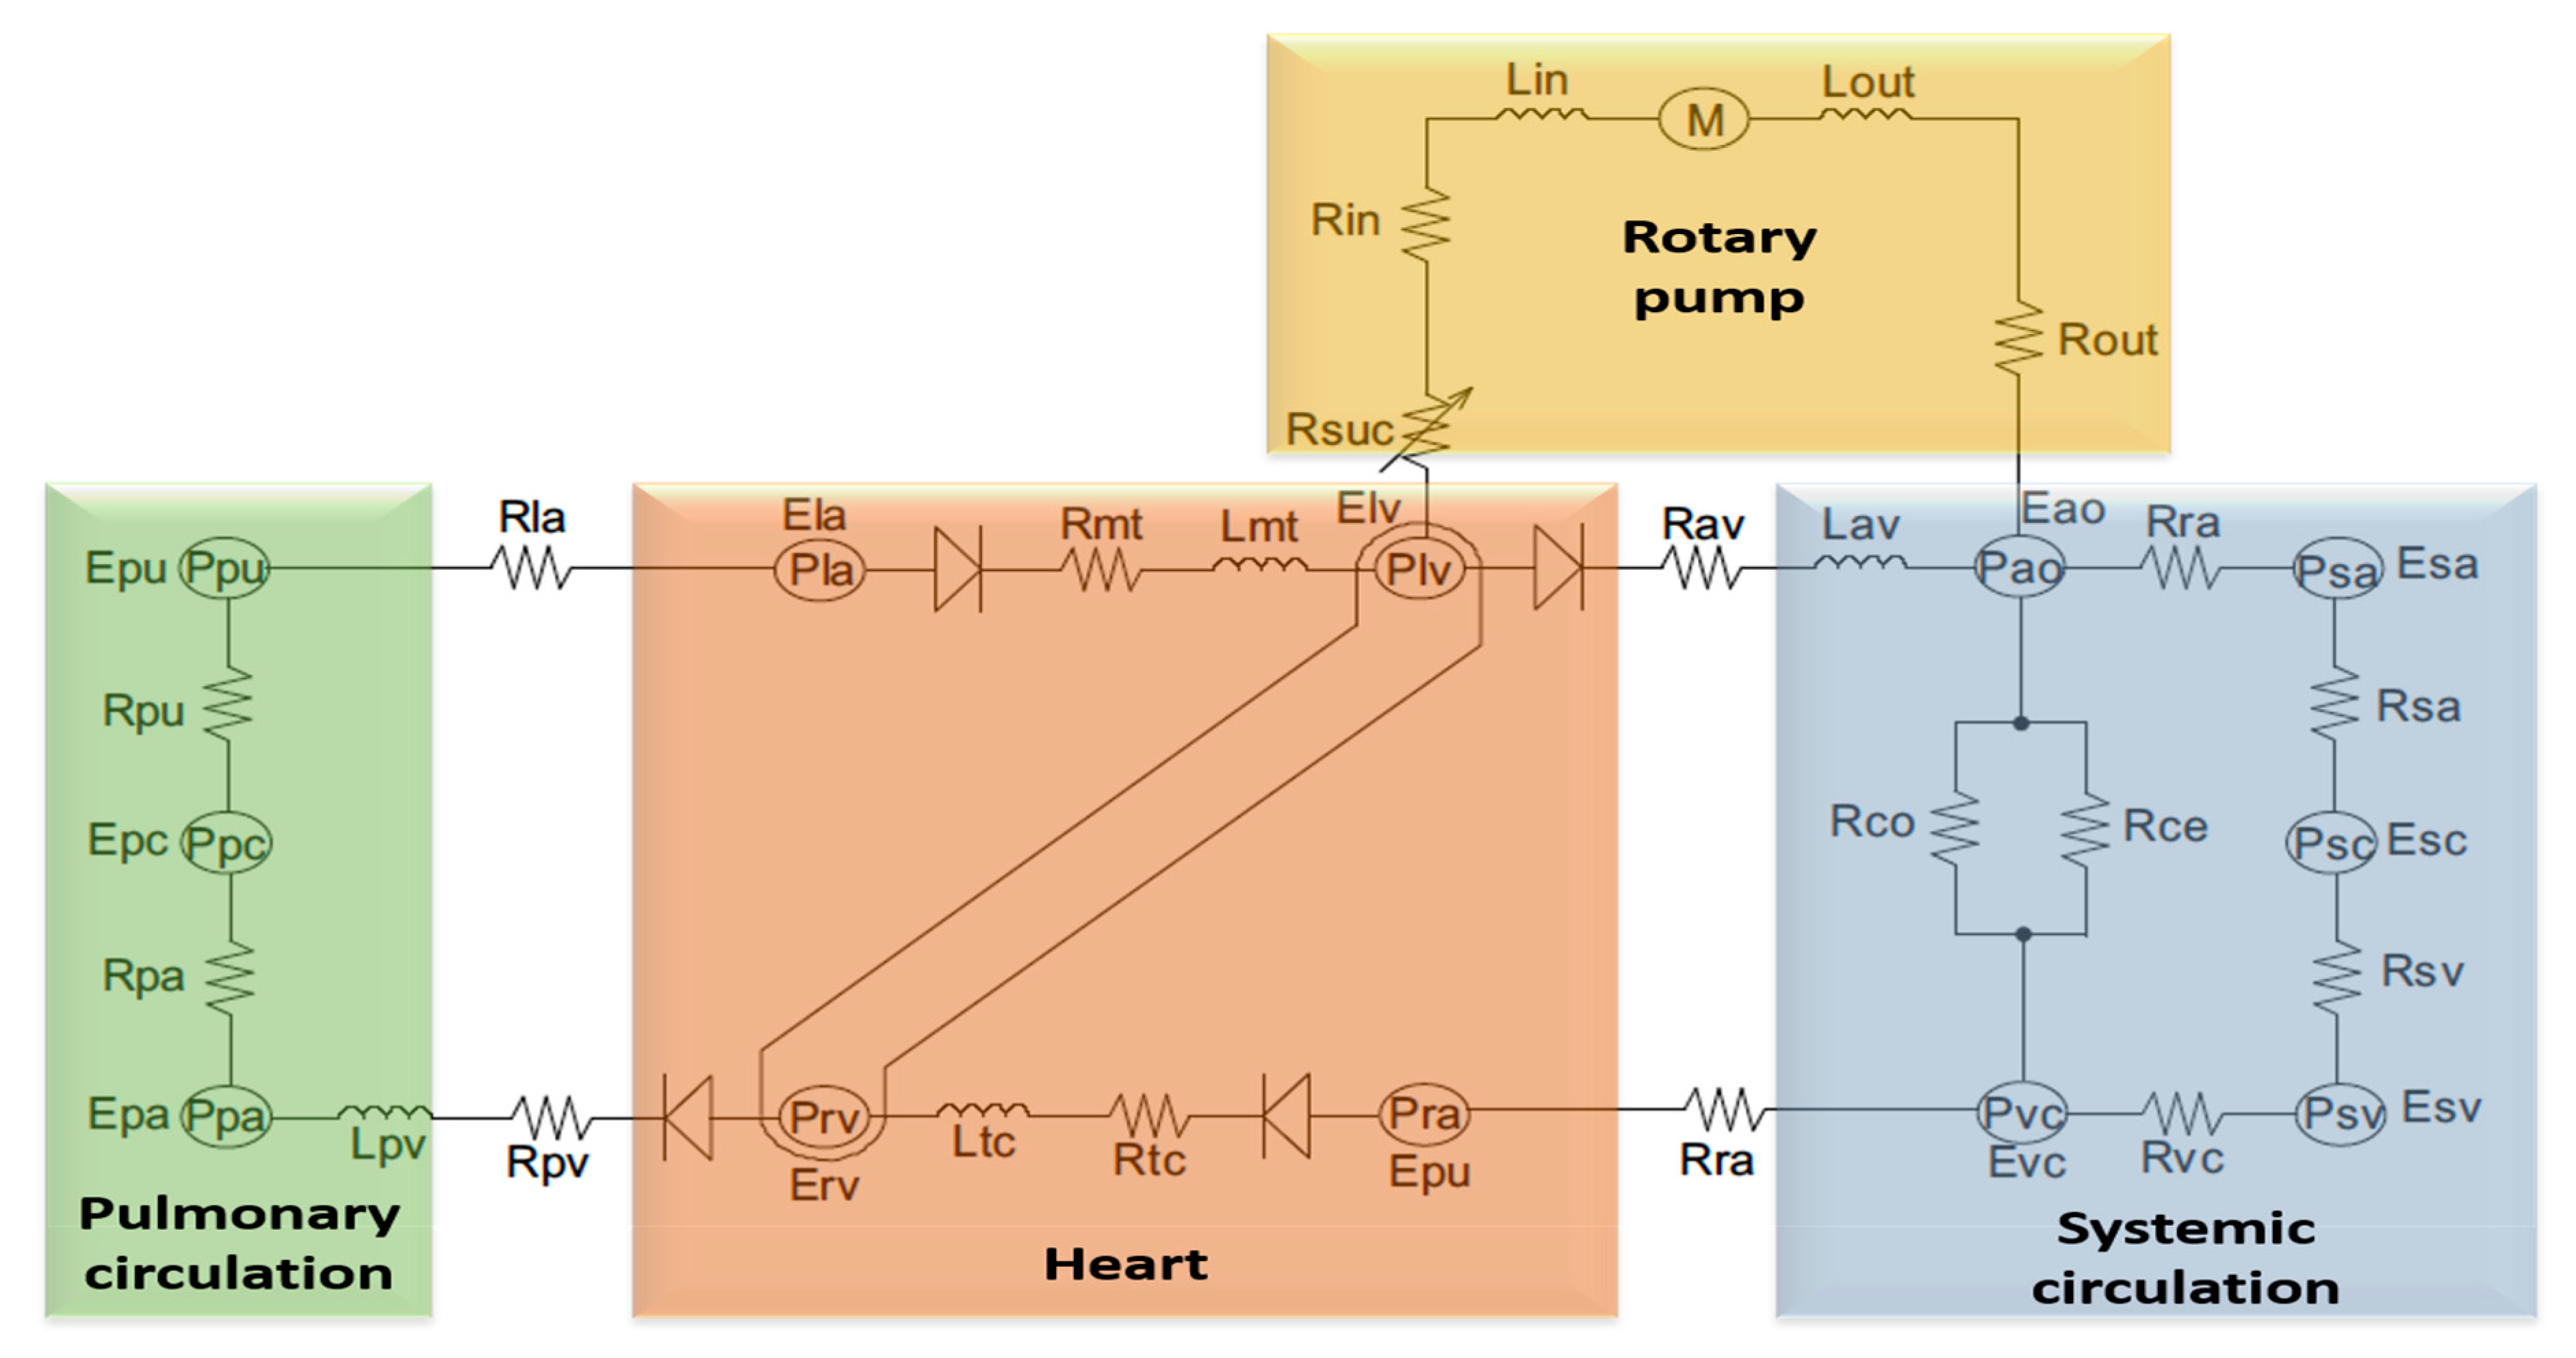
Figure 2.
Control of the operating point with an acceptable range of pump flow and pulsatility of pump flow.
Figure 2.
Control of the operating point with an acceptable range of pump flow and pulsatility of pump flow.

Figure 3.
Block diagram of the human cardiovascular system in combination with the controller, estimator, and desired flow.
Figure 3.
Block diagram of the human cardiovascular system in combination with the controller, estimator, and desired flow.

Figure 4.
Left ventricular (LV) pressure–volume loops before and after a reduction of the total circulatory volume (Vtotal) at the transition from normal to rest.
Figure 4.
Left ventricular (LV) pressure–volume loops before and after a reduction of the total circulatory volume (Vtotal) at the transition from normal to rest.

Figure 5.
Time waveform of the systematic pressure at the transition from normal to rest.

Figure 6.
Flow rate for systematic and pulmonary at the transition from normal to rest.

Figure 7.
Pump flow pulsatility vs average pulsatile flow at the transition from normal to rest.

Figure 8.
LV pressure–volume loops before and after the reduction of LV contractility (Emax) at the transition from rest to exercise.
Figure 8.
LV pressure–volume loops before and after the reduction of LV contractility (Emax) at the transition from rest to exercise.

Figure 9.
Time waveform of the systematic at the transition from rest to exercise.

Figure 10.
Flow rate for systematic and pulmonary at the transition from rest to exercise.

Figure 11.
Pump flow pulsatility vs average pulsatile flow at the transition from rest to exercise.

Table 1.
Cardiovascular system (CVS) model parameters used to simulate heart failure conditions.
| Variable | Unit | Healthy | Heart Failure |
|---|---|---|---|
| Left ventricle contractility () | mm Hg/mL | 3.5443 | 0.7100 |
| Right ventricle contractility () | mm Hg/mL | 1.7235 | 0.5322 |
| Systemic peripheral resistance () | mm Hg*s/mL | 0.7411 | 1.1100 |
| Total blood volume () | mL | 5300 | 5800 |
Table 2.
Hemodynamic data of the model for both healthy and heart failure patients.
| Variable | Symbol | Unit | Healthy | Heart Failure |
|---|---|---|---|---|
| End-diastolic left ventricle volume | mL | 133.35 | 183.21 | |
| End-systolic left ventricle volume | mL | 63.05 | 150.00 | |
| End-diastolic left ventricle pressure | mmHg | 7.11 | 22.23 | |
| End-systolic left ventricle pressure | mmHg | 130.00 | 89.56 |
© 2019 by the author. Licensee MDPI, Basel, Switzerland. This article is an open access article distributed under the terms and conditions of the Creative Commons Attribution (CC BY) license (http://creativecommons.org/licenses/by/4.0/).
Share and Cite
MDPI and ACS Style
Bakouri, M. Physiological Control Law for Rotary Blood Pumps with Full-State Feedback Method. Appl. Sci. 2019, 9, 4593. https://doi.org/10.3390/app9214593
AMA Style
Bakouri M. Physiological Control Law for Rotary Blood Pumps with Full-State Feedback Method. Applied Sciences. 2019; 9(21):4593. https://doi.org/10.3390/app9214593
Chicago/Turabian StyleBakouri, Mohsen. 2019. "Physiological Control Law for Rotary Blood Pumps with Full-State Feedback Method" Applied Sciences 9, no. 21: 4593. https://doi.org/10.3390/app9214593
Note that from the first issue of 2016, this journal uses article numbers instead of page numbers. See further details here.