Abstract
The paper examines the development of a portable sensor strip with fiber optic Bragg grating for monitoring urban traffic density up to 80 kph. It contains a 2.5-m-long and a 2-cm-high sensor created from a combination of silicone addition rubber (bicomponent addition silicone rubber) and Bragg grating placed inside a carbon tube. The design of the portable sensor permits traffic density and cars crossings to be monitored and detected in a single lane. The functionality of the sensor was verified in real traffic; the results of this study are based on the detection of 1518 vehicles of different types and sizes. According to the measurements, the sensor is characterized by a high detection rate of 98.946%.
1. Introduction
Traffic sensors are devices that detect input data and information for other transport infrastructure systems. Today, traffic sensors are primarily placed next to, above, into or onto a road’s surface. The usual basic parameters measured are detecting the presence of a vehicle, vehicle speed, vehicle classification, wheelbase and number of axles, total vehicle weight, road axle load and occupancy, all of which indicate the traffic flow quality.
1.1. Conventional Types
Inductive loops [1,2] and magnetic sensors [3] are among the most commonly used conventional sensors for car traffic. They are easy to install, accurate and reliable, but limited by difficult placement in reinforced concrete structures and higher repair costs because of the invasive manner in which they are installed in roadways.
Pneumatic sensors [4,5] are also frequently used sensors and measure the pressure change in a pipe laid across a road. They are portable technology and very easily installed, and can measure traffic intensity, occupancy in individual lanes and vehicle speed. Their disadvantage is difficultly in recognizing a stationary or slow-moving vehicle. Another type of sensor is a piezoelectric sensor [6,7,8], which measures changes in compression in the measuring probe. The voltage generated in the sensor is proportional to the force applied and therefore the respective vehicle weight. Microwave sensors [9,10] are used to measure vehicle speed based on the Doppler effect. However, these sensors are susceptible to electromagnetic interference caused by electromagnetic wave reflections from vehicle bodies, crash barriers, columns, etc. Closed-circuit television (CCTV) technology provides digitized static images for analysis. Vehicle registration plates can also be identified using CCTV [11].
1.2. Fiber Optic and Optical Sensors
An alternative option for monitoring basic traffic parameters are sensors employing optical fibers, which function on different principles. These sensors offer many significant advantages, such as reliability, accuracy, high sensitivity, electromagnetic and chemical resistance, electrical passivity and a broad temperature operating range. The greatest potential of optical fibers is in hybrid networks for data transmission, frequently in combination with its use as a sensor sensitive to certain measured parameters.
Optical infrared sensor gates work on the principle of transmitting and receiving a laser or infrared beam from an emitter to a receiver [12,13].
Another type is a special fiber optic micro-motion sensor [14], which works on the principle of increasing optical fiber attenuation. The fibers are embedded in special protective covers and built into a roadway. This type of sensor is experimental in nature and not used in general practice.
Other relatively frequently used types are WIM (Weigh-in-Motion) sensors. These are sensors built into roadways for monitoring the load from vehicle wheels and axles, vehicle speed, measuring the distance between axles, measuring vehicle width, etc. This type of sensor [15,16,17,18] is often based on different types of fiber-optic interferometers. Due to their high sensitivity, interferometric sensors can also be placed non-destructively next to a road, as described by the authors of [19,20,21]. It monitors basic parameters, such as traffic density and vehicle speed.
Another technology under discussion today is the DAS (Distributed Acoustic Sensor). DAS technology [22,23] uses a single optical fiber to monitor multiple traffic variables, such as detecting a car, its direction, its speed, etc.
Seim et al. [24] described the use of fiber Bragg grating strain sensors to monitor the health of bridges as well as the means to monitor vehicle traffic patterns and critical data such as speed, weight, and classification of vehicle types.
An invasive method for monitoring selected road traffic parameters which included detecting vehicles and vehicle speed and weight was conducted on the I-84 highway in Portland using five FBG (fiber Bragg grating) sensors installed into the asphalt pavement at a depth of 7 cm [25,26]. Insufficient protection of the FBG sensors resulted in damage to the sensors. The authors successfully solved this problem by adding composite fiber protection to the FBG sensors.
In the study by Al-Tarawneh and Huang [27], Al-Tarawneh et al. [28], a three-dimensional Glass Fiber-Reinforced Polymer packaged Fiber Bragg Grating sensor (3D GFRP-FBG) is introduced for vehicle speed and wheelbase estimation. These sensors were evaluated in practice by installing them into a real roadway. The experimental results of this study achieved a measurement reliability of at least 95%. However, the sensor is relatively complex to manufacture and implement.
Chen et al. [29] presented on of the most recent studies. This paper presents an alternative WIM (Weigh-in-Motion) system to measure a vehicle’s velocity, wheelbase and axial and gross weight based only on a single set of long-gauge FBG sensors. The results show that this method can achieve its function with good accuracy under different conditions.
Fiber Bragg sensors are increasingly being used to monitor selected parameters in automotive traffic. Table 1 summarizes the selected types of fiber optic sensors and their parameters.

Table 1.
Summary of the use of basic types of fiber optic sensors in road transport.
This study followed up on the trend of expanding fiber optic sensors into the field of automotive traffic monitoring. This publication describes an innovative portable FBG sensor for traffic density monitoring, whose advantages are a high success rate in detecting cars and non-invasive installation onto surfaced areas. The sensor was designed and subsequently evaluated for detecting urban traffic, i.e., in the typical range of values of 10–80 kph. For higher speeds, follow-up research will be conducted.
2. Methods
2.1. Fiber Bragg Grating
Fiber Bragg grating is formed in the optical fiber core by a periodic change of the refractive index. The structure of a uniform Bragg grating in which there are periodically changing layers of the refractive index of core with a higher refractive index index is shown in Figure 1. The uniform Bragg grating is characterized by a constant size of the induced refractive index and a constant period of of changes of refractive index.
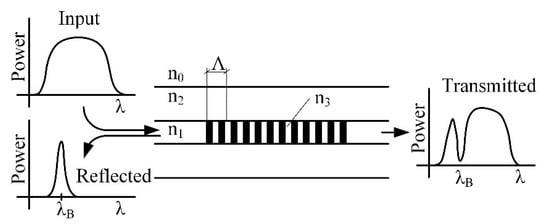
Figure 1.
Structure of uniform Bragg grating.
When a broadband spectrum of light passes through the structure of the Bragg grating, selected wavelengths in a narrow part of the spectrum are reflected, while other wavelengths are transmitted. The reflected part of the spectrum is called Bragg wavelength and is expressed by Equation (1):
where is the effective refractive index defined by the structure of the Bragg grating and is the distance between the periodical changes to the refractive index in the core of the optical fiber [30].
The Bragg wavelength is the geometric and optical properties that change under the influence of mechanical and thermal stresses. The relation of the Bragg wavelength change, the relative deformation and temperature is expressed by Equation (2):
where is Bragg wavelength shift, k is deformation coefficient, is deformation, is the coefficient of thermal expansion, is the thermo-optic coefficient and is change of temperature.
The relation in Equation (2) suggests that thermal and deformation sensitivity changes with the absolute value of the Bragg wavelength. With regard to the values of coefficients stated in the above relations, the standardized deformation coefficient at a constant temperature is expressed by Equation (3):
and a standardized deformation coefficient at a constant deformation is expressed by Equation (4):
The uniform Bragg grating has a deformation sensitivity of 1.2 pm/strain and a temperature sensitivity of 10.3 pm/C at a wavelength of 1550 nm [31].
2.2. Design and Realization of Portable FBG Sensor
In the Introduction, we summarize the current approaches to using fiber Bragg grating sensors for road traffic monitoring. Against the presented research [25,26,27,28,29], where an invasive installation of sensors into the road is necessary, we focused on the design of a portable sensor that can be installed non-invasively on the road at any place for any time with a focus on urban car traffic.
From the results of research, polymer materials were selected for the portable sensor’s design. A polymer in liquid form is a simple solution for encasing optical fibers. In selecting a suitable mold, any desired shape of the resulting sensor can be obtained. The polymer then cures either at either room temperature or raised temperature. Based on experimental measurements with several types of polymers, ZA 50 LT two-component additive rubber (ELCHEMCo, Zruc nad Sazavou, Czech Republic) was selected. This material cures at room temperature. The selection criteria for a suitable polymer included polymer hardness, resistance to passing cars, sensor lifespan and curing temperature. Table 2 summarizes the specification of ZA 50 LT rubber.
Table 2.
Properties of ZA 50 LT rubber.
For creating the portable sensor, we used an apodized Bragg grating that was made using the phase mask method at the producer Network group (Brno, Czech Republic). For the production process, we used a standard single-mode optical fiber (ITU-T recommendation G.652) with primary acrylic protection of 250 m. This type of material and size of protection was used for the recounting at the place of the Bragg grating. The length of Bragg grating itself was 1.6 mm.
The portable sensor strip consisted of an optical fiber Bragg grating with a Bragg wavelength of 1573.158 nm, reflectivity of 94.04% and spectrum width (full width at half maximum, FWHM) of 211 pm. The first prototype of the portable sensor was completed by casting a bare optical fiber with FBG. Manual handling of the portable strip and passing cars created a large deformation of more than 10,000 strain. This large deformation exceeded the maximum deformation (5000 strain) defined by the manufacturer of the used Bragg gratings (Network group, Brno, Czech Republic). Different types of optical fiber protection tubes (polymer, metal, fiberglass and carbon) were therefore tested to compensate. Testing showed that the most suitable form of protection was a carbon tube with an internal diameter of 0.3 mm and external diameter of 0.7 mm.
Figure 2 shows a scheme of a portable fiber optic sensor with a Bragg grating in a carbon tube, which was subsequently encased in a ZA 50 LT polymer. The length of the sensor was selected according to the width of the car lanes. The criterion for monitoring traffic density was a vehicle passing over the portable strip with at least one wheel in the lane. The minimum width of the local road in the Czech Republic is 2.75 m, and a length of 2.5 m was therefore selected. The width of the active area of the measuring tape is given by the length of the carbon tube, which was 2.35 m long. Outside the active area, sensitivity to a passing car is significantly reduced. The height of the strip was 2 cm, and its width was 6 cm. These values represent a compromise in order to sufficiently protect the FBG sensor while also minimizing the axle load of a passing vehicle.
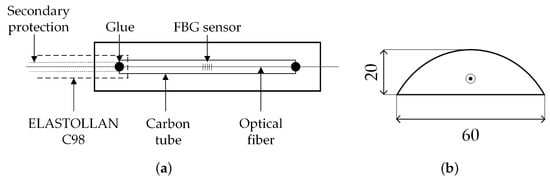
Figure 2.
Structure of the portable sensor for monitoring density of automobile traffic density: (a) longitudinal section; and (b) cross-section.
The optical fiber was pre-stressed by 500 pm in the carbon tube and glued at both ends with a two-component adhesive. A supplying optical fiber with a width of 900 m and length of 5 m was inserted into a protective ELASTOLLAN C98 polyurethane tube (Gumex, Brno, Czech Republic) along with internal and external protective tubes with outer diameters of 2 mm and 4 mm, respectively, and a wall thickness of 1 mm.
The polymer was then cured at 25 C for 72 h. The curing process itself caused a shift of the Bragg wavelength from 1573.158 nm to 1573.766 nm (shift to a higher wavelength by 608 pm). This change was very small and had no effect on the functionality of the Bragg gratings.
A semi-cylindrical shape was selected for the sensor in order to eliminate the impact of a passing car as much as possible and to maximize the comfort and safety of vehicle passengers in traffic. A photo of the FBG measuring sensor is shown in Figure 3.
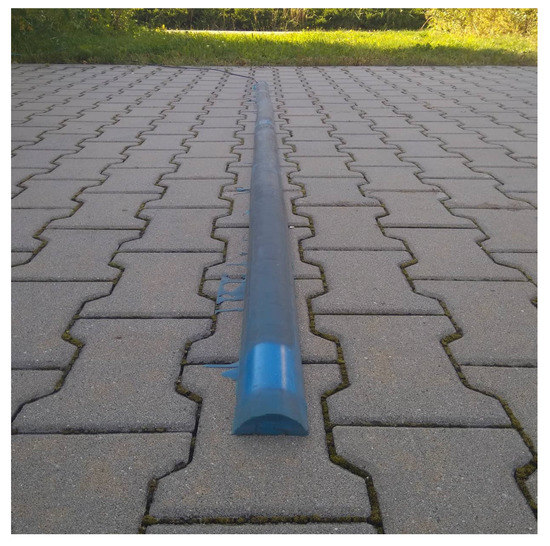
Figure 3.
Portable measuring FBG sensor.
According to Equation (2), the Bragg gratings in the portable strip is sensitive to both mechanical deformation and temperature. The signal from the FBG sensor will therefore fluctuate with ambient temperature during real measurements. The temperature sensitivity of the FBG portable sensor is 13.3 pm/C. The sensitivity of the portable sensor is higher than that of the bare Bragg grating, which is due to the higher thermal expansion coefficient of the ZA 50 LT polymer compared to the quartz glass the fiber is made of.
3. Experimental Measurement of Transport Vehicles
Figure 4 shows the measuring scheme that was used to monitor traffic density.
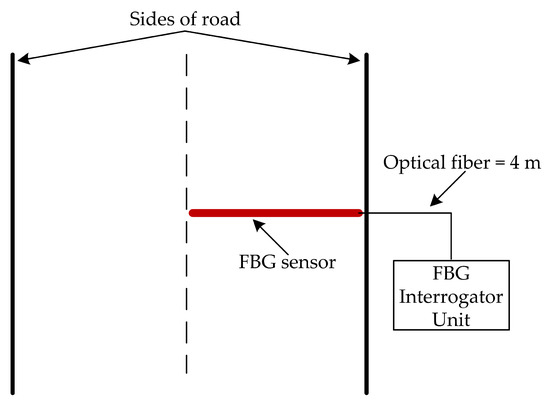
Figure 4.
Measuring scheme of experimental setup.
The measuring station comprised an FBG sensor, which was connected to an FBG interrogator unit entitled FBGuard Fast 1550 (Safibra, Prague, Czech Republic) through a fiber optic cable. This unit contained a wide-spectrum radiation source with an output power of 1 mW and an output spectral characteristic of 1510–1580 nm. The reflected light from the FBG sensor was guided through a diffraction grating to a CCD field that converted the light spectrum into an electric signal. The unit featured a spectral domain resolution of 1 pm and a maximum sampling rate of 10 kS/s, making it possible to measure very small and fast processes. Part of the device was also a computing unit that sent measured data from the FBG sensor in real-time over ethernet to a user’s computer. At this point, the collected data were processed in the Matlab environment.
The signal from the FBG sensor was filtered by a high-pass filter (Butterworth fourth order) with a cut-off frequency of 0.4 Hz in order to remove the slow component corresponding to the fluctuation of ambient temperature. The peaks (individual car axles) were then identified in the signal and individual car passes were detected.
3.1. Traffic Density Monitoring
Traffic density monitoring involved two experimental measurements. In the first measurements, a location with lower traffic density in a quiet suburban part of Ostrava was selected in order to verify the basic functionality of the sensor (this location mainly has passenger vehicle traffic). After successfully analyzing the measured data, a second, comprehensive set of measurements was conducted at a location with more frequent traffic in order to detect cars of different types and sizes (at the main entrance to the VSB-TUO premises).
3.1.1. Traffic Density on a Suburban Road
The portable strip was first tested on a street in a built-up area with family houses in the suburban district of Ostrava (Czech Republic) (GPS: 495003.3 N 180725.9 E). Measurements were conducted for 7 h (between 10:00 and 17:00). The sensor measurements recorded the time of passing, type of car (passenger, truck, trailer) and number of axles. All instances of passes were also manually recorded.
The portable sensor strip was placed on the outer edge of the road, which had a width of 5.125 m (Figure 5). The road was narrowed during the measurements with warning triangles so that cars passing in both directions would be forced to pass over the measuring strip. The reason for narrowing the road during measurement was to obtain relevant information about the total traffic density on the local road.
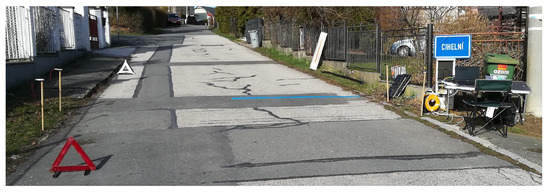
Figure 5.
Example of measuring station in suburban part of Ostrava.
Figure 6 shows an example of a car detection response at 50 kph. This particular speed was selected because it represents the legal maximum speed limit in cities in the Czech Republic.
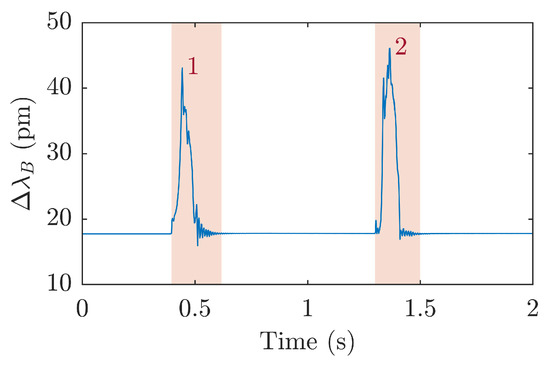
Figure 6.
The response of a car crossing over a 50 kph speed sensor strip.
The dynamic response of the portable sensor is high enough that the individual axles (shown in Figure 6) of the car can be distinguished. The sensor’s typical response to a passing car is in the range of 10–1000 pm, depending on the vehicle’s passing speed, the point on the portable strip where it passes and its weight.
According to the manual record, 140 passenger cars passed in the hours from 10:00 to 17:00. The sensor strip detected 139 cars correctly. One passing vehicle was not detected. In another five cases, the sensor incorrectly detected a passing car (false positive). This error was caused by pedestrians and cyclists crossing the sensor. The overall efficiency of detecting cars was 99.286%. The density of operation at hourly intervals is shown in Figure 7.
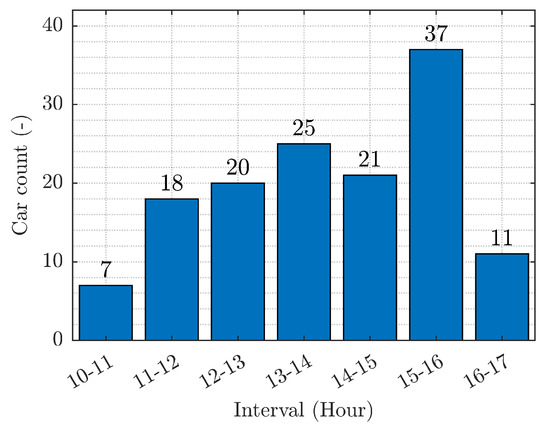
Figure 7.
Traffic density on the local road between 10:00 and 17:00.
3.1.2. Traffic Density at the Main Entrance to the VSB-TUO Campus
Traffic density was measured at the main entrance to the VSB-Technical University of Ostrava (GPS: 494950.1 N 180938.1 E). Measurements were conducted over 12 h (from 06:00 to 18:00). Sensor measurements recorded the crossing time, type of car (passenger, truck, or trailer) and the number of axles. All instances of passes were also manually recorded.
The portable strip was placed in the center of the road, which had a width of 5.55 m, so that passing cars in both directions always approached the sensor strip with at least one side of the vehicle. The placement of the sensor is shown in Figure 8.
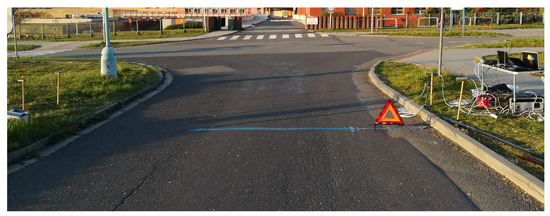
Figure 8.
Measuring station at the entrance to the VSB-TUO campus.
Figure 9a shows a passing passenger car, Figure 9b shows a passenger car with a two-axle trailer and Figure 9c shows a three-axle truck. Distinguishing individual axles makes it possible to differentiate each pass with respect to the time intervals between individual axles and thus allow traffic density to be calculated.
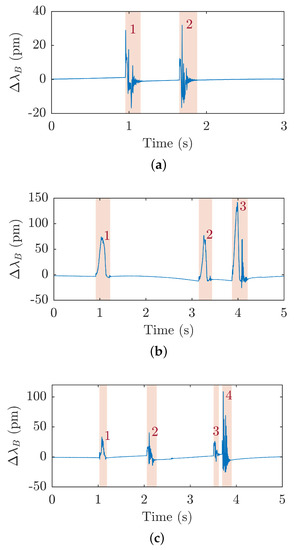
Figure 9.
The response of the FBG portable sensor to a passing passenger car (a); a passenger car with a two-axle trailer (b); and a three-axle truck (c).
A total of 1518 cars passed during the measurement period (1515 passenger cars, 2 passenger cars with a two-axle trailer and 1 truck with three axles). Only 1502 cars were correctly detected using the sensor strip. The remaining 16 passes were not detected because the vehicles passed the sensor strip outside the active area. The overall efficiency of detecting cars was 98.946%. The density of operation at hourly intervals is shown in Figure 10.
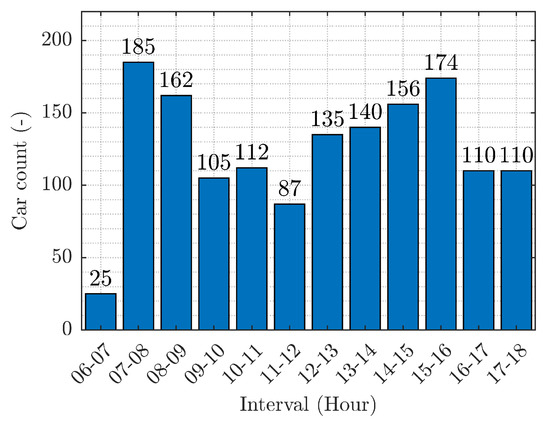
Figure 10.
Traffic density at the main entrance to the VSB-TUO site between 06:00 and 18:00.
Traffic density measurements for passing cars were analyzed using binary classification (whether a significant point falls under True Positive (TP), False Positive (FP) or False Negative (FN)) [32]. By determining TP, FP and FN, the Sensitivity (SE), Accuracy (ACC), Positive Predictive Value (PPV), Harmonic Means of Precision and Sensitivity (F1) and False Negative Rate (FNR) can be calculated [33].
The results of the statistics are summarized in Table 3.
Table 3.
Classification analysis of detected car passes.
4. Conclusions
This paper examines the design, production and experimental verification of the functionality of a portable measuring sensor created from a combination of silicone rubber and a fiber Bragg grating placed inside a carbon tube. The selected encasing method did not affect the functionality of the Bragg gratings. Due to the silicone rubber curing, the Bragg wavelength was shifted 608 pm higher. The rubber material alone caused an increase in temperature sensitivity to 13.3 pm/C.
The sensor was created and designed to measure selected parameters in traffic. Experimental measurements were conducted in real traffic. Initial measurements were conducted in a quiet suburban part of Ostrava over 7 h. A total of 140 cars passed during this experiment and resulted in a successful detection rate of 99.286% (139 cars). A second, comprehensive experiment was conducted at the main entrance to the VSB-TUO campus over 12 h (from 06:00 to 18:00). During this set of measurements, 1502 vehicles were successfully detected from a total of 1518 (detection success rate of 98.946%).
The sensor’s high sensitivity and success rate in detecting cars is a good prerequisite for expanding research and development into this portable sensor for monitoring automotive traffic. Follow-up research will be done to improve the design in order to achieve a more stable sensitivity in the sensor over its entire active length. This should increase the sensor’s success rate in detecting vehicles. Another objective is to extend the detection capabilities of the sensor, as driving direction and vehicle speed are important parameters in monitoring traffic density. The team of authors are also striving to design the sensor for year-round use. Any follow-up research will therefore also focus on verifying functionality during winter climatic conditions with a continuous layer of snow.
Author Contributions
M.F. (Michael Fridrich), and M.F. (Marcel Fajkus) proposed the systems idea and edited the manuscript. M.F. (Michael Fridrich), M.F. (Marcel Fajkus), P.M., J.N., M.K., and E.B. developed, tested and validated data. M.F. (Michael Fridrich), M.F. (Marcel Fajkus), J.N. and M.K. wrote the manuscript. M.F. (Michael Fridrich), M.F. (Marcel Fajkus), and J.N. critically evaluated the quality of the research data and experimental methods used to generate/acquire them as well as the soundness/validity of the scientific and engineering techniques, wrote the manuscript, and performed its final edits.
Funding
The paper was funded with support of conceptual development of science, research and innovation in 2018, assigned to VSB-Technical University of Ostrava, The Ministry of Education, Youth and Sports in the Czech Republic. This article was supported by the Ministry of Education of the Czech Republic (Project No. SP2019/79). This article was also supported by the European Regional Development Fund in the Research Centre of Advanced Mechatronic Systems project, project number CZ.02.1.01/0.0/0.0/16_019/0000867 within the Operational Programme Research, Development and Education. This work was supported by the European Regional Development Fund in Research Platform focused on Industry 4.0 and Robotics in Ostrava project, CZ.02.1.01/0.0/0.0/17_049/0008425 within the Operational Programme Research, Development and Education. This research was partially supported by the Ministry of Education, Youth and Sports of the Czech Republic through the grant project No. CZ.1.07/2.3.00/20.0217 within the frame of the operation program Education for Competitiveness financed by the European Structural Funds and from the state budget of the Czech Republic.
Conflicts of Interest
The authors declare no conflict of interest.
References
- Lu, X.Y.; Varaiya, P.; Horowitz, R.; Guo, Z.; Palen, J. Estimating traffic speed with single inductive loop event data. Transp. Res. Rec. 2012, 2308, 157–166. [Google Scholar] [CrossRef]
- Cherrett, T.; Bell, H.; McDonald, M. Estimating vehicle speed using single inductive loop detectors. Proc. Inst. Civ. Eng. Transp. 2001, 147, 23–32. [Google Scholar] [CrossRef]
- Markevicius, V.; Navikas, D.; Zilys, M.; Andriukaitis, D.; Valinevicius, A.; Cepenas, M. Dynamic vehicle detection via the use of magnetic field sensors. Sensors 2016, 16, 78. [Google Scholar] [CrossRef] [PubMed]
- Zheng, P.; Mike, M. An Investigation on the Manual Traffic Count Accuracy. Procedia Soc. Behav. Sci. 2012, 43, 226–231. [Google Scholar] [CrossRef]
- McGowen, P.; Sanderson, M. Accuracy of pneumatic road tube counters. In Proceedings of the 2011 Western District Annual Meeting, Anchorage, AK, USA, 26–28 June 2011; pp. 10–13. [Google Scholar]
- Guido, G.; Gallelli, V.; Rogano, D.; Vitale, A. Evaluating the accuracy of vehicle tracking data obtained from Unmanned Aerial Vehicles. Int. J. Transp. Sci. Technol. 2016, 5, 136–151. [Google Scholar] [CrossRef]
- Xu, D.; Huang, S.; Lei, Q.; Cheng, X. Preparation, properties and application research of piezoelectric traffic sensors. Procedia Eng. 2012, 27, 269–280. [Google Scholar] [CrossRef][Green Version]
- Bhalla, S.; Deb, S.K. A cost-effective approach for traffic monitoring using piezo-transducers. Exp. Tech. 2011, 35, 30–34. [Google Scholar] [CrossRef]
- Heide, P.; Schubert, R.; Mágori, V.; Schwarte, R. A high performance multisensor system for precise vehicle ground speed measurement. Microw. J. 1996, 39, 22–34. [Google Scholar]
- Nguyen, V.C.; Dinh, D.K.; Le, V.A.; Nguyen, V.D. Length and speed detection using microwave motion sensor. In Proceedings of the International Conference on Advanced Technologies for Communications, Hanoi, Vietnam, 15–17 October 2015; pp. 371–376. [Google Scholar] [CrossRef]
- Zhang, D.; He, J. Super-resolution reconstruction of low-resolution vehicle plates: A comparative study and a new algorithm. In Proceedings of the 2014 7th International Congress on Image and Signal Processing, CISP 2014, Dalian, Chin, 14–16 October 2014; pp. 359–364. [Google Scholar] [CrossRef]
- Ai, H.; Zheng, Y. Characterization of a traffic management system using pyroelectric infrared sensors. Instrum. Sci. Technol. 2015, 43, 319–333. [Google Scholar] [CrossRef]
- Rivas-Lopez, M.; Gomez-Sanchez, C.A.; Rivera-Castillo, J.; Sergiyenko, O.; Flores-Fuentes, W.; Rodriguez-Quinonez, J.C.; Mayorga-Ortiz, P. Vehicle detection using an infrared light emitter and a photodiode as visualization system. In Proceedings of the IEEE International Symposium on Industrial Electronics, Buzios, Brazil, 3–5 June 2015; pp. 972–975. [Google Scholar] [CrossRef]
- Suopajärvi, P.; Pennala, R.; Heikkinen, M.; Karioja, P.; Lyöri, V.; Myllylä, R.; Nissilä, S.; Kopola, H.; Suni, H. Fibre optic sensors for traffic monitoring applications. In Proceedings of the Smart Structures and Materials 1998: Smart Systems for Bridges, Structures, and Highways, San Diego, CA, USA, 1–5 March 1998; Volume 3325, pp. 222–229. [Google Scholar] [CrossRef]
- Donlagic, D.; Hanč, M. Vehicle axle detector for roadways based on fiber optic interferometer. In Proceedings of the Smart Structures and Materials 2003: Smart Sensor Technology and Measurement Systems, San Diego, CA, USA, 3–6 March 2003; Volume 5050, pp. 317–321. [Google Scholar] [CrossRef]
- Donlagić, D.; Hanč, M. A simple fiber-optic vehicle axle detector for roadways. IEEE Trans. Veh. Technol. 2003, 52, 401–405. [Google Scholar] [CrossRef]
- Feng, L.L.; Wang, Y.T.; Ruan, C.; Tao, S. Road vehicle information collection system based on distributed fiber optics sensor. Adv. Mater. Res. 2014, 1030–1032, 2105–2109. [Google Scholar] [CrossRef]
- Chen, S.Z.; Wu, G.; Feng, D.C. Development of a bridge weigh-in-motion method considering the presence of multiple vehicles. Eng. Struct. 2019, 191, 724–739. [Google Scholar] [CrossRef]
- Stolarik, M.; Nedoma, J. Fiber-optic interferometric sensor for dynamic impact measurement of transport trucks. Int. J. Eng. Res. Afr. 2019, 42, 34–46. [Google Scholar] [CrossRef]
- Nedoma, J.; Fajkus, M.; Kahankova, R.; Martinek, R.; Dvorsky, M.; Vanus, J.; Vasinek, V.; Cvejn, D. Fiber-optic interferometric sensor for monitoring automobile and rail traffic. Turk. J. Electr. Eng. Comput. Sci. 2018, 26, 2986–2995. [Google Scholar] [CrossRef]
- Nedoma, J.; Fajkus, M.; Martinek, R.; Vanus, J.; Kepak, S.; Kahankova, R.; Jaros, R.; Cvejn, D.; Prauzek, M. Analysis of the use of fiber-optic sensors in the road traffic. IFAC-PapersOnLine 2018, 51, 420–425. [Google Scholar] [CrossRef]
- Hill, D. Distributed Acoustic Sensing (DAS): Theory and Applications. In Proceedings of the Frontiers in Optics 2015, San Jose, CA, USA, 18–22 October 2015; Optical Society of America: Washington, DC, USA, 2015; p. FTh4E.1. [Google Scholar] [CrossRef]
- Duckworth, G.L. Distributed sensing applications of rayleigh scattering in fiber optic cables. In Proceedings of the Optics InfoBase Conference Papers, Arlington, VA, USA, 23–27 June 2013. [Google Scholar]
- Seim, J.; Udd, E.; Schulz, W.; MacMahon, R.; Soltesz, S.; Laylor, M. Development and deployment of fiber optic highway and bridge monitoring systems. In Proceedings of the Nondestructive Evaluation of Highways, Utilities, and Pipelines IV, Newport Beach, CA, USA, 6–8 March 2000; Volume 3995, pp. 479–482. [Google Scholar]
- Kunzler, M.; Edgar, R.; Udd, E.; Taylor, T.; Schulz, W.L.; Kunzler, W.; Soltesz, S.M. Fiber grating traffic monitoring systems. In Proceedings of the Smart Structures and Materials 2002: Smart Systems for Bridges, Structures, and Highways, San Diego, CA, USA, 17–21 March 2002; Liu, S.C., Pines, D.J., Eds.; International Society for Optics and Photonics: Bellingham, WA, USA, 2002; Volume 4696, pp. 238–243. [Google Scholar] [CrossRef]
- Kunzler, M.; Udd, E.; Taylor, T.; Kunzler, W. 2nd Generation Fiber Grating Traffic Monitoring Systems on the I-84 Freeway. In Proceedings of the Smart Structures and Materials 2003: Industrial and Commercial Applications of Smart Structures Technologies, San Diego, CA, USA, 2–6 March 2003; Volume 5054, pp. 230–239. [Google Scholar] [CrossRef]
- Al-Tarawneh, M.; Huang, Y. In-pavement fiber Bragg grating sensor for vehicle speed and wheelbase estimation. In Proceedings of the Sensors and Smart Structures Technologies for Civil, Mechanical, and Aerospace Systems, Denver, CO, USA, 5–8 March 2018; Volume 10598, pp. 580–588. [Google Scholar] [CrossRef]
- Al-Tarawneh, M.; Huang, Y.; Lu, P.; Tolliver, D. Vehicle Classification System Using In-Pavement Fiber Bragg Grating Sensors. IEEE Sens. J. 2018, 18, 2807–2815. [Google Scholar] [CrossRef]
- Chen, S.Z.; Wu, G.; Feng, D.C.; Zhang, L. Development of a Bridge Weigh-in-Motion System Based on Long-Gauge Fiber Bragg Grating Sensors. J. Bridge Eng. 2018, 23, 4018063. [Google Scholar] [CrossRef]
- Othonos, A. Fiber Bragg gratings. Rev. Sci. Instrum. 1997, 68, 4309–4341. [Google Scholar] [CrossRef]
- Kersey, A.D.; Davis, M.A.; Patrick, H.J.; LeBlanc, M.; Koo, K.P.; Askins, C.G.; Putnam, M.A.; Friebele, E.J. Fiber grating sensors. J. Lightwave Technol. 1997, 15, 1442–1462. [Google Scholar] [CrossRef]
- Unler, A.; Murat, A. A discrete particle swarm optimization method for feature selection in binary classification problems. Eur. J. Oper. Res. 2010, 206, 528–539. [Google Scholar] [CrossRef]
- Trevethan, R. Sensitivity, Specificity, and Predictive Values: Foundations, Pliabilities, and Pitfalls in Research and Practice. Front. Public Health 2017, 5. [Google Scholar] [CrossRef] [PubMed]


© 2019 by the authors. Licensee MDPI, Basel, Switzerland. This article is an open access article distributed under the terms and conditions of the Creative Commons Attribution (CC BY) license (http://creativecommons.org/licenses/by/4.0/).