Article

System Reliability Evaluation of Prefabricated RC Hollow Slab Bridges Considering Hinge Joint Damage Based on Modified AHP

College of Transportation, Jilin University, Changchun 130025, China
*
Author to whom correspondence should be addressed.
Appl. Sci. 2019, 9(22), 4841; https://doi.org/10.3390/app9224841
Submission received: 11 September 2019 / Revised: 6 November 2019 / Accepted: 8 November 2019 / Published: 12 November 2019
(This article belongs to the Section Civil Engineering)

Abstract

:
The prefabricated reinforced concrete (RC) hollow slab bridges, with the advantages of high quality, lower cost and shorter construction period, have been widely used for small-to-medium-span highway bridges in China. Because of environmental deterioration and traffic volume increases, the performance of the bridge system deteriorates gradually. Accurate bridge system evaluation can provide a reliable basis for maintenance and management. A bridge system is composed of multiple interrelated components, which makes the system reliability evaluation become a computationally intractable work. In this paper, an effective method was proposed to evaluate the system reliability of the prefabricated RC hollow slab bridge considering hinge joint damage based on the modified analytic hierarchy process (AHP). Considering the subjectivity of the traditional AHP method in constructing the judgment matrix, this paper proposed an objective construction method of the judgment matrix to modify the traditional AHP. The modified hinge plate method (MHPM) proposed by the previous research was utilized to analyze the effect of hinge joint damage on system reliability. In order to verify the applicability of the proposed system reliability evaluation method, a simply supported RC hollow slab bridge was selected as the case study and the system reliability indexes were compared with the traditional series and parallel methods. The results indicated that the traditional methods were either too conservative or too radical to objectively evaluate the actual system reliability level of the structure. In contrast, the proposed method in this paper was more suitable for evaluating the system reliability of such bridges, and more accurate in providing maintenance decision makers with a relatively reasonable bridge condition information.

1. Introduction

Traffic and load levels have increased rapidly with the development of the national economy and transportation. Meanwhile, people are facing serious environmental problems, such as global warming, ozone layer destruction, acid rain, etc. The prefabricated reinforced concrete (RC) hollow slab bridge, with the characteristics of higher quality, lower cost and shorter construction period, has been widely used for small-to-medium-span highway bridges in China [1,2]. As environmental deterioration and traffic volume increase, the mechanical properties of RC bridges deteriorate gradually [3,4,5]. Many in-service bridges cannot meet the current operational requirements [6,7,8]. In order to ensure that the structure can continue to be used normally, some maintenance and reinforcement measures are required [9,10]. A reasonable reinforcement scheme is based on an accurate structural performance assessment [11,12,13]. However, there are uncertainties in predicting structural resistance and load effects [14,15,16]. Therefore, the probabilistic methods are often used in structural performance evaluation [17,18,19,20]. Failure probability and reliability indexes are common performance indicators that are used to describe the uncertainty [21,22]. Fragility models are commonly used in structural performance evaluation that consider the uncertainties under extreme actions [23,24]. Here, we use the failure probability and reliability indexes as evaluation indicators. In general, it is difficult to obtain an analytical solution for these two indicators [25]. Therefore, numerical methods are proposed, such as Monte Carlo simulation and the first-order and second moment (FOSM) method [26,27]. In this paper, the reliability index is selected as the evaluation index.
A bridge is a complex system with multiple failure modes and components. The reliability of a single component cannot reflect the overall condition of the bridge structure. System reliability is an important index that is used to evaluate the system safety. In recent years, the bridge system reliability analysis has become a primary concern. Lu et al. [28] presented a framework as a general tool for system reliability evaluation of cable-stayed bridges subjected to cable degradation and demonstrated the influence of cable degradation on the system reliability. Gao et al. [29] proposed an efficient method to identify the dominant failure modes for a long-span bridge system and demonstrated that it was a suitable method for system reliability analysis. Liu et al. [30] presented the mixed copula models for the time-independent system reliability analysis of the series and parallel systems, and analyzed the nonlinear correlation between failure modes. Wang et al. [31] proposed a semi-analytical method to assess the system reliability of a series bridge network subjected to non-stationary loads and investigated the sensitivity of system reliability to the load intensity, number of components and resistance correlation. Liu et al. [32] proposed an adaptive support vector regression method for system reliability assessment and utilized a prestressed concrete (PC) cable-stayed bridge to verify the applicability of this method. Significant researches have been devoted to reliability evaluation of complex bridge system. However, there are few researches focused on the system reliability evaluation of the prefabricated RC hollow slab bridge. The system reliability is usually evaluated using traditional methods, such as the series and parallel methods.
The analytic hierarchy process (AHP), developed by Satty, is a multi-criteria decision-making approach with the characteristics of systematic analysis and easy applicability, and has been widely used in many aspects, such as environmental protection, economic management and strategy decisions [33]. Due to these characteristics, AHP has been applied in the field of bridge engineering, such as bridge risk evaluation and condition assessment, in recent years. Sasmal et al. [34] proposed a systematic methodology for priority ranking towards condition assessment of RC bridges based on AHP and applied the methodology to help bridge managers determine the maintenance order of the bridges. In order to determine the risk level, Peng et al. [35] used AHP to obtain the weight of risk criteria and risk resources in bridge risk evaluation. Wang et al. [33] investigated the influence of 24 parameter cases on the seismic responses of a triple-tower suspension bridge and applied AHP to find the optimal case of evaluation of seismic performance. Lu et al. [36] presented a reliable method for risk assessment of cable system construction of suspension bridges and calculated the weights of the risk evaluation index system based on AHP. Cho et al. [37] applied AHP to determine the importance of random variables in probabilistic risk assessment for the construction phases of a prestressed concrete box girder. However, AHP is still rarely used to assess bridge system reliability.
In this study, we proposed a new method to evaluate the system reliability of the superstructure of the prefabricated RC hollow slab bridge based on the modified AHP. The modified AHP has improved the construction of the judgment matrix based on traditional AHP. Hinge joint damage often occurs in the prefabricated RC hollow slab bridge [2]. Different hinge joints damage cases were considered while evaluating the system reliability in this paper. Then, a simply supported prefabricated RC hollow slab bridge was selected as a case study to illustrate the applicability of the proposed system reliability evaluation method compared with the traditional series and parallel methods.

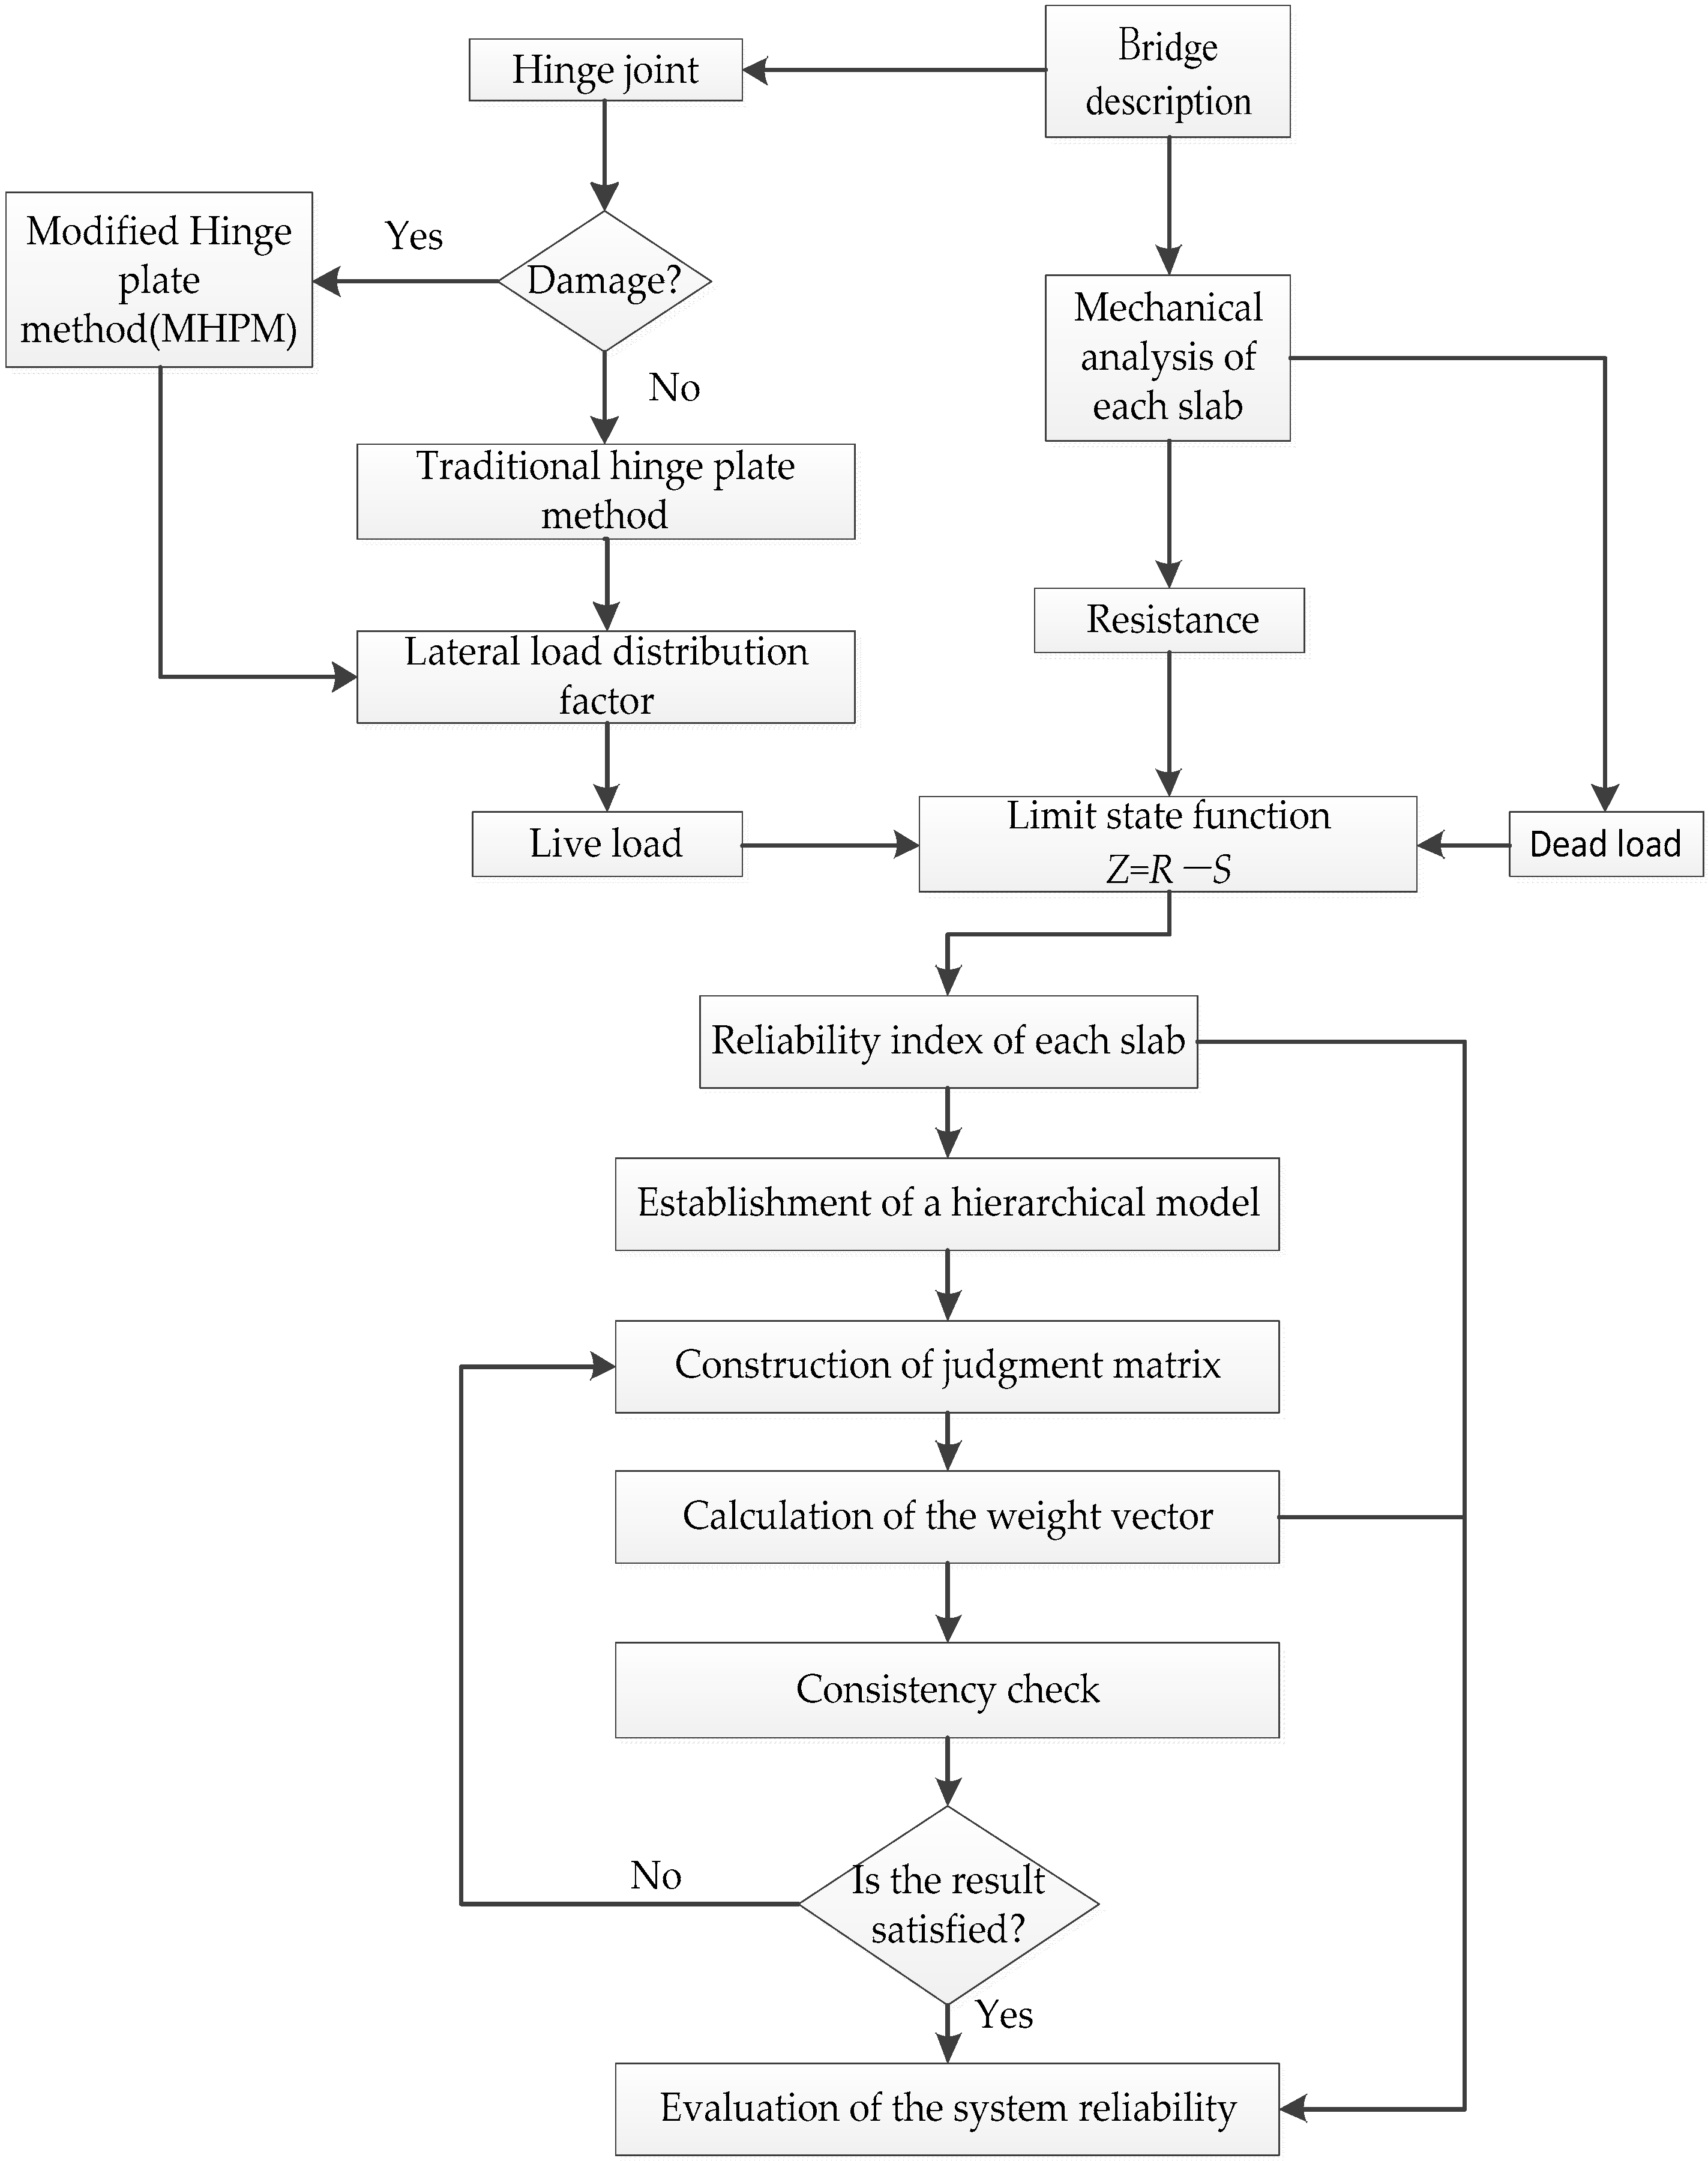
2. System Reliability Evaluation Methods

2.1. Traditional System Reliability Evaluation Method

Bridge structure is composed of multiple components, and the system reliability level is closely related to the reliability of a single component. The reliability level related to a particular limit state is then quantified via the failure probability or reliability index. Failure probability is defined in Equation (1), and the corresponding reliability index can be computed following Equation (2):
p f i = P ( Z i 0 ) = D f f X ( X ) d X ,
β i = Φ 1 ( 1 p f i ) ,
where p f i , β i and Z i represent the failure probability, reliability index and the limit state function of the ith component, respectively. f X ( X ) is the joint probability distribution function (PDF). D f is the failure domain, where Z i 0 . Φ 1 ( ) is the inverse of cumulative distribution function of standard normal variate.
For the series system, the failure probability of the system is defined following Equation (3);
p f = P ( i = 1 n Z i 0 ) = i = 1 n Z i 0 f X ( X ) d X .
For the parallel system, the failure probability of the system is defined using Equation (4):
p f = P ( i = 1 n Z i 0 ) = i = 1 n Z i 0 f X ( X ) d X .
However, the PDF is not easy to obtain as the calculation of the integral is very difficult. Therefore, some approximation methods have been proposed to solve this problem, such as the series method and the parallel method [38], which are represented by Equations (5) and (6), respectively:
m a x 1 i n p f i p f 1 i = 1 n ( 1 p f i ) ,
i = 1 n p f i p f m i n 1 i n p f i .

2.2. System Reliability Evaluation Method Based on the Modified AHP

AHP is a decision-making method that combines qualitative and quantitative solutions to solve complex problems of multiple objectives. Considering the subjectivity of the traditional AHP method in constructing the judgment matrix, an objective judgment matrix construction method suitable for evaluating the bridge system reliability is proposed to modify the traditional AHP in this research. The modified hinge plate method (MHPM) was adopted to consider hinge joint damage in the system reliability evaluation. The specific system reliability evaluation process based on modified AHP is shown in Figure 1.

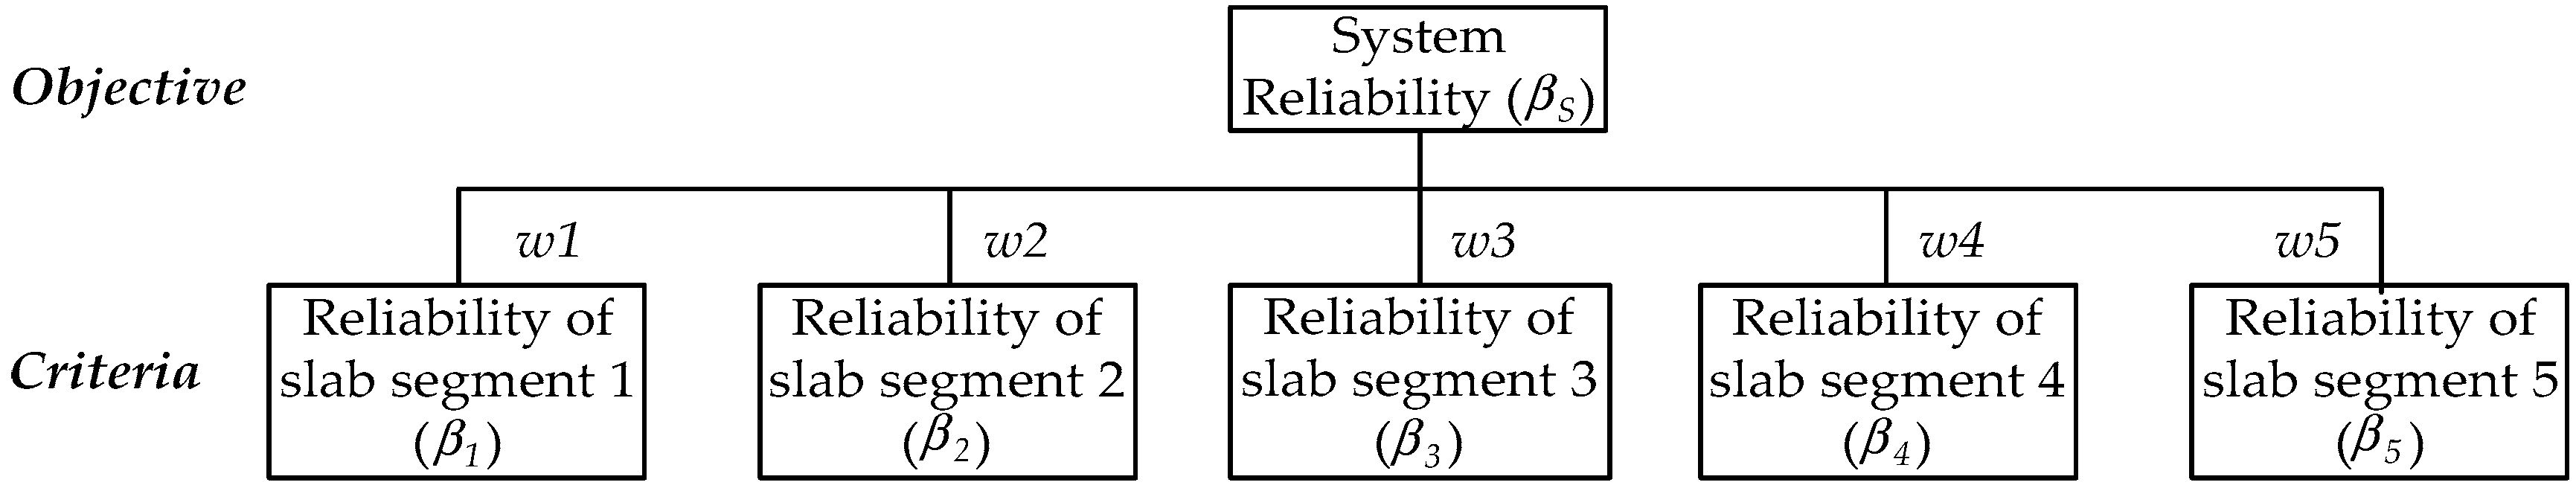
2.2.1. Establishment of a Hierarchical Mode

System reliability is closely related to the reliability of a single component. Figure 2 shows the hierarchical model.

2.2.2. Calculation of Reliability of Each Slab Segment

For small-to-medium-span RC hollow slab girder bridges, the failure mode of the slab segment is generally the bending failure and the shear failure. In this paper, we use the bending failure mode as the failure mode of the system, and analyzed the system reliability index under the bending failure mode. The system reliability evaluation process under the shear failure mode is basically similar and will not be described in detail in this paper. Therefore, according to the limit state function of the bending failure of each slab segment, the reliability index β is calculated by FOSM. Then, the reliability indexes of all slab segments are represented as a row vector, β = ( β 1 , β 2 β n ) .

2.2.3. Constructing Judgment Matrix

(1) Traditional Method
The traditional AHP method combined expert experience and a 9-point scale (shown in Table 1) to construct a judgment matrix A . Table 1 shows the definition of the element a i j in the judgment matrix, in which a i j indicates the relative importance of the ith factor over the jth factor.
(2) The Modified Construction Method of Judgement Matrix
The core content of the AHP method is to construct a judgement matrix. An objective construction method of a judgment matrix is proposed, which considers the subjectivity of the traditional AHP method in constructing the judgment matrix. The judgment matrix is constructed for the two cases of hinge joint damaged and hinge joint undamaged, respectively.
a.Hinge joint undamaged
The superstructure is composed of several slab segments, and the system failure probability is closely related to the failure probability of a single component. Equation (2) shows the relationship between the reliability index and the failure probability. Therefore, the elements of the judgment matrix a i j can be represented by the reliability index of each slab segment, as shown in Equation (7):
a i j = β j β i
where β i and β j represent the reliability index of the ith slab segment and the jth slab segment, respectively.
b.Hinge joint damaged
The judgment matrices are constructed separately for different damage cases. In each damage case, the hinge joints have different damage degrees in the scope of (0%, 100%). The range analysis of the reliability of each slab segment is performed under the same damage case. Then, the elements of the judgment matrix a i j can be represented by the range of each slab segment, as shown in Equation (8):
a i j = R β i R β j = m a x ( β i 0 % : β i 100 % ) m i n ( β i 0 % : β i 100 % ) m a x ( β j 0 % : β j 100 % ) m i n ( β j 0 % : β j 100 % )
where R β i and R β j represent the range of reliability for slab segment i and j . β i 0 % and β i 100 % mean the reliability indexes of slab segment i when the damage degree are 0% and 100%. Similarly, β j 0 % and β j 100 % have the same meaning.

2.2.4. Calculations of Weight Vector and Largest Eigenvalue

The weight vector W = ( ω 1 ; ω 2 ω n ) and the largest eigenvalue λ m a x of the judgement matrix are calculated according to Equations (9) and (10):
ω i = j = 1 n a i j n j = 1 n a i j n ,
λ m a x = 1 n i = 1 n ( A W ) i ω i .

2.2.5. Checking the Performance Consistency of the Judgement Matrix

The consistency index C I and the consistency ratio C R can be calculated with the random consistency index R I (shown in Table 2) based on Equations (11) and (12):
C I = λ m a x n n 1 ,
C R = C I R I .

2.2.6. System Reliability

The superstructure of the prefabricated RC hollow slab bridge is composed of several slab segments. The performance and damage condition of each slab segment will have different effects on the performance of the superstructure system. In order to evaluate the system reliability more reasonably, the influence of the reliability of each slab segment on the system reliability is considered comprehensively by means of the idea of the AHP method. Then, the system reliability can be expressed as a weighted summation of the reliability of each slab segment, as shown in Equation (13):
β S = β W = β 1 ω 1 + β 2 ω 2 β n ω n .

3. Results and Discussion

3.1. Bridge Description

A typical highway bridge is selected as the case study to verify the applicability of the proposed system reliability evaluation method for a bridge superstructure. The bridge is located at Baiquan County, Heilongjiang Province, China. This simple span, reinforced concrete, hollow slab structure is 10.0 m long and about 7.5 m wide, and is composed of five slab segments. Its total length is 14.2 m. The bridge overview is shown in Figure 3.

3.2. Influence of Hinge Joint Damage on Lateral Load Distribution Factor

According to the characteristics of the bridge, all damage cases of hinge joints are listed in Table 3. Here, the damage degree refers to the average damage degree of a hinge joint within the span of the bridge. According to the theory of load lateral distribution, the hinge joint damage will affect the load lateral distribution factor (LLDF), and then result in the change in the design value of live load for each slab segment. The reliability of each slab segment varies with the changes in the LLDF. Therefore, the influence of hinge joint damage on LLDF should be considered first.
Using the modified hinge plate method (MHPM) proposed by our previous research [28], the influence lines of load lateral distribution under different damage cases of hinge joints are analyzed. According to the most unfavorable loading position of live load, the LLDF of different cases are calculated as shown in Table 4. In order to visually analyze the influence of different damage cases on the LLDF of each slab segment, the range analysis of the LLDF is conducted and the results are shown in Figure 4.
As can be seen from Table 4 and Figure 4, the hinge joint damage has an effect on each slab segment. The LLDF increases as the damage degree increases. Meanwhile, the range values of LLDF increase with the number of damaged hinge joints. The effect of damaged hinge joint 2 or 3 on LLDF is much greater than that of damaged hinge joint 1 or 4.

3.3. Component Reliability

It is necessary to calculate the reliability index of each slab segment under different damage cases of hinge joints before evaluating the system reliability. Then, the bending limit state function is established by Equation (14):
Z = R λ G ( S G 1 + S G 2 ) λ Q S Q
where Z is the limit state function; R , S G 1 , S G 2 and S Q are random variables, represent the resistance, dead load, secondary dead load and live load, respectively; λ G and λ Q represent partial coefficients of dead load and live load, respectively, λ G = 1.2 , λ Q = 1.4 .
The design values of these random variables are calculated separately according to Equations (15)–(18):
R d = f c d b f x ( h 0 x / 2 )
where f c d is the compressive strength of concrete; b f is the effective width of concrete flange; x represents the depth of compression; h 0 is the effective height.
S G 1 k d = g 1 L 2 8 ,
where L is the calculated span; g 1 and g 2 represent the load intensity of dead load and secondary dead load, respectively.
S Q k d = ( 1 + μ ) m ( q k Ω k + P k y k ) ,
where μ is the impact coefficient; m is the load lateral distribution factor (LLDF); q k and P k represent the uniform load and the concentrated load, respectively; y k = L 4 , Ω k = L 2 8 .
According to the design values of these four random variables, Table 5 gives the statistic parameters of the random variables. The statistical parameters and probability distributions are based on Chinese national standard GB/T 50283-1999.
The reliability indexes of a single slab segment are calculated by FOSM under different damage cases of hinge joints based on the statistic parameters in Table 5 and Equation (14). The reliability indexes of each slab segment are listed in Table 6. Then, the range analysis of reliability for each case is performed, as shown in Table 7 and Figure 5.
Comparing Figure 4 with Figure 5, it can be seen that the variation tendency of the range analysis values of the reliability indexes and LLDF under different damage cases of hinge joints is basically the same. Different damaged hinge joints have different effects on the reliability index.

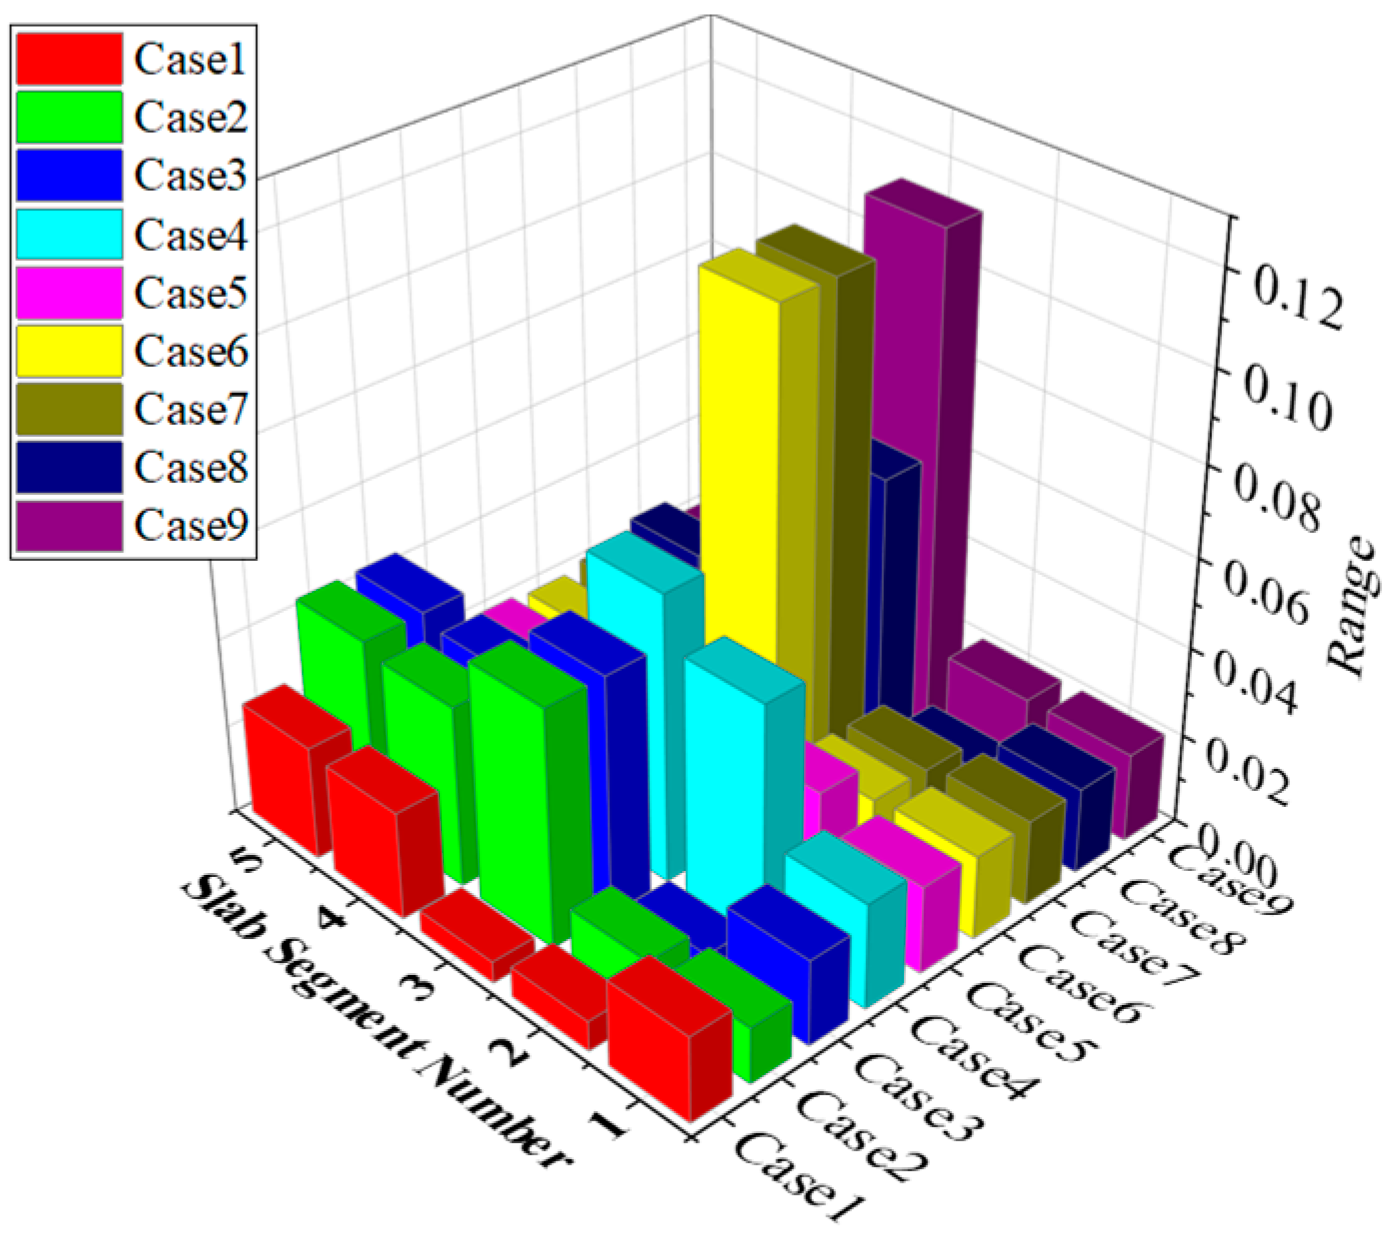
3.4. System Reliability

According to the method proposed in this paper, the system reliability of the case study can be evaluated.
Firstly, a hierarchical model shown in Figure 2 is established.
Secondly, the judgment matrices of different damage cases of hinge joints are established. When the hinge joints are intact, the element a i j is calculated according to Equation (7) and the judgment matrix A i n t a c t is constructed. When the hinge joints are damaged, the element a i j is calculated according to Equation (8) and the corresponding judgment matrices are established.
A i n t a c t = [ 1.000 1.083 1.089 1.083 1.000 0.924 1.000 1.006 1.000 0.924 0.918 0.994 1.000 0.994 0.918 0.924 1.000 1.006 1.000 0.924 1.000 1.083 1.089 1.083 1.000 ] A c a s e 1 = [ 1.000 2.934 4.099 0.816 0.753 0.314 1.000 1.397 0.278 0.257 0.244 0.716 1.000 0.199 0.184 1.226 3.597 5.026 1.000 0.923 1.328 3.896 5.444 1.083 1.000 ] A c a s e 2 = [ 1.000 1.086 0.242 0.317 0.293 0.921 1.000 0.223 0.292 0.270 4.133 4.487 1.000 1.312 1.212 3.150 3.420 0.762 1.000 0.924 3.409 3.701 0.825 1.082 1.000 ] A c a s e 3 = [ 1.000 3.685 0.369 0.484 0.447 0.271 1.000 0.100 0.131 0.121 2.711 9.988 1.000 1.312 1.212 2.066 7.613 0.762 1.000 0.924 2.236 8.238 0.825 1.082 1.000 ] A c a s e 4 = [ 1.000 0.452 0.375 1.840 1.696 2.211 1.000 0.829 4.068 3.750 2.667 1.207 1.000 4.908 4.525 0.543 0.246 0.204 1.000 0.922 0.589 0.267 0.221 1.085 1.000 ] A c a s e 5 = [ 1.000 0.753 0.598 0.753 1.000 1.328 1.000 0.794 1.000 1.328 1.672 1.260 1.000 1.260 1.672 1.328 1.000 0.794 1.000 1.328 1.000 0.753 0.598 0.753 1.000 ] A c a s e 6 = [ 1.000 1.083 0.169 1.083 1.000 0.924 1.000 0.156 1.000 0.924 5.907 6.395 1.000 6.395 5.907 0.924 1.000 0.156 1.000 0.924 1.000 1.083 0.169 1.083 1.000 ] A c a s e 7 = [ 1.000 1.128 0.174 1.016 0.938 0.887 1.000 0.154 0.901 0.832 5.754 6.488 1.000 5.849 5.397 0.984 1.109 0.171 1.000 0.923 1.066 1.202 0.185 1.084 1.000 ] A c a s e 8 = [ 1.000 1.876 0.305 0.368 0.782 0.553 1.000 0.163 0.196 0.417 3.275 6.142 1.000 1.207 2.559 2.714 5.091 0.829 1.000 2.121 1.279 2.400 0.391 0.471 1.000 ] A c a s e 9 = [ 1.000 1.034 0.180 1.034 1.000 0.967 1.000 0.174 1.000 0.967 5.548 5.736 1.000 5.736 5.548 0.967 1.000 0.174 1.000 0.967 1.000 1.034 0.180 1.034 1.000 ] .
Thirdly, the weight vector W = ( ω 1 ; ω 2 ω n ) and the largest eigenvalue λ m a x are calculated according to Equations (9) and (10). Then, the performance consistency of the judgement matrix is checked according to Equations (11) and (12). The results are shown in Table 8.
As can be seen in Table 8, the CR value of each matrix is less than 0.1, which means that all judgment matrices meet the consistency requirement.
Lastly, the system reliability indexes are calculated according to Equation (13). When the hinge joints are intact, the reliability indexes of each slab segment are shown in Table 6, and the system reliability index can be calculated as follows:
β S i n t a c t   =   0.2098 × 4.314   +   0.1938 × 4.671   +   0.1926 × 4.698   +   0.1938 × 4.671   +   0.2098 × 4.314 = 4.526 .
When the hinge joint is damaged, in order to ensure a more secure system reliability evaluation result, the minimum reliability indexes of different damage degrees of each slab segment under different damage cases of hinge joints are selected. The minimum reliability indexes taken from Table 6 are shown in Table 9. Then, the system reliability indexes considering the hinge joint damage can be calculated according to Equation (13).
β S c a s e 1   =   0.2416 × 4.253   +   0.0824 × 4.649   +   0.0589 × 4.673   +   0.2963 × 4.574   +   0.3208 × 4.232 = 4.399 .
β S c a s e 2   =   0.0793 × 4.274   + 0.0730 × 4.612   + 0.3277 × 4.506   + 0.2498 × 4.521   + 0.2703 × 4.176 = 4.409 .
β S c a s e 3   =   0.1207 × 4.253   + 0.0328 × 4.633   + 0.3272 × 4.505   + 0.2494 × 4.521   + 0.2699 × 4.176 =   4.393 .
β S c a s e 4   =   0.1426 × 4.238 + 0.3153 × 4.481 + 0.3804 × 4.470 + 0.0775 × 4.608 + 0.0841 × 4.270 = 4.434 .
β S c a s e 5   =   0.1580 × 4.251 + 0.2098 × 4.565 + 0.2643 × 4.567 + 0.2098 × 4.565 + 0.1580 × 4.251 = 4.466 .
β S c a s e 6   =   0.1025 × 4.254 + 0.0947 × 4.594 + 0.6056 × 4.317 + 0.0947 × 4.594 + 0.1025 × 4.254 = 4.356 .
β S c a s e 7   =   0.1032 × 4.253 + 0.0915 × 4.594 + 0.5938 × 4.317 + 0.1015 × 4.588 + 0.1100 × 4.248 = 4.355 .
β S c a s e 8   =   0.1136 × 4.253 + 0.0606 × 4.616 + 0.3721 × 4.470 + 0.3084 × 4.481 + 0.1454 × 4.235 = 4.424 .
β S c a s e 9   =   0.1055 × 4.250 + 0.1020 × 4.587 + 0.5851 × 4.317 + 0.1020 × 4.587 + 0.1055 × 4.250 = 4.357 .
In order to verify the applicability of the proposed system reliability evaluation method, the system reliability indexes were also calculated by traditional methods under different damage cases of hinge joints according to Equations (5) and (6). The results are shown in Table 10.
Then, the calculation results of the proposed method in this paper and the traditional methods are compared with the target reliability index, as shown in Figure 6. At present, the system reliability does not have a specified target reliability index. Therefore, the target reliability index of the component is adopted as the evaluation criteria. In accordance with the standard [39], the target reliability index is chosen for the RC2 reliability class, β T = 4.2 .
As can be seen form Table 10 and Figure 6, the average values of the system reliability indexes calculated by the series method are mostly less than the target reliability index (4.2). In particular, when the hinge joints are intact, the system reliability index is already close to the target reliability index (4.2). When the reliability index is less than the target reliability index, it means that the structure has failed. Obviously, the calculation results of the series method are too conservative and may result in an unreasonable allocation of maintenance funds in maintenance management. The lower bound value of the system reliability index calculated by the parallel method is the maximum reliability index of all slab segments under different damage cases, and the upper bound value is infinite. The results may overestimate the reliability level of the structure and cannot objectively evaluate the actual structural performance, which will result in potential security risks in the structure. The calculation results of the method proposed in this paper are larger than the average values of the series method and smaller than the lower bound values of the parallel method. It shows that the method proposed in this paper is more reasonable and accurate than the traditional methods. In addition, as the number of damaged hinge joints increases, the system reliability indexes show a declining trend, but it is not a linear changing process. Comparing different damage cases of hinge joints, it can be inferred that the influence of hinge joint 1 or 2 on the system reliability is greater than that of hinge joint 3 or 4 on the system reliability.

4. Conclusions

The aim of the paper was to propose a new method to evaluate the system reliability of the superstructure of the prefabricated RC hollow slab bridge considering hinge joint damage based on the modified AHP. An objective construction method of the judgment matrix was presented to modify the traditional AHP. The MHPM was used to analyze the effect of hinge joint damage on system reliability. The case study of the simply supported prefabricated RC hollow slab bridge has performed the process of system reliability evaluation. The following conclusions were obtained:
  • Hinge joint damage has an effect on both LLDF and the reliability index of each slab segment under different damage cases. As the damage degree of hinge joint and the number of damaged hinge joint increases, the LLDF of each slab segment increases, and the corresponding reliability index decreases gradually.
  • The evaluation results of system reliability by the traditional series and parallel methods are either too conservative or too radical. Compared with the traditional methods, the method proposed in this paper is more suitable to evaluate the system reliability index of the prefabricated RC hollow slab bridge and the calculation results of the system reliability indexes were more reasonable and accurate.
  • Hinge joint damage had a certain influence on the system reliability but will not cause system failure. Different damaged hinge joints have different effects on system reliability. Hinge joint 2 or 3 has a greater influence on the system reliability than that of hinge joint 1 or 4.

Author Contributions

Conceptualization, H.L. and G.T.; formal analysis, H.L. and G.T.; funding acquisition, H.L. and G.T.; investigation, X.W., X.H. and G.L.; methodology, X.W. and G.T.; software, X.W. and G.L.; writing—original draft, H.L. and X.W.; writing—review and editing, G.T.

Funding

This research was funded by the National Natural Science Foundation of China (grant numbers 51478203 and 51978309); Science and Technology Project of Education Department of Jilin Province (grant number JJKH20190150KJ); Scientific and Technological Project of Science and Technology Department of Jilin Province (grant number of 20190303052SF); Budget Capital Construction Fund of Jilin Province (grant number 2019C041-5).

Acknowledgments

The authors would like to thank the anonymous reviewers for their constructive suggestions and comments to improve the quality of the paper.

Conflicts of Interest

The authors declare no conflict of interest.

References

  1. Val, D.V.; Chernin, L. Serviceability reliability of reinforced concrete beams with corroded reinforcement. J. Struct. Eng. 2009, 135, 896–905. [Google Scholar] [CrossRef]
  2. Liu, H.B.; He, X.; Jiao, Y.B. Damage identification algorithm of hinged joints for simply supported slab bridges based on modified hinge plate method and artificial bee colony algorithms. Algorithms 2018, 11, 198. [Google Scholar] [CrossRef]
  3. Liu, H.B.; He, X.; Jiao, Y.B.; Wang, X.R. Reliability assessment of deflection limit state of a simply supported bridge using vibration data and dynamic Bayesian network inference. Sensors 2019, 19, 837. [Google Scholar] [CrossRef] [PubMed]
  4. Tolentino, D.; Carrillo-Bueno, C.A. Evaluation of structural reliability for reinforced concrete buildings considering the effect of corrosion. KSCE. J. Civ. Eng. 2018, 22, 1344–1353. [Google Scholar] [CrossRef]
  5. Stewart, M.G.; Wang, X.M.; Nguyen, M.N. Climate change adaptation for corrosion control of concrete infrastructure. Struct. Saf. 2012, 35, 29–39. [Google Scholar] [CrossRef]
  6. El Hassan, J.; Bressolette, P.; Chateauneuf, A.; El Tawil, K. Reliability–based assessment of the effect of climatic conditions on the corrosion of RC structures subject to chloride ingress. Eng. Struct. 2010, 32, 3279–3287. [Google Scholar] [CrossRef]
  7. Alipour, A.; Shafei, B.; Shinozuka, M.S. Capacity loss evaluation of reinforced concrete bridges located in extreme chlorideladen environments. Struct. Infrastruct. Eng. 2013, 9, 8–27. [Google Scholar] [CrossRef]
  8. Neves, R.; Torrent, R.; Imamoto, K. Residual service life of carbonated structures based on site non-destructive tests. Cem. Concr. Res. 2018, 109, 10–18. [Google Scholar] [CrossRef]
  9. Sajedi, S.; Huang, Q.D. Reliability–based life–cycle–cost comparison of different corrosion management strategies. Eng. Struct. 2019, 186, 52–63. [Google Scholar] [CrossRef]
  10. Cleland, D.J.; Tharmarajah, G.; Robinson, D.; Taylor, S.E. Corrosion-resistant FRP reinforcement for bridge deck slabs. Bridge Eng. 2015, 168, 208–217. [Google Scholar]
  11. Anoop, M.B.; Rao, K.B.; Raghuprasad, B.K. Performancebased remaining life assessment of reinforced concrete bridge girders. Comput. Concr. 2016, 18, 69–97. [Google Scholar] [CrossRef]
  12. Eamon, C.D.; Jensen, E.A.; Grace, N.F.; Shi, X.W. Lifecycle cost analysis of alternative reinforcement materials for bridge superstructures considering cost and maintenance uncertainties. J. Mater. Civ. Eng. 2012, 24, 373. [Google Scholar] [CrossRef]
  13. Zhu, J.S.; Liu, B.Q. Performance life cost-Based maintenance strategy optimization for reinforced concrete girder bridges. J. Bridge Eng. 2013, 18, 172–178. [Google Scholar] [CrossRef]
  14. Allahvirdizadeh, R.; Gholipour, Y. Reliability evaluation of predicted structural performances using nonlinear static analysis. Bull. Earthq. Eng. 2017, 15, 2129–2148. [Google Scholar] [CrossRef]
  15. Strauss, A.; Karimi, S.; Kopf, F.; Capraru, C.; Bergmeister, K. Monitoringbased performance assessment of railbridge interaction based on structural reliability. Struct. Concr. 2015, 16, 342–355. [Google Scholar] [CrossRef]
  16. Ghosn, M.; Dueñas-Osorio, L.; Frangopol, D.M.; McAllister, T.P.; Bocchini, P.; Manuel, L.; Ellingwood, B.R.; Arangio, S.; Bontempi, F.; Shah, M.; et al. Performance indicators for structural systems and infrastructure networks. J. Struct. Eng. 2016, 142, F4016003. [Google Scholar] [CrossRef]
  17. Leander, J. Reliability evaluation of the Eurocode model for fatigue assessment of steel bridges. J. Constr. Steel Res. 2018, 141, 1–8. [Google Scholar] [CrossRef]
  18. Gu, Q. Performance and risk assessment of soilstructure interaction systems based on finite element reliability methods. Math. Probl. Eng. 2014, 2014, 1–16. [Google Scholar] [CrossRef]
  19. Zhou, J.; Zhi, X.D.; Fan, F.; Jiao, A.L.; Qian, H.L. Anchor design of a ring joint based on reliability in a precast shear wall structure. Appl. Sci. 2019, 9, 3361. [Google Scholar] [CrossRef]
  20. Chen, H.P.; Xiao, N. Symptombased reliability analyses and performance assessment of corroded reinforced concrete structures. Struct. Eng. Mech. 2015, 53, 1183–1200. [Google Scholar] [CrossRef]
  21. Mochocki, W.; Radoń, U. Analysis of basic failure scenarios of a truss tower in a probabilistic approach. Appl. Sci. 2019, 9, 2662. [Google Scholar] [CrossRef]
  22. Valdebenito, M.A.; Pradlwarter, H.J.; Schueller, G.I. The role of the design point for calculating failure probabilities in view of dimensionality and structural nonlinearities. Struct. Saf. 2010, 32, 101–111. [Google Scholar] [CrossRef]
  23. Brunesi, E.; Parisi, F. Progressive collapse fragility models of European reinforced concrete framed buildings based on pushdown analysis. Eng. Struct. 2017, 152, 579–596. [Google Scholar] [CrossRef]
  24. Vela, R.J.M.; Brunesi, E. Seismic assessment of an industrial frametank system: Development of fragility functions. Bull. Earthq. Eng. 2019, 17, 2569–2602. [Google Scholar] [CrossRef]
  25. Saydam, D.; Frangopol, D.M. Applicability of simple expressions for bridge system reliability assessment. Comput. Struct. 2013, 114, 59–71. [Google Scholar] [CrossRef]
  26. Huang, P.; Huang, H.Z.; Huang, T.D. A novel algorithm for structural reliability analysis based on finite step length and armijo line search. Appl. Sci. 2019, 9, 2546. [Google Scholar] [CrossRef] [Green Version]
  27. Patelli, E.; Feng, G.; Coolen, F.P.; Coolen–Maturi, T. Simulation methods for system reliability using the survival signature. Reliab. Eng. Syst. Saf. 2017, 167, 327–337. [Google Scholar] [CrossRef] [Green Version]
  28. Lu, N.W.; Liu, Y.; Beer, M. System reliability evaluation of in-service cablestayed bridges subjected to cable degradation. Struct. Infrastruct. Eng. 2018, 14, 1486–1498. [Google Scholar] [CrossRef]
  29. Gao, X.; Li, S.L. Dominant failure modes identification and structural system reliability analysis for a longspan arch bridge. Struct. Eng. Mech. 2017, 63, 799–808. [Google Scholar]
  30. Liu, Y.F.; Fan, X.P. Timeindependent reliability analysis of bridge system based on mixed copula models. Math. Probl. Eng. 2016, 2016, 2720614. [Google Scholar] [CrossRef] [Green Version]
  31. Wang, C.; Zhang, H.; Li, Q.W. Timedependent reliability assessment of aging series systems subjected to non-stationary loads. Struct. Infrastruct. Eng. 2017, 13, 1513–1522. [Google Scholar] [CrossRef]
  32. Liu, Y.; Lu, N.W.; Yin, X.F.; Noori, M. An adaptive support vector regression method for structural system reliability assessment and its application to a cablestayed bridge. Proc. Inst. Mech. Eng. Part O J. Risk Reliab. 2016, 230, 204–219. [Google Scholar] [CrossRef]
  33. Wang, H.; Wu, Y.H.; Sha, B.; Zheng, W.Z.; Gao, Y.Q. Compositive optimal control for the seismic response of a longSpan triple–tower suspension bridge. Int. J. Struct. Stab. Dyn. 2018, 18, 1840009. [Google Scholar] [CrossRef]
  34. Sasmal, S.; Ramanjaneyulu, K.; Lakshmanan, N. Priority ranking towards condition assessment of existing reinforced concrete bridges. Struct. Infrastruct. Eng. 2017, 3, 75–89. [Google Scholar] [CrossRef]
  35. Peng, K.K. Risk evaluation for bridge engineering based on cloudclustering group decision method. J. Perform. Constr. Facil. 2019, 33, 1–8. [Google Scholar] [CrossRef]
  36. Lu, Z.F.; Wei, C.F.; Liu, M.Y.; Deng, X.G. Risk assessment method for cable system construction of longspan suspension bridge based on cloud model. Adv. Civ. Eng. 2019, 2019, 1–9. [Google Scholar] [CrossRef]
  37. Cho, T.; Lee, J.B.; Kim, S.S. Probabilistic risk assessment for the construction phases of a PSC box girder railway bridge system with six sigma methodology. KSCE. J. Civ. Eng. 2015, 15, 119–130. [Google Scholar] [CrossRef]
  38. Cornell, C.A. Bounds on the reliability of structural systems. J. Struct. Eng. 1967, 93, 171–200. [Google Scholar]
  39. Ministry of Communications of the People’s Republic of China. Unified Standard for Reliability Design of Highway Engineering Structures; Ministry of Construction of the People’s Republic of China: Beijing, China, 1999. (In Chinese)
Figure 1. Flow chart of system reliability evaluation.
Applsci 09 04841 g001
Figure 2. Hierarchical model of system reliability evaluation.
Applsci 09 04841 g002
Figure 3. Geometry and cross section for the case study bridge (all dimensions are in m): (a) a side view of the bridge, (b) the crosssection of the bridge and (c) the detailed crosssection of a slab segment.
Applsci 09 04841 g003
Figure 4. Range analysis of the load lateral distribution factor (LLDF).
Applsci 09 04841 g004
Figure 5. Range analysis of reliability index.
Applsci 09 04841 g005
Figure 6. Comparisons of system reliability indexes calculated by different methods.
Applsci 09 04841 g006
Table 1. Definition of the element in the judgement matrix.
Relative Importance a i j   Verbal Judgement of Importance
1Factor i is as important as j
3Factor i is slightly more important than j
5Factor i is more important than j
7Factor i is significantly more important than j
9Factor i is absolutely more important than j
2,4,6,8Between two importance levels
Table 2. The random consistency index RI.
n1234567891011
RI000.580.901.121.241.321.411.451.491.51
If C R < 0.1 , the judgement matrix satisfies the consistency.
Table 3. Damage cases of hinge joints.
Case NumberDamaged Hinge JointsDamage Degrees
1hinge joint 1intact, 20%, 40%, 60%, 80% and 100%
2hinge joint 2
3hinge joints 1 and 2
4hinge joints 1 and 3
5hinge joints 1 and 4
6hinge joints 2 and 3
7hinge joints 1, 2 and 3
8hinge joints 1, 2 and 4
9hinge joints 1, 2, 3 and 4
Table 4. LLDF under different damage cases of hinge joints.
Case NumberSlab Segment NumberDamage DegreeCase NumberSlab Segment NumberDamage Degree
Intact20%40%60%80%100%Intact20%40%60%80%100%
Case 11 0.4807 0.4860 0.4903 0.4941 0.4972 0.5000 Case 61 0.4807 0.4948 0.4993 0.4995 0.4973 0.4934
2 0.3746 0.3728 0.3712 0.3699 0.3688 0.3678 2 0.3746 0.3880 0.3923 0.3925 0.3904 0.3866
3 0.3670 0.3657 0.3646 0.3637 0.3629 0.3622 3 0.3670 0.3862 0.4068 0.4292 0.4535 0.4800
4 0.3746 0.3812 0.3868 0.3914 0.3955 0.3989 4 0.3746 0.3880 0.3923 0.3925 0.3904 0.3866
5 0.4807 0.4877 0.4935 0.4984 0.5026 0.5063 5 0.4807 0.4948 0.4993 0.4995 0.4973 0.4934
Case 21 0.4807 0.4850 0.4881 0.4903 0.4920 0.4934 Case 71 0.4807 0.4961 0.4996 0.4998 0.4995 0.5000
2 0.3746 0.3787 0.3816 0.3837 0.3854 0.3866 2 0.3746 0.3873 0.3921 0.3922 0.3884 0.3800
3 0.3670 0.3855 0.3983 0.4077 0.4150 0.4207 3 0.3670 0.3859 0.4068 0.4291 0.4533 0.4800
4 0.3746 0.3886 0.3984 0.4056 0.4111 0.4155 4 0.3746 0.3905 0.3941 0.3934 0.3906 0.3866
5 0.4807 0.4955 0.5058 0.5134 0.5192 0.5238 5 0.4807 0.4975 0.5013 0.5005 0.4975 0.4934
Case 31 0.4807 0.4888 0.4934 0.4964 0.4985 0.5000 Case 81 0.4807 0.4922 0.4963 0.4980 0.4989 0.5000
2 0.3746 0.3768 0.3781 0.3789 0.3795 0.3800 2 0.3746 0.3817 0.3847 0.3852 0.3836 0.3800
3 0.3670 0.3902 0.4033 0.4115 0.4170 0.4207 3 0.3670 0.3902 0.4050 0.4160 0.4246 0.4318
4 0.3746 0.3923 0.4022 0.4085 0.4126 0.4155 4 0.3746 0.3922 0.4044 0.4138 0.4216 0.4282
5 0.4807 0.4993 0.5098 0.5163 0.5207 0.5238 5 0.4807 0.4995 0.5051 0.5054 0.5033 0.5000
Case 41 0.4807 0.4967 0.5030 0.5044 0.5030 0.5000 Case 91 0.4807 0.4981 0.5007 0.5002 0.4995 0.5000
2 0.3746 0.3882 0.3997 0.4100 0.4194 0.4282 2 0.3746 0.3902 0.3945 0.3936 0.3888 0.3800
3 0.3670 0.3851 0.3993 0.4114 0.4221 0.4318 3 0.3670 0.3921 0.4149 0.4365 0.4578 0.4800
4 0.3746 0.3830 0.3867 0.3879 0.3877 0.3866 4 0.3746 0.3902 0.3945 0.3936 0.3888 0.3800
5 0.4807 0.4896 0.4934 0.4947 0.4945 0.4934 5 0.4807 0.4981 0.5007 0.5002 0.4995 0.5000
Case 51 0.4807 0.4910 0.4967 0.4995 0.5004 0.5000
2 0.3746 0.3800 0.3855 0.3910 0.3964 0.4015
3 0.3670 0.3748 0.3821 0.3888 0.3951 0.4010
4 0.3746 0.3800 0.3855 0.3910 0.3964 0.4015
5 0.4807 0.4910 0.4967 0.4995 0.5004 0.5000
Table 5. Statistic parameters of the random variables.
VariablesMeanStandard DeviationDistribution
R 1.2262 R d 0.1734 R d Normal
S G 1 k 1.0212 S G 1 k d 0.0472 S G 1 k d Normal
S G 2 k 0.9865 S G 2 k d 0.0967 S G 2 k d Normal
S Q k 0.6961 S Q k d 0.1076 S Q k d Weibull
Table 6. Reliability indexes under different damage cases of hinge joints.
Case NumberSlab Segment NumberDamage DegreeCase NumberSlab Segment NumberDamage Degree
Intact20%40%60%80%100%Intact20%40%60%80%100%
Case 114.3144.2984.2844.2724.2614.253Case 614.3144.2694.2554.2544.2614.274
24.6494.6554.6604.6644.6674.67024.6494.6084.5944.5944.6004.612
34.6734.6774.6804.6834.6864.68834.6734.6134.5494.4784.4014.317
44.6494.6294.6124.5974.5844.57444.6494.6084.5944.5944.6004.612
54.3144.2924.2734.2584.2444.23254.3144.2694.2554.2544.2614.274
Case 214.3144.3004.2914.2844.2784.274Case 714.3144.2654.2544.2534.2544.253
24.6494.6374.6284.6214.6164.61224.6494.6104.5954.5944.6074.633
34.6734.6164.5754.5464.5234.50534.6734.6144.5494.4784.4024.317
44.6494.6064.5754.5534.5354.52144.6494.6004.5884.5914.6004.612
54.3144.2674.2344.2104.1914.17654.3144.2614.2484.2514.2604.274
Case 314.3144.2894.2744.2644.2574.253Case 814.3144.2784.2644.2594.2564.253
24.6494.6434.6394.6364.6344.63324.6494.6274.6184.6164.6214.633
34.6734.6014.5604.5344.5174.50534.6734.6014.5544.5204.4934.470
44.6494.5944.5634.5444.5304.52144.6494.5954.5564.5274.5024.481
54.3144.2554.2214.2004.1864.17654.3144.2544.2364.2354.2424.253
Case 414.3144.2634.2434.2384.2434.253Case 914.3144.2594.2504.2524.2544.253
24.6494.6074.5714.5394.5094.48124.6494.6014.5874.5904.6054.633
34.6734.6174.5724.5344.5014.47034.6734.5954.5234.4554.3884.317
44.6494.6234.6124.6084.6094.61244.6494.6014.5874.5904.6054.633
54.3144.2864.2744.2704.2704.27454.3144.2594.2504.2524.2544.253
Case 514.3144.2814.2634.2544.2514.253
24.6494.6334.6154.5984.5824.565
34.6734.6494.6264.6054.5864.567
44.6494.6334.6154.5984.5824.565
54.3144.2814.2634.2544.2514.253
Table 7. Range analysis values of reliability indexes of each slab segment under different damage cases of hinge joints.
Slab Segment NumberCase Number
Case 1Case 2Case 3Case 4Case 5Case 6Case 7Case 8Case 9
10.06190.04060.06190.07600.06320.06030.06190.06190.0642
20.02110.03740.01680.16800.08390.05570.05490.03300.0621
30.01510.16780.16780.20270.10570.35620.35620.20270.3562
40.07590.12790.12790.04130.08390.05570.06090.16800.0621
50.08220.13840.13840.04480.06320.06030.06600.07920.0642
Table 8. The largest eigenvalue, the weight vector, the consistency index and the consistency ratio of each matrix.
MatrixλmaxCICR W
A i n t a c t 5.00041.0498 × 10−49.3734 × 10⁻⁵(0.2098; 0.1938; 0.1926; 0.1938; 0.2098)
A c a s e 1 4.9999−2.7785 × 10⁻⁵−2.4808 × 10⁻⁵(0.2416; 0.0824; 0.0589; 0.2963; 0.3208)
A c a s e 2 4.9994−1.5615 × 10⁻⁴−1.3942 × 10⁻⁴(0.0793; 0.0730; 0.3277; 0.2498; 0.2703)
A c a s e 3 4.9981−4.6301 × 10⁻⁴−4.1340 × 10⁻⁴(0.1207; 0.0328; 0.3272; 0.2494; 0.2699)
A c a s e 4 5.00051.1798 × 10−41.0534 × 10⁻⁴(0.1426; 0.3153; 0.3804; 0.0775; 0.0841)
A c a s e 5 5.00051.2918 × 10−41.1534 × 10⁻⁴(0.1580; 0.2098; 0.2643; 0.2098; 0.1580)
A c a s e 6 4.9987−3.2423 × 10⁻⁴−2.8950 × 10⁻⁴(0.1025; 0.0947; 0.6056; 0.0947; 0.1025)
A c a s e 7 5.00003.4477 × 10−63.0783 × 10⁻⁶(0.1032; 0.0915; 0.5938; 0.1015; 0.1100)
A c a s e 8 4.9999−3.3564 × 10⁻⁵−2.9968 × 10⁻⁵(0.1136; 0.0606; 0.3721; 0.3084; 0.1454)
A c a s e 9 4.9994−1.3097 × 10⁻⁴−1.4669 × 10⁻⁴(0.1055; 0.1020; 0.5851; 0.1020; 0.1055)
Table 9. The minimum reliability index of each slab segment under different damage cases of hinge joints.
Slab Segment NumberCase Number
Case 1Case 2Case 3Case 4Case 5Case 6Case 7Case 8Case 9
14.2534.2744.2534.2384.2514.2544.2534.2534.250
24.6494.6124.6334.4814.5654.5944.5944.6164.587
34.6734.5054.5054.4704.5674.3174.3174.4704.317
44.5744.5214.5214.6084.5654.5944.5884.4814.587
54.2324.1764.1764.2704.2514.2544.2484.2354.250
Table 10. System reliability indexes obtained by traditional methods.
Case NumberSeries MethodParallel Method
Lower BoundUpper BoundLower BoundUpper Bound
Intact4.1044.3144.698 +
Case 14.0384.2324.673 +
Case 23.9924.1764.612 +
Case 33.9864.1764.633 +
Case 44.0074.2384.608 +
Case 54.0234.2514.567 +
Case 63.9884.2544.594 +
Case 73.9864.2484.594 +
Case 84.0004.2354.616 +
Case 93.9854.2504.587 +

