Urinary Levels of Free 2,5-Hexanedione in Italian Subjects Non-Occupationally Exposed to n-Hexane

 ,
,
Abstract
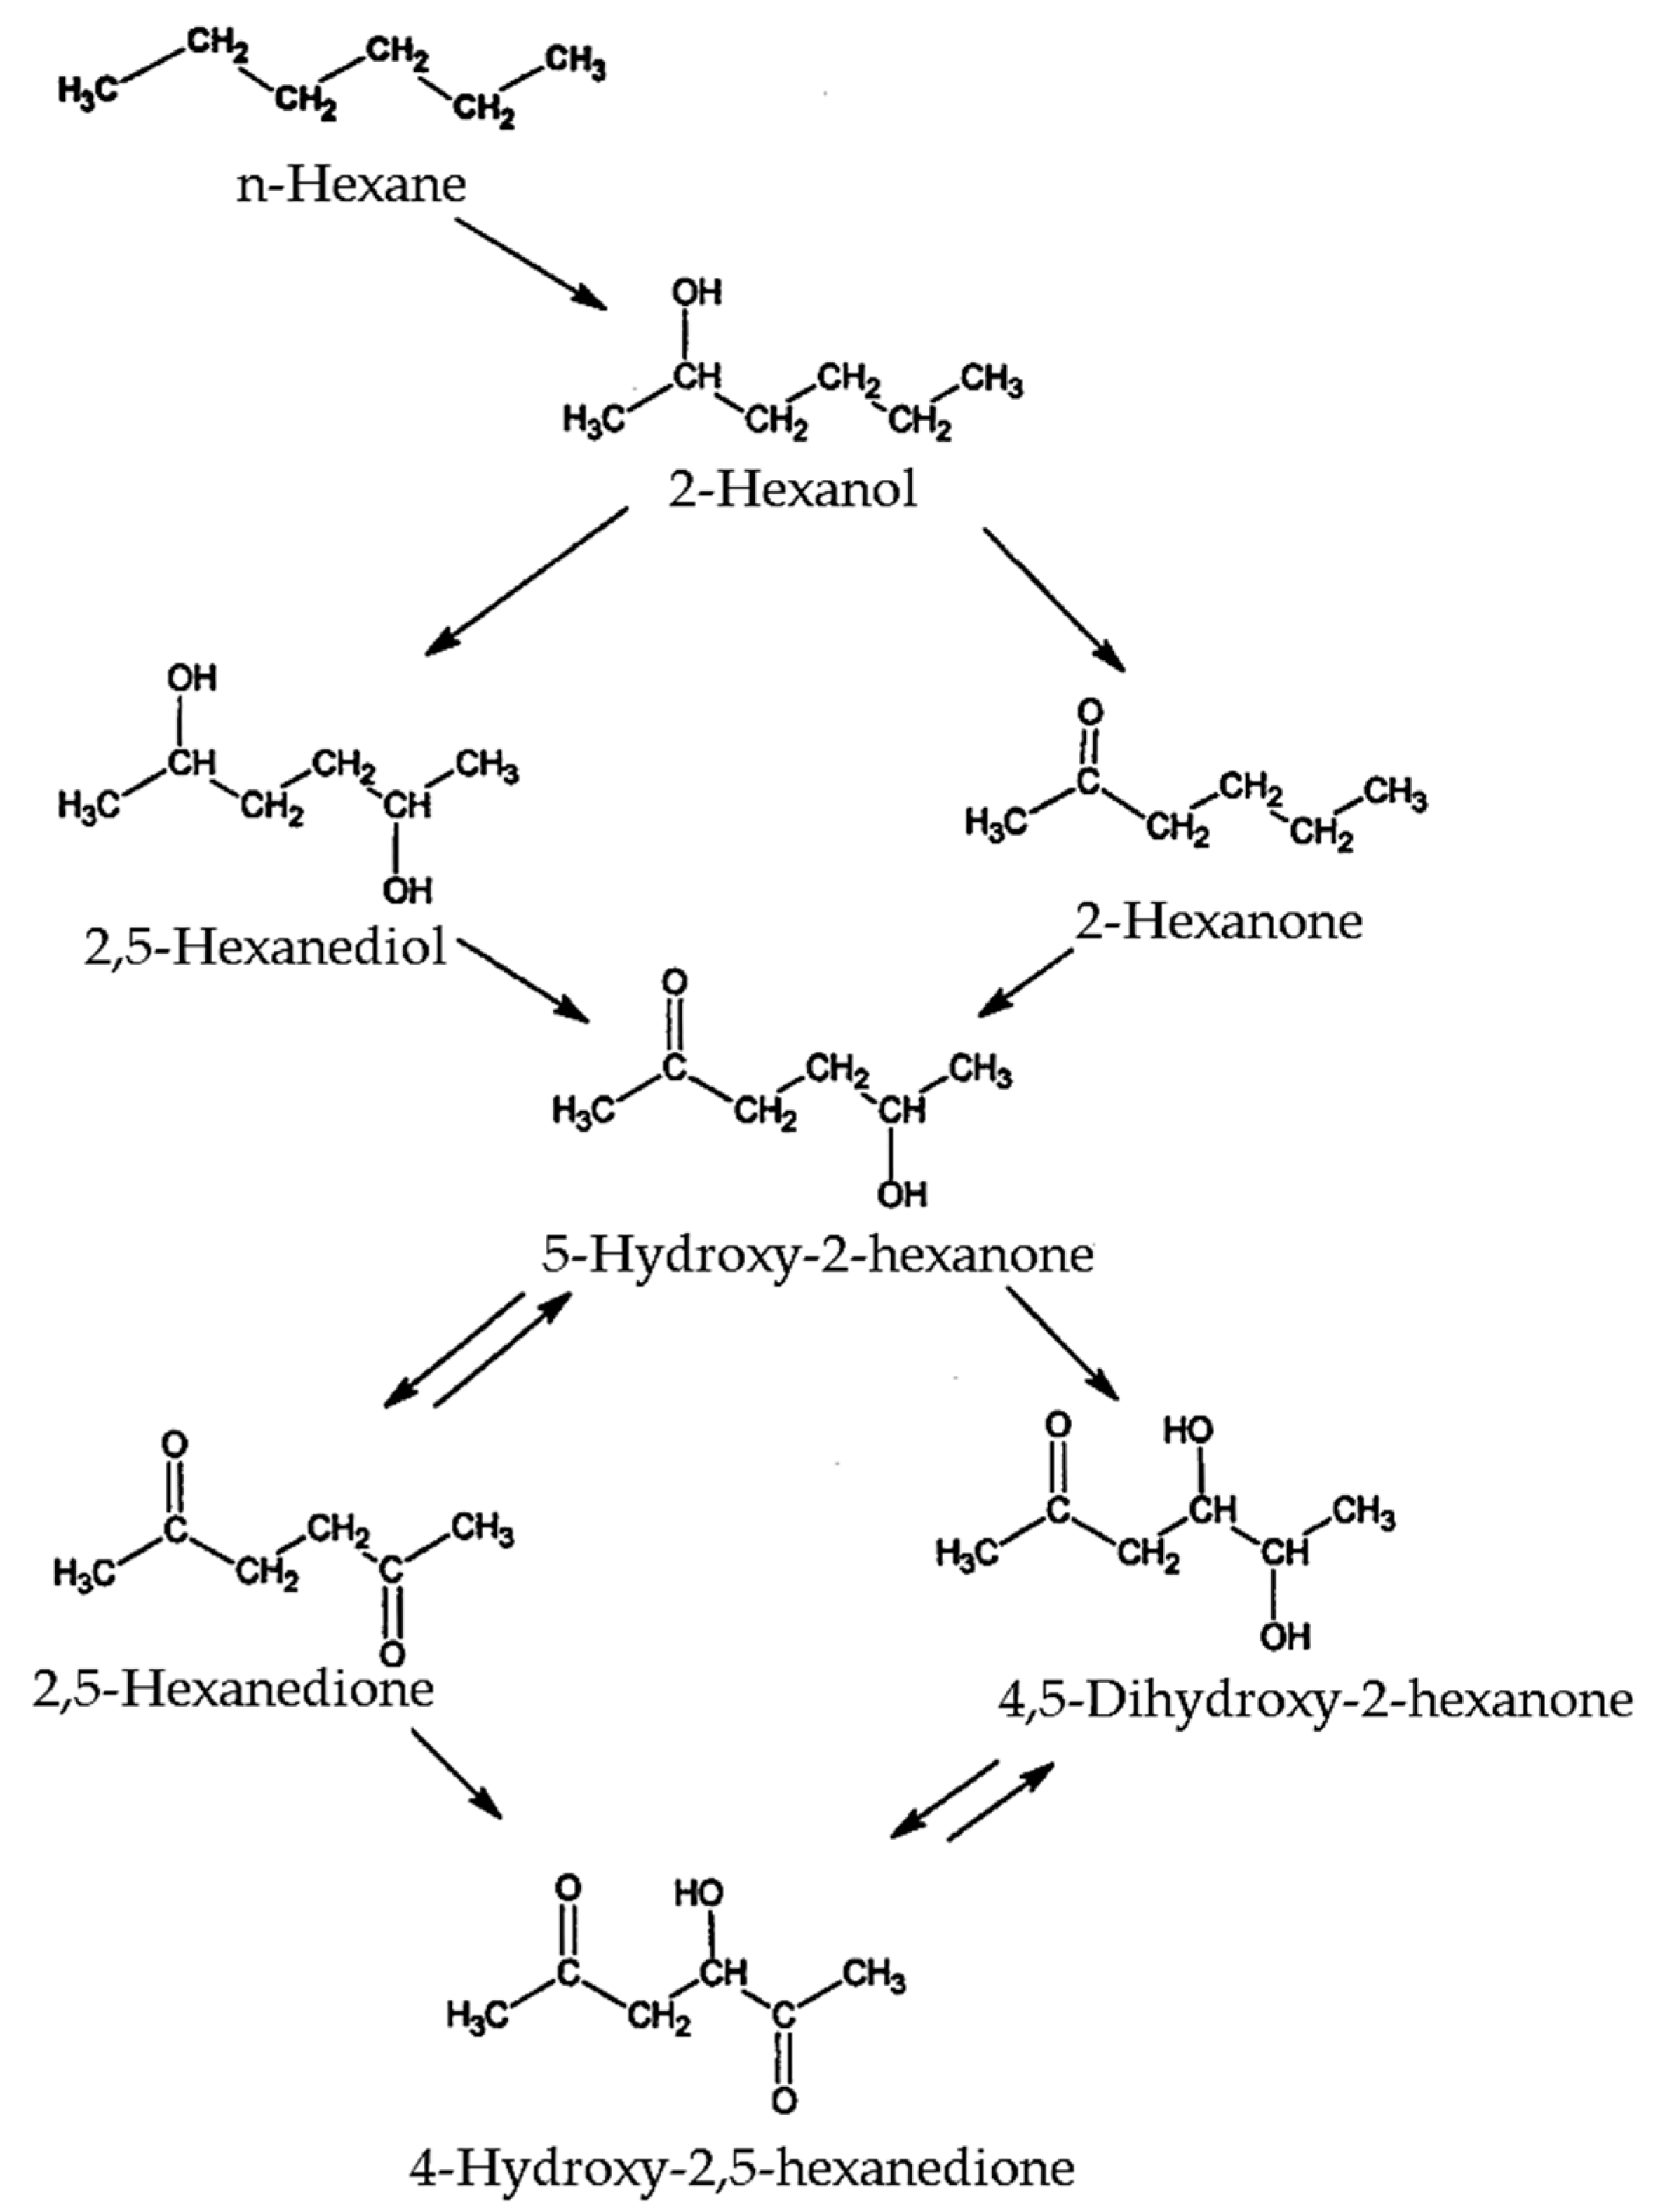
:1. Introduction
2. Materials and Methods
2.1. Study Population
2.2. Analytical Method
2.3. Statistical Analysis
3. Results
4. Discussion
Author Contributions
Funding
Conflicts of Interest
References
- Contribution to the International Programme on Chemical Safety (IPCS). Environmental Health Criteria 122: N-Hexane; WHO: Geneva, Switzerland, 1991. [Google Scholar]
- Inoue, T.; Takeuchi, Y.; Hisanaga, N.; Iwata, M.; Ogata, M.; Saito, K.; Sakurai, H.; Hara, I.; Matsushita, T.; Ikeda, M. A nation-wide survey on organic solvent components in various solvent products; Part 1. Homogeneous products such as thinners, degreasers and reagents. Ind. Health 1983, 21, 175–183. [Google Scholar] [CrossRef] [PubMed] [Green Version]
- Kumai, M.; Koizumi, A.; Saito, K.; Sakurai, H.; Inoue, T.; Takeuchi, Y.; Hara, I.; Ogata, M.; Matsushita, T.; Ikeda, M. A nationwide survey on organic solvent components in various solvent products: Part 2. Heterogeneous products such as paints, inks and adhesives. Ind. Health 1983, 21, 185–197. [Google Scholar] [CrossRef] [PubMed]
- Ukai, H.; Inui, S.; Takada, S.; Dendo, J.; Ogawa, J.; Isobe, K.; Ashida, T.; Tamura, M.; Tabuki, K.; Ikeda, M. Types of organic solvents used in small- to medium-scale industries in Japan; a nationwide field survey. Int. Arch. Occup. Environ. Health 1997, 70, 385–392. [Google Scholar] [CrossRef] [PubMed]
- Yasugi, T.; Endo, G.; Monna, T.; Odachi, T.; Yamaoka, K.; Kawai, T.; Horiguchi, S.; Ikeda, M. Types of Organic Solvents used in Workplaces and Work Environment Conditions with Special References to Reproducibility of Work Environment Classification. Ind. Health 1998, 36, 223–233. [Google Scholar] [CrossRef] [PubMed] [Green Version]
- Saito, J.; Ikeda, M. Solvent constituents in paint, glue and thinner for plastic miniature hobby. Tohoku J. Exp. Med. 1988, 155, 275–283. [Google Scholar] [CrossRef] [Green Version]
- Pei, J.; Yin, Y.; Liu, J.; Dai, X. An eight-city study of volatile organic compounds in Chinese residences: Compounds, concentrations, and characteristics. Sci. Total Environ. 2020, 698, 134137. [Google Scholar] [CrossRef]
- Jiang, C.; Li, D.; Zhang, P.; Li, J.; Wang, J.; Yu, J. Formaldehyde and volatile organic compound (VOC) emissions from particleboard: Identification of odorous compounds and effects of heat-treatment. Build. Environ. 2017, 117, 118–126. [Google Scholar] [CrossRef]
- Minoia, C.; Meroni, G.; Aprea, C.; Oppezzo, M.C.; Magnaghi, S.; Sciarra, G.; Barisano, A.; Fiorentino, M.L.; Berri, A.; Bellinzona, M.; et al. Environmental and urinary reference values as marker of exposure to hydrocarbons in urban areas. Sci. Total Environ. 1996, 192, 163–182. [Google Scholar] [CrossRef]
- Mandin, C.; Trantallidi, M.; Cattaneo, A.; Canha, N.; Mihucz, V.G.; Szigeti, T.; Mabilia, R.; Perreca, E.; Spinazzè, A.; Fossati, S.; et al. Assessment of indoor air quality in office buildings across Europe—The OFFICAIR study. Sci. Total Environ. 2017, 579, 169–178. [Google Scholar] [CrossRef] [Green Version]
- Ikeda, M.; Kumai, M.; Watanabe, T.; Fujita, H. Aromatic and other contents in automobile gasoline in Japan. Ind. Health 1984, 22, 235–241. [Google Scholar]
- Hakkola, M.; Saarinen, L. Exposure of tanker drivers to gasoline and some of its components. Ann. Occup. Hyg. 1996, 40, 1–10. [Google Scholar] [CrossRef]
- Feldman, R.G. Approach to Diagnosis: Occupational and Environmental Neurotoxicology; Lippincott-Raven: Philadelphia, PA, USA, 1999. [Google Scholar]
- Spencer, P.S.; Schaumburg, H.H. Experimental and Clinical Neurotoxicology; Oxford University Press: New York, NY, USA, 2000. [Google Scholar]
- American Conference of Governmental Industrial Hygienist (ACGIH). 1987 TLVs and BEIs. Based on the Documentations of the Threshold Limit Values for Chemical Substances and Physical Agents and Biological Exposure Indices; ACGIH: Cincinnati, OH, USA, 1987.
- Deutsche Forschungsgemeinschaft (DFG). List of MAK and BAT Values 2018; Report no 54; Wiley-VCH Verla GmbH & Co: Weinheim, Germany, 2018. [Google Scholar]
- Fedtke, N.; Bolt, H.M. The relevance of 4,5-dihydroxy-2-hexanone in the excretion kinetics of n-hexane metabolites in rat and man. Arch. Toxicol. 1987, 61, 131–137. [Google Scholar] [CrossRef] [PubMed]
- Manini, P.; Andreoli, R.; Mutti, A.; Bergamaschi, E.; Franchini, I. Determination of free and glucuronated hexane metabolites without prior hydrolysis by liquid- and gas-chromatography coupled with mass spectrometry. Toxicol. Lett. 1999, 5, 225–231. [Google Scholar] [CrossRef]
- Fedtke, N.; Bolt, H.M. Detection of 2,5-hexanedione in the urine of persons not exposed to n-hexane. Int. Arch. Occup. Environ. Health 1986, 2, 143–148. [Google Scholar] [CrossRef] [PubMed]
- Perbellini, L.; Tagliaro, F.; Maschio, S.; Zedde, A.; Brugnone, F. Gas chromatographic determination of 2,5-hexanedione in the urine. Med. Lav. 1986, 6, 628–634. [Google Scholar]
- Kawai, T.; Mizunuma, K.; Yasugi, T.; Uchida, Y.; Ikeda, M. The method of choice for the determination of 2,5-hexanedione as an indicator of occupational exposure to n-hexane. Int. Arch. Occup. Environ. Health 1990, 5, 403–408. [Google Scholar] [CrossRef]
- Kawai, T.; Yasugi, T.; Mizunuma, K.; Horiguchi, S.; Uchida, Y.; Iwami, O.; Iguchi, H.; Ikeda, M. Dose-dependent increase in 2,5-hexanedione in the urine of workers exposed to n-hexane. Int. Arch. Occup. Environ. Health 1991, 4, 285–291. [Google Scholar] [CrossRef]
- Perbellini, L.; Pezzoli, G.; Brugnone, F.; Canesi, M. Biochemical and physiological aspects of 2,5-hexanedione: Endogenous or exogenous product? Int. Arch. Occup. Environ. Health 1993, 1, 49–52. [Google Scholar] [CrossRef]
- Bavazzano, P.; Li Donni, V.; Baldasseroni, A. Quality control in a system for the biological surveillance of exposure to n-hexane. Med. Lav. 1993, 2, 115–120. [Google Scholar]
- Maestri, L.; Ghittori, S.; Imbriani, M.; Capodaglio, E. Determination of 2,5-hexandione by high-performance liquid chromatography after derivatization with dansylhydrazine. J. Chromatogr. B Biomed. Appl. 1994, 1, 111–117. [Google Scholar] [CrossRef]
- Bavazzano, P.; Apostoli, P.; Balducci, C.; Bartolucci, G.B.; Buratti, M.; Duca, P.; Gori, G.; Li Donni, V.; Perbellini, L.; Perico, A.; et al. Determination of urinary 2,5-hexanedione in the general italian population. Int. Arch. Occup. Environ. Health 1998, 71, 284–288. [Google Scholar] [CrossRef] [PubMed]
- Centers for Disease Control and Prevention (CDC). National Health and Nutrition Examination Survey (NHANES): Fourth National Exposure Report on Human Exposure to Environmental Chemicals, Updated Tables; Centers for Disease Control and Prevention, National Center for Environmental Health, Division of Laboratory Sciences: Atlanta, GA, USA, 2015. Available online: https://www.cdc.gov/biomonitoring/pdf/FourthReport_UpdatedTables_Feb2015.pdf (accessed on 13 November 2019).
- Černá, M.; Krsková, A.; Čejchanová, M.; Spĕváčková, V. Human biomonitoring in the Czech Republic: An overview. Int. J. Hyg. Environ. Health 2012, 215, 109–119. [Google Scholar] [CrossRef]
- Schulz, C.; Wilhelm, M.; Heudorf, U.; Kolossa-Gehring, M. Reprint of “Update of the reference and HBM values derived by the German Human Biomonitoring Commission”. Int. J. Hyg. Environ. Health 2012, 215, 150–158. [Google Scholar] [CrossRef] [PubMed]
- Società Italiana Valori di Riferimento (SIVR). 4° Lista dei Valori di Riferimento per Elementi, Composti Organici e Loro Metaboliti Edizione 2017; SIVR: Siena, Italy, 2017. [Google Scholar]
- American Conference of Governmental Industrial Hygienist (ACGIH). Documentation of the Biological Exposure Indices; ACGIH: Cincinnati, OH, USA, 2019.
- Perbellini, L.; Brugnone, F.; Faggionato, G. Urinary excretion of the metabolites of n-hexane and its isomeres during occupational exposure. Br. J. Ind. Med. 1981, 38, 20–26. [Google Scholar] [PubMed] [Green Version]
- Matthiessen, A. Use of a keeper to enhance the recovery of volatile polycyclic aromatic hydrocarbons in HPLC analysis. Chromatographia 1997, 45, 190–194. [Google Scholar] [CrossRef]
- National Institute for Occupational Safety and Health (NIOSH). Manual of Analytical Methods, 4th ed.; NIOSH: Cincinnati, OH, USA, 1994.
- Istituto Superiore di Sanità (ISS). Epicentro: The Portal of Epidemiology for Public Health; Available online: https://www.epicentro.iss.it/passi/dati/sovrappeso (accessed on 13 November 2019). (In Italian)
- Dos Santos, C.R.; Meyer Passarelli, M.; de Souza Nascimento, E. Evaluation of 2,5-hexanedione in urine of workers exposed to n-hexane in Brazilian shoe factories. J. Chromatogr. B Analyt. Technol. Biomed. Life Sci. 2002, 778, 237–244. [Google Scholar] [CrossRef]
- Agency for Toxic Substances and Disease Registry (ATSDR). Toxicological Profile for n-Hexane; Department of Health and Human Services, Public Health Service: Atlanta, GA, USA, 1999.
- Japan Society for Occupational Health: Recommendation of Occupational Exposure Limits (2018–2019). J. Occup. Health 2018, 60, 419–452. [CrossRef]
- American Conference of Governmental Industrial Hygienist (ACGIH). 2003 TLVs and BEIs: Based on the Documentations of the Threshold Limit Values for Chemical Substances and Physical Agents and Biological Exposure Indices; ACGIH: Cincinnati, OH, USA, 2003.
- American Conference of Governmental Industrial Hygienist (ACGIH). 2019 TLVs and BEIs: Based on the Documentations of the Threshold Limit Values for Chemical Substances and Physical Agents and Biological Exposure Indices; ACGIH: Cincinnati, OH, USA, 2019.
- Carrieri, M.; Trevisan, A.; Bartolucci, G.B. Adjustment to concentration-dilution of spot urine samples: Correlation between specific gravity and creatinine. Int. Arch. Occup. Environ. Health 2001, 74, 63–67. [Google Scholar] [CrossRef]
- Persson, B.; Vrethem, M.; Murgia, N.; Lindh, J.; Hällsten, A.; Fredrikson, M.; Tondel, M. Urinary 2,5-hexanedione excretion in cryptogenic polyneuropathy compared to the general Swedish population. J. Occup. Med. Toxicol. 2013, 8, 21. [Google Scholar] [CrossRef] [Green Version]
- Xing-Fu, P.; Ya-Ling, Q.; Wei, Z.; Hong-Fang, T.; Zheng, R.; Bang-Hua, W.; Han-Lin, H.; Yu-Xin, Z.; Hui-Fang, Y. Determination of total urinary 2,5-hexanedione in the Chinese general population. Environ. Res. 2016, 150, 645–650. [Google Scholar] [CrossRef]
- Cardona, A.; Marhuenda, D.; Prieto, M.J.; Marti, J.; Periago, J.F.; Sánchez, J.M. Behaviour of urinary 2,5-hexanedione in occupational co-exposure to n-hexane and acetone. Int. Arch. Occup. Environ. Health 1996, 68, 88–93. [Google Scholar] [PubMed]
- Prieto, M.J.; Marhuenda, D.; Roel, J.; Cardona, A. Free and total 2,5-hexanedione in biological monitoring of workers exposed to n-hexane in the shoe industry. Toxicol. Lett. 2003, 145, 249–260. [Google Scholar] [CrossRef]
- Hamelin, G.; Truchon, G.; Tardif, R. Comparison of unchanged n-hexane in alveolar air and 2,5-hexanedione in urine for the biological monitoring of n-hexane exposure in human volunteers. Int. Arch. Occup. Environ. Health 2004, 77, 264–270. [Google Scholar] [CrossRef] [PubMed]
- Sakai, T.; Araki, T.; Ushio, K.; Takeuchi, Y.; Ikeda, Y. Effect of hydrolysis conditions on the determination of urinary 2,5-hexanedione in workers exposed on not exposed to n-hexane. Jnp. J. Ind. Health 1992, 34, 440–447. [Google Scholar]
- Hamelin, G.; Charest-Tardif, G.; Truchon, G.; Tardif, R. Physiologically based modelling of n-hexane kinetics in humans following inhalation exposure at rest and under physical exertion: Impact on free 2,5-hexanedione in urine and on n-hexane in alveolar air. J. Occup. Environ. Hyg. 2005, 2, 86–97. [Google Scholar] [CrossRef]
- Tanaka, E. Clinical importance of non-genetic and genetic cytochrome P450 function tests in liver disease. J. Clin. Pharm. Ther. 1998, 23, 161–170. [Google Scholar] [CrossRef]
- Takeuchi, Y.; Hisanaga, N.; Ono, Y.; Shibata, E.; Saito, I.; Iwata, M. Modification of metabolism and neurotoxicity of hexane by co-exposure of toluene. Int. Arch. Occup. Environ. Health 1993, 65, S227–S230. [Google Scholar] [CrossRef]
- Nylén, P.; Hagman, M. Function of the auditory and visual systems, and of peripheral nerve, in rats after long-term combined exposure to n-hexane and methylated benzene derivatives. II. Xylene. Pharmacol. Toxicol. 1994, 74, 124–129. [Google Scholar] [CrossRef]
- Perbellini, L.; Mozzo, P.; Brugnone, F.; Zedde, A. Physiologicomathematical model for studying human exposure to organic solvents: Kinetics of blood/tissue n-hexane concentrations and of 2,5-hexanedione in urine. Br. J. Ind. Med. 1986, 43, 760–768. [Google Scholar] [CrossRef] [Green Version]


| Parameter | Males | Females | Total |
|---|---|---|---|
| Number | 52 | 47 | 99 |
| Smoking habit | |||
| No | 32 | 33 | 65 |
| <5 cigarettes/day | 9 | 6 | 15 |
| 5–10 cigarettes/day | 3 | 5 | 8 |
| 11–20 cigarettes/day | 8 | 3 | 11 |
| Residence | |||
| Urban | 37 | 37 | 74 |
| Rural | 15 | 9 | 24 |
| Industrial | - | 1 | 1 |
| Traffic intensity | |||
| Low | 20 | 14 | 34 |
| Medium | 27 | 21 | 48 |
| High | 5 | 12 | 17 |
| Age | |||
| <30 years | 16 | 8 | 24 |
| 30–50 years | 25 | 30 | 55 |
| >50 years | 11 | 9 | 20 |
| BMI | |||
| <25 kg/m2 | 30 | 35 | 65 |
| 25–30 kg/m2 | 15 | 8 | 23 |
| >30 kg/m2 | 7 | 4 | 11 |
| Sample Size | Geometric Mean ± GSD (µg/L) | Mean (µg/L) | Selected Percentile (µg/L) | |||||
|---|---|---|---|---|---|---|---|---|
| 5th | 25th | 50th | 75th | 95th | ||||
| Total | 99 | 19.1 ± 2.8 | 31.4 | <12.0 | <12.0 | 20.3 | 54.3 | 77.9 |
| Gender | ||||||||
| Males | 52 | 17.9 ± 2.7 | 31.8 | <12.0 | <12.0 | 20.6 | 58.2 | 85.5 |
| Females | 47 | 18.1 ± 3.0 | 31.0 | <12.0 | <12.0 | 20.3 | 52.2 | 72.2 |
| Age | ||||||||
| <30 years | 24 | 19.8 ± 2.7 | 30.3 | <12.0 | <12.0 | 21.5 | 49.4 | 79.7 |
| 30–50 years | 54 | 19.8 ± 2.9 | 32.1 | <12.0 | <12.0 | 23.9 | 53.1 | 74.2 |
| >50 years | 21 | 17.0 ± 3.1 | 30.9 | <12.0 | <12.0 | 14.3 | 65.0 | 77.4 |
| Smoking habit | ||||||||
| No | 65 | 17.1 ± 2.7 | 27.0 | <12.0 | <12.0 | 15.9 | 47.4 | 69.0 |
| Smokers | 34 | 23.8 ± 3.1 | 39.9 | <12.0 | <12.0 | 33.0 | 59.9 | 97.4 |
| <5 cigarettes/day | 15 | 24.9 ± 2.7 | 35.5 | <12.0 | <12.0 | 37.9 | 57.9 | 66.2 |
| 5–10 cigarettes/day | 8 | 16.3 ± 3.1 | 27.5 | <12.0 | <12.0 | 14.4 | 42.4 | 71.7 |
| 11–20 cigarettes/day | 11 | 29.5 ± 3.8 | 54.9 | <12.0 | <12.0 | 57.9 | 84.6 | 128.0 |
| Residence | ||||||||
| Industrial | 1 | - | - | <12.0 | - | |||
| Urban | 74 | 17.7 ± 2.9 | 29.9 | <12.0 | <12.0 | 16.7 | 52.4 | 75.9 |
| Rural | 24 | 25.7 ± 2.7 | 37.3 | <12.0 | <12.0 | 31.4 | 58.5 | 81.0 |
| Traffic intensity | ||||||||
| Low | 34 | 26.3 ± 2.8 | 39.9 | <12.0 | <12.0 | 36.4 a | 60.5 | 89.3 |
| Medium | 48 | 15.6 ± 2.8 | 27.1 | <12.0 | <12.0 | 13.3 | 40.3 | 76.6 |
| High | 17 | 17.9 ± 2.6 | 26.9 | <12.0 | <12.0 | 15.9 | 47.4 | 68.4 |
| BMI | ||||||||
| <25 kg/m2 | 65 | 16.9 ± 2.8 | 27.8 | <12.0 | <12.0 | 16.0 b | 47.0 | 68.3 |
| 25–30 kg/m2 | 23 | 27.6 ± 2.9 | 41.9 | <12.0 | <12.0 | 39.4 | 85.0 | 93.6 |
| >30 kg/m2 | 11 | 18.4 ± 2.9 | 31.3 | <12.0 | <12.0 | 15.9 | 44.3 | 90.7 |
© 2019 by the authors. Licensee MDPI, Basel, Switzerland. This article is an open access article distributed under the terms and conditions of the Creative Commons Attribution (CC BY) license (http://creativecommons.org/licenses/by/4.0/).
Share and Cite
Salamon, F.; Martinelli, A.; Trevisan, A.; Scapellato, M.L.; Bartolucci, G.B.; Carrieri, M. Urinary Levels of Free 2,5-Hexanedione in Italian Subjects Non-Occupationally Exposed to n-Hexane. Appl. Sci. 2019, 9, 5277. https://doi.org/10.3390/app9245277
Salamon F, Martinelli A, Trevisan A, Scapellato ML, Bartolucci GB, Carrieri M. Urinary Levels of Free 2,5-Hexanedione in Italian Subjects Non-Occupationally Exposed to n-Hexane. Applied Sciences. 2019; 9(24):5277. https://doi.org/10.3390/app9245277
Chicago/Turabian StyleSalamon, Fabiola, Andrea Martinelli, Andrea Trevisan, Maria Luisa Scapellato, Giovanni Battista Bartolucci, and Mariella Carrieri. 2019. "Urinary Levels of Free 2,5-Hexanedione in Italian Subjects Non-Occupationally Exposed to n-Hexane" Applied Sciences 9, no. 24: 5277. https://doi.org/10.3390/app9245277