Article

Exploration of Feature Extraction Methods and Dimension for sEMG Signal Classification

1
School of Technology, Beijing Forestry University, Beijing 100083, China
2
Key Lab of State Forestry and Grassland Administration for Forestry Equipment and Automation, Beijing 100083, China
*
Author to whom correspondence should be addressed.
Appl. Sci. 2019, 9(24), 5343; https://doi.org/10.3390/app9245343
Submission received: 19 September 2019 / Revised: 26 November 2019 / Accepted: 5 December 2019 / Published: 6 December 2019
(This article belongs to the Section Applied Biosciences and Bioengineering)

Abstract

:
It is necessary to complete the two parts of gesture recognition and wireless remote control to realize the gesture control of the automatic pruning machine. To realize gesture recognition, in this paper, we have carried out the research of gesture recognition technology based on surface electromyography signal, and discussed the influence of different numbers and different gesture combinations on the optimal size. We have calculated the 630-dimensional eigenvector from the benchmark scientific database of sEMG signals and extracted the features using principal component analysis (PCA). Discriminant analysis (DA) has been used to compare the processing effects of each feature extraction method. The experimental results have shown that the recognition rate of four gestures can reach 100.0%, the recognition rate of six gestures can reach 98.29%, and the optimal size is 516~523 dimensions. This study lays a foundation for the follow-up work of the pruning machine gesture control, and p rovides a compelling new way to promote the creative and human computer interaction process of forestry machinery.

1. Introduction

The electromyogram (EMG) signal is a vital biosignal produced by the electrical activity of muscle fibers during contraction or relaxation, and can be detected on the surface of the skin [1]. The EMG signal is a non-stationary random signal and usually requires noise reduction and signal amplification [2]. The development of EMG signal recognition systems has become a research hotspot [3,4,5,6,7]. However, in these studies, there are few applications related to forestry machinery. Based on the wireless remote-control automatic wood pruning machine developed in Japan [8], we have developed the BSR-Z23 radio remote automatic pruning machine [9], which can effectively improve the pruning efficiency and ensure the personal safety of the operators. At present, the automatic pruning machine control method is the traditional button type control [10]. Compared with the push-button control, the gesture control method based on the sEMG signal makes the consciousness of the human body and the mechanical device uniform. With the characteristics of straightforwardness and flexibility, it can realize natural control, intuitive operation [11]. The advantages have practical significance for the operations in the forest area, and it is easy to develop portable equipment, which provides a new idea for promoting the creative and human computer interaction process of forestry machinery [12].
The success of the EMG control scheme depends largely on feature computation and selection. So far, no studies have identified what types of features can fully express the mathematical properties of sEMG signals. If too many features are selected, the calculation and complexity of the classifier will be increased, and the recognition efficiency will be reduced. If too few features are selected, the information contained in the EMG signal will be lost and not contribute to the classification in subsequent identification steps. At present, the sEMG signal feature calculation methods mainly include time-domain, frequency-domain, time-frequency-domain, and nonlinear dynamics analysis [12,13,14]. In time-domain analysis, there are mean absolute value [15], root mean square [16], Wilson amplitude [15], zero-crossing rate [17], wavelength [18], and some time-domain model parameters, such as auto-regressive parameter model coefficients [17]. Power spectrum analysis is commonly used in frequency-domain analysis methods. Time-frequency domain analysis includes wavelet decomposition [19] and wavelet packet decomposition. Among the nonlinear dynamics methods, calculation of the information entropy [20,21] and the maximum Lyapunov exponent [22] are the main methods.
To reduce the dimensionality of signal features, Phinyomark et al. [23] have proposed thirty-seven time-domain and frequency-domain features for studying the characteristics of EMG signals, among which the most recommended ones are the mean absolute value, waveform length, Wilson amplitude, auto-regressive, mean absolute value slope, and mean frequency. Bakshi et al. [24] have employed a Kernel Least Square Tracker (KRLS-T) to estimate dimensional wrist kinematics from the sEMG signals of forearm muscle groups. But the accuracy is not high enough. In conjunction with wavelet analysis, Fairley et al. [25] have used principal component analysis (PCA) and feature selection algorithms to reduce the number of dimensions and achieve automatic detection of EMG signals. Xing et al. [26] combined LDA with the wavelet packet transform to develop a novel feature selection method based on a depth recursive search algorithm. Such that the high-dimensional features can be reduced using a supervised feature reduction algorithm. Xie et al. [27] have proposed a multi-scale bidirectional two-dimensional PCA method for high-dimensional biomedical signal analysis, which realized the dimensionality reduction of high-dimensional signals and proved to be highly efficient. Wang et al. [28] have applied LDA classify the sEMG signals from 2 electrodes and recognize the grasping force. Although these methods have achieved good experimental results, their research is only for specific gestures. There is no demonstration of compliance with the classification requirements of other combinations of actions.
It is necessary to complete the two parts of gesture recognition and wireless remote control to realize the gesture control of the automatic pruning machine. To realize gesture recognition, in this paper, we have carried out the research of gesture recognition technology based on surface electromyography signal, and discussed the influence of different numbers and different gesture combinations on the optimal size. In order to explore the classification effects of different gesture combinations and different gestures, this paper applies four feature extraction methods and six classification algorithms to classify sEMG signals. Moreover, under the condition of setting different feature data sizes and using different classification algorithms, the recognition accuracy of each feature extraction method is obtained. The study lays a foundation for the follow-up work of the pruning machine gesture control and provides a compelling new way to promote the intelligent and human computer interaction process of forestry machinery.

2. Materials and Methods
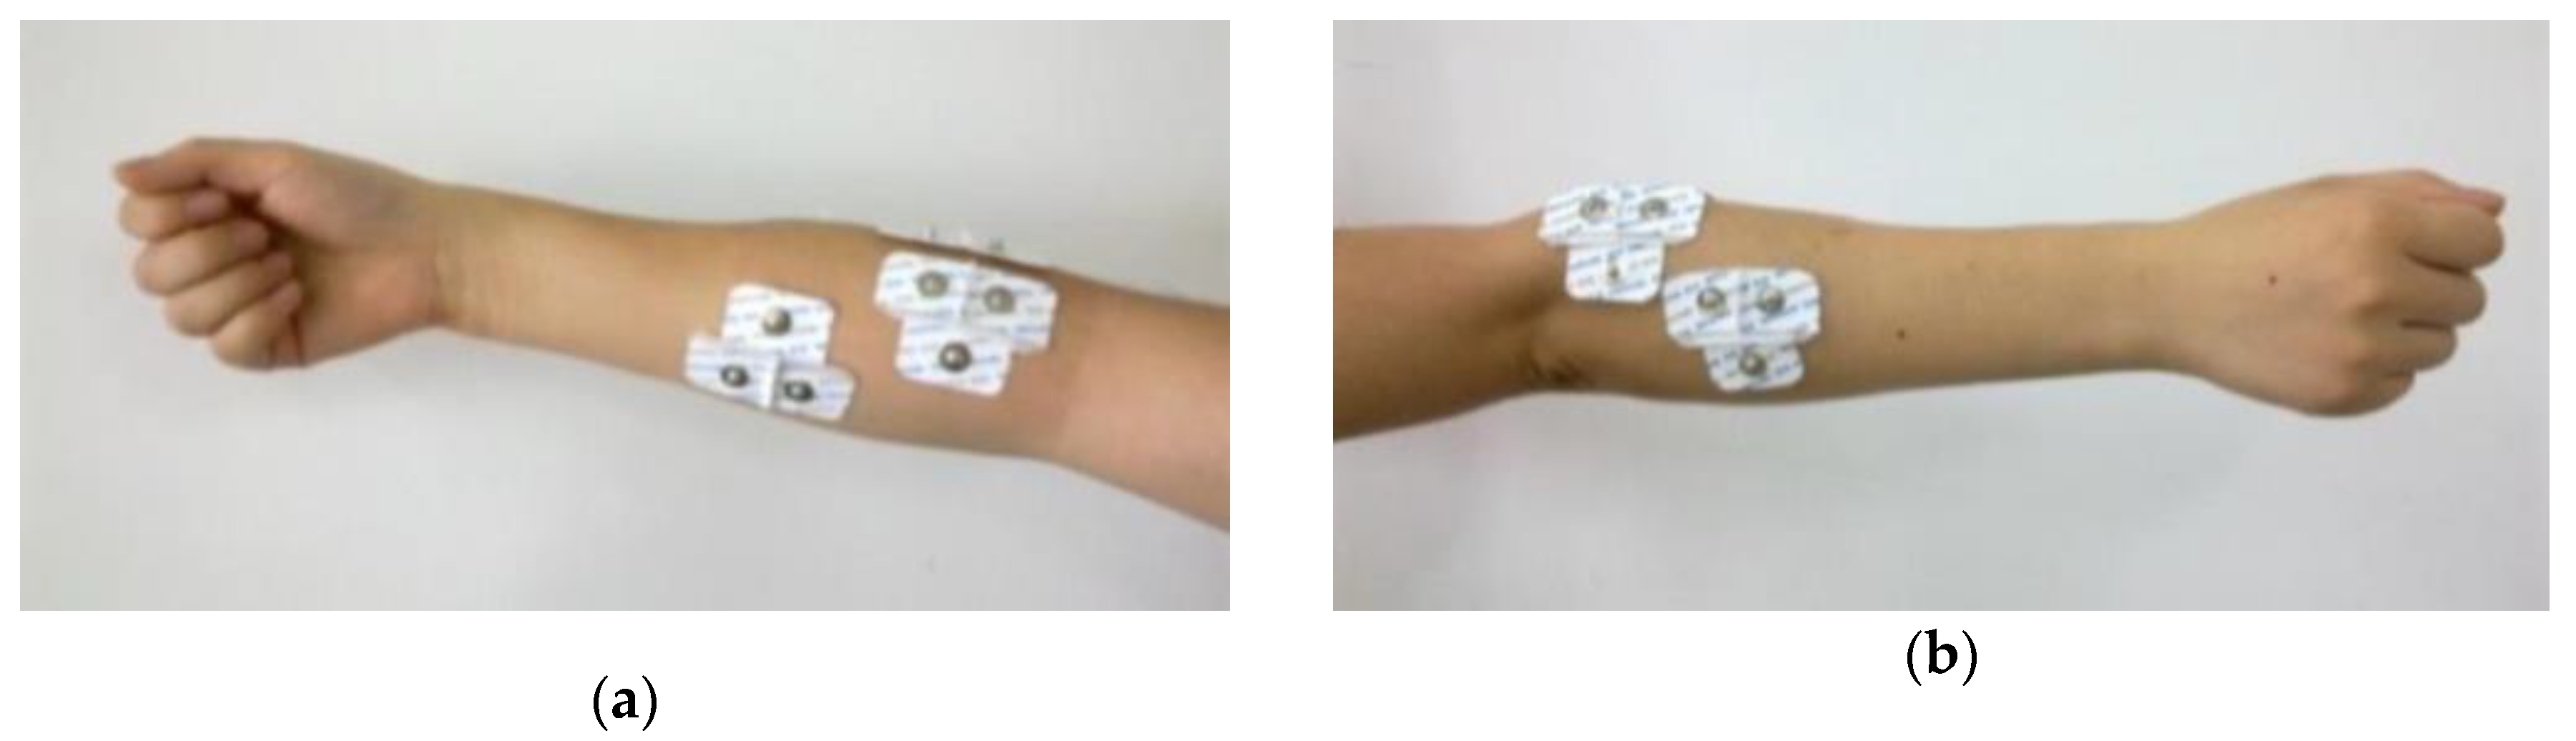
2.1. Materials

We applied the RM6240B multi-channel physiological signal acquisition and processing system to acquire the sEMG signal. The signal sampling frequency reached 100 up to kHz, and it simultaneously acquired four channels of signals. The sampling frequency of the acquisition device was set to 1000 Hz. According to the operation command of the forestry machinery, combined with the function of the forearm muscle, we designed six types of gestures [29], which comprised fist, palm lateral supination, palm lateral pronation, palm supination, palm pronation, and finger spread, corresponding to median, ascending, descending, idle, operation, and walking, respectively. We used patch electrodes to collect 4-way sEMG signals derived from the palmaris longus muscle of the forearm, the brachioradialis muscle, the extensor digitorum muscle, and the extensor carpi ulnaris muscle. The placement of the chip electrodes is shown in Figure 1. The determination of the target muscle was based on the following factors: first, muscles in the shallow forearm were preferentially selected; second, the function of the muscles corresponds to the gesture movement; finally, the position of the selected muscles is easy to find. The average age of the subjects was 23 years, including 12 males and three females. The subjects had no neuromuscular disease. In the last six months, there were no injuries to the forearm that affected the movement of the hand.
In the signal acquisition, each group experiment included six actions, which were fist punching, punching, valgus, inversion, upper cutting, and lower cutting. The following action sequence was used to collect each set of motion signals: gesture 1 for 2 s → relax for 5 s → gesture 2 for 2 s → ... → gesture 6 for 2 s. Once an action sequence was completed, the subject had a 2-min relaxation period to prevent muscle fatigue. The acquisition instrument recorded the EMG signal continually, so the segment of sEMG signals contained both the motion signal segment and the no-action signal segment. Finally, 150 4-way motion signals were obtained in the acquisition experiment, in which each segment contained six myoelectric features of gestures. The signals obtained after pre-processing constituted the data sets of this study. The data set was tagged for the calculation of classification accuracy.
The signal pre-processing process included mainly noise cancellation, amplification, and active segment detection. First, 50 Hz power-frequency interference and other noise in the sEMG signal were eliminated by using a 50 Hz notch filter and a bandpass filter that allowed only frequency components between 10 and 450 Hz to pass. Then, the amplitude of the sEMG signal was amplified by a factor of 1000. Finally, to confirm the starting point and end of the motion, the moving average method was used to detect the active segment of the sEMG signal. The result of the active segment detection is shown in Figure 2. The red “×” indicates the starting point of the action, and the green “×” indicates the ending point of the action. After successfully segmenting the motion signal segment, 1024 sample points were taken in each segment of the signal for calculating features.

2.2. Methods

2.2.1. Feature Computation

The primary task of feature computation is to perform a series of operations on the EMG signal to represent the original signal. To fully reflect the information in the signal, we calculated 27 characteristics from four categories. Feature vectors with a total of 252-dimensions were obtained. The gesture classification procedure based on sEMG signals is shown in Figure 3. Four feature extraction methods were used to treat the feature vector, and six classification methods were used for the feature extraction of the data.
  • Time-features
The time-domain feature had the advantage of simple calculation and effective representation of signal characteristics. Therefore, ten time-domain features were selected for feature calculation. They were the mean absolute value (MAV) [15], root mean square (RMS) [16], Wilson amplitude (WAMP) [15], zero-crossing (ZC) [17], waveform length (WL) [18], the mean absolute value slope (MAVS) [30], slope sign change (SSC) [31], variance (VAR) [32], autoregressive (AR) coefficient of sEMG signal [27], and the AR coefficients from the first difference (FDAR) of the sEMG signal.
  • Frequency-features
The power spectrum waveform of the sEMG signal varies greatly, so the frequency characteristics obtained by the power spectrum calculation were relatively stable. However, its calculation is difficult to achieve, so the median frequency (MDF) [18] and the mean frequency (MNF) [33] were used to characterize the power spectrum estimate.
  • Time-frequency features
The time-frequency analysis method is a novel signal processing and analysis method in sEMG signal analysis. Wavelet transform (WT) represents this analysis method and plays a vital role in the analysis and processing of non-stationary signals. Wavelet Packet Decomposition (WPD) is a more sophisticated analysis method that can more accurately reflect signal characteristics. The twelve time-frequency features we use include the maximum values of WT and WPD, singular values, average energy, variance, standard deviation, and WL [34,35,36,37,38,39,40,41]. In this paper, the wavelet-based sym3 is used to perform level = 3 wavelet decomposition on the EMG signal, and the third-order Symlet wavelet packet base is used to perform WPD on the EMG signal.
  • Nonlinear dynamics features
Information entropy is a measure of the degree of disorder of the transmitted information, and the maximum value of the Lyapunov exponent can quantitatively describe the motion characteristics of the sEMG signal. Therefore, three nonlinear dynamic characteristics (including the entropy of WT [19], the entropy of WPD [21], and the maximum value of Lyapunov exponent [22]) were selected.

2.2.2. Feature Selection

Laplacian eigenmaps [42], kernel principal component analysis [43], the Gaussian process latent variable model [44], and linear discriminant analysis [45] were used in the dimension exploration experiments of self-acquisition signals. Since these feature selection methods are perfect in the scientific community, they will not be described again.

2.2.3. Classification Methods

This paper classifies the feature vectors after feature selection by using six classification methods: k-nearest neighbor (KNN), random forest (RF), naive Bayes (NB), discriminant analysis (DA), back-propagation neural network (BPNN) and support vector machine (SVM). These methods can be found in reference [46,47,48,49,50,51], respectively. The final correct recognition rate is the standard for judging feature selection methods.

3. Experiments

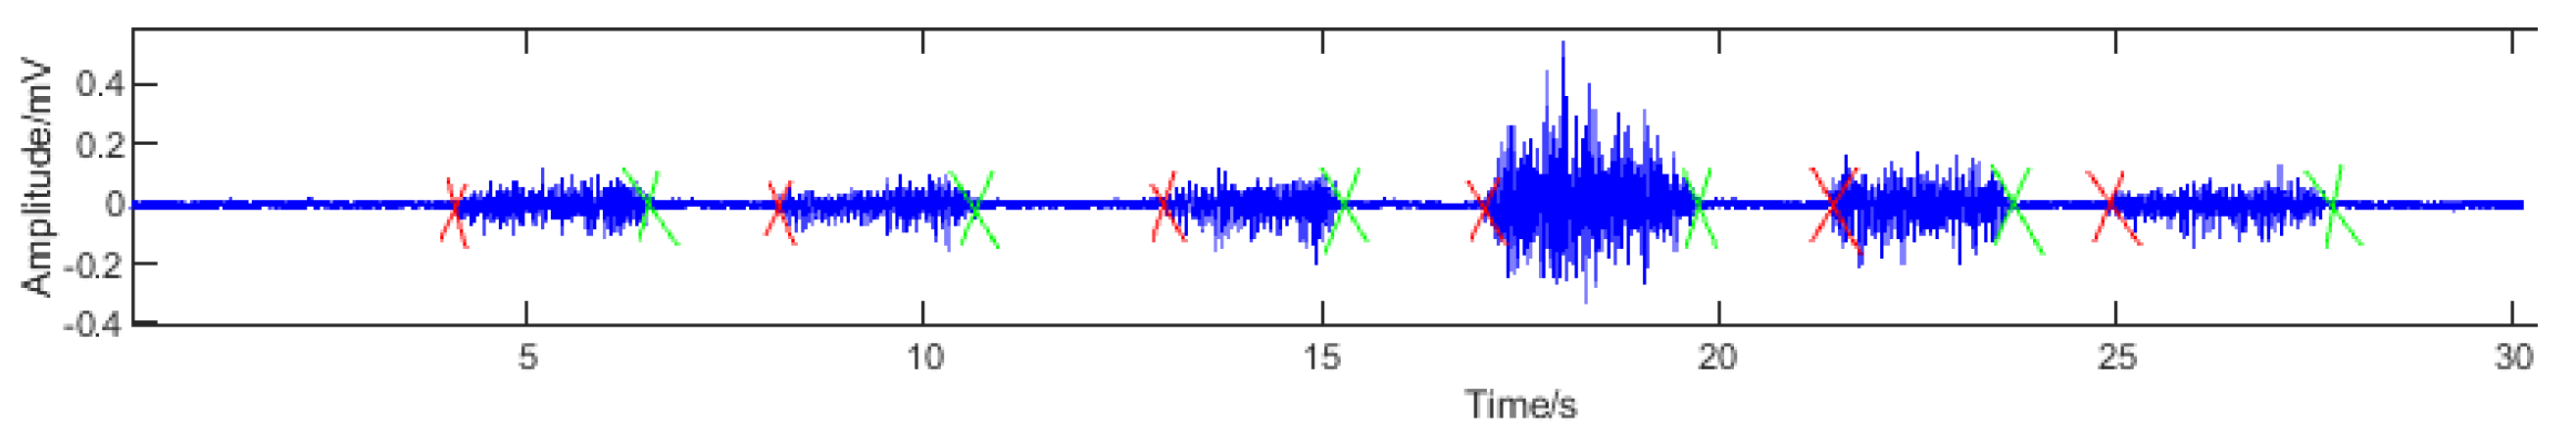
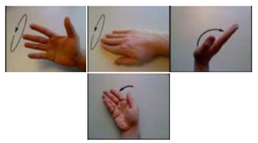
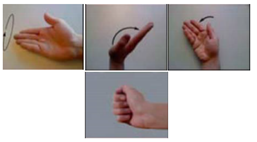
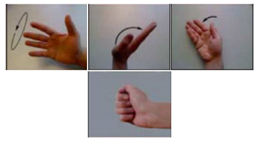
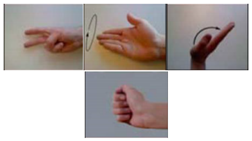
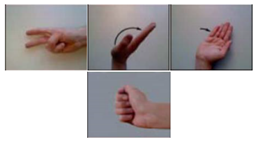
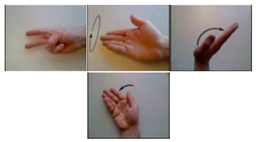
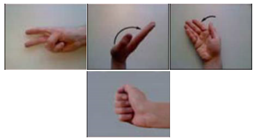
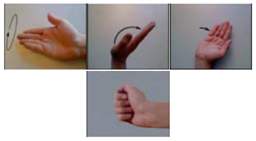
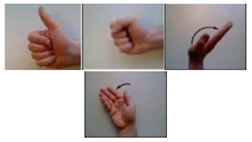
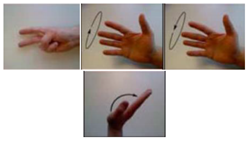
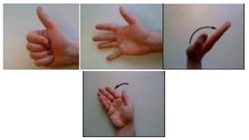
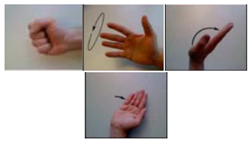
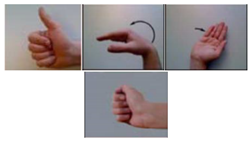
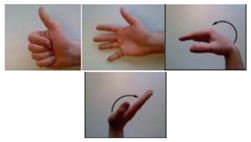
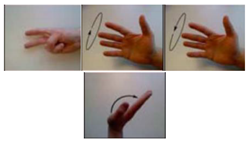
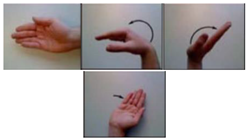
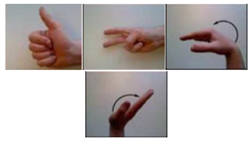
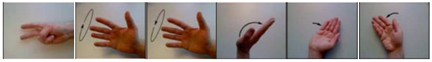
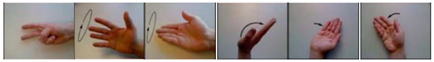
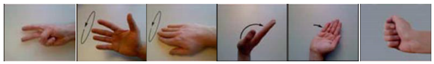
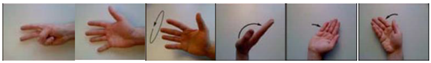
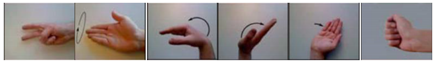
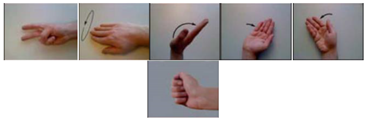
3.1. Self-Collecting Signals

After the feature extraction process was performed on the 252-dimensional feature vector, according to experience, the offline classification algorithm was adopted. We chose randomly 80% of the sample as training data, others as testing data. The above six classification algorithms were used to identify the dimension-reduction algorithms of different dimensions. The experimental results are shown in Figure 4. The results of using the k-nearest neighbour (KNN) classifier to test the four feature extraction algorithms are shown in Figure 4a, where the nearest neighbor number k was set to 4. The results of using the random forest (RF) classifier are shown in Figure 4b. The number of trees was set to 50. Because the RF classifier recognition results are different every time, the recognition rate in different dimensions is the average value of three recognition results. The results of using the naive Bayes (NB), discriminant analysis (DA), back-propagation neural network (BPNN), and support vector machine (SVM) are shown in Figure 4c–f, respectively. The training function of the BPNN was set as traincgb, the number of nodes in 13 hidden layers was set, and the training iteration number was 1000. The SVM parameters C and γ were set to 4 and 1, respectively. Table 1 summarizes the results in Figure 4.
As reported in Table 1, the results of dimensionality reduction using six classifiers show that LDA has the best dimension-reduction effect, and the optimal dimensions of LE and KPCA are generally higher than the optimal dimensions of GP-LVM and LDA. The average of the best dimensions of LE and KPCA is more significant than 100 dimensions, and the average of the best dimensions of GP-LVM and LDA is less than 60 dimensions. When testing with BPNN, the best dimension of GP-LVM appears to be 205 dimensions, which has some contingency. From the six figures, it can be observed that there is a maximum value in low dimensions.
To explore the difference in the optimal size number between different subjects, and the effect on different gesture recognition. We used the data which went through LDA reduced dimension as the feature data. Among the specific data of each gesture action of each subject, 80% of them were randomly selected as training data, and the rest were test data, and ten sets of training and test data were randomly obtained. The optimal dimensionality reduction dimension of each classifier was selected. KNN, NB, and DA classifiers used 5-dimensional data, RF classifiers used 6-dimensional data, and BPNN used 8-dimensional data. The final recognition rate was the average of 10 test results. The gesture recognition results are shown in Table 2, and the gesture recognition results for each gesture action are shown in Table 3.
It can be seen from Table 2 and Table 3 that the DA classification algorithm has the highest recognition rate, and the average recognition rate is 98.2%. The standard deviation of recognition rates between different subjects and between different gestures is 1.3% and 0.5%, respectively, and robustness is the best. The individual differences between subjects amount to less than 2% in using RF, NB, and DA classifications. In the KNN and BPNN classification, the impact of individual differences is only 2.3%. And the effect of different gestures on the optimal size is less than 2.7%. All results show that the optimal size number has no difference in subjects and gesture actions, and the effect of DA is best.

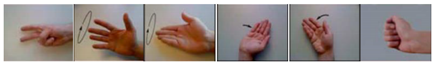
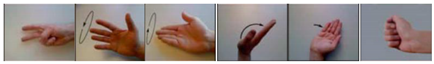
3.2. Benchmark Scientific Databases

Due to the three feature selection methods of LE, KPCA, and LDA, and the good performance of the DA classifier on the self-collecting signals, we applied it to the benchmark scientific databases [52] to further explore the optimal size. Because KPCA is more costly and less accurate than PCA, we used PCA to replace KPCA. Exercise B in the benchmark database (including eight isometric and isometric hand configurations and nine basic movements of the wrist) was selected as the data set for this part of the experiment. Acquired the data set by ten patch electrodes, obtain the 630-dimensional feature vector after feature calculation.

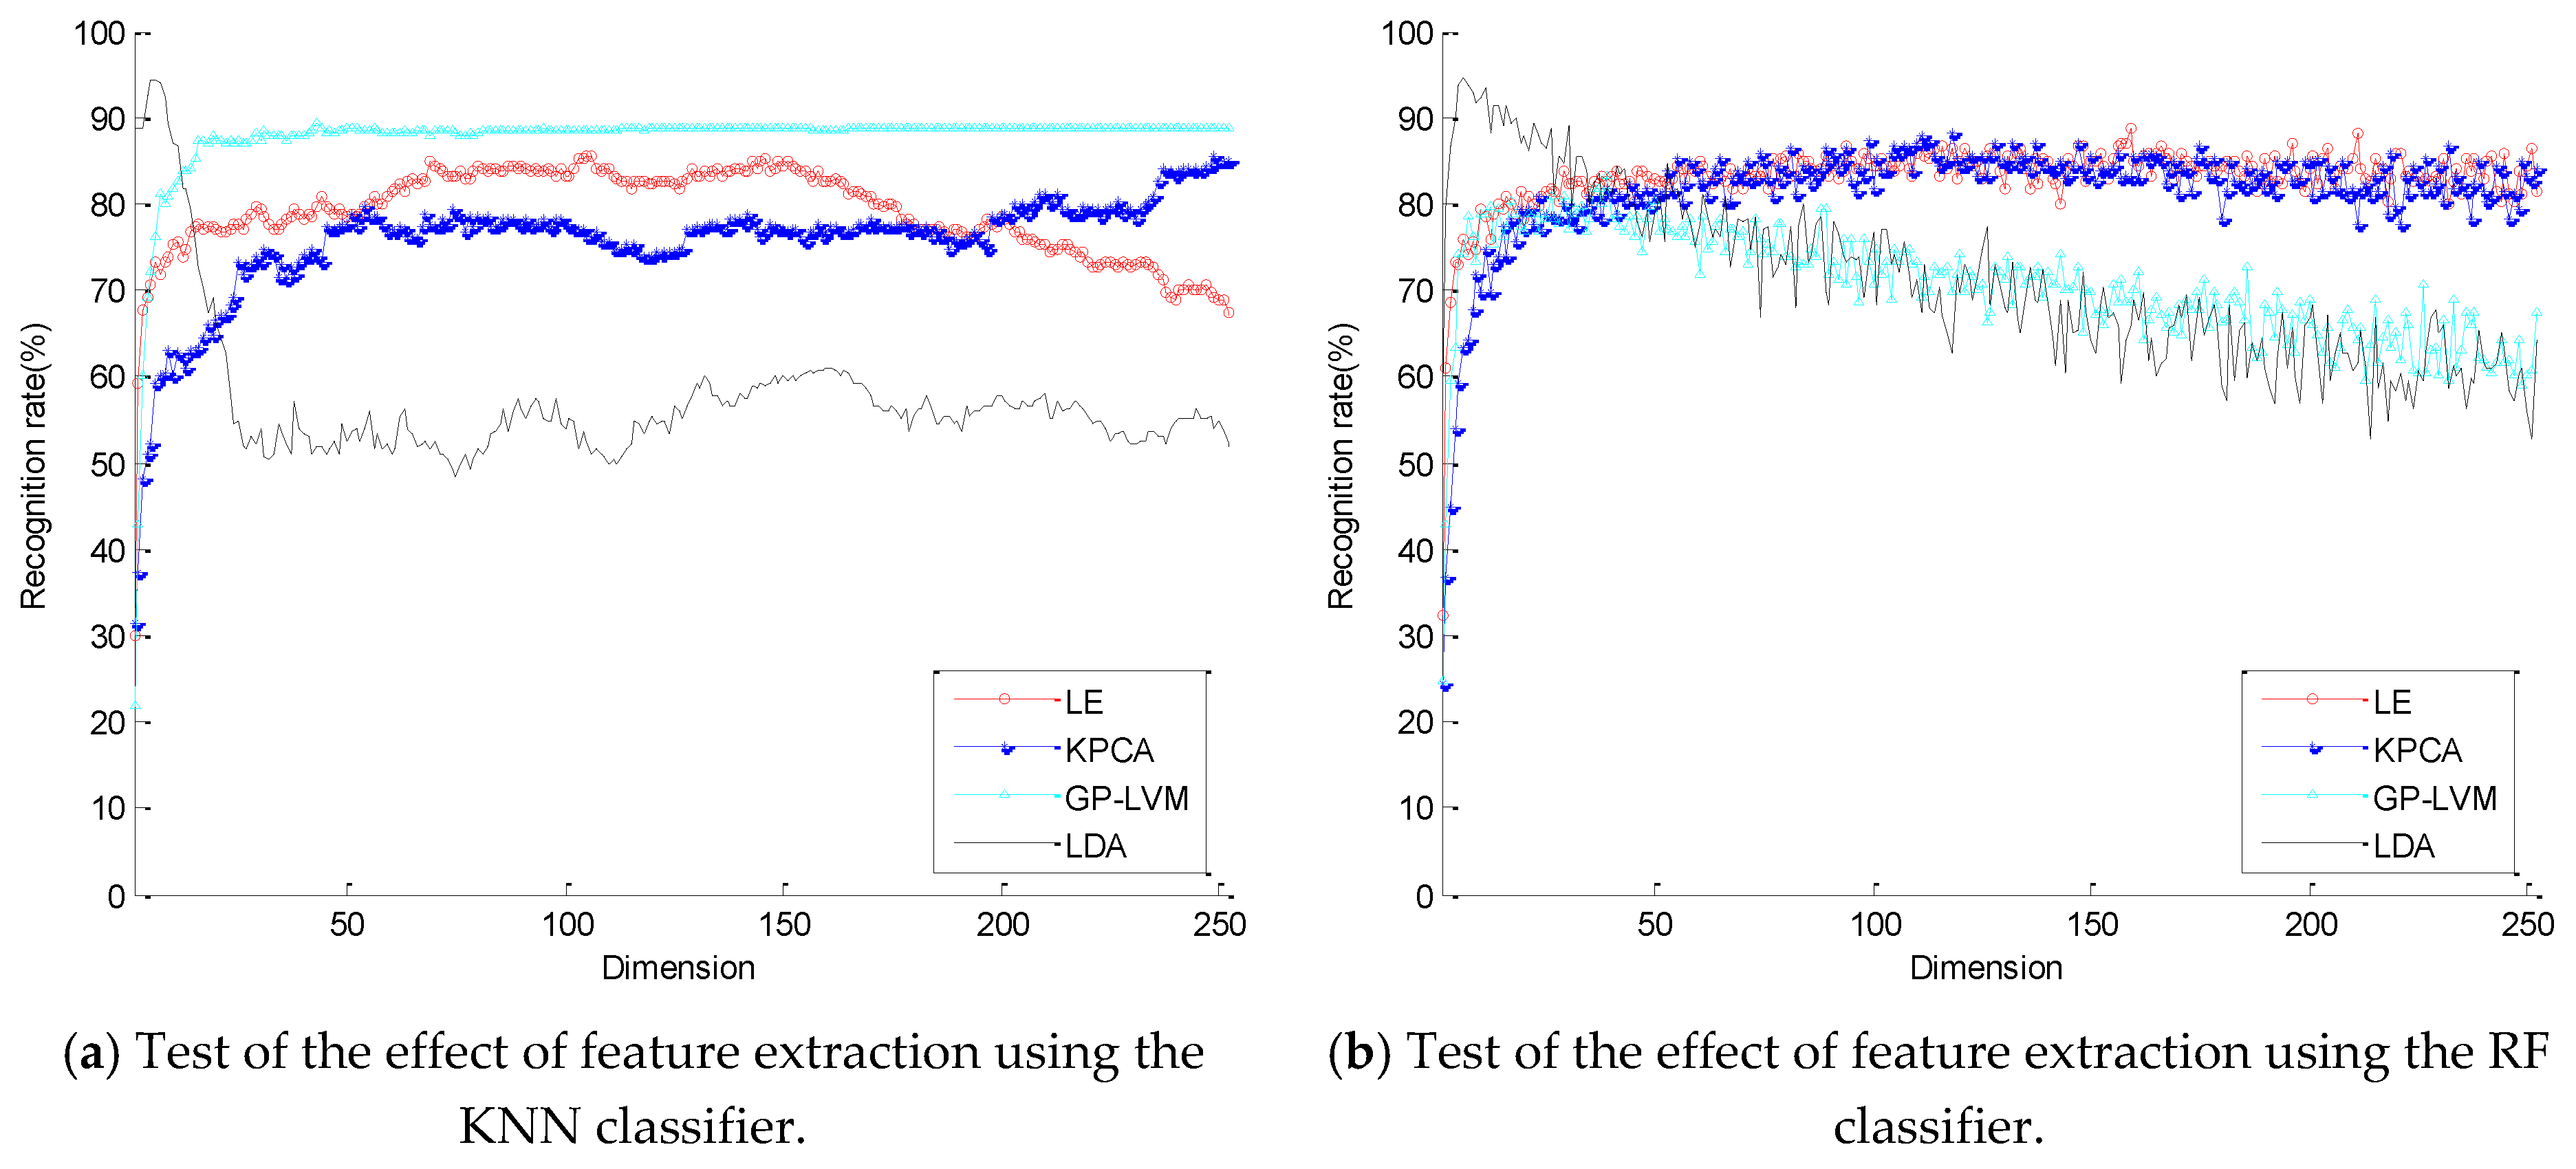
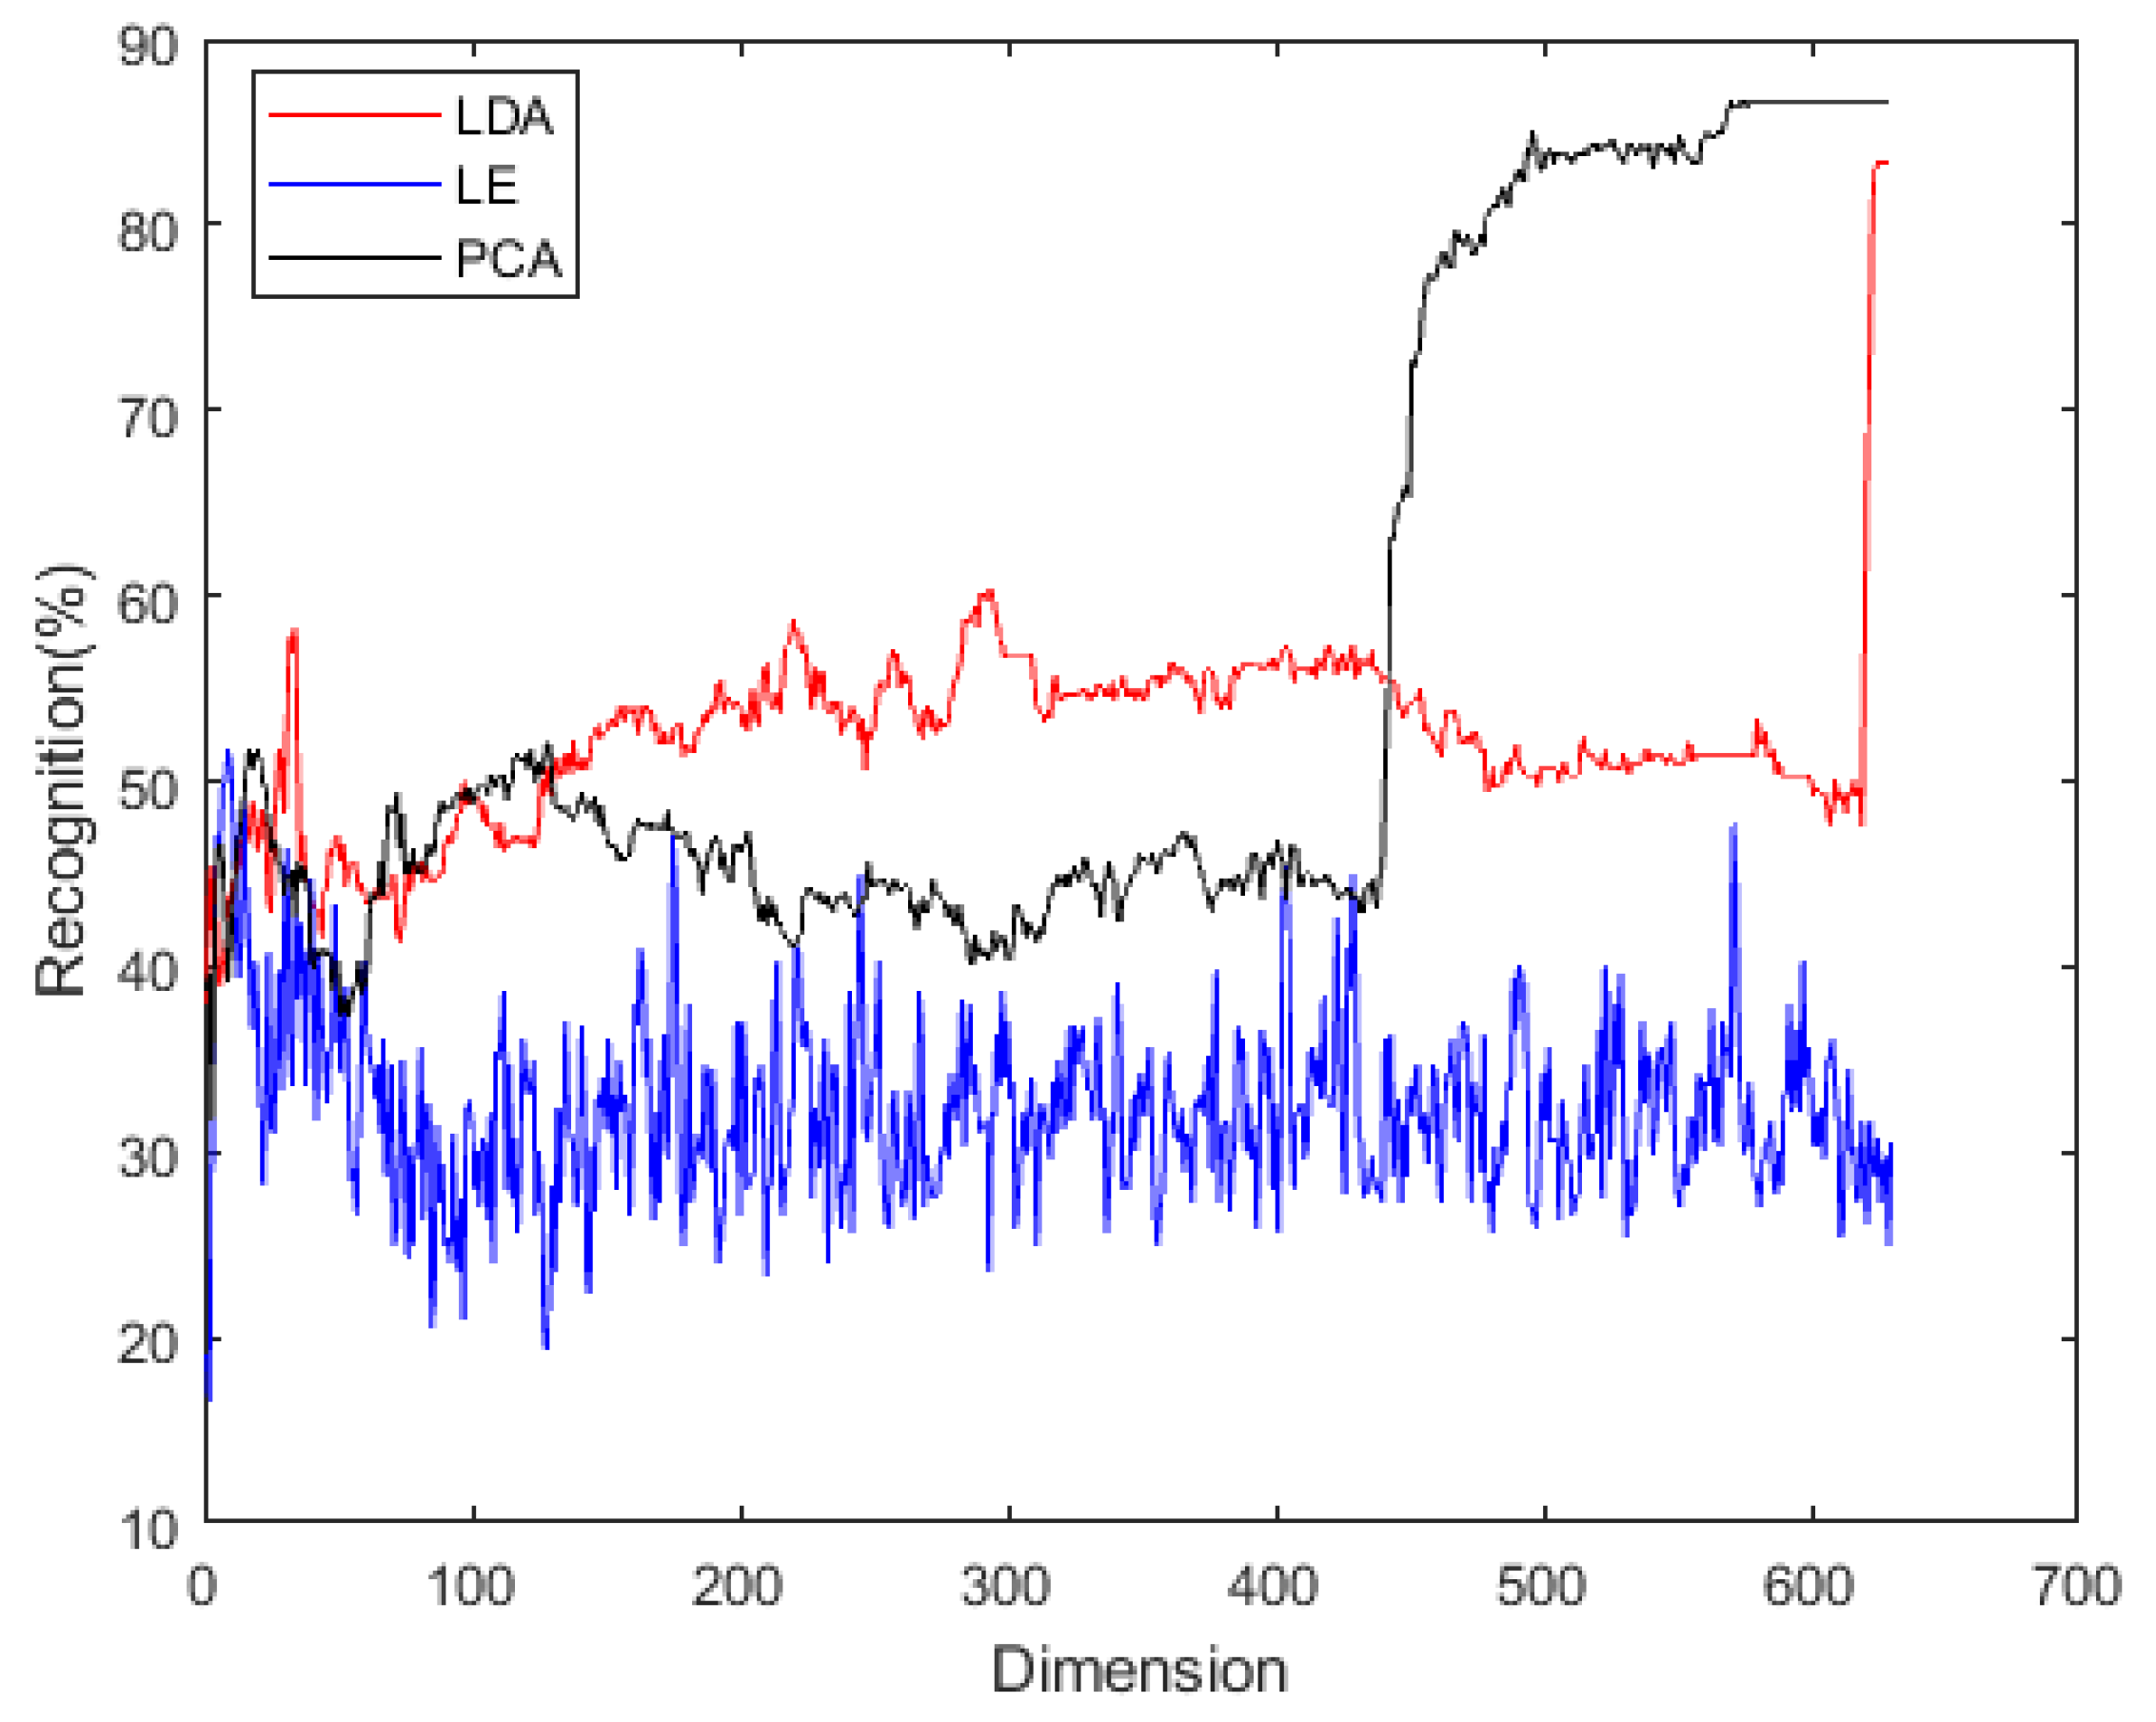
3.2.1. Dimensional Exploration of Similar Gestures

In this part, we selected six kinds of gestures similar to the self-acquisition signal gestures and carried out preliminary feature selection methods and dimension exploration. The experimental results are shown in Figure 5. The results show that the best recognition rate of LE is 51.67, the corresponding dimension is 9; the best recognition rate of LDA is 83.33, the corresponding dimension is 625; the best recognition rate of PCA is 86.67, the corresponding dimension is 570.

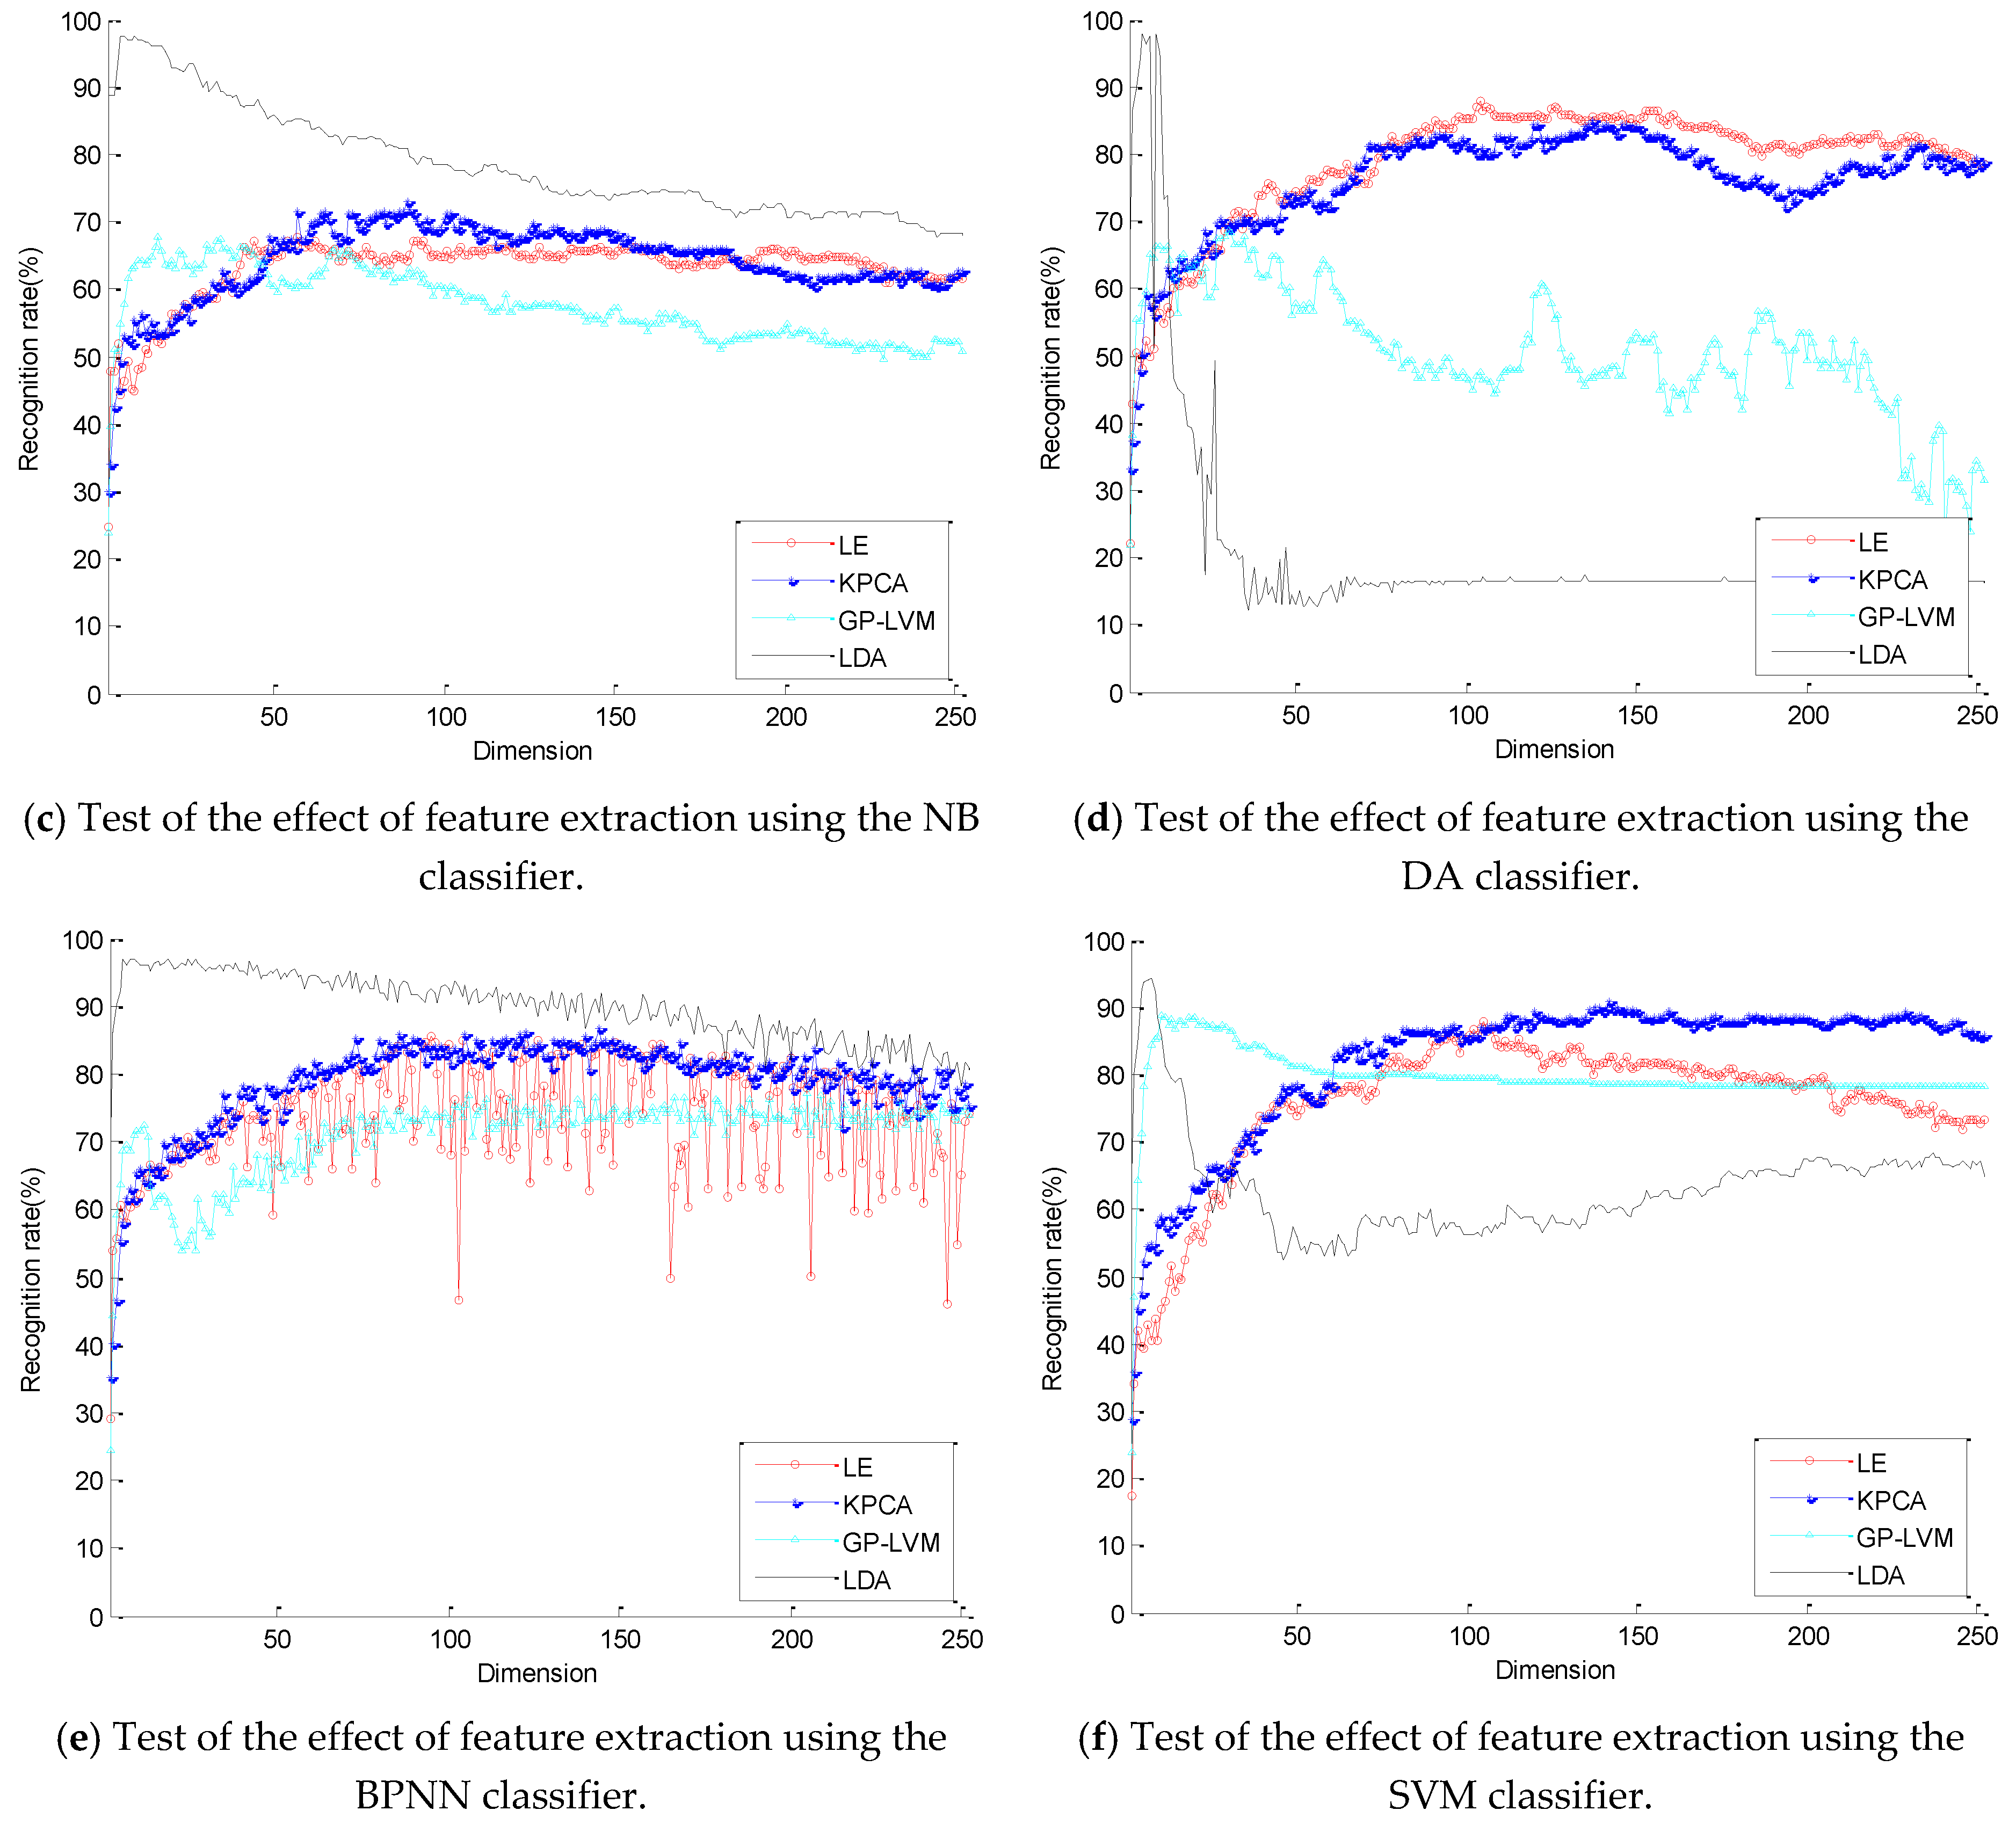
3.2.2. Dimensional Exploration of Different Gestures

To explore the effects of different gesture combinations on the classification effect and the optimal dimension, combined with the experimental results of Section 3.2.1, PCA and LDA were used to experiment on the four and six freely combined gestures on the dataset. Table 3 is the top ten gestures with the accuracy of the four action combinations after the PCA size reduced, and the corresponding optimal size. As can be seen from Table 4, the best dimension of PCA is 511 ± 12, and the best dimension of LDA is 35 ± 24. LDA is inferior to PCA in terms of stability of optimal size or classification accuracy. Therefore, PCA was chosen to explore the best dimensions of the six gestures. The results were shown in Table 5. It can be seen that the best dimension for PCA to classify six gestures is 542 ± 26.

4. Conclusions

In this paper, we first classify six gestures from 15 healthy subjects using self-acquired signals (252-dimensional feature vectors), compare feature selection methods and classifiers with better classification effects, and compare different. Whether there are individual differences between the examiners is explored. The results indicate that there are no individual differences between subjects. Next, using the benchmark dataset (630-dimensional feature vector), the PCA and LDA dimension reduction methods are combined with the DA classifier to explore the effect of different numbers and different gestures on the optimal dimension. The experimental results show that the maximum accuracy of the four types of gestures is up to 100.0% after PCA dimensional reduction, and the optimal size is 511 ± 12. The highest accuracy after LDA reduction is only 73.94%, and the optimal size is 35 ± 24. The performance of PCA is better than LDA, both in terms of classification accuracy and stability of optimal size. For the six types of gestures, the highest classification accuracy after PCA reduction is 98.29%, and the optimal size is 542 ± 26. This shows that as the gesture movement increases or decreases, the optimal size of the PCA dimension reduction is not large, basically between 516 and 523 dimensions. The difference in the dimensionality of the two data sets may be due to the difference in the number of electrodes used in the two data sets during signal acquisition. The first data set was acquired using four electrode patches, while the second data set was acquired using ten patch electrodes. The multiplication of the number of electrodes will undoubtedly increase the complexity of the signal. If a high-precision classification is desired, the dimensionality reduction will not be large. This also inspired us that the dimension of the sEMG signal is not as high as possible. We need to choose different dimensions according to the different requirements of the application. In general, the research results can meet the accuracy requirements of the automatic standing wood pruning machine for the classification of myoelectric signals. It provides a platform and extension for new control methods for pruning machines. The experimental results can be applied not only to the control method of the pruning machine but also to the forestry machinery below the six control commands, demonstrating the application of sEMG-based gesture recognition technology in the field of forestry machinery intelligence and human computer interaction.

Author Contributions

Conceptualization, W.L. and J.K.; methodology, J.K.; data curation, Y.W., X.H., and Z.W.; formal analysis, Y.W., X.H., and J.W.; supervision, J.W. and W.L.; writing—original draft preparation, Y.W.; project administration, J.W.

Funding

This research is financially supported by the Ningxia Hui Autonomous Region science and technology key R&D project (No. 2018BBF02020).

Conflicts of Interest

The authors declare no conflicts of interest.

References

  1. Cheung, V.C.K.; d’Avella, A.; Tresch, M.C.; Bizzi, E. Central and sensory contributions to the activation and organization of muscle synergies during natural motor behaviors. J. Neurosci. 2005, 25, 6419–6434. [Google Scholar] [CrossRef] [PubMed]
  2. Cho, Y.J.; Kim, J.Y. The effects of load, flexion, twisting and window size on the stationarity of trunk muscle EMG signals. Int. J. Ind. Ergon. 2012, 42, 287–292. [Google Scholar] [CrossRef]
  3. Gioioso, G.; Salvietti, G.; Malvezzi, M.; Prattichizzo, D. An Object-Based Approach to Map Human Hand Synergies onto Robotic Hands with Dissimilar Kinematics. In Robotics: Science and Systems VIII; MIT Press: Sydney, Australia, 2012; p. 504. [Google Scholar]
  4. Shi, W.T.; Lyu, Z.J.; Tang, S.T.; Chia, T.L.; Yang, C.Y. A bionic hand controlled by hand gesture recognition based on surface EMG signals: A preliminary study. Biocybern. Biomed. Eng. 2018, 38, 126–135. [Google Scholar] [CrossRef]
  5. Naik, G.R.; Al-Ani, A.; Gobbo, M.; Nguyen, H.T. Does Heel Height Cause Imbalance during Sit-to-Stand Task: Surface EMG Perspective. Front. Physiol. 2017, 8, 626. [Google Scholar] [CrossRef]
  6. Rehman, M.Z.U.; Gilani, S.O.; Waris, A.; Niazi, I.K.; Slabaugh, G.; Farina, D.; Kamavuako, E.N. Stacked Sparse Autoencoders for EMG-Based Classification of Hand Motions: A Comparative Multi Day Analyses between Surface and Intramuscular EMG. Appl. Sci. 2018, 8, 1126. [Google Scholar] [CrossRef] [Green Version]
  7. Naik, G.R.; Selvan, S.E.; Nguyen, H.T. Single-Channel EMG Classification with Ensemble-Empirical-Mode-Decomposition-Based ICA for Diagnosing Neuromuscular Disorders. IEEE Trans. Neural Syst. Rehabil. Eng. 2016, 24, 734–743. [Google Scholar] [CrossRef]
  8. Bai, X.P. Present situation, trend and goals of forestry mechanization in Japan. For. Sci. Technol. 1994, 11, 32–33. [Google Scholar]
  9. Li, W.B.; Huo, G.Q.; Feng, M. Study on technology and machine of standing tree pruning. For. Eng. 2009, 25, 32–34. [Google Scholar]
  10. Zhang, J.M.; Li, W.B.; Sa, C. Wireless transmitter control system of automatic pruning machine based on EDA technology. For. Mach. Wood Work. Equip. 2006, 34, 23–25. [Google Scholar]
  11. Naik, G.R.; Arjunan, S.; Kumar, D. Applications of ICA and fractal dimension in sEMG signal processing for subtle movement analysis: A review. Australas. Phys. Eng. Sci. Med. 2011, 34, 179–193. [Google Scholar] [CrossRef]
  12. Zhan, L.; Zhu, X.L.; Ma, Y. The design of small skidder for intermediate cutting area. J. For. Eng. 2016, 1, 97–102. [Google Scholar]
  13. Hudgins, B.; Parker, P.; Scott, R. A new strategy for multifunction myoelectric control. IEEE Trans. Biomed. Eng. 1993, 40, 82–94. [Google Scholar] [CrossRef] [PubMed]
  14. Karlik, B.; Tokhi, M.O.; Alci, M. A fuzzy clustering neural network architecture for multifunction upper-limb prosthesis. IEEE Trans. Biomed. Eng. 2003, 50, 1255–1261. [Google Scholar] [CrossRef] [PubMed]
  15. Zardoshti-Kermani, M.; Wheeler, B.C.; Badie, K.; Hashemi, R.M. EMG feature evaluation for movement control of upper extremity prostheses. IEEE Trans. Neural Syst. Rehabil. Eng. 1995, 3, 324–333. [Google Scholar] [CrossRef]
  16. Kim, K.S.; Choi, H.H.; Moon, C.S.; Mun, C.W. Comparison of k-nearest neighbor, quadratic discriminant and linear discriminant analysis in classification of electromyogram signals based on the wrist-motion directions. Curr. Appl. Phys. 2011, 11, 740–745. [Google Scholar] [CrossRef]
  17. Boostani, R.; Moradi, M.H. Evaluation of the forearm EMG signal features for the control of a prosthetic hand. Physiol. Meas. 2003, 24, 309–319. [Google Scholar] [CrossRef] [Green Version]
  18. Oskoei, M.A.; Hu, H. Support vector machine based classification scheme for myoelectric control applied to upper limb. IEEE Trans. Biomed. Eng. 2008, 55, 1956–1965. [Google Scholar] [CrossRef]
  19. Kumar, D.K.; Pah, N.D.; Bradley, A. Wavelet analysis of surface electromyography to determine muscle fatigue. IEEE Trans. Neural Syst. Rehabil. Eng. 2003, 11, 400–406. [Google Scholar] [CrossRef]
  20. Kiatpanichagij, K.; Afzulpurkar, N. Use of supervised discretization with PCA in wavelet packet transformation-based surface electromyogram classification. Biomed. Signal Process. Control 2009, 4, 127–138. [Google Scholar] [CrossRef]
  21. Rosso, O.A.; Blanco, S.; Yordanova, J.; Kolev, V.; Figliola, A.; Schurmann, M.; Basar, E. Wavelet entropy: A new tool for analysis of short duration brain electrical signals. J. Neurosci. Methods 2001, 105, 65–75. [Google Scholar] [CrossRef]
  22. Zhang, X.; Zhou, P. Sample entropy analysis of surface EMG for improved muscle activity onset detection against spurious background spikes. J. Electromyogr. Kinesiol. 2012, 22, 901–907. [Google Scholar] [CrossRef] [PubMed] [Green Version]
  23. Phinyomark, A.; Phukpattaranont, P.; Limsakul, C. Feature reduction and selection for EMG signal classification. Expert Syst. Appl. 2012, 39, 7420–7431. [Google Scholar] [CrossRef]
  24. Bakshi, K.; Manjunatha, M.; Kumar, C.S. Estimation of continuous and constraint-free 3 DoF wrist movements from surface electromyogram signal using kernel recursive least square tracker. Biomed. Signal Process. Control 2018, 46, 104–115. [Google Scholar] [CrossRef]
  25. Fairley, J.A.; Georgoulas, G.; Smart, O.L.; Dimakopoulos, G.; Karvelis, P.; Stylios, C.D.; Rye, D.B.; Bliwise, D.L. Wavelet analysis for detection of phasic electromyographic activity in sleep: Influence of mother wavelet and dimensionality reduction. Comput. Biol. Med. 2014, 48, 77–84. [Google Scholar] [CrossRef] [PubMed] [Green Version]
  26. Xing, K.X.; Yang, P.P.; Huang, J.; Wang, Y.J.; Zhu, Q.M. A real-time EMG pattern recognition method for virtual myoelectric hand control. Neurocomputing 2014, 136, 345–355. [Google Scholar] [CrossRef]
  27. Xie, H.B.; Zhou, P.; Guo, T.R.; Sivakumar, B.; Zhang, X.; Dokos, S. Multiscale Two-Directional Two-Dimensional Principal Component Analysis and Its Application to High-Dimensional Biomedical Signal Classification. IEEE Trans. Biomed. Eng. 2016, 63, 1416–1425. [Google Scholar] [CrossRef]
  28. Wang, N.F.; Lao, K.Y.; Zhang, X.H.; Lin, J.F.; Zhang, X.M. The recognition of grasping force using LDA. Biomed. Signal Process. Control 2019, 47, 393–400. [Google Scholar] [CrossRef]
  29. Hu, X.H.; Kan, J.M.; Li, W.B. Classification of surface electromyogram signals based on directed acyclic graphs and support vector machines. Turk. J. Electr. Eng. Comput. Sci. 2018, 26, 732–742. [Google Scholar] [CrossRef]
  30. Miller, C.J. Real-Time Feature Extraction and Classification of Prehensile EMG Signals. Master’s Thesis, San Diego State University, San Diego, CA, USA, 2008. [Google Scholar]
  31. Wang, N.F.; Chen, Y.L.; Zhang, X.M. Realtime recognition of multi-finger prehensile gestures. Biomed. Signal Process. Control 2014, 13, 262–269. [Google Scholar] [CrossRef]
  32. Park, S.H.; Lee, S.P. EMG pattern recognition based on artificial intelligence techniques. IEEE Trans. Neural Syst. Rehabil. Eng. 1998, 6, 400–405. [Google Scholar] [CrossRef]
  33. Du, S.; Vuskovic, M. Temporal vs. spectral approach to feature extraction from prehensile EMG signals. In Proceedings of the IEEE International Conference on Information Reuse and Integration, Las Vegas, NV, USA, 8–10 November 2004; pp. 344–350. [Google Scholar]
  34. Rønager, J.; Christensen, H.; Fuglsang-Frederiksen, A. Power spectrum analysis of the EMG pattern in normal and diseased muscles. J. Neurol. Sci. 1989, 94, 283–294. [Google Scholar] [CrossRef]
  35. Potluri, C.; Anugolu, M.; Schoen, M.P.; Naidu, D.S.; Urfer, A.; Chiu, S. Hybrid fusion of linear, non-linear and spectral models for the dynamic modeling of sEMG and skeletal muscle force. Comput. Biol. Med. 2013, 43, 1815–1826. [Google Scholar] [CrossRef] [PubMed]
  36. Klema, V.; Laub, A. The singular value decomposition: Its computation and some applications. IEEE Trans. Autom. Control 1980, 25, 164–176. [Google Scholar] [CrossRef] [Green Version]
  37. Barmpakos, D.; Strimpakos, N.; Karkanis, S.A.; Pattichis, C. Towards a Versatile Surface Electromyography Classification System. In XIV Mediterranean Conference on Medical and Biological Engineering and Computing 2016; Springer International Publishing: Berlin/Heidelberg, Germany, 2016. [Google Scholar]
  38. Jiang, M.; Wang, R.; Wang, J.; Jin, D. A Method of Recognizing Finger Motion Using Wavelet Transform of Surface EMG Signal. In Proceedings of the IEEE Engineering in Medicine and Biology Society, Shanghai, China, 17–18 January 2005; Volume 3, pp. 2672–2674. [Google Scholar]
  39. Lucas, M.F.; Gaufriau, A.; Pascual, S.; Doncarli, C.; Farina, D. Multi-channel surface emg classification using support vector machines and signal-based wavelet optimization. Biomed. Signal Process. Control 2008, 3, 169–174. [Google Scholar] [CrossRef]
  40. Chu, J.U.; Moon, I.; Lee, Y.J.; Kim, S.K.; Mun, M.S. A Supervised Feature-Projection-Based Real-Time EMG Pattern Recognition for Multifunction Myoelectric Hand Control. IEEE ASME Trans. Mechatron. 2007, 12, 282–290. [Google Scholar] [CrossRef]
  41. Rong, Y.; Hao, D.; Han, X.; Zhang, Y.; Zhang, J.; Zeng, Y. Classification of surface emgs using wavelet packet energy analysis and a genetic algorithm-based support vector machine. Neurophysiology 2013, 45, 39–48. [Google Scholar] [CrossRef]
  42. Guo, Y.; Naik, G.R.; Huang, S.; Abraham, A.; Nguyen, H.T. Nonlinear multiscale maximal lyapunov exponent for accurate myoelectric signal classification. Appl. Soft Comput. 2015, 36, 633–640. [Google Scholar] [CrossRef]
  43. Zhang, Z.Y.; Zha, H.Y. Principal manifolds and nonlinear dimensionality reduction via tangent space alignment. SIAM J. Sci. Comput. 2004, 8, 313–338. [Google Scholar] [CrossRef] [Green Version]
  44. Cao, L.J.; Chua, K.S.; Chong, W.K.; Lee, H.P.; Gu, Q.M. A comparison of PCA, KPCA and ICA for dimensionality reduction in support vector machine. Neurocomputing 2003, 55, 321–336. [Google Scholar] [CrossRef]
  45. Lawrence, N. Probabilistic non-linear principal component analysis with Gaussian process latent variable models. J. Mach. Learn. Res. 2005, 6, 1783–1816. [Google Scholar]
  46. Ma, L.; Crawford, M.M.; Tian, J.W. Local Manifold Learning-Based-Nearest-Neighbor for Hyperspectral Image Classification. IEEE Trans. Geosci. Remote 2010, 48, 4099–4109. [Google Scholar] [CrossRef]
  47. Verikas, A.; Gelzinis, A.; Bacauskiene, M. Mining data with random forests: A survey and results of new tests. Pattern Recognit. 2011, 44, 330–349. [Google Scholar] [CrossRef]
  48. Venugopal, G.; Navaneethakrishna, M.; Ramakrishnan, S. Extraction and analysis of multiple time window features associated with muscle fatigue conditions using sEMG signals. Expert Syst. Appl. 2014, 41, 2652–2659. [Google Scholar] [CrossRef]
  49. Alkan, A.; Cunay, M. Identification of EMG signals using discriminant analysis and SVM classifier. Expert Syst. Appl. 2012, 39, 44–47. [Google Scholar] [CrossRef]
  50. Ren, C.; An, N.; Wang, J.; Li, L.; Hu, B.; Shang, D. Optimal parameters selection for BP neural network based on particle swarm optimization: A case study of wind speed forecasting. Knowl. Based Syst. 2014, 56, 226–239. [Google Scholar] [CrossRef]
  51. Karthick, P.A.; Ghosh, D.M.; Ramakrishnan, S. Surface electromyography based muscle fatigue detection using high-resolution time-frequency methods and machine learning algorithms. Comput. Methods Programs Biomed. 2018, 154, 45–56. [Google Scholar] [CrossRef]
  52. Atzori, M.; Gijsberts, A.; Castellini, C.; Caputo, B.; Hager, A.G.M.; Elsig, S.; Giatsidis, G.; Bassetto, F.; Muller, H. Electromyography data for non-invasive naturally-controlled Robotic hand prostheses. Sci. Data 2014, 1, 140053. [Google Scholar] [CrossRef] [Green Version]
Figure 1. Photo of placement positions of surface electrodes. (a) is the abdominal positions of the palmaris longus muscle and brachioradialis muscle; (b) is the abdominal positions of the extensor digitorum muscle and extensor carpi ulnaris muscle.
Applsci 09 05343 g001
Figure 2. sEMG signal waveform and activity segment detection.
Applsci 09 05343 g002
Figure 3. Gesture classification process based on sEMG signal.
Applsci 09 05343 g003
Figure 4. Test of the effect of feature extraction.
Applsci 09 05343 g004aApplsci 09 05343 g004b
Figure 5. Test of the effect of feature extraction using the DA classifier on the benchmark databases.
Applsci 09 05343 g005
Table 1. Comparison of the effects of the four feature extraction methods.
Feature Extraction MethodsClassification MethodsBest Classification Rates (%)Optimal DimensionsAverage of Optimal Dimensions
LEKNN85.56105104.2
RF88.89159
NB67.7857
DA87.78104
BPNN85.4395
SVM87.78105
KPCAKNN85.56249146.5
RF88.15118
NB72.9689
DA84.81137
BPNN86.79144
SVM90.74142
GP-LVMKNN89.264357.2
RF83.3339
NB67.7816
DA68.5230
BPNN77.04205
SVM88.8910
LDAKNN94.4456.0
RF94.446
NB97.415
DA97.785
BPNN97.048
SVM94.447
Table 2. Overall classification results for each subject when employing 5 common algorithms.
Subject NumberKNN/%RF/%NB/%DA/%BPNN/%
193.396.798.398.3100.0
2100.095.698.396.796.7
398.394.498.396.798.3
498.397.8100.096.7100.0
595.096.195.098.398.3
6100.097.896.798.3100.0
796.795.095.096.793.3
8100.094.498.398.396.7
998.398.3100.0100.0100.0
1093.396.798.3100.096.7
1196.797.298.398.393.3
12100.096.798.398.3100.0
13100.093.9100.0100.096.7
1496.791.793.396.795.0
1595.093.9100.0100.0100.0
Averaged (mean ± SD)97.4 ± 2.395.7 ± 1.897.9 ± 2.098.2 ± 1.397.7 ± 2.3
Table 3. Overall classification results for each motion when employing 5 common algorithms.
GesturesKNN/%RF/%NB/%DA/%BPNN/%
1100.097.397.398.098.7
298.093.397.398.095.3
398.796.999.398.0100.0
499.398.098.098.097.3
596.794.299.399.398.7
692.094.796.098.096.0
Averaged (mean ± SD)97.4 ± 2.795.7 ± 1.797.9 ± 1.298.2 ± 0.597.7 ± 1.6
Table 4. Classification accuracy of four gesture combinations after feature selection. (a) Classification accuracy after dimensional reduction by PCA. (b) Classification accuracy after dimensional reduction by LDA.
a
Gesture CombinationsBest Classification Rate (%)Optimal Dimensions
Applsci 09 05343 i001100.0504
Applsci 09 05343 i00299.22504
Applsci 09 05343 i00399.22507
Applsci 09 05343 i00499.21511
Applsci 09 05343 i00599.18503
Applsci 09 05343 i00698.95507
Applsci 09 05343 i00798.92515
Applsci 09 05343 i00898.70504
Applsci 09 05343 i00998.64523
Applsci 09 05343 i01098.64499
b
Gesture CombinationsBest Classification Rate (%)Optimal Dimensions
Applsci 09 05343 i01173.9429
Applsci 09 05343 i01271.5416
Applsci 09 05343 i01370.8234
Applsci 09 05343 i01470.5111
Applsci 09 05343 i01568.9944
Applsci 09 05343 i01668.1123
Applsci 09 05343 i01768.0758
Applsci 09 05343 i01867.9022
Applsci 09 05343 i01967.8759
Applsci 09 05343 i02067.7258
Table 5. Classification accuracy of six gesture combinations after PCA feature selection.
Gesture CombinationsBest Classification Rate (%)Optimal Dimensions
Applsci 09 05343 i02198.29567
Applsci 09 05343 i02298.21549
Applsci 09 05343 i02397.88533
Applsci 09 05343 i02497.71508
Applsci 09 05343 i02597.71560
Applsci 09 05343 i02697.70535
Applsci 09 05343 i02797.64 527
Applsci 09 05343 i02897.16517
Applsci 09 05343 i02997.15551
Applsci 09 05343 i03097.03549

