1. Introduction
Built in 2006, the outer burial pits of the Han Dynasty Yang Mausoleum is the first fully enclosed museum in China. In order to effectively evaluate the effect of the closed protection mode, 260 Internet of things (IoT) sensors have been installed in the site since 2009. Heterogeneous data such as temperature, humidity and carbon dioxide concentration are mainly monitored by IoT sensors. In the museum, heterogeneous data can be monitored remotely and in real time by IoT sensors [
1,
2,
3,
4], which can be used to study the evolution law of the site and predict its development trend, so as to better guide the protection of the site. Also, IoT sensors can communicate autonomously with the base station to report the current condition of the soil surface, which greatly 1reduces human interference and damage. Although a large number of IoT sensors have been deployed in the museum, the utilization rate of large-scale monitoring data is not relatively high. A deeper understanding of the data is needed to detect or determine anomalies. It mainly went through the following two stages.
The processing of monitoring data still relies on traditional statistical models. These studies include studies on indoor museums and outdoor soil sites, involving museum air quality [
5], temperature and humidity [
6], microclimate models [
7,
8], etc. Furthermore, there are also many studies on the outer burial pits of the Han Dynasty Yang Mausoleum, including the influence of indoor temperature change on cultural relics [
9], prediction model [
10,
11], weathering of the soil sites [
12], the change rules of indoor air temperature and relative humidity [
13,
14], indoor air environment at Hanyang Mausoleum museum [
15]. These researches are based on the traditional statistical algorithm, which can only obtain the statistical rules of the data in a short time. In addition, these studies also don’t mine the detailed characteristics of the data. The algorithm for processing data is not only relatively simple but also uses few data points. Compared with a large number of data, the algorithm uses less data. So it can not show the detailed characteristics of temperature change.
Traditional machine learning is an attempt to predict the future behavior or trend of data based only on observed samples. Modern machine learning [
16,
17] is a technology that studies how computers simulate or implement human learning behavior in order to acquire new knowledge or skills. Semi-supervised learning [
18] can use big data to reorganize the existing knowledge structure to continuously improve its performance. Literature [
19] proposes a time-frequency representation based on kernel-extreme learning machine(ELM), which solves non-uniform sampling. ELM is a single-hidden layer forward neural network (SLFNN) machine learning method, its main advantages are simple structure and fast learning. Literature [
20] proposes a temperature data modeling and prediction algorithm by using ELM, which establishes a prediction model based on solar calendar label. Intelligent technology was initially introduced into the field of cultural relic protection by the model. Also, the prediction of temperature change in detail was also realized. The traditional Chinese lunar calendar can show information from both the sun and the moon. Natural data tend to be influenced by the sun and the moon at the same time, so using the lunar calendar as a time label would be more consistent with the changing law of the data itself.
Based on the previous work, in this paper, the ELM is used to establish a temperature prediction model based on lunar calendar label. Compared with the processing of solar calendar labels, accuracy of this method is relatively higher. In addition, the superiority of the lunar calendar in recording natural data is preliminarily verified. Experiments show that compared with the solar calendar model, the lunar calendar model can better predict the temperature, humidity, and other environmental factors. Modeling and analysis of temperature data based on lunar calendar can not only improve the accuracy of temperature prediction, but also effectively mine the overall law of temperature.
The structure of this paper is as follows: an introduction to site’s monitoring data characteristics and processing in
Section 2; data prediction model based on Lunar calendar is given in
Section 3; the results of real data tests are presented in
Section 4; and concluding remarks are given in
Section 5.
2. Monitoring Data Processing
2.1. Introduction to Solar Calendar and Lunar Calendar
The Gregorian calendar is used as solar calendar today in all around world, which was developed by the Romans according to the revolution of the earth. The average length of the calendar year is 365 days, 5 h, 49 min and 12 s, while the length of the tropical year is 365 days, 5 h, 48 min and 46 s. The difference between a Gregorian year and a tropical year is only 26 s. The month and date of each calendar year in the Gregorian calendar also coincide well with the position of the sun on the ecliptic. The Gregorian calendar is divided into 12 months, due to one twelfth of the tropical year being about 30 and a half days (30.4368 days). However, the “month” in question has nothing to do with the phase of the moon. In other words, the solar calendar can only show information about the sun.
The lunar calendar is based on the earth’s revolution and the moon’s revolution. Its history can be traced back to the Qin and Han dynasties. The lunar calendar takes the tropical year as one year and the lunar month as one month. However, a tropical year is about 11 days longer than 12 lunar months. If lunar year is measured in 12 months, the date will be wrong. Through practice, the ancients stipulated every three years an extra month, this year is called leap year. Through calculation, the method that seven calendar years were selected as leap years in 19 calendar years was invented. The 3rd, 6th, 9th, 11th, 14th, 17th, and 19th years are generally selected as leap years, and the rest of the year as ordinary years. A leap year has 13 months, while an ordinary year has only 12 months. Which month is set as leap month according to the solar terms of China. That leaves a mere 0.09 days (about 2 h, 9 min and 36 s) between the 19 tropical years and 235 lunar months (12 common years and seven leap years). During the southern and northern dynasties, Zu Chongzhi created the more accurate method, which selected 144 of 391 calendar years as leap years and the rest as common years. After that, it’s still used today. The uniqueness of the lunar calendar lies in that, on the one hand, the date of the calendar represents a certain phase of the moon, such as the beginning of the new moon, the full moon is just in the middle. On the other hand, it is coordinated with the four seasons (spring, summer, autumn and winter). In conclusion, the lunar calendar can display information from both the sun and the moon. Due to natural data are often influenced by both the sun and the moon, using the lunar calendar as a time label would be more consistent with the changing pattern of the data itself.
2.2. Monitoring Data
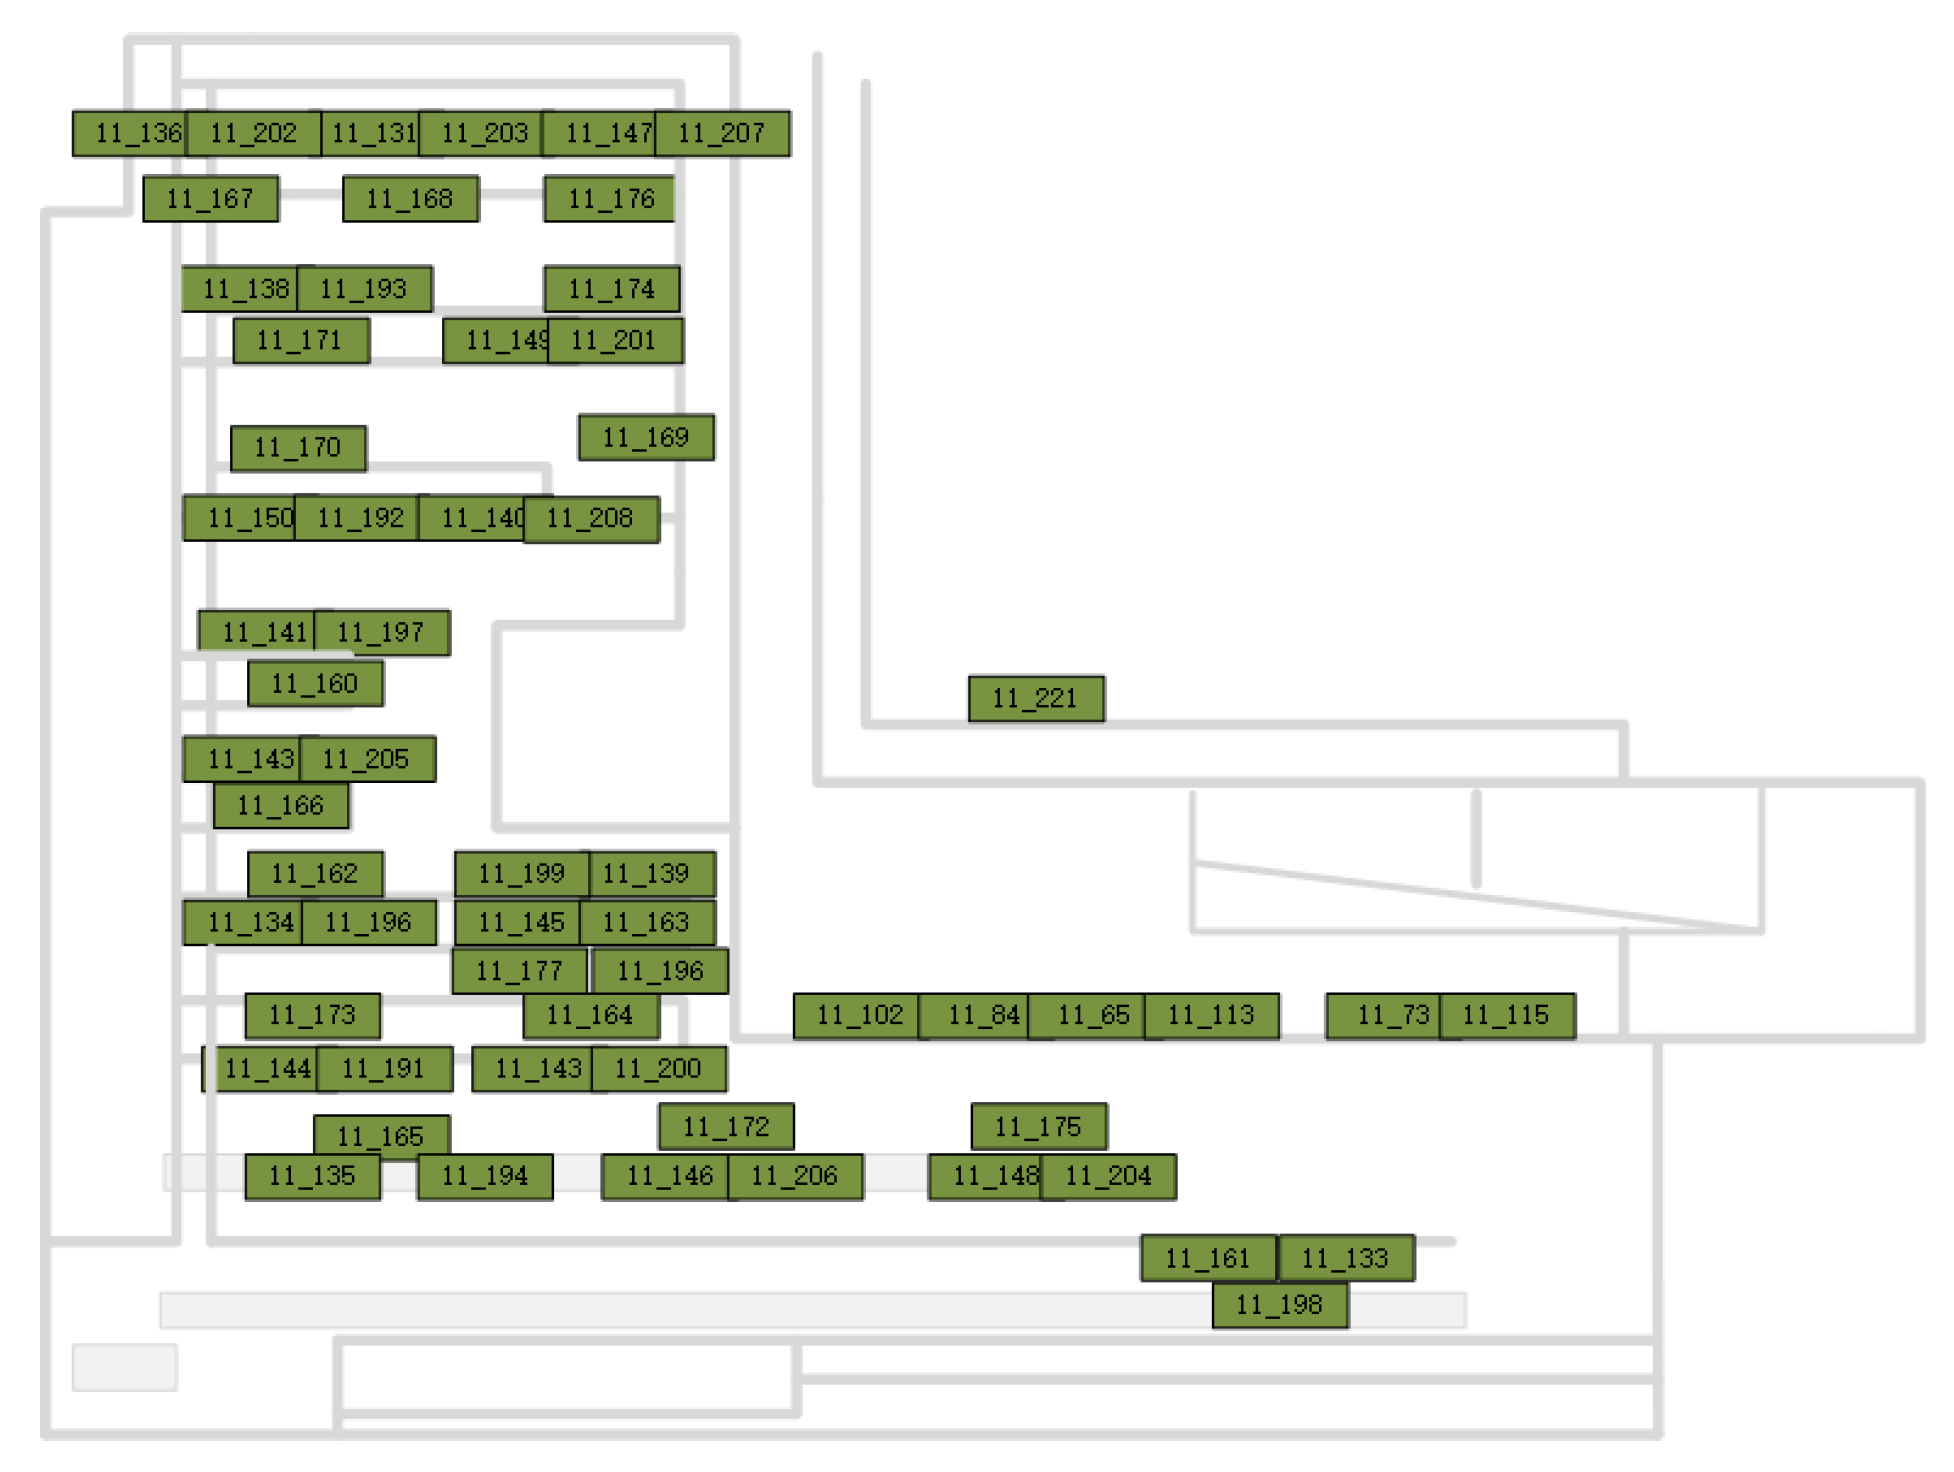
The outer burial pits of the Han Dynasty Yang Mausoleum is the first fully enclosed museum in China. As shown in
Figure 1, a large number of IoT sensors were set up at the site. Moreover, the green rectangle represents IoT sensor. A lots of heterogeneous data have been recorded over the years, including temperature, humidity, frost point, dew point, and carbon dioxide concentration. Although the outer burial pits is a completely enclosed environment, it only isolates the influence of atmospheric environment on the pit environment. Moreover, the site itself is still directly connected with the earth, which suggests that the impact of the underground environment on the site can’t be avoided. It indicates that the monitoring of the site itself is also indispensable. Therefore, on the basis of the existing monitoring points, soil temperature, water content, and electrical conductivity are also monitored on the soil partition beam, as shown in
Figure 2a,b. It makes the monitoring of environmental factors more comprehensive. In addition, monitoring points are also set up in the outer pit, outside the glass cover, and the site itself in
Figure 3 (Round, diamond, and rectangle represent temperature and humidity, crack, and soil respectively). On the basis of using the original monitoring points, the monitoring area can be more comprehensive.
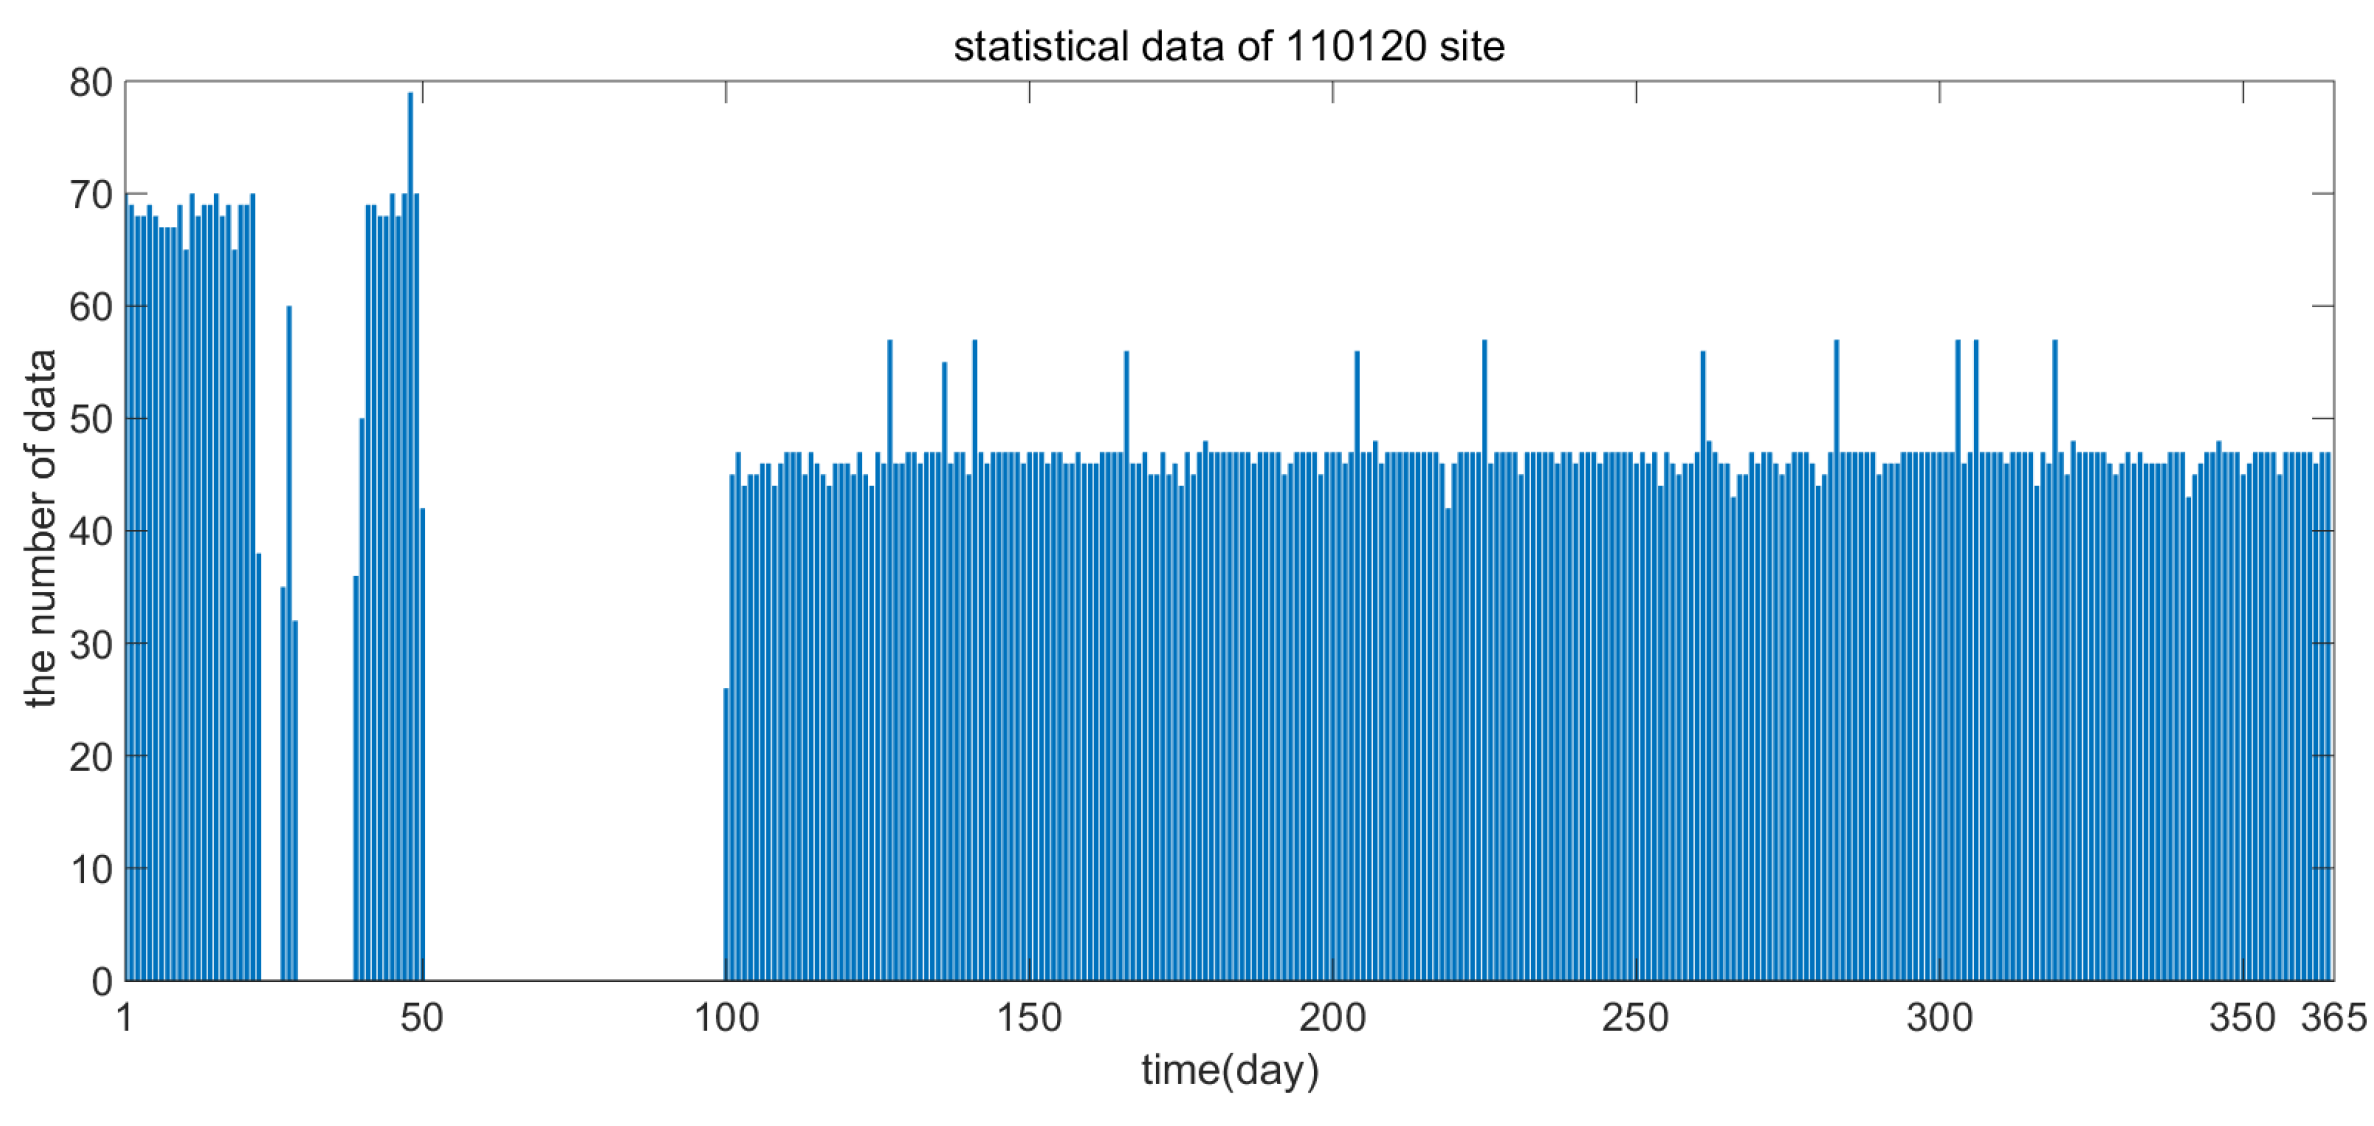
In this paper, the temperature monitoring data of the 110,120 sensor is selected as the analysis object, which is placed in the middle hall of the outer burial pits.
Figure 4 shows that the monitoring instrument is an indoor atmospheric temperature and humidity sensor (model: MW301GA). The measurement accuracy and range are
°C, 20–80 °C respectively, the monitoring period was from 1 January 2011 to 31 December 2011. Due to the museum staff adjusted the sampling frequency, different sampling frequencies occurred during a year period. The change of sampling frequency makes it impossible to use the monitoring data directly to build the lunar calendar model, otherwise the accuracy of the lunar calendar model will be reduced. The monitoring frequency was as following: sampling every 20 min from 1st to 50th days and every 30 min from 51st to 365th days. 18,720 data should be measured, but the total number of actual measured data s 15,007.
2.3. Data Information
Sensor number: 110,120.
Parameter type: temperature (°C).
Year of monitoring data: 2011.
Time period: from 1 January 2011 to 31 December 2011.
Sampling frequency: sampling every 20 min from 1st to 50th days and every 30 min from 51st to 365th days.
Number of data: 15,017.
The structure of this kind of data is relatively complex, as shown in
Figure 5 and
Figure 6. This is mainly reflected in two aspects:
Firstly, uneven distribution of data.
The adjustment of sensor sampling frequency, data recording, data transmission and other emergencies result in relatively more data recorded from 1st to 50th day. Due to the maintenance of monitoring equipment and the renovation of the museum’s power supply system, the recorded data are seriously insufficient from 51st to 99th day. If these data are directly used to calculate the daily average temperature, there will be a big error, and then building the temperature prediction model based on the statistical data will lead to inaccurate prediction.
Secondly, Missing data.
(1) Short-term deletion. From the 1st to the 50th day, the sensor collects data about 20 min once, so about 72 sets of data can be collected every day. Later, as the sampling frequency of the sensor was adjusted to about 30 min, only about 48 sets of data could be collected every day from the 100th to the 365th day. However, less data may be collected on the 100th day due to emergencies, which will affect the later machine learning.
(2) Long-term deletion. Data is missing on a daily basis, such as no monitoring data between the 51st and the 99th day. The long-term absence of data will affect the processing of data details.
2.4. Data Preprocessing
The ELM [
21,
22] is a single layer feedback neural network learning method proposed by Huang et al. Its main characteristic is that it is adaptive to non-linear structure and imprecise rules and can optimize calculation through independent learning. The optimal solution can be generated by setting a reasonable number of hidden layer nodes before training and assigning appropriate values to input weights and hidden layer bias during execution. Furthermore, the ELM is also used as a classifier in many fields, including image processing, signal processing and data classification and prediction.
The entire process of processing the monitoring data is shown in
Figure 7. Due to the uneven distribution and missing of monitoring data, it is impossible to directly calculate and predict the data. Firstly, the monitoring data is preprocessed (for example normalization). Secondly, only the normalized data can be used to extract for time characteristics, including hours (accurate to seconds), dates, months and years. Finally, the time characteristics was trained as the input of ELM, a temperature prediction model based on time characteristics is built to achieve temperature prediction by the ELM.
5. Conclusions
In this paper, based on the actual problems of environmental monitoring data of the outer burial pits of the Han Dynasty Yang Mausoleum, the ELM is used to establish a temperature prediction model based on the lunar calendar to predict the temperature of the site. It is verified by experiments that the lunar calendar model is more accurate than the solar calendar model in predicting temperature. Moreover, the model can better express the temperature characteristics. The lunar calendar model of this paper also has a good extensibility. Moreover, the accuracy of lunar model can be effectively improved by properly improving the weight of lunar model. The model can be used not only to predict temperature, but also can be extended to predict other environmental data such as precipitation, humidity, soil temperature, and dew point temperature. Furthermore, the study of temperature prediction in this paper is not limited to providing guidance for site protection, but also can be applied to the field of weather forecast and environmental forecast, etc.

 ,
, 


