Article

Phase Transitions in Wireless MESH Networks and Their Application in Early Detection of Network Coherence Loss

by
Andrzej Paszkiewicz
*,
Marek Bolanowski
and
Przemysław Zapała
Department of Complex Systems, The Faculty of Electrical and Computer Engineering, Rzeszow University of Technology, 35-959 Rzeszów, Poland
*
Author to whom correspondence should be addressed.
Appl. Sci. 2019, 9(24), 5508; https://doi.org/10.3390/app9245508
Submission received: 14 October 2019 / Revised: 6 December 2019 / Accepted: 11 December 2019 / Published: 14 December 2019
(This article belongs to the Section Applied Physics General)

Abstract

:

Featured Application

The results of the work may find a potential application in creating effective wireless communication environments with high probability connections; for example, for IoT.

Abstract

The paper focuses on the phenomenon of phase transitions related to changes taking place directly in a network structure; i.e., in physical topology. Although these changes are related to the physical layer, they directly affect the functioning of higher layers, and thus the quality and efficiency of network transmission. The research presented herein was focused in particular on phase transformations in MESH type wireless topologies. The dependence between the values of radius (transmitter power) nodes and the coherence of the MESH network is presented. These considerations are important for understanding the dynamics of processes occurring in topological structures, and for optimizing the use of power sources for individual nodes. The paper also presents the use of phase transition analysis for early detection of network coherence loss at the physical layer level. A new mechanism for assessing the level of network communication and an active method of preventing its failure using the arbiter and a set of limited diagnostic information are described. The solution presented can be used both in Internet of Things (IoT) systems and Industry 4.0 to create a high level of reliability wireless connection infrastructure between mobile and fixed devices.

1. Introduction

Phase transitions occur in many areas of the world around us [1,2,3,4,5]. This applies to both phenomena occurring in natural systems, and in artificial (man-made) ones. Usually, the phase change is caused by a rapid and significant change in the values of the parameters of a given system or object. It obviously changes the properties of a given system. Such phenomena are well known and described. They mostly regard studies in the field of physics, electronics specifically, but also social and economic relations [6,7,8,9,10,11]. Thermodynamic processes are the most well-known and commonly observed phase changes, among which there are the changes in the state of water into ice or steam [12]. Phenomena related to phase transitions also occur in computer networks and systems [13,14,15]. They are connected, e.g., with routing processes, data flow processes, and queuing, but also changes in the structure of physical and logical topology. This paper primary concerns the changes in physical topology in computer networks, which especially in the case of wireless networks, may take the form of sudden and unpredictable changes. The authors based their study on one of the forms of wireless networks; namely, MESH networks [16,17]. These networks are particularly widely used in Internet of Things (IoT) type infrastructure; i.e., to ensure connectivity of sensor systems or communication in computer networks of the ad hoc type [18,19,20,21]. They can be used both in general access networks (networks in parks, on the streets, the natural environment, etc.), industrial networks (for Industry 4.0; e.g., connections of production devices and communication in a distributed sensor system), and in a home environment (e.g., smart home solutions). These types of networks allow the creation of both mobile and fixed structures of wireless communication networks that enable both work in the stable work phase and adaptation to changing conditions in the unstable work phase. Adaptive routing mechanisms that adapt to the current situation in the network infrastructure are usually responsible for this [22,23,24,25]. The scope of this paper does not take into account the aspects of routing and Quality of Service (QoS) mechanisms implemented in higher layers. The aim of the study was to consider the phenomenon of phase transition in the context of ensuring the consistency of the MESH network and to use it for early detection and prediction of failures.
From the point of view of the operation of MESH wireless networks, the reliability of the elements forming it is particularly important. The unreliability of this class of solutions is primarily associated with the model of battery power supply of elements, and frequently, their unprotected location. Compared to classic wired or wireless networks, the Mean Time To Failure (MTTF) time for MESH nodes is significantly shorter [26]. The reliability analysis of this class of solutions was presented in papers [27,28]. Therefore, in the case of MESH wireless networks it is important to pay special attention to issues related to failure tolerance, since these solutions are used in production networks and support the functioning of critical infrastructure systems. At present, mechanisms related to ensuring business continuity of the MESH network are based on mechanisms of quick failure identification and fault tolerance at the level of communication protocols.
In [29], a simple multicast ping mechanism for detecting damaged nodes in the ZigBee network is presented. In [30], failure detection in the mesh network was based on the use of artificial neural network. A previously trained neural network analyzes parameters, such as number of dropped packets, delay, and throughput reduction, and detects a failure based on them. A similar approach for optical networks is described in [31]. The implementation of these solutions in a real network would, unfortunately, be difficult due to the need for ongoing monitoring of all inter-node communication, which in consequence introduces large communication overheads. In [32], the authors analyzed the possibility of using “hello messages” to quickly detect failure in a mesh network. The paper [33] proposed how to accelerate the failure detection in MESH network nodes using data-mining-based link failure detection and using the MAC layer to predict connection failures. The literature also includes the use of a number of other mechanisms for detecting MESH network damage, such as Cooperative Watchdog [34], Software Defined Networks (SDN) [35], and the use of redundant elements [28].
Frequent exchange of control messages between nodes may be required for routing protocols that support fault tolerance to identify current network topology. Mechanisms known from wired networks (e.g., Bidirectional Forwarding Detection) can also be used in conjunction with the alternative routes table for each topology node. In the case of using tolerance and fault detection mechanisms at the level of routing protocols after damage detection or during the diagnostic process, increased communication of the MESH network nodes with the network supervision node occurs, which may adversely affect the time of failure removal and network load [35,36,37].
Formal methods applied to diagnose failures in wired mesh networks in the case of supercomputers and on Networks on Chip (NoCs) networks can be adapted for early detection or estimation of the probability of failure [38,39]. However, direct application of the results is difficult due to the inability to take into account the current, variable state of the network in the proposed model.
The solutions regarding MESH connection network failure described in the literature are associated with a reactive approach based on the early detection of a failure to a node or a communication channel. In the cases analyzed, the prediction of network failure is usually based on the use of artificial intelligence methods or data mining techniques to analyze sets of a wide spectrum of network operational parameters, and the traffic that is transmitted through them. There are no solutions that, based on limited information, are able to predict network failures without having to analyze all traffic parameters. The methods presented above are based on mechanisms specific to layers 2 and 3 of the ISO/OSI model. This paper proposes a method of prediction of a failure in the physical layer (topology) of the MESH network using a phase transition model with an arbiter and a set of limited diagnostic information. We concentrated on the relationship between the change in the strength of wireless transmitters (which has a direct impact on their range) and the consistency of physical topology. Thanks to this analysis, the phase changes that accompany them may be presented. The conducted simulations were carried out for random topological structures using a variable power of transmitters. The results of these simulations give a completely new look at the issue of phase transitions in computer networks and provide the basis for further research.

2. Wireless MESH Networks

The rapid development of mobile services and the significant increase in the number of mobile devices makes it necessary to provide more and more novel solutions in terms of reliability and performance of wireless network structures. MESH networks are one of the types of these structures [16,40]. These networks constitute a wireless communication infrastructure between distributed network nodes. These nodes can be installed wherever power infrastructure is provided. These structures are frequently used in ad hoc type solutions, which are perceived as cheap and energy-saving nodes. As technology advances, they are becoming more and more miniaturized and efficient. The essence of this type of network is to provide direct, non-hierarchical communication between as many nodes as possible. Therefore, the main idea of MESH wireless networks is based on the appropriate physical topology, as various techniques can be used in the area of logical topology—switching, routing, load balancing, etc.
Thanks to the implementation of this type of network, it is possible to set up a connection without the need to use a wired network, which enables a significant increase in network coverage. The density of nodes has a direct impact on the number of connections between them, the effect of which is an increase in reliability and distribution of load in the network. Such a solution may be particularly important in areas where it is difficult to build a wired network infrastructure; e.g., forested and mountainous terrain; environments that are temporary in nature, such as at occasional events, including concerts and sports competitions; but also in parks, buildings, and many other places.
The infrastructure of MESH wireless networks is based on the classical grid topology (Figure 1). Obviously, it is not always possible to provide a physical infrastructure on the basis of a full mesh, because then a combination of n(n−1)/2 connections is necessary, where n is the number of nodes. On the one hand, this solution can be expensive, but on the other hand it is impossible to implement; e.g., due to technological limitations such as the range of radio connections. In this case partial mesh solutions are used; they are intended to ensure the cohesion of the network in the first step, and in the second step enable possible redundancy of connections.
Figure 2 presents an example of the implementation of a wireless MESH network based on, e.g., the 802.11s standard [41,42]. Thanks to the use of such a solution, it is possible to combine effective wireless communication between the wireless nodes, which are intermediate points (e.g., access points) and end devices connected to it.
MESH technologies are used to create fast and redundant wireless infrastructure. Implementing them in wireless networks extends their functionality and contributes to the increase of their performance; thus, becoming a more effective transmission medium for various convergent network types as well, ensuring stable transmission of video, audio, control data, etc. In addition, their advantage in relation to traditional wireless networks is their increased resistance to failures, and the use of an appropriate number of devices allows one to balance their load by selecting the optimal routes.

3. Phase Transitions in the Structure of a Wireless Network

Before implementing the analysis of phase transformations in topological structures, one should present a definition of a phase; i.e., a uniform part of the physical system, separated from others by interphases, called phase boundaries, on which a step change of physical or chemical properties takes place [43,44]. Taking into account the structure of physical topology in wireless networks, the phase transition border shown in Figure 3 also indicates that even a small reduction in the transmitter’s range (exceeding this limit to the left) may cause major changes in the structure of network connections. In an extremely critical situation, as even a slight crossing of this limit may result in a loss of cohesion, and hence the breakdown of communication connections. However, in many cases, this limit is the beginning of the so-called interfacial area; i.e., the area in which the probability of a connection between neighboring nodes decreases (below the value of 1). It should be remembered that change in the value of such parameters as transmission range, number of nodes, and their location, does not necessarily result in a change in the probability value of ensuring network connectivity (which will be demonstrated later in the work). In this case, despite maintaining the connection, there may be significant degradation of the connection quality, which is associated with the loss of packets, large delays, etc.
The interphase dissociates the stable operation phase of the wireless network from unstable operation. From the perspective presented above, a phase transition of a structural nature is considered. Therefore, no changes such as routing or providing flows are analyzed for logical relations. Taking this into account, the interfacial area is characterized by the fact that coherence is still maintained, with the probability of connections between each pair of any nodes being less than 1.
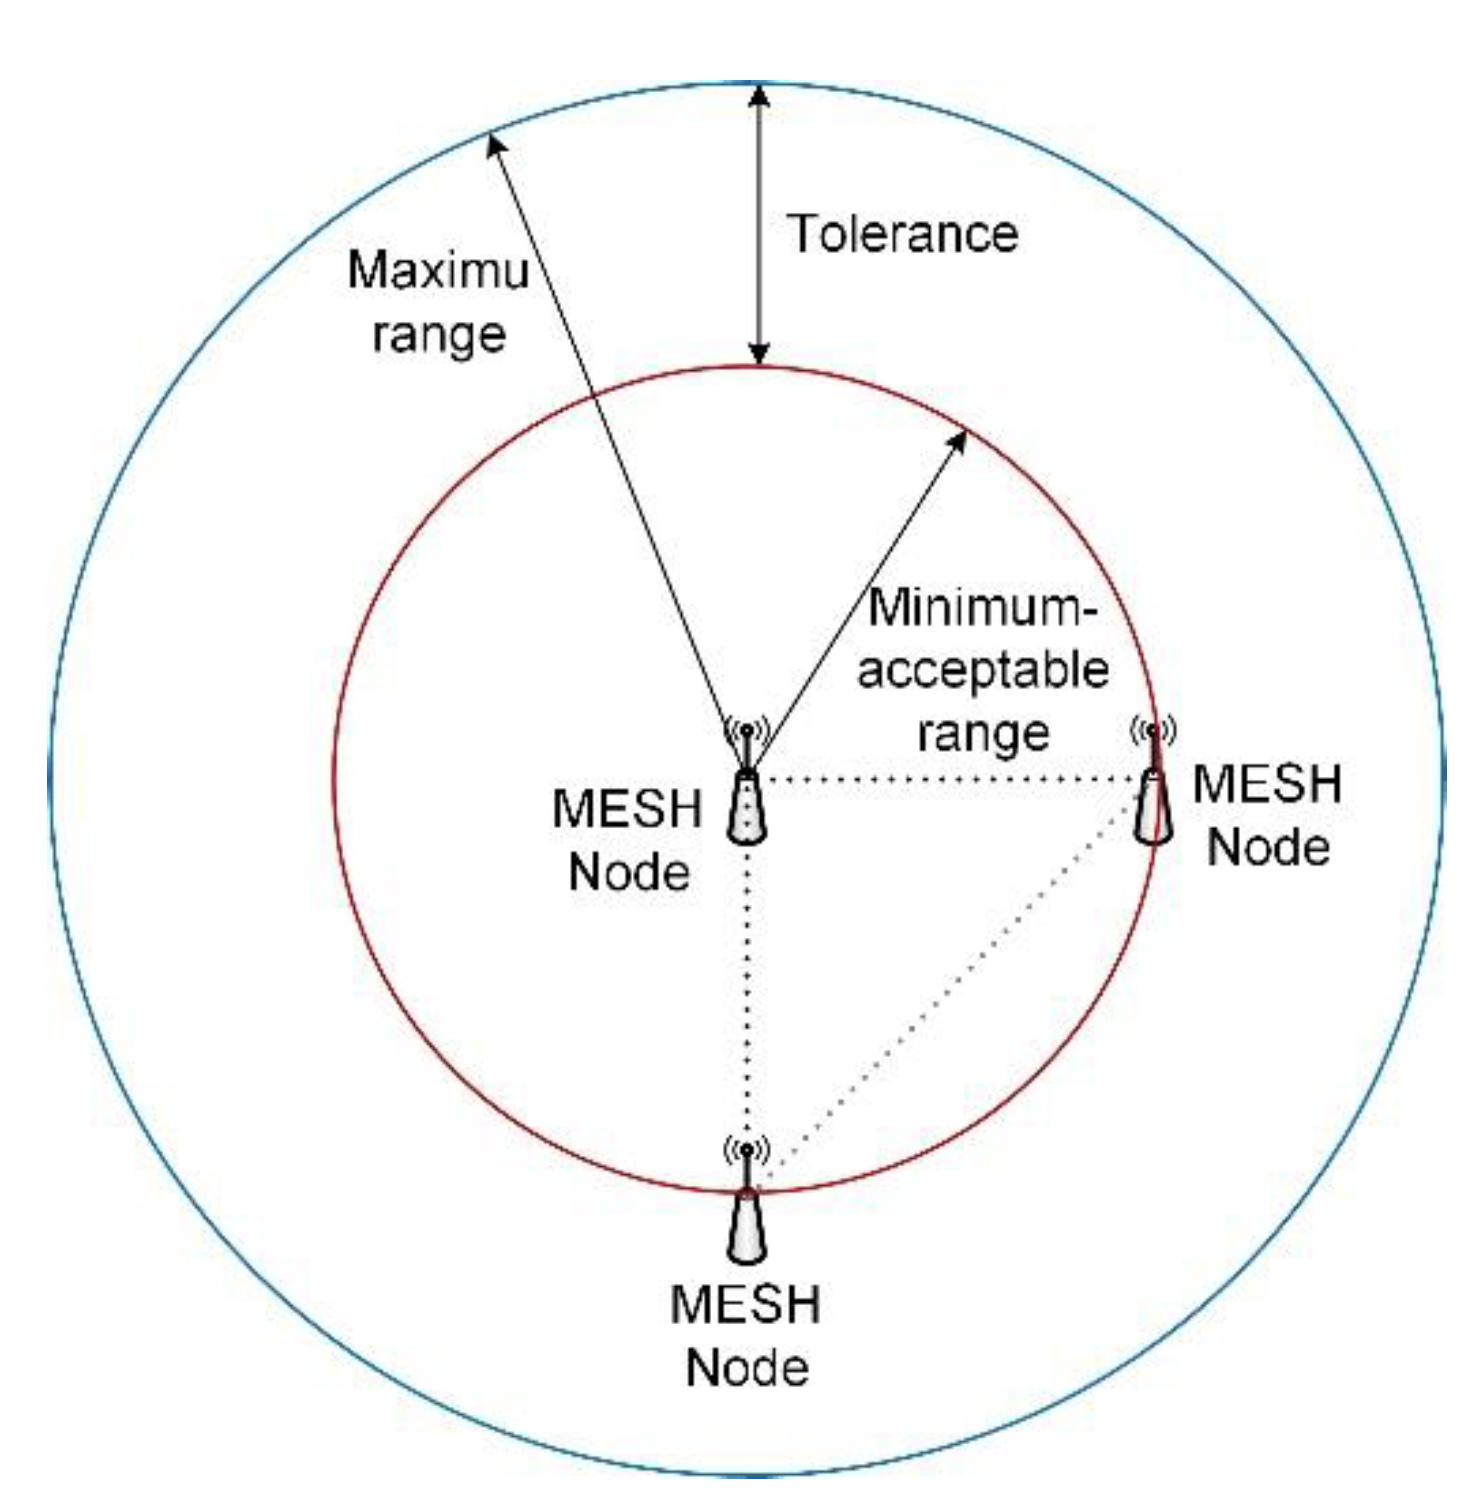
Figure 4 presents an exemplary fragment of the MESH network structure taking into account the maximum and minimum-acceptable power of nodes. The difference between the two powers creates a tolerance factor that provides connections to all nodes in the network. Thus, tolerance directly affects the costs associated with the power of transmitters used to make the necessary connections.

4. Analysis of Phase Transitions in the MESH Network

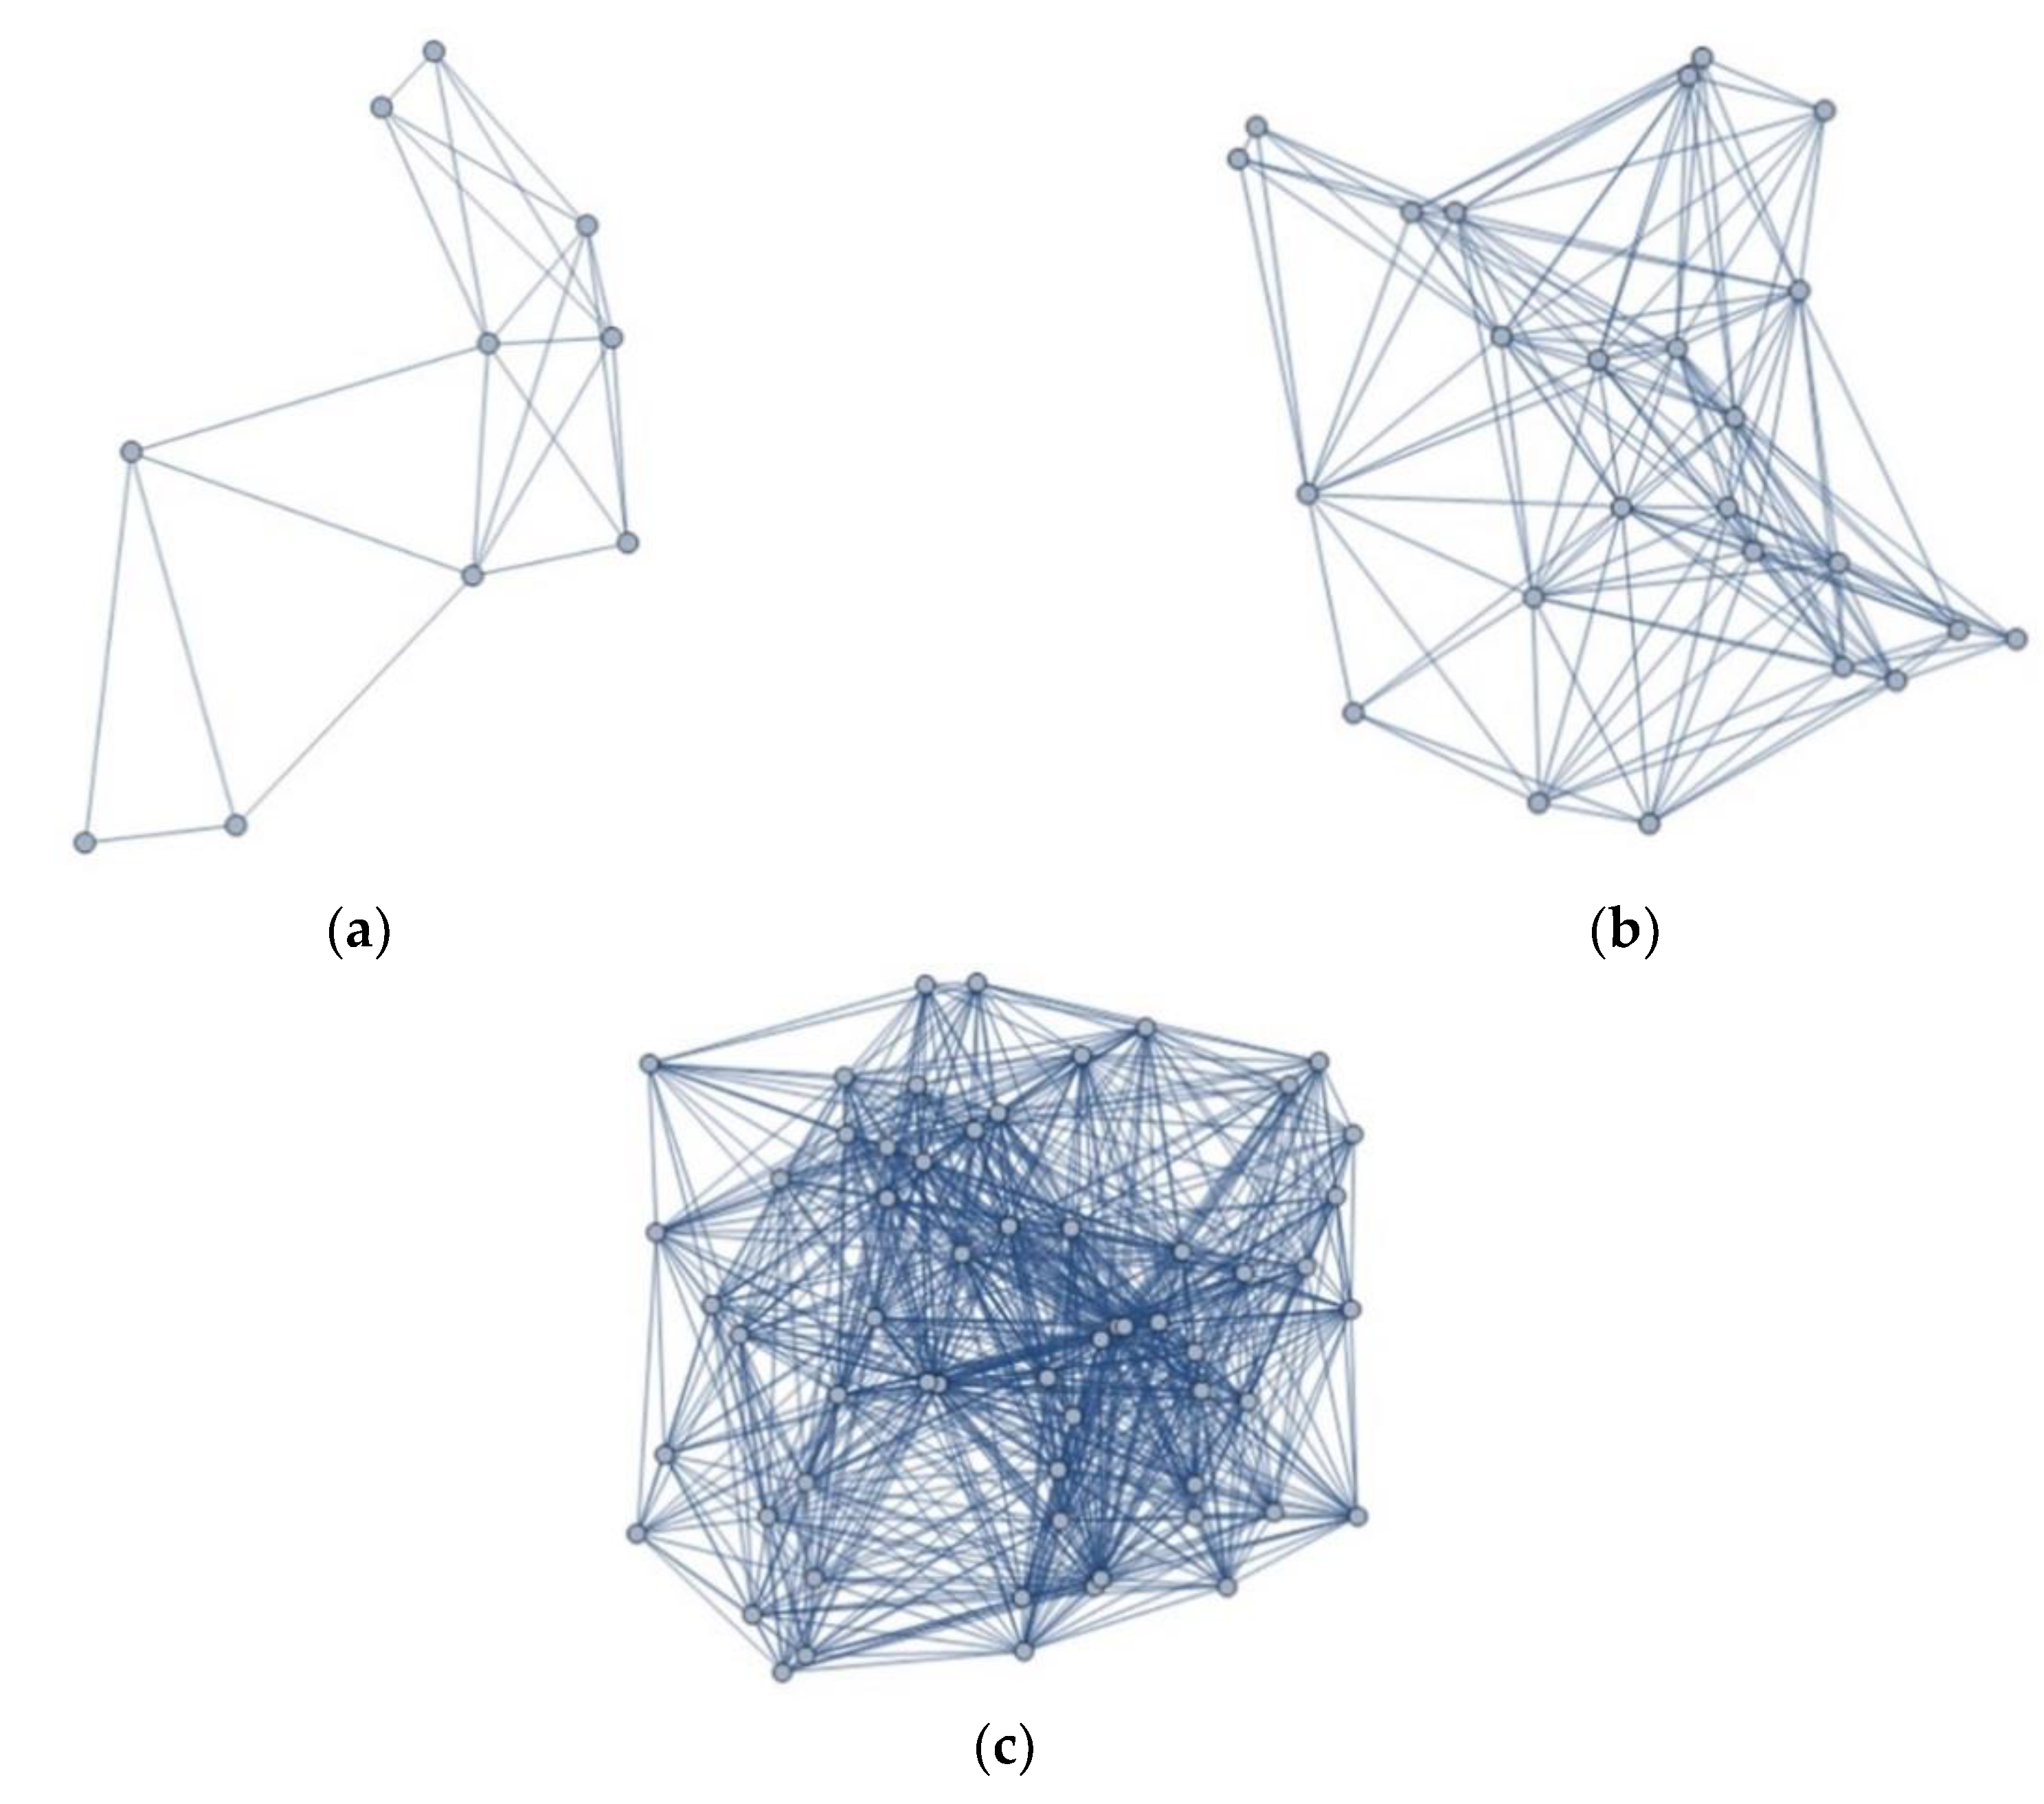
The simulations we conducted were based on randomly generated topologies of wireless networks. Thus, the random distribution of nodes determined the necessary power of the transmitters in order to ensure a proper set of connections. Taking into account the development of technology, antennas, protocols, and communication standards during the simulation, a general assumption was made in which the radius of a given node means r 0 ; 1 , where the value 1 means the guarantee of connection of each node with each in the infrastructure. Thus, this case corresponds to the topology, which is characterized by a high rate of connection redundancy (full mesh). The sample mesh topologies for different numbers of nodes and r = 0.5 are presented in Figure 5. It should be noted that the number of nodes randomly distributed in a given area affects the distances between them; therefore, it will affect the process of the phase transition.
The simulations carried out indicate that as the radius value decreases, the number of available connections decreases. In addition, with a smaller number of nodes, there is a higher probability that the number of available connections will be significantly reduced with a relatively small change in the radius value. This dependence is shown in Figure 6 (for the purposes of the paper, this chart will be referred to as PTC; phase transition chart), which shows the relationship between the probability of connection and the radius value. These charts confirm previous observations. Thus, a smaller number of nodes causes a faster phase change (see Figure 6a), while the interface is much wider. However, in the case of a large number of nodes, e.g., 60 (see Figure 6d), the probability of providing connections (p = 1) is much larger and the interphase is relatively narrow. Thus, the dynamics of the phase change process in the interfacial area is much larger, and a small change in the transmitter’s power allows the meaning to reach the stability/consistency of the topology faster.
Figure 7 presents selected simulation stages in which for a selected number of nodes, n = 25, the radius value was gradually reduced from 1 to 0.1. For a radius value of approximately 0.4, the interfacial area begins, which lasts up to approximately 0.2. At the same time, we obtain an incoherent structure at 0.2, so we are in the unstable phase from the perspective of the network structure.
As a result of the tests, it can be clearly stated that in the case of phase transition in the structure of the MESH wireless network, the interfacial area indicated in Figure 3 has no fixed size, and thus, for different distribution of nodes, may be larger or smaller. This is important for maintaining the stability of the network structure and for providing higher layer services. In the interfacial area, optimal parameters can be found to achieve, e.g., high energy savings, but it can also include parameters that will allow high redundancy of connections and devices.

5. Application

One of the basic areas of active management of a distributed computer system is the ongoing analysis of the consistency of communication network. It is particularly important from the perspective of dynamic structures based on radio communication for Industry 4.0 and IoT systems. One of the main pillars for the development of production lines designed in the spirit of industry 4.0 is the use of in-depth sensory diagnostics. For economic reasons, it is not possible to replace existing manufacturing components (machines) with new ones equipped with the desired sensors. One of the proposed solutions is the use of additional sensors placed on crucial elements of the machines that transfer data to the control system, anomaly detection, etc. Such a solution was proposed, e.g., in the paper [45], where the authors present the use of high-sensitivity LiNbO3 vibration sensors for robotic arm monitoring. The MESH network was built to create a communication layer for the sensors. The possibilities of using MESH networks to connect IoT elements are obviously much wider and their use is practically unlimited, especially for data collection networks. Some of the industrially-used solutions use battery-powered MESH infrastructure elements. Their lifetime is limited, but a failure of one of the network elements does not cause its inconsistency. The node coherence of such networks is usually many times higher than 2. In order to manage such networks properly, it is necessary to develop a method for estimating the current network integrity. Of course, measures such as graph coherence or connectivity (understood as the ratio of the edges available in the topology being analyzed to the number of edges in the corresponding complete graph) can be used. However, their use does not determine the probability of loss of consistency in a holistic approach, but is rather used to determine whether the network is working or not. To assess the current ability to provide network communication, the authors proposed architecture and an algorithm based on the phase transition analysis discussed earlier. The system architecture is presented in Figure 8.
The key element of the system is the arbiter; i.e., the application that collects and controls the state of the MESH N1 network on an ongoing basis using three types of messages:
  • Actual node radius—in this message the nodes in the network transmit the current value of the transmitter power which is then transformed to the form of r 0 ; 1 .
  • Keep alive—is information periodically sent to the arbiter by each network node, informing it about its proper functioning, similar to the mechanisms used in classic routing protocols. The node may initiate sending information periodically or create a response to a message sent by the arbiter. It depends on the specificity of the network and the protocols used. In case this message is not received, the arbiter acknowledges that the node is unreachable and a response from technical staff is required. It is possible to define a threshold value for the number of unreceived messages, which allows us to conclude that a given node is permanently unavailable.
  • Position—this message provides information about the current position of the node (its location). The message is important for networks with mobile elements and should be treated as options. For static networks, the location of static nodes can be implemented at the network construction stage and remembered by the arbiter.
Based on this data, the arbiter creates a virtual network model referred to as VN1 in the Figure 8. The model created in this way is passed for further analysis to the algorithm (blue blocks in Figure 8). Apart from VN1, the input data are: pt—the borderline value of probability of providing connections p acceptable to the business owner of the network; t—time (time step) defining how often the network status control procedure is run. In order to save energy consumption of individual nodes, the three types of messages described above can be sent as one collective message. At this stage, the key is the proper selection of the t parameter, which is responsible for the frequency of sending these messages. This translates into energy consumption by the node. Therefore, the value of this parameter may depend on the assumed level of network reliability, service level agreement, and the current node’s battery level. In the next step, the PTC chart is determined for a given topology. On this basis, the current point at which the network is located in terms of phase transition and acceptable risk is determined. Figure 9 illustrates this process.
At the moment t1 (Figure 9a), the operating parameters of the system (available number of nodes, their location, and range of transmission) ensure the possibility of maintaining full coherence in the network; i.e., making connections with probability of p = 1. Let us assume that the power of transmitters is reduced as a result of system operation due to the depleted node batteries. As a result, the probability is p = 0.8 at t2. In this case, the system generates a warning message to the network management system (NMS) system, informing it about deteriorating network reliability. If the power of the transmitters decreases further at the time of t3, the system sends a message about the critical state of the network and the need to take immediate action (e.g., the need to replace the battery). It should be noted that the arbiter is connected both to the MESH network structure using a wireless network and uses a reliable connection (GSM, cable connection, etc.) to the network management system (NMS). The question of how to replace the battery can be implemented in many ways, e.g., by technical staff. A separate issue, discussed later in this article, is how to set the parameter value pt. The second case is considered here (Figure 9b). Compared to the first case, the number of available network nodes dropped as a result of failure directly affecting the shape of the PTC curve. The way the curve shape changes for the interfacial area depending on the number of nodes is presented for sample networks in Figure 6. To maintain consistency, nodes must increase the transmission range. As a result of these events, the network becomes very sensitive to power drops (a very small “green” area on the PTC chart) of transmitters and requires relatively much energy for proper operation. In such a situation, the arbiter quickly reports warning (t4) messages and corrective action will be required. The probability limit pt can be determined experimentally during system operation. Correct timing is crucial because of the system operation costs. During the interviews with a group of entrepreneurs, the following aspects were identified related to the correct selection of time:
  • Huge and constantly growing costs of maintaining own IT department responsible for maintaining the company’s IT systems, including the considered network system [46]. In order to reduce operation costs, companies use outsourcing of ICT services. Generally, the costs of such a service include: cost of maintaining engineers’ readiness (fixed monthly fee), cost of response time (fixed monthly fee), cost of work performed on site (variable man-hour charge), maintenance of spare parts warehouse (fixed fee monthly). If the company operates a critical communication system, it strives to ensure that the response time is as short as possible (maximum 4 h), and that the outsourcing company maintains all types of spare parts. In this case, the value pt should be close to 1 (e.g., 0.9). Early failure prediction, based on the proposed algorithm, will extend the response time and eliminate the need to maintain full hot stock of spare parts. This will significantly reduce the fixed operating costs of the system.
  • Some companies base operations on a risk management model. In this case, the model analysis enables precise determination of the value pt, which in turn allows achieving the level of risk acceptable for the entire system (direct connection of the value pt with the residual risks).
In both cases presented in Figure 9, for a considered MESH network, recovery from critical state t3t2 and t6t5 could be achieved by placing additional nodes in the communication system. In the first case, this would improve the connection parameters of the system at a lower radius r, and in the second case, this would reduce the power of transmitters and extend their operating time. The optimal location to place the transmitter can be determined on the basis of a simulation based on the VN1 network model. After determining the location, the previously prepared transmitter (provisioning) can be set in a given location by unqualified technical staff.
Figure 10 shows the response areas used by the arbiter for the exemplary situations shown in Figure 7. The warning area starts when the radius value falls below r = 0.51 (and p < 1). If the pt parameter value falls below 0.5 (r < 0,3), the network may lose coherence in the case of a small change in several parameters. Below the radius value of 0.28, an adverse change in any parameter will result in the loss of integrity of the entire network.
During the simulation, many tests were carried out for various MESH network structures with different numbers of nodes and different radius values. Figure 11 and Figure 12 present select results from these simulations. In these two cases, variants of the MESH network topology with 100, 150, 250, and for a broader analysis, 1000 nodes, were taken into account. The choice of a larger number of nodes resulted from the need to compare potential results with those previously obtained for a smaller number of nodes (Figure 6 and Figure 7). The simulations carried out in these cases included two radius values r = 0.1 (Figure 11) and r = 0.4 (Figure 12). As can be seen in particular in Figure 12, an increase in radius value would not be significant at a high saturation of a given area with nodes, since the stable operation phase associated with a 100% probability of ensuring network connectivity remains unchanged in the range from about 0.2 to 1.0. Therefore, the previous statement is confirmed that the number of nodes directly affects the phase transformation process. Therefore, the interfacial area is much narrower (Figure 11 and Figure 12b,d,f,h) and the slope of the graph is much steeper, so the warning and critical areas are much smaller, which forces a quick response from the NMS. Presenting a greater number of cases, e.g., 300, 500, or 750, or over 1000 nodes, will not bring anything new, as the results obtained are similar to those presented in Figure 11 and Figure 12. Analyzing the results obtained in these graphs, it can be observed that the rapid reduction in radius when the system is in the interphase can cause immediate network inconsistency. Therefore, comparing Figure 6, Figure 7, Figure 11 and Figure 12, it can be stated that in the case of a small number of nodes, the stable operation phase is shorter, which is associated with higher energy consumption, while in the case of a large number of nodes, the radius value can be significantly reduced, but then infrastructure is much more sensitive to changes in the value of transmitter’s power.
Analyzing the results obtained from the point of view of fault tolerance, the situation is then the opposite; i.e., in the case of Figure 11 and Figure 12, despite the narrow interfacial area, it is characterized by high resistance to the potential for failure of individual nodes. On the other hand, in the case of Figure 6 and Figure 7, the wide interfacial area does not guarantee consistency when the number of active nodes is reduced. Additionally, one can imagine a situation in which the interfacial area could be very narrow and almost tangential to the vertical axis; i.e., the value near r = 0. Such a situation is not economical, as it requires the use of a huge number of nodes. However, comparing Figure 6b, Figure 11b and Figure 12b, it can be stated that by oscillating radius values in the range from 0.2 to 0.6, network coherence can be achieved by using a much smaller number of nodes. Therefore, by increasing the radius value, we are also broadening the interfacial area, and thus the critical and warning areas are much wider. For example: the diagrams related to the interfacial area from Figure 11a and Figure 12a are very similar to each other, but in the case of the topology corresponding to Figure 11a there is a loss of network consistency which results directly from a small radius value r = 0.1 (in the case of topology from Figure 12a r = 0.4). For the example under consideration, it is important to determine the appropriate probability value pt, which will define the demarcation lines between the critical and warning areas. Of course, as it was previously described in this paper, this value can be iteratively determined during the system’s operation; however, it should be noted that the value of pt determined for the network from Figure 12a will be much higher than the value of pt for the network from Figure 12b.
The network management system (NMS) plays a key role in responding to a failure in the proposed architecture. In short, it is a central IT system (most often an application) for IT system management including a computer network. Recently, the paradigm of NMS systems has changed and has evolved towards SDN networks [47] dedicated to automatic network management. In the research we conducted, two mechanisms of NMS system response to critical or warning messages reported by the arbiter were considered. In the first reactive approach, NMS system informs technical staff about the need to take action. In the second case, first NMS system automatically takes independent actions to repair the network. Figure 13 proposes the architecture of the MESH system with inactive transmitters marked in red. For a given type of messages, the NSM system can activate all or select transmitters to improve connection conditions of the entire system.
The application of test results presented in this chapter is one of many possible scenarios. The research conducted by the team is closely related to industrial applications, Industry 4.0, and IoT systems, which is why this class of systems has been chosen to present the possibilities of using research related to phase transition analysis in wireless networks built in MESH topology.
Existing work in the literature does not deal efficiently to resolve the issue of early detection of network coherence, especially for wireless MESH networks. Table 1 presents a comparison of methods that are used in the process of failure detection in computer networks and their prediction. Particularly noteworthy are methods based on machine learning and based on data mining techniques. They can be used for short-term prediction of network failures. In the case of the methods described in [31,48], their proper functioning requires the maximally extended logging of traffic and activity of network nodes. This approach in the MESH networks considered in the article due to the assumed battery power supply would significantly reduce the network lifetime and significantly reduce the value of the available transmission band for the relevant data (other than diagnostic and control packages). In the case of the method in [49], it is necessary to implement functionality for each node in the application layer that would allow detection of network failures. In the case of the MESH networks discussed, that is unacceptable due to limited computational performance of network nodes and assumed battery-power supply. The approach proposed in the article compared to existing methods requires fewer diagnostic data (sent from network nodes to the arbiter) and allows for conducting computationally complex analyses outside the MESH transmission network infrastructure. Thanks to this, the proposed solution works well for wireless MESH networks.

6. Conclusions

Phase transitions occur in various environments, both natural and artificial. The study of them can contribute to understanding the dynamics of changes taking place in complex systems, such as computer systems and networks. Therefore, this paper analyzed the relationship between the connection structure at the physical layer in wireless MESH networks and the power of the transmitter. As a result of the simulations conducted, a clear interfacial area was observed, in which the topological coherence still occurs with a changing probability of connections smaller than 1.
The results obtained should contribute to a greater understanding of the phase change phenomenon occurring in IT networks, and allow designers of this type of infrastructure to create effective communication environments with high probabilities of connections while taking into account the optimization of transmission resources. The effective energy management, which is directly related to the power of individual transmitters, is also of great importance here. This issue is of particular importance when using MESH network nodes that do not have a constant source of power, and are based, e.g., on solar charged batteries. The paper also proposes a new approach for early warning of loss of MESH network consistency based on the results obtained in the first part of the paper. Its application enables the prediction of critical failures of communication systems, e.g., in industrial systems and sensor networks.
In future studies, we plan to study phase transitions related to topological structures in wired networks, and processes related to network traffic flow, phase transitions in logical network structures—routing, load balancing, etc.—and phase transitions occurring in queuing systems.

Author Contributions

A.P., M.B., and P.Z. researched the literature; A.P. and M.B. formulated the problems and constructed the research framework, A.P. conceived the methodologies and designed the experiments; A.P., P.Z. performed the simulations; A.P. and M.B. investigated and developed the application of results in a real production environment; A.P., M.B., and P.Z. contributed to the writing of this paper. All authors have read and agreed to the published version of the manuscript.

Funding

This project was financed by the Minister of Science and Higher Education of the Republic of Poland within the “Regional Initiative of Excellence” program for years 2019–2022. Project number 027/RID/2018/19: amount granted 11,999,900 PLN.

Conflicts of Interest

The authors declare no conflict of interest. The funders had no role in the design of the study; in the collection, analyses, or interpretation of data; in the writing of the manuscript, or in the decision to publish the results.

References

  1. Buchanan, M. Biological transitions. Nat. Phys. 2019, 15. [Google Scholar] [CrossRef]
  2. Torres, J.J.; Marro, J. Brain Performance versus Phase Transitions. Sci. Rep. 2015, 5. [Google Scholar] [CrossRef] [Green Version]
  3. Perc, M. Phase transitions in models of human cooperation. Phys. Lett. A 2016, 380, 2803–2808. [Google Scholar] [CrossRef]
  4. Stanley, H.E. Introduction to Phase Transitions and Critical Phenomena; Oxford University Press: New York, NY, USA, 1989. [Google Scholar]
  5. Papon, P.; Leblond, J.; Meijer, P.H.E. The Physics of Phase Transition: Concepts and Applications; Springer: Berlin, Germany, 2002. [Google Scholar]
  6. Oprisan, A.; Garrabos, Y.; Lecoutre, C.; Beysens, D. Pattern Evolution during Double Liquid-Vapor Phase Transitions under Weightlessness. Molecules 2017, 22, 947. [Google Scholar] [CrossRef] [PubMed] [Green Version]
  7. Wang, B.; Han, Y.; Chen, L.; Aihara, K. Multiple Phase Transitions in the Culture Dissemination. Complex Sci. 2009, 4, 286–290. [Google Scholar]
  8. Novotny, J.; Lavička, H. Non-equilibrium Phase Transitions of Economic Systems under Exogenous Structural Shocks. Phys. Rev. B 2014. [Google Scholar] [CrossRef]
  9. Wiltshire, T.J.; Butner, J.E.; Fiore, S.M. Problem-Solving Phase Transitions during Team Collaboration. Cogn. Sci. A Multidiscip. J. 2018, 42, 129–167. [Google Scholar] [CrossRef] [PubMed] [Green Version]
  10. Huberman, B.A. Social Computing and the Attention Economy. J. Stat. Phys. 2013, 151, 329–339. [Google Scholar] [CrossRef]
  11. Fronczak, P.; Fronczak, A.; Hołyst, J.A. Phase transitions in social networks. Eur. Phys. J. B 2007, 59, 133–139. [Google Scholar] [CrossRef]
  12. Okamoto, H.; Schlesinger, M.E.; Mueller, E.M. ASM International Volume 3. Alloy Phase. Available online: https://www.asminternational.org/documents/10192/1849770/05442G_TOC.pdf/ecbf0e0e-cbe5-4d00-a82e-edc48bc156a4. (accessed on 14 October 2019).
  13. Bondareva, A.; Levchenko, T.; Zmievskaya, G.I. Computer Simulation Model for First-Order Phase Transition Fluctuation Stage. Defect Diffus. Forum 2010, 297, 502–507. [Google Scholar] [CrossRef]
  14. Seoane, L.F.; Solé, R. Phase transitions in Pareto optimal complex networks. Phys. Rev. E 2015, 92. [Google Scholar] [CrossRef] [PubMed] [Green Version]
  15. Moore, C. The Computer Science and Physics of Community Detection: Landscapes, Phase Transitions, and Hardness. Available online: https://arxiv.org/pdf/1702.00467.pdf (accessed on 14 October 2019).
  16. Misra, S.; Misra, S.C.; Zhang, I. Guide to Wireless Mesh Networks; Springer: London, UK, 2009. [Google Scholar]
  17. Darroudi, S.M.; Gomez, C. Bluetooth Low Energy Mesh Networks: A Survey. Sensors 2017, 17, 1467. [Google Scholar] [CrossRef] [PubMed] [Green Version]
  18. Cilfone, A.; Davoli, L.; Belli, L.; Ferrari, G. Wireless Mesh Networking: An IoT-Oriented Perspective Survey on Relevant Technologies. Future Internet 2019, 11, 99. [Google Scholar] [CrossRef] [Green Version]
  19. Hortelano, D.; Olivares, T.; Ruiz, M.C.; Garrido-Hidalgo, C.; López, L. From Sensor Networks to Internet of Things. Bluetooth Low Energy, a Standard for This Evolution. Sensors 2017, 17, 372. [Google Scholar] [CrossRef] [Green Version]
  20. Pau, G.; Chaudet, C.; Zhao, D.; Collotta, M. Next Generation Wireless Technologies for Internet of Things. Sensors 2018, 18, 221. [Google Scholar] [CrossRef] [PubMed] [Green Version]
  21. Di Pascale, E.; Macaluso, I.; Nag, A.; Kelly, M.; Doyle, L. The Network as a Computer: A Framework for Distributed Computing Over IoT Mesh Networks. IEEE Internet Things J. 2018, 5, 2107–2119. [Google Scholar] [CrossRef]
  22. Sharma, S.; Kumar, S.; Singh, B. Routing in Wireless Mesh Networks: Three New Nature Inspired Approaches. Wirel. Pers. Commun. 2015, 83, 3157–3179. [Google Scholar] [CrossRef]
  23. Tsado, Y.; Gamage, K.A.A.; Adebisi, B.; Lund, D.; Rabie, K.M.; Ikpehai, A. Improving the Reliability of Optimised Link State Routing in a Smart Grid Neighbour Area Network based Wireless Mesh Network Using Multiple Metrics. Energies 2017, 10, 287. [Google Scholar] [CrossRef] [Green Version]
  24. Chai, Y.; Zeng, X.-J. Regional condition-aware hybrid routing protocol for hybrid wireless mesh network. Comput. Netw. 2019, 148, 120–128. [Google Scholar] [CrossRef] [Green Version]
  25. Chai, Y.; Shi, W.; Shi, T.; Yang, X. An efficient cooperative hybrid routing protocol for hybrid wireless mesh networks. Wirel. Netw. 2017, 23, 1387–1399. [Google Scholar] [CrossRef]
  26. Chen, J.-L.; Ma, Y.-W.; Lai, C.-P.; Hu, C.-C.; Huang, Y.-M. Multi-Hop Routing Mechanism for Reliable Sensor Computing. Sensors 2009, 9, 10117–10135. [Google Scholar] [CrossRef] [PubMed]
  27. Silva, I.; Guedes, L.A.; Portugal, P.; Vasques, F. Reliability and Availability Evaluation of Wireless Sensor Networks for Industrial Applications. Sensors 2012, 12, 806–838. [Google Scholar] [CrossRef] [PubMed] [Green Version]
  28. Park, J.H. All-Terminal Reliability Analysis of Wireless Networks of Redundant Radio Modules. IEEE Internet Things J. 2016, 3, 219–230. [Google Scholar] [CrossRef]
  29. Rosyidi, L.; Pradityo, H.P.; Gunawan, D.; Harwahyu, R.; Sari, R.F. Dual hop multicast ping method for node failure detection in ZigBee loop network. Int. Conf. Inf. Technol. Syst. Innov. (ICITSI) 2014. [Google Scholar] [CrossRef]
  30. Yaqini, A.; Popalyar, F. An artificial neural network based fault detection and diagnosis for wireless mesh networks. Wirel. Days Conf. 2018. [Google Scholar] [CrossRef]
  31. Wang, Z.; Zhang, Z.; Wang, D.; Song, C.; Liu, M.; Li, J.; Lou, L.; Liu, Z. Failure prediction using machine learning and time series in optical network. Opt. Express 2017, 25, 18553–18565. [Google Scholar] [CrossRef]
  32. Hayajna, T.; Kadoch, M. Hello-Based Link Detection Failure Analysis in Wireless Mesh Networks. In Proceedings of the IEEE 4th International Conference on Future Internet of Things and Cloud (FiCloud), Vienna, Austria, 22–24 August 2016. [Google Scholar]
  33. Lindhorst, T.; Lukas, G.; Nett, E.; Mock, M. Data-Mining-Based Link Failure Detection for Wireless Mesh Networks. IEEE Symp. Reliab. Distrib. Syst. 2010. [Google Scholar] [CrossRef]
  34. Sota, N.; Higaki, H. Cooperative Watchdog for Malicious Failure Notification in Wireless Ad-Hoc Networks. In Proceedings of the 8th IFIP International Conference on New Technologies, Mobility and Security (NTMS), Larnaca, Cyprus, 21–23 November 2016. [Google Scholar]
  35. Tanha, M.; Sajjadi, D.; Pan, J. Demystifying Failure Recovery for Software-Defined Wireless Mesh Networks. In Proceedings of the 4th IEEE Conference on Network Softwarization and Workshops (NetSoft), Montreal, QC, Canada, 25–29 June 2018. [Google Scholar]
  36. Singh, M. Routing Protocol for WMNs; Springer: Berlin, Germany, 2018. [Google Scholar]
  37. Peng, Y.; Song, Q.; Yu, Y.; Wang, F. Fault-tolerant routing mechanism based on network coding in wireless mesh networks. J. Netw. Comput. Appl. 2014, 37, 259–272. [Google Scholar] [CrossRef]
  38. Wang, G.; Wang, G.; Shan, Z. Fault tolerance analysis of mesh networks with uniform versus nonuniform node failure probability. Inf. Process. Lett. 2012, 112, 396–401. [Google Scholar] [CrossRef]
  39. Khichar, J.; Choudhary, S. Fault aware adaptive routing algorithm for mesh based NoCs. In Proceedings of the International Conference on Inventive Computing and Informatics (ICICI), Coimbatore, India, 23–24 November 2017. [Google Scholar]
  40. Guerin, J.; Portmann, M.; Pirzada, A. Routing metrics for multi-radio wireless mesh networks. Telecommun. Netw. Appl. Conf. 2007, 343–348. [Google Scholar] [CrossRef] [Green Version]
  41. Hiertz, G.R.; Denteneer, D.; Max, S.; Taori, R.; Cardona, J.; Berlemann, L.; Walke, B. IEEE 802.11s: The WLAN Mesh Standard. IEEE Wirel. Commun. 2010, 17, 104–111. [Google Scholar] [CrossRef]
  42. Sgora, A.; Vergados, D.D.; Chatzimisios, P. IEEE 802.11s Wireless Mesh Networks: Challenges and Perspectives. Soc. Inform. Telecommun. Eng. 2009, 13, 263–271. [Google Scholar]
  43. Sznajd-Weron, K. Teoria Przejść Fazowych I Zjawiska Krytyczne; Uniwersytet Wrocławski Instytut Fizyki Teoretycznej: Wrocław, Poland, 2012. [Google Scholar]
  44. Gonczarek, R. Teoria przejść fazowych, wybrane zagadnienia; Oficyna Wydawnicza Politechniki Wrocławskiej: Wrocław, Poland, 2004. [Google Scholar]
  45. Du, Y.-C.; Lin, D.T.; Jen, C.-P.; Ng, C.W.; Chang, C.-Y.; Wen, Y.-X. Development of a Wireless Mesh Sensing System with High-Sensitivity LiNbO3 Vibration Sensors for Robotic Arm Monitoring. Sensors 2019, 19, 507. [Google Scholar] [CrossRef] [PubMed] [Green Version]
  46. Opening Report published by the Council IT Sector Competencies 2018. Available online: https://www.radasektorowa.pl. (accessed on 14 October 2019).
  47. Mazur, D.; Paszkiewicz, A.; Bolanowski, M.; Budzik, G.; Oleksy, M. Analysis of possible SDN use in the rapid prototyping process part of the Industry 4.0. Bull. Pol. Acad. Sci. Tech. Sci. 2019, 67, 21–30. [Google Scholar]
  48. Ji, W.; Duan, S.; Chen, R.; Wang, S.; Ling, Q. A CNN-based network failure prediction method with logs. In Proceedings of the Chinese Control and Decision Conference (CCDC), Shenyang, China, 9–11 June 2018. [Google Scholar]
  49. Di, X.; Zhang, Z.; Li, H.; Ao, C.; Tian, J.; Ozaki, K.; Wen, Y.; Fujita, H. Low-overhead and high-accuracy failure detection method for wireless multi-hop ad hoc networks. In Proceedings of the International Wireless Communications and Mobile Computing Conference (IWCMC), Nicosia, Cyprus, 4–8 August 2014. [Google Scholar]
  50. Draz, U.; Ali, T.; Yasin, S.; Waqas, U.; Rafiq, U. Towards Formalism of Link Failure Detection Algorithm for Wireless Sensor and Actor Networks. In Proceedings of the International Conference on Engineering and Emerging Technologies (ICEET), Lahore, Pakistan, 21–22 February 2019. [Google Scholar]
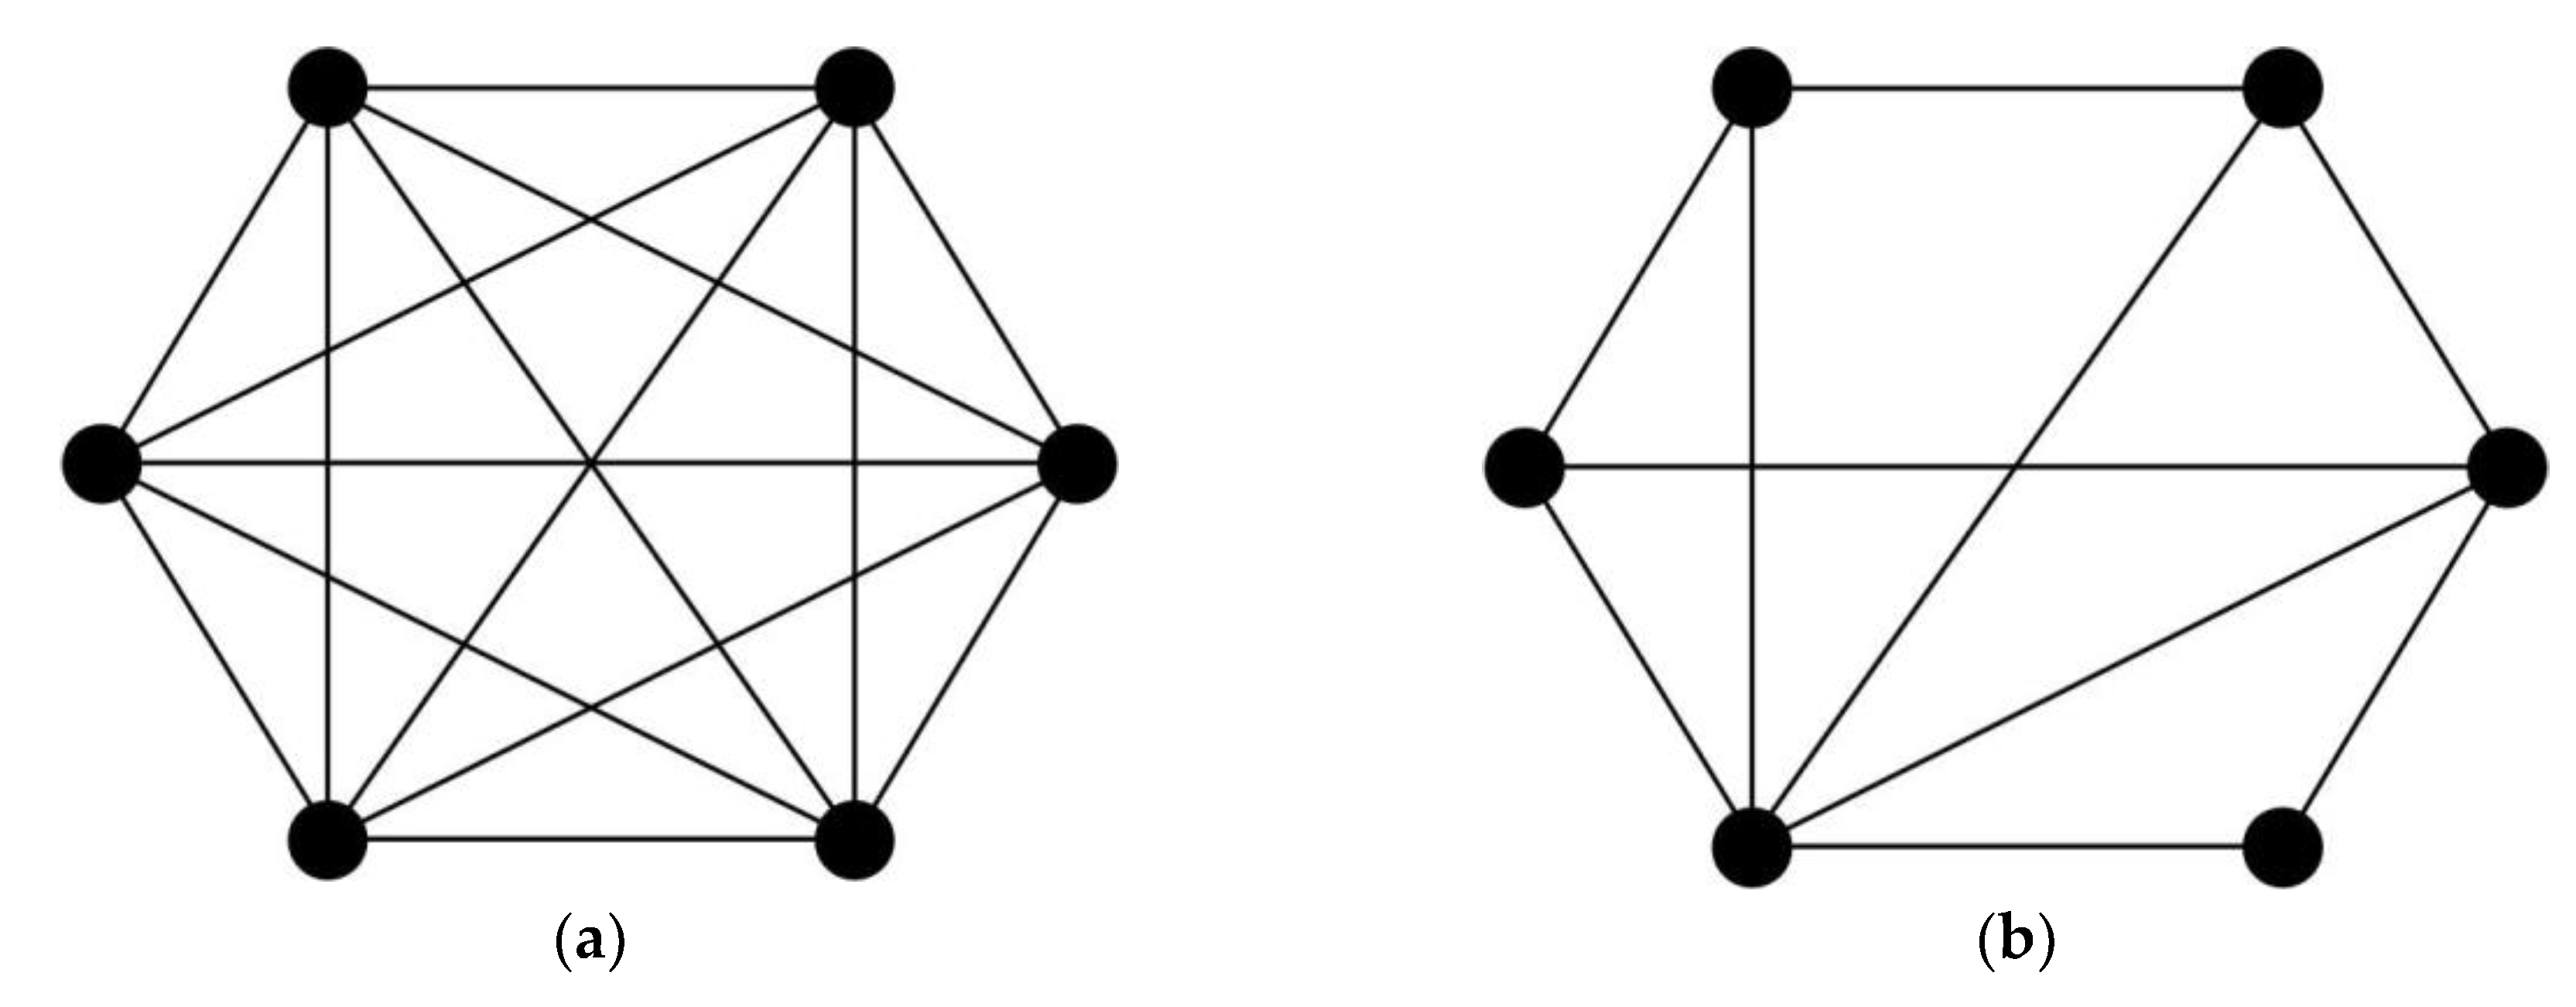
Figure 1. Topologies of the mesh: (a) full mesh; (b) partial mesh.
Applsci 09 05508 g001
Figure 2. An example of the implementation of the MESH structure in a wireless network.
Applsci 09 05508 g002
Figure 3. The power range of a transmitter in the context of providing connectivity.
Applsci 09 05508 g003
Figure 4. Tolerance to maintain connectivity in a wireless network.
Applsci 09 05508 g004
Figure 5. Exemplary mesh topologies for the radius of 0.5 for: (a) n = 10; (b) n = 25; (c) n = 60.
Applsci 09 05508 g005
Figure 6. Phase transition in terms of providing connectivity in the MESH topology for values of: (a) n = 3; (b) n = 10; (c) n = 25; (d) n = 60.
Applsci 09 05508 g006aApplsci 09 05508 g006b
Figure 7. Structural phase transition for mesh topology at n = 25: (a) r = 1; (b) r = 0.65; (c) r = 0.28; (d) r = 0.2; (e) r = 0.1; (f) probability of combination depending on r.
Applsci 09 05508 g007aApplsci 09 05508 g007b
Figure 8. Architecture of the early warning system against loss of consistency.
Applsci 09 05508 g008
Figure 9. Illustration of the algorithm operation in Figure 8: (a) reduction of transmission power; (b) reduction of available network nodes.
Applsci 09 05508 g009
Figure 10. Areas identified by the arbiter in relation to the cases in Figure 7.
Applsci 09 05508 g010
Figure 11. Exemplary mesh topologies for the radius of 0.1: (a) n = 100; (c) n = 150; (e) n=250; (g) n = 1000; and structural phase transition for these topologies: (b) n = 100; (d) n = 150; (f) n = 250; (h) n = 1000.
Applsci 09 05508 g011
Figure 12. Exemplary mesh topologies for the radius of 0.4: (a) n = 100; (c) n = 150; (e) n = 250; (g) n = 1000; and structural phase transition for these topologies: (b) n = 100; (d) n = 150; (f) n = 250; (h) n = 1000.
Applsci 09 05508 g012
Figure 13. MESH network with inactive transmitters: (a) simulation for a sample network; (b) presentation of ideas.
Applsci 09 05508 g013
Table 1. Comparison of failure detection and prediction methods in computer networks.
MethodNetwork Failure DetectionPrediction of Network FailureNetwork SizeModels of the Method Implementation in the Real NetworkNetwork Type
Proposed method based on Phase transitions analysisYesYesNo limit, tested for network with 2000 nodesNetwork with arbiter, SDN networksWireless, MESH, cable, fiber, LAN, MAN, WAN
Classical Network management systemsYes, but only for previously defined elements (nodes, links, devices elements)Limited based on:—network baseline,—human decision in Network Operating CenterNo limit, often dedicated for homogeneous network (devices from one vendor). Tested for network with 150 devicesClassical network with one or more NMS stationWireless, cable, fiber, LAN, MAN, WAN
Log Data mining [48]NoYesNo limit, a large amount of data transmitted from network nodes to central management nodeNetwork with arbiter, SDN networkscable, fiber, MAN, WAN
Model of Link Failure Detection Algorithm (LFDA) [50]Yes (limited)YesN/ANetwork with arbiterMESH, cable, fiber, MAN, WAN
Root Node Reduction method [49]YesNoNo limit, tested for several nodesDistributed architectures, application layer, communication overhead, calculations in nodeWireless, cable, fiber, LAN
DES-SVM prediction method (machine learning) [31]YesYesNo limit, large amount of data transmitted from network nodes to central management nodeSDMAN, SDNMesh optical topology, LAN, MAN