1. Introduction
Wind is one of the fundamental forces shaping geomorphology [
1], especially in arid climate, it provides the main driving power to determine the desert surface morphology [
2,
3]. The distribution of aeolian sand, dune morphology, movement and even the development of grain sand are all related to the wind of different scales [
4]. Wind is also the direct power condition causing aeolian sand disasters [
5]. Wind energy is a key variable in indices designed to examine potential sand drift [
6]. Wind regime (i.e., wind speed and direction) hastherefore been widely studied to support the classification of aeolian geomorphology [
3]. Other regional factors, such as grain size and sand surface moisture [
7], surface crusting [
8], vegetation cover [
9] and topography [
10] also influence the aeolian sand transport. Scholars have previously made numerous efforts to study the estimation of sand transport through both field measurement and theoretical calculation with models [
11,
12,
13,
14]. Resulting from regional variability in these factors, the patterns, size and distribution of aeolian dunes usually exhibit distinct regional characteristics [
15].
The Hobq Desert (Hobq is in Mongolian) is the seventh largest desert in China. At the beginning of 1959, the sand control team of the Chinese Academy of Sciences carried out a comprehensive investigation of the natural geographical features and natural resources of the Hobq Desert. Previous studies were mainly concentrated on the problem of land desertification in Hobq region [
16], variation in grain size of dune [
17], the environmental changes [
18,
19] (Li et al., 2017; Xu et al., 2018), and how the Hobq Desert affected the channel evolution of the Yellow River [
20,
21]. Ta et al. [
22] suggested that channel aggradation of the Hobq Desert reach of the Yellow River was induced by perennial sediment input from the surrounding deserts. There has less sufficient detailed research on basic dune characteristics and temporal changes in wind regime and sand transport of the Hobq Desert.
The aims of this study were to analyze the dune height, dune type and spatial and temporal distribution of wind speed and perform an integrated analysis of recent changes from 2009 to 2018 in the wind regime of the Hobq Desert, and to discuss the influence of climate change on sand transport. The conclusions provide a scientific basis for the prevention and treatment of regional sand disasters and aeolian sand blown into the Yellow River, and the research application is the procedure for long-term monitoring of sand dunes.
2. Study Area
The Hobq Desert is located in the south bank of the Yellow River and the northern part of the Ordos Plateau in Inner Mongolia, with an area of 1.56 × 10
4 km
2. The desert is narrow in the east and wide in the west, with a length of about 300km from the east to the west. Ten tributaries (cross-desert ephemeral tributaries) flow through the east and middle of the Hobq Desert to the Yellow River on its right bank (
Figure 1). Set the most western tributary of the ten tributaries as the boundary, the eastern desert is with a width of 8–28km and that of the western desert is 40–90 km. Influenced by the east Asian summer monsoon, the average annual precipitation of the Hobq Desert decreased from 400 mm in the east to 150 mm in the west [
23]. The rainfall appears mainly in the form of rainstorms and concentrates from July to September. Strong winds and sandstorms often happen in winter and spring with an annual average frequency of 34.5 and 19.2 days at Dongsheng meteorological station. At Baotou meteorological station, they are 46.8 and 21.6 days respectively [
24]. The average day of sandstorms from 1981 to 2013 in Linhe weather station is 20 days [
25].
3. Data and Methods
3.1. Data
Dune height data are clipped from the map of desert distribution in 1:2,000,000 in China and dune type data are extracted from 1:100,000 scale desert distribution map set of China. These two data setsare both provided by Environmental and Ecological Science Data Center for West China, National Natural Science Foundation of China(
http://westdc.westgis.ac.cn).
Remote sensing data used are the satellite images of the Google Earth. They are available and suitable for this study taken at some times in 2019.
Annual meteorological data (average wind speed, precipitation, temperature, relative humidity and annual maximum wind speed) of six meteorological stations around the Hobq Desert: Hangjinhouqi (HJHQ), Linhe (LH) and Baotou (BT) stations in the north and E’tuokeqi (ETKQ), Yijinhuoluo (YJHL) and Dongsheng (DS) stations in the south (
Figure 1), and daily meteorological data of Linhe, Baotou and Dongsheng stations from 2009 to 2018 were downloaded from China’s National Meteorological Information Center (
http://data.cma.cn). Wind data were measured at 10 m above the ground, following World Meteorological Organization standards for anemometer heights.
3.2. Sand Drift Potential
Drift potential (DP) represents yearly total wind power and therefore is used for describing the potential maximum amount of sand transport by winds with a velocity above the threshold velocity [
26]. It is calculated as follows:
where
V is the measured 10-min wind velocity, in m/s;
Vt is the threshold wind velocity for winds to entrain sediment, in m/s, it was estimated to be 6 m/s in Hobq Desert, according to the previous study [
24] and
t is the proportion of time during which wind velocity is greater than
Vt.
Modified by Fryberger and Dean [
26], different DP values represent different wind energy environments. If DP is less than 200, the wind energy environment is low. If DP is between 200 and 400, the wind energy environment is intermediate. If DP is greater than 400, that is high.
Resultant drift potential (RDP) represents the net DP or the vectorial sum of the DP values in each compass direction. It is calculated as follows [
6]:
where
VU represents the
DP in each wind direction (in this paper, we grouped winds into 16 directions), in vector units, and
is the midpoint of each wind orientation class measured clockwise from 0° (north) [
3].
The resultant drift direction (RDD) represents the direction of net trend of sand drift. It is calculated as follows [
6]:
Directional variability (RDP/DP) is the ratio of the resultant drift potential (RDP) to the drift potential (DP). RDP/DP values close to 1 indicate a narrowly unidirectional wind regime, with a single dominant drift direction, whereas values close to 0 indicate a multidirectional wind regime with multiple significant drift directions [
3,
6]. Specifically, if RDP/DP is less than 0.3, the directional category is complex or obtuse bimodal. If RDP/DP is between 0.3 and 0.8, that is obtuse bimodal or acute bimodal. If RDP/DP is greater than 0.8, that is wide or narrow unimodal [
26].
3.3. Trend and Breakpoint Detection
The Mann–Kendall (M–K) trend test [
27,
28] is based on the correlation between the ranks of a time seriesand their time order. For a time series
X = {
x1,
x2, …,
xn}, the test statistic is given by
where
and
Ri and
Rj are the ranks of observations
xi and
xj of thetime series, respectively. The mean and variance of the
S statistic in Equation (6) above are given by [
28]
where
n is the number of observations. If
n is greater than 8, the
S values will follow an approximately normal distribution [
29]. The Mann–Kendall
Z is given by [
30]
A positive value of
Z indicates an increasing trend, and vice versa. The null hypothesis of no trend is rejected if |
Z| > 1.96 at the 5% significance level [
29].
After trend analysis, we use the Pettitt test [
31], a non-parametric method that is widely applied to detect abrupt changes, to find out the breakpoint.
3.4. Other Methods
To calculate the spatial distribution of dune height inthe study area, we used ArcGIS10.5 to interpolate values between adjacent stations using the ordinary kriging function provided by the Spatial Analyst tool.
Spatial distribution of the average and maximum annual wind speed was calculated through Surfer 13.
We obtained mathematicsstatistical summary of the wind velocity parameters using OriginPro20, including standard deviation, minimum value and maximum value. We performed regressions for the relationships between DP and climatic parameters with SPSS 20.
4. Results and Analysis
4.1. Basic Characteristics of Dune
The sand dune height of the Hobq Desert ranged largely, the highest value was 5010 m and the lowest was 10 m. It decreased gradually from the west to the east (
Figure 2A). The height of the dune mainly distributed below 1500 m, which accounted for 20.6%, followed by 1500–2000 m, which was 17.3%. The distribution area of other heights was basically the same, which was about 15%.
According to different fractional vegetation cover (FVC), the Hobq Desert includes four dune types, migratory dune (FVC < 5%), semimigrated dune (FVC 5%–20%), semifixed dune (FVC 21%–50%) and fixation dune (FVC > 50%). Migratory, semimigrated, semifixed and fixation sand dunes in Hobq Desert accounted for 51.8%, 25%, 14.9% and 8.3% of the dunes, respectively. Migratory and semimigrated dunes mainly were distributed in the west and southwest of the desert (
Figure 2B).
Twenty locations were selected, namely, sixmigratory dunes (M1–M6), five semimigrated dunes (SM1–SM5), seven semifixed dunes (SF1–SF7) and two fixation dunes (F1–F2). Location SF4–SF7, M5–M6 and SM5 lay in the eastern part of the desert, and the rest of the locationslay in the western part of the desert (
Figure 2B). Downloading part of high-resolution images from Google Earth (
Figure 3), following the Livingstone and Warren (1996) dune classification system, the migratory dune pattern wastrellis dune (M2, M4 and M6), semimigrated dune and semifixed dune patterns including the honeycomb dune (SM1 and SF1), parabolic dune (SM2 and SF3) and brush dune (SM3 and SF6), and the fixation dune pattern was grass dune (F1 and F2).
4.2. Annual Wind Characteristics
For the rest of the stations, the average and maximum annual wind speed fluctuated between about 10 m/s and 15 m/s from 2009 to 2018 (
Figure 4).
With the M–K test, there was a significant downward trend of the maximum and average annual wind speed at Dongsheng station during 2009–2018 and had a break in 2013. At Hangjinhouqi and E’tuoke stations, there wasa significant upward trend of the average annual wind speed and had a break in 2017 and 2012, respectively. There was no significant trend at the rest of the stations (
Table 1).
The greatest maximum and average annual wind speed were both at Yijinhuoluo (16.7 ± 3.1 m·s
−1 and 3.0 ± 0.5 m·s
−1). The smallest of those two parameters were at Dongsheng (10.0 ± 1.4 m·s
−1) and Hangjinhouqi (2.2 ± 0.2 m·s
−1), respectively (
Table 2).
Figure 5 shows the distribution of the average and maximum annual wind speed in the desert and adjacent areas from 2009 to 2018. Annual wind speed was greatest in the southeast and decreased moving to the northwest.
4.3. Dominant Wind Characteristics
In order to find out the dominant wind direction, we obtained the rose diagrams of the wind direction at Dongsheng, Baotou and Linhe stations during the years from 2009 to 2018 with daily wind data (
Figure 6). The dominant wind direction of Dongsheng station was W from 2009 to 2016, and WNW from 2017 to 2018, but the frequency of W wind was less than 3% lower than that of WNW wind.Apart from the ENE wind in 2009, all the other years of Linhe station were SW wind, but after 2010 and 2014, it was mainly WSW. Different from Dongsheng and Linhe stations, the dominant wind direction of Baotou station varied greatly in the decade. To be specific, the prevailing wind was NW from 2009 to 2012, and ESE from 2013 to 2018.
According to the prevailing winds of Dongsheng, Baotou and Linhe stations in each year, the frequency of occurrence of different speed intervals was plotted (
Figure 7). From the overall wind speed distribution, the average wind speed of the prevailing winds of each station from 2009 to 2018 was mainly distributed at 4–8 m/s. In contrast, the frequency percentage of Baotou station with wind speed greater than 6m/s was the lowest, the mean value was less than 30% and the maximum value wasonly 54%. As for the other two stations, they had little difference, the frequency percentage of the maximum wind speed greater than 6 m/s was about 85% and that of the mean value was about 45%. However, the frequency percentage of wind speed exceeding 10 m/s at each station was very low, with the maximum value of 10% or below.
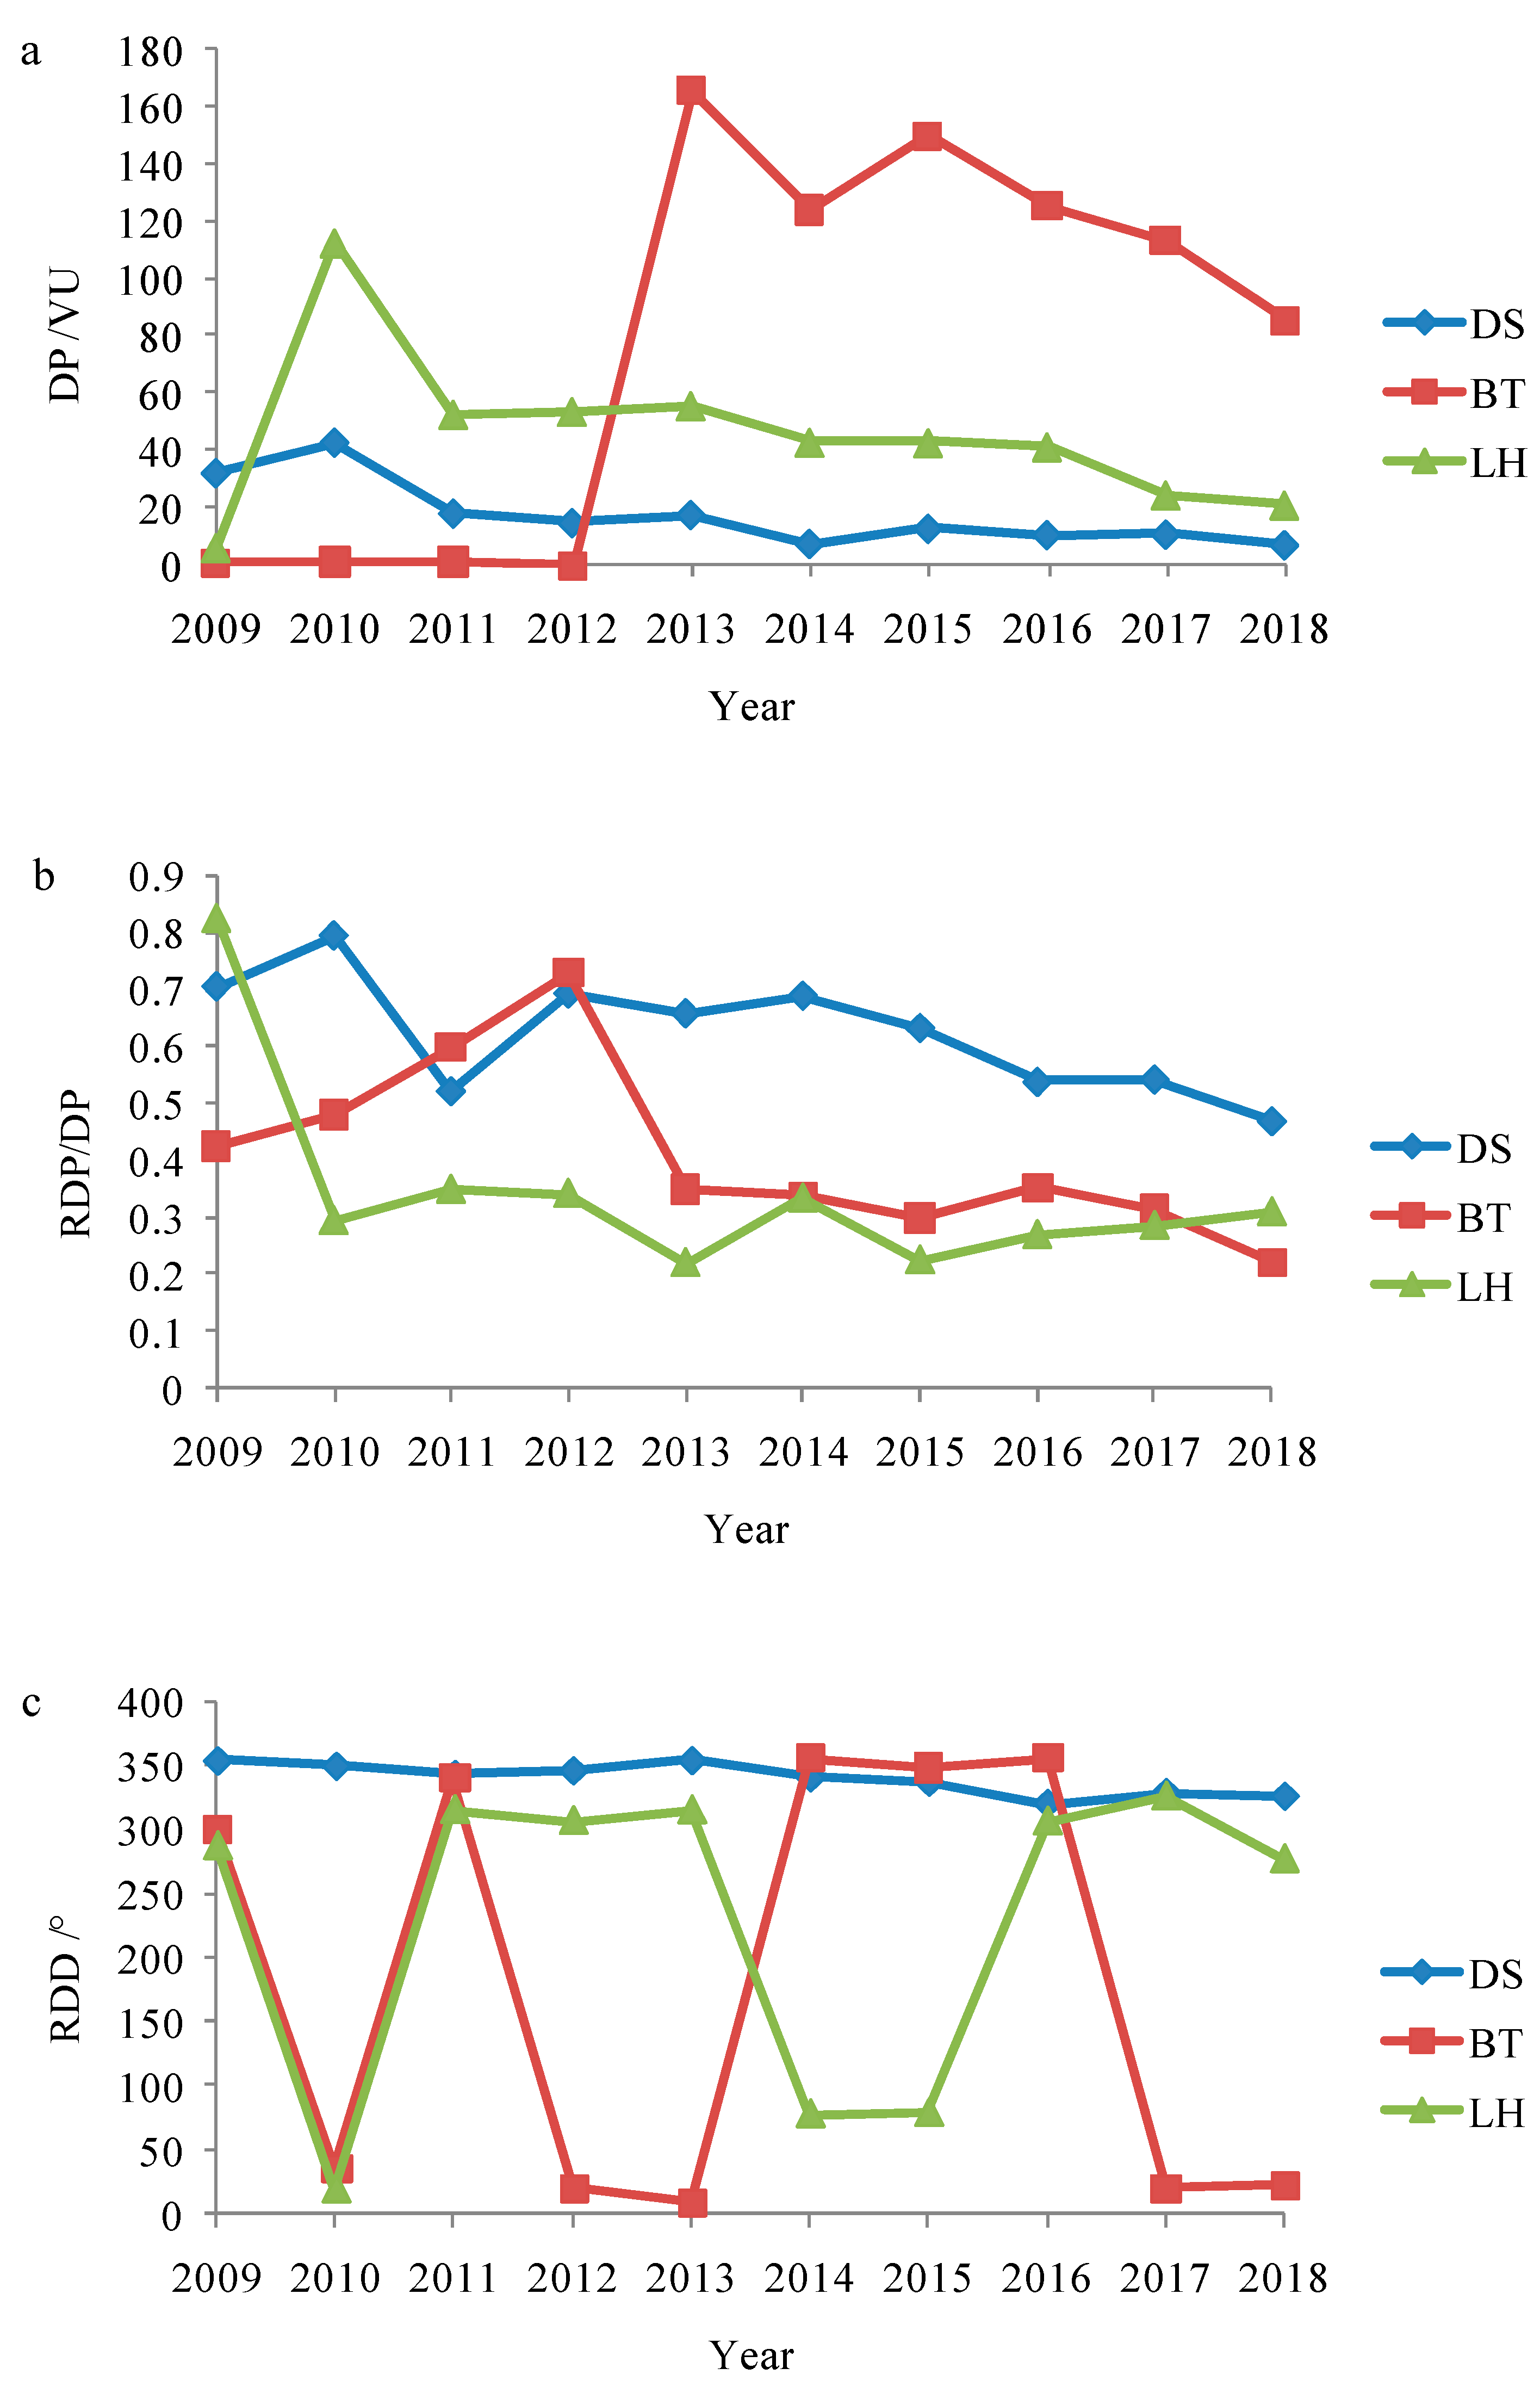
4.4. Sand Drift Potential
Sand drift potential (DP) was greatest at Baotou station, where the annual DP was 76.79 ± 68.57 (mean ± SD), followed by the Linhe station, with an annual DP of 45.3 ± 28.55. That was 17.43 ± 11.41 at Dongsheng station (
Figure 8a). All those DP values indicated a low energy wind environment in the Hobq Desert.
The annual directional variability was mostly intermediate, with values between 0.3 and 0.8 (
Figure 8b), with one exception: Baotou had low directional variability in 2018 and Linhe had low directional variability in 2013 and 2015. The wind regime in the Hobq Desert was main obtuse or acute bimodal.
RDD at Dongsheng station was relatively constant from 2009 to 2018, it was about 350°, and the standard deviation was 12°. RDD differed greatly during 2009 to 2018 at Baotou and Linhe, were 181° ± 169° and 231° ± 121°, respectively (
Figure 8c).
4.5. Sand Transport and Wind Speed
Using the annual wind speed data from threeweather stations in and around the Hobq Desert, we obtained 10 years of data that provided a better idea of the annual maximum and average wind speed and established a relationship between DP and the average (
Figure 9a) and maximum wind speed (
Figure 9b). It could be concluded that this relationship was expressed as a power function through comparing the values of
R2 and
p among 11 kinds of math models. DP was strongly correlated with the annual average wind speed (
R2 = 0.81,
p < 0.01) and the annual maximum wind speed (
R2 = 0.90,
p < 0.01). With the increase of wind speed, DP increased, especially the average wind speed was greater than 2.5 m/s and the maximum wind speed was greater than 12 m/s, DP increased rapidly.
4.6. Climate Change Characteristics
We used precipitation and temperature to present the climate change characteristics. Based on data from three weather stations (Dongsheng, Baotou and Linhe) from 2009 to 2018, we analyzed annual precipitation and annual average temperature characteristics of those three stations. The annual precipitation at Linhe station was 200 mm and below. While, the annual precipitation at Dongsheng and Baotou stations was between 200 and 500 mm, for some year, it was as high as about 700 mm at Dongsheng station (
Figure 10a).
For the annual average temperature, it concentrated from 8 to 8.5 °C at Baotou station (
Figure 10b). The annual average temperature ranged greater at Dongsheng and Linhe stations, were 6.5–8.5°C and 7.5–9.5°C, respectively.
5. Discussion
Wind is the power responsible for movement of aeolian sediments, thus transport should increase with increasing wind speed. However, other factors can disrupt this simple relationship. For example, precipitation can increase vegetation cover, sand moisture content and the air’s relative humidity, and all of these factors can decrease sand transport [
32,
33]. Increased temperatures have the opposite effect: they increase evaporation, and thereby decrease soil cohesion. Thus, climate change will affect the formation and subsequent evolution of sand seas and sand dunes [
3]. To figure out the influence of long-term climate change on sand transport, we analyzed the relationship between DP and annual precipitation and annual average temperature. The annual precipitation at Linhe station was positive correlated with DP. While, it was negative correlated with DP at the eastern part of the Hobq Desert (
Figure 11a).
For the annual average temperature, it had a positive correlation with DP at Baotou station (
Figure 11b) and the annual average temperature at Dongsheng and Linhe stations had a negative correlation with DP. However, the relationships between DP and the annual precipitation and temperature at all the stations from 2009 to 2018 were not significant (
p > 0.05). Although precipitation and temperature directly restricted the species diversity, growth and development of plants, usually, the vegetation developed in dry years is difficult to produce coverage protection effect on the surface [
34]. For the Hobq Desert with a large area of migratory dune, there wasno significant correlationbetween the temporal changes in DPand climate change. The modern environmental monitoring of the Maowusu Sandy Land, which is located in the south of the Hobq Desert shows that the vegetation restoration capacity of the east and west of the Maowusu Sandy Land was out of sync with the decreasing wind, decreasing anthropology activities and slightly increasing precipitation. The eastern region gives a priority response to the climate changes, while the western region depends on the continuous improvement of climatic environment [
35]. This suggests that the response to climate change in the eastern and western regions of the Hobq Desert may also be out of sync. Under the condition of a better climate, the eastern region may give a priority response to the changes, solidifying the dune and gradually developing the paleosols, while the sandstorm activity in the western region may still continue, at least it did not form the environmental conditions for soil development. Meanwhile, through study on the sedimentary sequence of the strata in the Hobq Desert, it is found that the formation of aeolian sand in some sections is mainly related to the increase of available loose sand sources rather than the arid climate conditions [
23].
6. Conclusions
Wind regimes play an important role in the formation and development of aeolian dune. The calculated DP was strongly related to the annual average and maximum wind speed, and the relationships were described with a power function. With the increase of wind speed, DP increased, especially the average wind speed was greater than 2.5 m/s and the maximum wind speed was greater than 12 m/s, DP increased rapidly. While, considering the other two key climate factors, precipitation and temperature, there was no significant correlation between them and calculated DP from 2009 to 2018.
In the Hobq Desert, there was a low energy wind environment, with intermediate annual directional variability and obtuse or acute bimodal wind regime. Annual wind speed was greatest in the southeast and decreased moving to the northwest. Aeolian dune height mainly distributed below 1500 m, it decreased gradually from the west to the east, and dune patterns includedtrellis dune, honeycomb dune, parabolic duneand brush dune and grass dune.The dominant wind direction was main W and SW from 2009 to 2018 in the Hobq Desert, the average wind speed of the prevailing winds mainly distributed at 4–8 m/s. The frequency of wind speed exceeding 10 m/s is very low, with the maximum value of 10% or below.The complexity of the local and region wind regime controlled the variety of the sand dune patterns.
Author Contributions
H.Y. performed the data processing and wrote the manuscript. X.H. provided the ideas and helped process the data. J.C. revised the language and provided financial support. All authors have read and agreed to the published version of the manuscript.
Funding
This research was funded by the National Key Research and Development Plan Project of China grant numbers [2018YFC0406501–02] and National Natural Science Foundation of China grant numbers [41877170]. And the APC was founded by [2018YFC0406501–02].
Acknowledgments
This work is supported by CFERN and Beijing Techno Solutions Award Funds on excellent academic achievements. We are grateful for the inputs of the laboratory staff and anonymous reviewers.
Conflicts of Interest
The authors declare no conflict of interest.
References
- Skidmore, E.L. Soil erosion by wind. In Physics of Desertification; El-Baz, F., Hassan, M.H.A., Eds.; MartinusNijhoff Publishers: Dordrecht, The Netherlands, 1986; pp. 261–273. [Google Scholar]
- Zhu, Z.D. Desert, Desertification and Its Control; Environmental Science Press of China: Beijing, China, 1999; pp. 33–47. [Google Scholar]
- Zhang, Z.C.; Dong, Z.B.; Li, C.X. Wind regime and sand transport in China’s Badain Jaran Desert. Aeolian Res. 2015, 17, 1–13. [Google Scholar] [CrossRef]
- Goudie, A.S. Dust storms in space and time. Prog. Phys. Geogr. 1983, 7, 502–530. [Google Scholar] [CrossRef]
- Zu, R.P.; Zhang, K.C.; Qu, J.J.; Fang, H.Y. Study on wind regime characteristics in the Taklimakan Desert. Arid Geogr. 2005, 28, 167–170. [Google Scholar]
- Al-Awadhi, J.M.; Al-Helal, A.; Al-Enezi, A. Sand drift potential in the desert of Kuwait. J. Arid Environ. 2005, 63, 425–438. [Google Scholar] [CrossRef]
- Wiggs, G.F.S.; Atherton, R.J.; Baird, A.J. Thresholds of aeolian sand transport: Establishing suitable values. Sedimentology 2004, 51, 95–108. [Google Scholar] [CrossRef]
- Rice, M.A.; McEwan, I.K. Crust strength:a wind tunnel study of the effect of impact by saltating particles on cohesive soil surfaces. Earth Surf. Process Landf. 2001, 26, 721–733. [Google Scholar] [CrossRef]
- Kuriyama, Y.; Mochizuki, N.; Nalashima, T. Influence of vegetation on Aeolian sand transport rate from a backshore to a foreshore at Hasaki, Japan. Sedimentology 2005, 52, 1123–1132. [Google Scholar] [CrossRef]
- Hesp, P.; Davidson-Arnott, R.; Walker, I.; Ollerhead, J. Flow dynamics over a foredune at Prince Edward Island Canada. Geomorphology 2005, 65, 71–84. [Google Scholar] [CrossRef]
- Dong, Z.B.; Liu, X.P.; Wang, X.M. Wind initiation thresholds of the moistened sands. Geophys. Res. Lett. 2002, 29, 25-1–25-4. [Google Scholar] [CrossRef]
- Sherman, D.J.; Li, B.L.; Ellis, J.T.; Farrell, E.J.; Maia, L.P.; Granja, H. Recalibrating aeolian sand transport models. Earth Surf. Process Landf. 2013, 38, 169–178. [Google Scholar] [CrossRef]
- Yang, Y.Y.; Qu, Z.Q.; Shi, P.J.; Liu, L.Y.; Zhang, G.M.; Tang, Y.; Hu, X.; Lv, Y.L.; Xiong, Y.Y.; Wang, J.P.; et al. Wind regime and sand transport in the corridor between the Badain Jaran and Tengger deserts, central Alxa Plateau, China. Aeolian Res. 2014, 12, 143–156. [Google Scholar] [CrossRef]
- Van Rijin, L.C.; Strypteen, G. A fully predictive model for aeolian sand transport. Coast. Eng. 2019. [Google Scholar] [CrossRef]
- Hack, J.T. Dunes of the Western Navajo country. Geogr. Rev. 1941, 31, 240–263. [Google Scholar] [CrossRef]
- Yang, J.P. Study onDesertification and Its Control in Hobq Area; Beijing Forestry University: Beijing, China, 2006. [Google Scholar]
- Liu, M.P.; Hasi, E.; Sun, Y. Variation in grain size and morphology of an inland parabolic dune during the incipient phase of stabilization in the Hobq Desert, China. Sediment. Geol. 2016, 337, 100–112. [Google Scholar] [CrossRef]
- Li, B.F.; Sun, D.H.; Xu, W.H.; Wang, F.; Liang, B.Q.; Ma, Z.W.; Wang, X.; Li, Z.J.; Chen, F.H. Paleomagnetic chronology and paleoenvironmental records from drill cores from the Hetao Basin and their implications for the formation of the Hobq Desert and the Yellow River. Quat. Sci. Rev. 2017, 156, 69–89. [Google Scholar] [CrossRef] [Green Version]
- Xu, Y.T.; Lai, Z.P.; Chen, T.Y.; Gong, S.L. Late Quaternary optically stimulated luminescence (OSL) chronology and environmental changes in the Hobq Desert, northern China. Quat. Int. 2018, 470, 18–25. [Google Scholar] [CrossRef]
- Pan, B.T.; Guan, Q.Y.; Liu, Z.B.; Gao, H.S. Analysis of channel evolution characteristics in the Hobq Desert reach of the Yellow River (1962–2000). Glob. Planet. Chang. 2015, 135, 148–158. [Google Scholar] [CrossRef]
- Wang, Z.J.; Ta, W.Q. Hyper-concentrated flow response to aeolian and fluvial interactions from a desert watershed upstream of the Yellow River. Catena 2016, 147, 258–268. [Google Scholar] [CrossRef]
- Ta, W.Q.; Xiao, H.L.; Dong, Z.B. Long-term morphodynamic changes of a desert reach of the Yellow River following upstream large reservoirs’ operation. Geomorphology 2008, 97, 249–259. [Google Scholar] [CrossRef]
- Yang, X.P.; Liang, P.; Zhang, D.G.; Li, H.W.; Rioual, P.; Wang, X.L.; Xu, B.; Ma, Z.B.; Liu, Q.Q.; Ren, X.Z.; et al. Holocene aeolian stratigraphic sequences in the eastern portion of the desert belt (sand seas and sandy lands) in northern China and their palaeoenvironmental implications. Sci. China Earth Sci. 2019, 62, 1302–1315. [Google Scholar] [CrossRef]
- Yang, H.; Shi, C.X. Spatial and temporal variations of aeolian sediment input to the tributaries (the Ten Kongduis) of the upper Yellow River. Aeolian Res. 2018, 30, 1–10. [Google Scholar] [CrossRef]
- Qiu, Q.L. Statistical analysis of dust weather variation characteristics in Linhe district. Shanxi Agric. Econ. 2019, 3, 163. [Google Scholar]
- Fryberger, S.G.; Dean, G. Dune forms and wind regime. In A Study of Global Sand Seas; Professional Paper 1052; McKee, E.D., Ed.; U.S. Geological Survey: Washington, DC, USA, 1979; pp. 137–169. [Google Scholar]
- Mann, H.B. Nonparametric tests against trend. Econometrica 1945, 13, 245–259. [Google Scholar] [CrossRef]
- Kendall, M. Rank Correlation Measures; Charles Griffin: London, UK, 1975. [Google Scholar]
- Yao, H.F.; Shi, C.X.; Shao, W.W.; Bai, J.B.; Yang, H. Changes and influencing factors of the sediment load in the Xiliugoubasin of the upper Yellow River, China. Catena 2016, 142, 1–10. [Google Scholar] [CrossRef]
- Hamed, K.H. Trend detection in hydrologic data: The Mann–Kendall trend test under the scaling hypothesis. J. Hydrol. 2008, 349, 350–363. [Google Scholar] [CrossRef]
- Pettitt, A.N. A non-parametric approach to the change-point problem. J. R. Stat. Soc. Ser. C (Appl. Stat.) 1979, 28, 126–135. [Google Scholar] [CrossRef]
- Livingstone, I.; Warren, A. Aeolian Geomorphology: An Introduction; Addison Wesley Longman Limited: London, UK, 1996. [Google Scholar]
- Dong, Z.; Zhang, Z.; Lv, P.; Qian, G. An aeolian transport model for flat shifting sand fields under dynamic–limiting conditions. J. Arid Environ. 2011, 75, 865–869. [Google Scholar] [CrossRef]
- Chang, X.L.; Zhao, A.F.; Li, S.G. The vegetation species diversity of fixed dune in Horqin sandy land response to precipitation changes. Chin. J. Plant Ecol. 2000, 24, 147–151. [Google Scholar]
- Liang, P.; Yang, X. Landscape spatial patterns in the Maowusu (Mu Us) Sandy Land, northern China and their impact factors. Catena 2016, 145, 321–333. [Google Scholar] [CrossRef]
© 2019 by the authors. Licensee MDPI, Basel, Switzerland. This article is an open access article distributed under the terms and conditions of the Creative Commons Attribution (CC BY) license (http://creativecommons.org/licenses/by/4.0/).


