Article

The Role of Electron Trajectories in XUV-Initiated High-Harmonic Generation

Department of Physics of Complex Systems, Weizmann Institute of Science, Rehovot 76100, Israel
*
Author to whom correspondence should be addressed.
These authors contributed equally to this work.
Appl. Sci. 2019, 9(3), 378; https://doi.org/10.3390/app9030378
Submission received: 24 December 2018 / Revised: 17 January 2019 / Accepted: 18 January 2019 / Published: 22 January 2019
(This article belongs to the Special Issue Attosecond Science and Technology: Principles and Applications)

Abstract

:
High-harmonic generation spectroscopy is a powerful tool for ultrafast spectroscopy with intrinsic attosecond time resolution. Its major limitation—the fact that a strong infrared driving pulse is governing the entire generation process—is lifted by extreme ultraviolet (XUV)-initiated high-harmonic generation (HHG). Tunneling ionization is replaced by XUV photoionization, which decouples ionization from recollision. Here we probe the intensity dependence of XUV-initiated HHG and observe strong spectral frequency shifts of the high harmonics. We are able to tune the shift by controlling the instantaneous intensity of the infrared field. We directly access the reciprocal intensity parameter associated with the electron trajectories and identify short and long trajectories. Our findings are supported and analyzed by ab initio calculations and a semiclassical trajectory model. The ability to isolate and control long trajectories in XUV-initiated HHG increases the range of the intrinsic attosecond clock for spectroscopic applications.

1. Introduction

Attosecond spectroscopy has enabled the direct observation of ultrafast electron dynamics in atoms, molecules, and solids on its natural time scale, the attosecond time domain ( 1 as = 10 18 s) [1,2,3]. It is based on the production of attosecond extreme ultraviolet (XUV) pulses through a process known as high-harmonic generation (HHG) [4]. In HHG, the interaction of a bound electron with a strong laser field leads to tunneling ionization. The liberated electron recollides with the parent matter, which is followed by the emission of bursts of XUV radiation with attosecond duration [5,6,7]. At the heart of HHG is the notion of electron trajectories, which lead to a direct mapping between time and energy and the emergence of a cutoff in the HHG spectrum. The cutoff energy is given by E cutoff I p + 3.17 U p , where I p is the ionization potential of the parent matter and U p is the ponderomotive energy. Electron trajectories are classified into short and long trajectories according to the duration of their travel [8,9,10]. Macroscopic pulse propagation effects in the HHG medium typically lead to an enhancement of the short trajectories while the long trajectories are usually suppressed and possess a high degree of divergence [11,12].
The quantity that governs the macroscopic response in HHG is the reciprocal intensity parameter α for a specific harmonic and trajectory [13]. The parameter describes the scaling of the spectral phase ϕ of a specific harmonic as a function of intensity I, where to a good approximation, ϕ ( I ) α I . Experimentally, α has been resolved with the help of the reconstruction of attosecond beating by interference of two-photon transitions (RABBITT) [14], cross-correlation frequency-resolved optical gating (XFROG) [15,16], two-source HHG interferometry [17], and quantum path interference in HHG [12]. The intensity dependence of ϕ leads to an instantaneous frequency shift δ Ω ( t ) of the harmonics over the range of the driving laser pulse envelope, δ Ω ( t 1 ) α I ( t 1 ) / t 1 , where t 1 is the time of recollision [15,16]. This results in a pronounced frequency broadening of the long trajectory harmonics because their α parameters are significantly larger than those of their short trajectory counterparts (cf. [10,13]).
A major limitation of HHG is imposed by the inherent coupling between the ionization and recollision steps of the interaction, both governed by the strong infrared (IR) field. XUV-initiated HHG replaces the tunnel ionization step in HHG by XUV-driven photoionization, overcoming this limitation [18,19,20,21,22,23,24]. Controlling the delay between an ionizing XUV field and a strong IR laser pulse determines the time frame when electrons are promoted to the continuum and undergo IR-driven recollision. Figure 1a shows the principle of XUV-initiated HHG. An XUV pulse promotes an electron to an excited or continuum state close to the ionization threshold. Subsequently, the IR field induces a recollision trajectory, leading to the emission of XUV light carrying higher energy. XUV-initiated HHG is related to XUV-initiated photoelectron rescattering [25,26], laser-assisted photoemission [27,28], and XUV-seeded cluster ionization avalanching [29].
In this work, we study the response of the electron trajectories to the instantaneous intensity of the IR field in XUV-initiated HHG. The ability to scan the delay between the ionizing XUV pulse train and the IR pulses allows the detection and isolation of various electron trajectories through their intensity-dependent spectral shifts. Such spectral shifts provide a direct insight into the reciprocal intensity parameter α of XUV-initiated HHG, validating the semiclassical picture that describes the mechanism. In contrast to tunneling-driven HHG, here the ability to accurately control the XUV–IR delay allows us to scan the variation of the reciprocal intensity parameter within the laser cycle, following its dependence on the length of the underlying trajectory. Our experimental findings are supported by two theoretical models, the semiclassical Coulomb-corrected three-step model (CCTSM) and a numerical integration of the time-dependent Schrödinger equation (TDSE).

2. Experimental Results

2.1. Experimental Setup

XUV-initiated HHG is produced in a collinear apparatus with two stages (see Figure 1b). First, we generate an XUV attosecond pulse train (APT) by focusing 787 nm laser pulses from a Ti:sapphire amplifier system (KMlabs Red Dragon) into a gas cell filled with xenon. The pulse duration (intensity duration full-width at half maximum (FWHM)) is about 25 fs. At the cell position, we reach a peak intensity of about 9 × 10 13 W cm 2 . The resulting low-divergence XUV beam is spatially separated from the copropagating IR beam by a thin aluminum filter (200 nm thickness). A two-segment mirror (focal length 600 mm, Ultrafast Innovations) is used to refocus the beams, where the inner segment is coated for reflecting the XUV beam at the spectral range of harmonics H11–H17. A piezoelectric actuator controls the position of the inner segment, providing an accurate delay control between the XUV beam and the IR beam. Both beams are refocused into a gas cell filled with helium (20 Torr) to produce XUV-initiated HHG. The IR intensity at the helium gas cell is ( 7.8 ± 1.9 ) × 10 13 W cm 2 , which is insufficient for HHG without the assistance of the APT. Once both beams overlap temporally and spatially, we observe the generation of new harmonics above the helium ionization threshold.

2.2. Energy- and Delay-Resolved XUV-Initiated HHG Spectra

Figure 2a shows experimental HHG spectra without and with helium in the target gas cell. Without helium, only the spectrum of the incident harmonics generated in the xenon gas are visible, mainly H11 to H17, with a weak signal at H19 and H21. Note that the pedestal structures around H11–H17 in the spectrum are lens flare artifacts of the imaging system. In the presence of helium and for full temporal overlap of the XUV and IR fields, XUV-initiated HHG is clearly visible, ranging from H19 to H25. As we scan the delay, each harmonic shows intensity oscillations at a frequency equaling twice the IR frequency. Although only H17 possesses sufficient energy for direct photoionization of the helium atom; H11, H13, and H15 also strongly contribute to the XUV-initiated HHG as they excite the helium atom below the ionization threshold [24]. The cutoff around H25 is compatible with the IR intensity in the gas cell.
Scanning the XUV–IR delay provides insight into pulse envelope effects in the interplay between the IR pulse and the APT. Figure 3a shows experimental XUV-initiated HHG spectra as a function of the delay, in a logarithmic color plot (negative delay: XUV precedes the IR). The pedestal artifacts of Figure 2a are also visible in these spectra. The experimental results contain several characteristic spectral features that we will use in order to study the electron trajectories in detail. First, we observe a correspondence between the XUV–IR delay and the measured cutoff frequency (indicated by the white line in Figure 3a). Second, we identify spectral components with pronounced positive and negative frequency shifts in the range H17–H23, for negative and positive delays, respectively (marked by “A”). The magnitudes of the observed shifts reach 0.9 eV, more than half of the photon energy of the IR pulse. Third, the sub-cycle oscillations of the frequency-shifted spectral components are phase-shifted with respect to those of the unshifted part of the harmonics (marked by “B”). Finally, we observe a weak spectral tilt of the odd harmonics as a function of the delay. We note that we do not find any signatures of XUV free induction decay [30] or HHG by frustrated tunneling ionization [31] below the ionization threshold.

3. Theoretical Methods

In this section we introduce two theoretical models, the Coulomb-corrected three-step model (CCTSM) and a numerical integration of the time-dependent Schrödinger equation (TDSE).

3.1. Coulomb-Corrected Three-Step Model

HHG is well described by the Lewenstein model [7] and by the three-step model in the classical limit [5]. For a description of XUV-initiated HHG, the role of the XUV pulse in the ionization step, the influence of the Coulomb potential, and the role of the excited states must be accounted for. For that, a Coulomb-corrected three-step model for XUV-initiated HHG can be used [24]. Here the discrete harmonics of the incident APT lead to the excitation of a ground-state electron to the continuum. Motivated by theoretical predictions of strongly broadened excited states in the presence of a strong IR field [32,33], we describe the singly-excited states of helium as a continuum and allow XUV-driven transitions to those states. We note that in accordance with the results of Reference [24], we do not consider a difference between excitations to this effective continuum—driven by incident harmonics H11, H13, and H15—and photoionization to the continuum above the ionization threshold—driven by H17. After excitation, the electron propagates under the combined influence of the IR field and the Coulomb potential and undergoes over-the-barrier emission [34]. The photoelectron recollides with the ionic core, sending off its energy as an XUV photon. In the CCTSM, several quantum paths contribute to the emission of a final harmonic, in three distinct ways. First, each incident harmonic opens up an ionization channel, leading to the appearance of an electron in the continuum with a well-defined energy. Second, the liberated electron either receives a kick in the direction of the Lorentz force exerted by the IR field (“downhill” trajectory branch) or against it (“uphill” trajectory branch) [34]. Third, in analogy to tunneling-driven HHG, recollision is mediated by short and long trajectories. Quantum interference due to these multiple pathways leads to oscillations of the harmonic yield with changing XUV–IR delay. CCTSM is able to predict the delay-dependent sub-cycle oscillations and underlying phases of the contributing trajectories (for more information see Appendix A). An intrinsic interferometer in XUV-initiated HHG was used for reconstructing the photoionization dynamics in the presence of a strong IR field, finding good agreement between experiments and short-trajectory CCTSM calculations [24].

3.2. Numerical Integration of the Time-Dependent Schrödinger Equation

We calculate XUV-initiated HHG in helium using a numerical integration of the TDSE employing the QPROP solver [35]. In the single active electron approximation, the atomic potential of helium is well described by a parametrized model potential [36]. We use 787 nm laser pulses with a peak intensity of 8 × 10 13 W cm 2 and a FWHM intensity duration of 25 fs. The APT is modeled as a pulse train consisting of the H11–H17 harmonic orders, with a FWHM duration of 8 fs (for detailed definitions of the fields see Appendix B). We calculate the time-dependent dipole as a function of the XUV–IR delay Δ t and perform a Fourier transformation in order to retrieve the resulting XUV dipole spectrum. Here we do not include pulse propagation effects [11], but focus solely on the single-atom response in XUV-initiated HHG. Figure 2b shows the dipole spectrum calculated with the TDSE without and with the IR field at zero delay. XUV-initiated HHG is clearly visible, in good agreement with the experimental results although macroscopic effects are not included.

4. Discussion

In this section, we will compare the experimental results with the theoretical models and interpret the observed spectral features.

4.1. Variation of the HHG Cutoff

The cutoff variation observed in the experiments, as a function of delay, is due to the inherent intensity dependence of the HHG cutoff. The delay determines which part of the IR envelope overlaps with the APT, selecting a specific instantaneous IR intensity which drives the recollision process. We find good agreement with the cutoff law of the three-step model of HHG. The white dotted curve in Figure 3a indicates the cutoff corresponding to the intensity envelope of an IR pulse with the experimental parameters (25 fs, 8 × 10 13 W cm 2 ). The decoupling of ionization and recollision enables dynamical control over the cutoff energy in HHG.

4.2. Frequency Shifts of Short Trajectory Harmonics

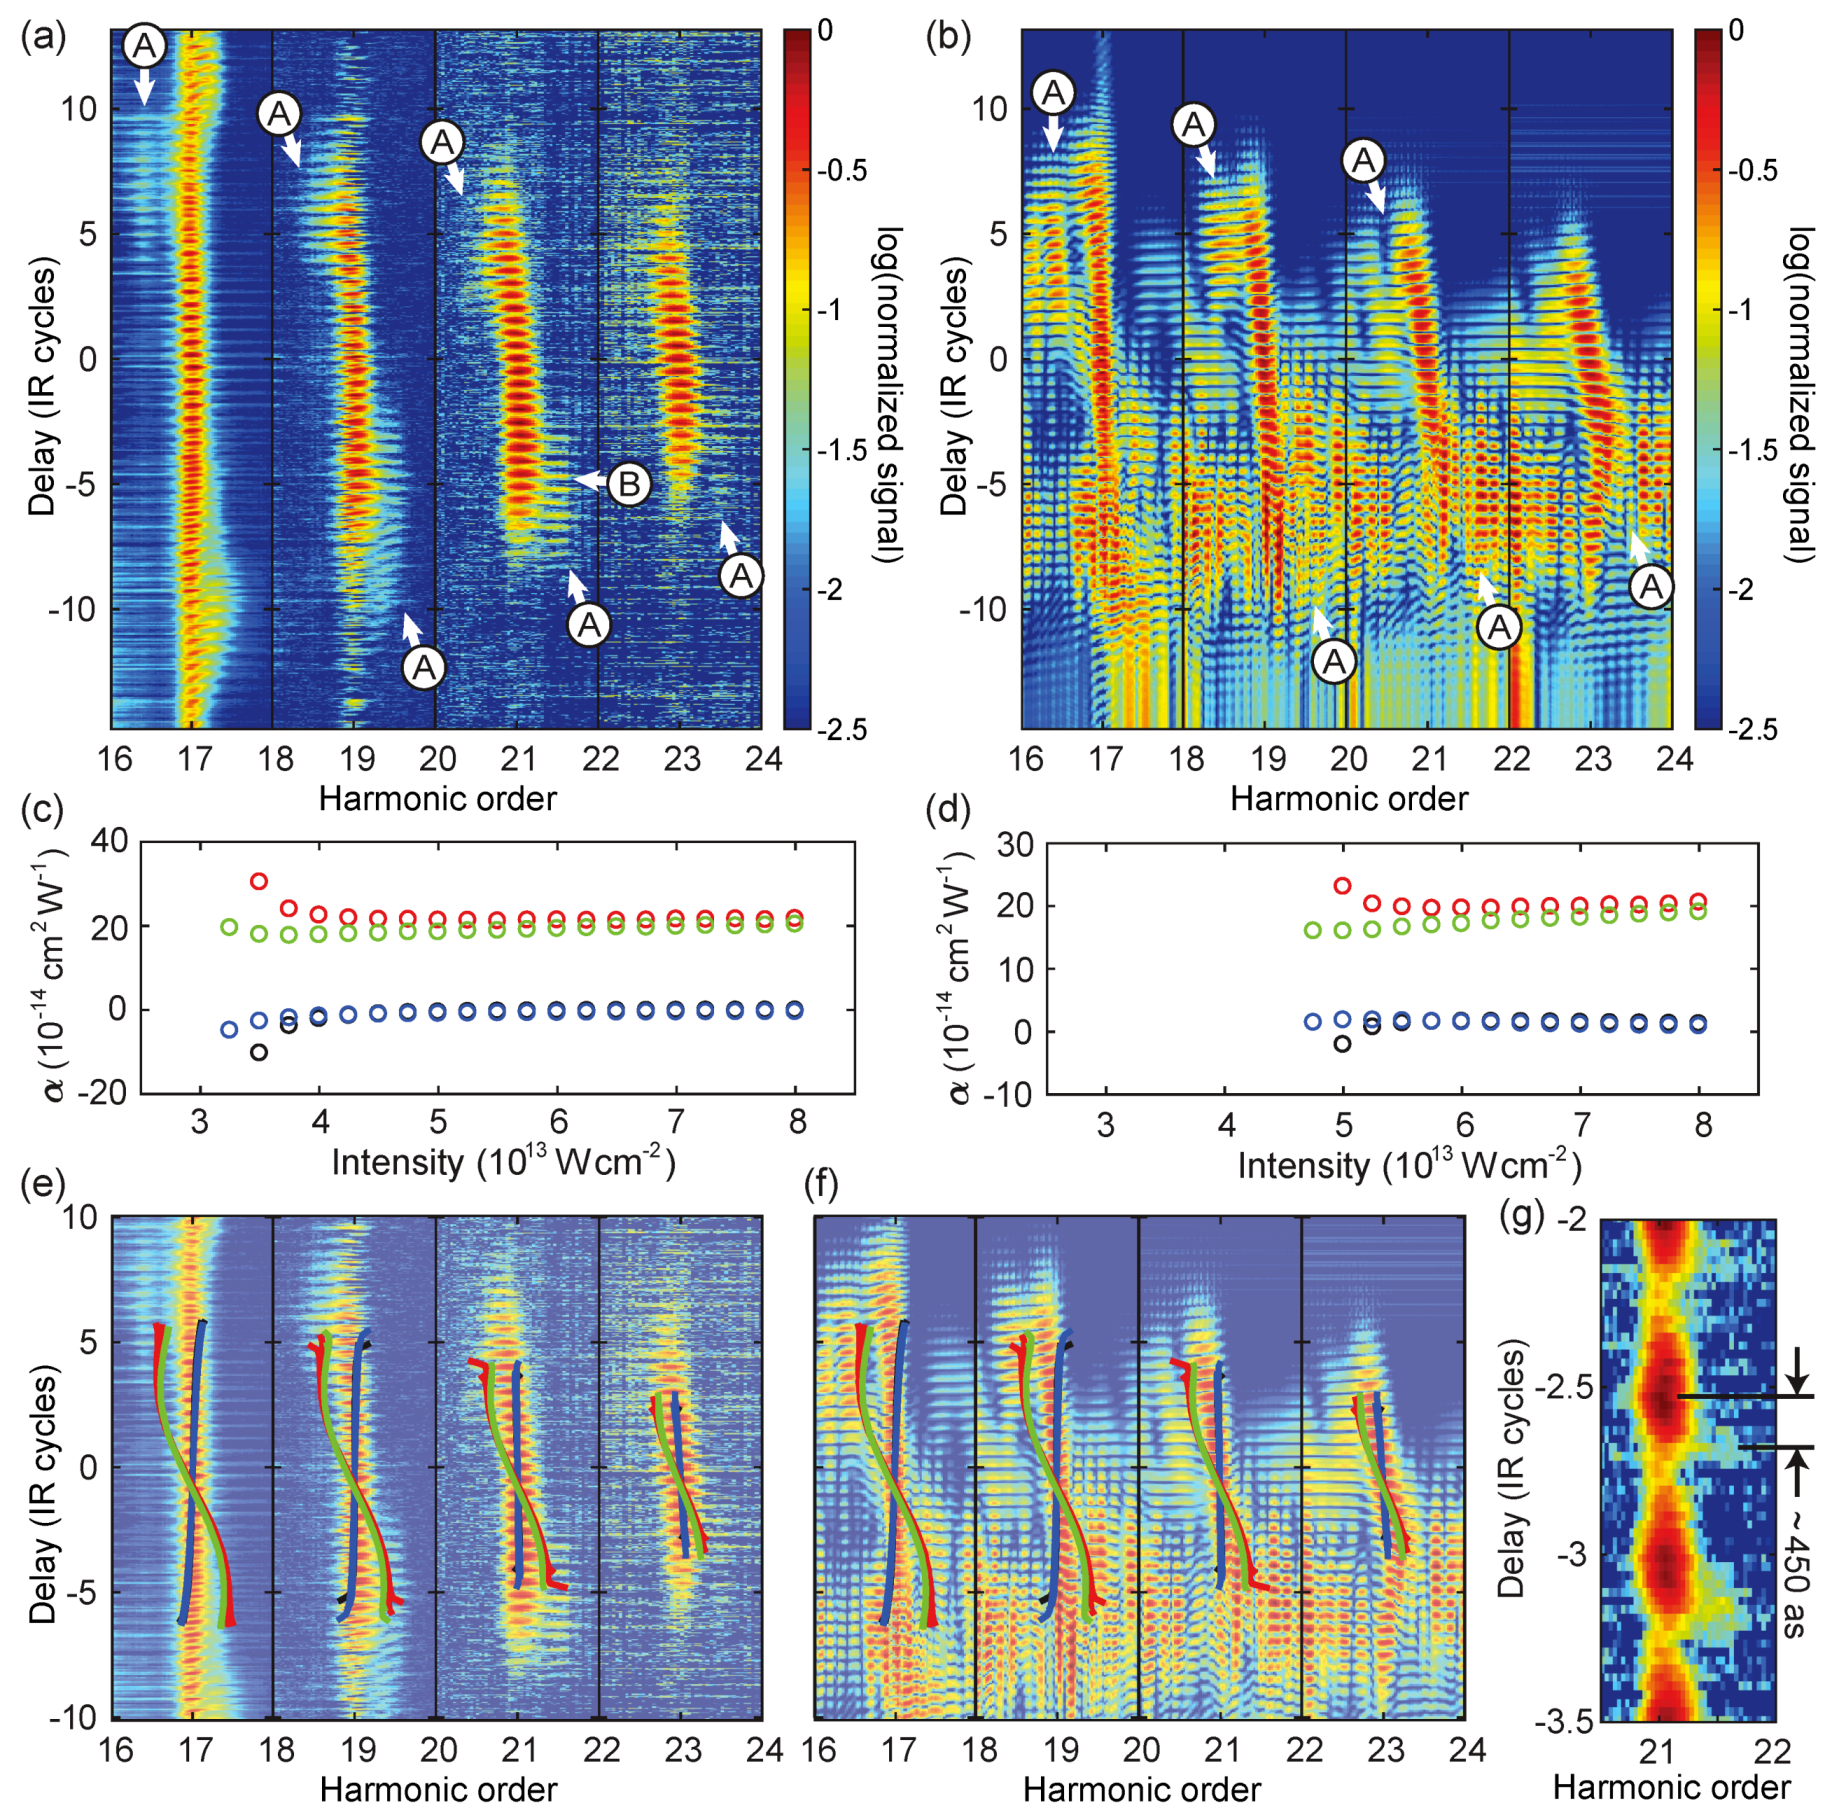
Here we investigate the origin of the weak delay-dependent spectral tilt of the odd harmonics in the range H19–H25 (Figure 3a). The TDSE calculation (Figure 3b) agrees well with the experiments and qualitatively reproduces all the experimental observations. Many features in the calculation, however, are not found in the experiments. For instance, we note the absence of strong inter-harmonic signal at negative delays between H21 and H23 at Δ t 7 IR cycles. We attribute this to the limitations of our single-atom response calculation, which does not suppress multiple-return trajectories [37]. In order to more clearly visualize the delay-dependent frequency shift effect on the odd harmonics, we show a normalized color plot for both the measured signal (Figure 4a) and the TDSE calculation (Figure 4b). The spectral tilt is clearly visible in both experimental and theoretical results and increases with ascending harmonic order. The spectral tilt in the TDSE calculation is comparatively steeper than the experimental one. This difference can be attributed to an additional chirp of the IR pulse in the experiment [15] and the choice of the IR envelope function as a squared-cosine pulse in the TDSE.
The measured delay-dependent frequency shift enables us to determine the α parameter for each spectral component directly from the experiments. Scanning Δ t controls the overlap of the APT with the IR envelope, which determines the instantaneous IR intensity and the time window when photoelectrons are produced. Therefore, we can associate the delay with a mean ionization time t ¯ 0 Δ t and a recollision time t ¯ 1 Δ t + t travel . Here, we approximate the travel time t travel with a cutoff trajectory, t travel 0.6 T opt , where T opt is the optical cycle duration of the IR field. We can establish a relationship between the frequency shift and the delay for a specific trajectory:
δ Ω ( Δ t ) α I ( t ) t | Δ t + 0.6 T opt .
We retrieve α parameters corresponding to specific positions ( δ Ω , Δ t ) in the spectrum, assuming a cosine-square IR field envelope function as in the TDSE. From Equation (1), we estimate α = ( 4 ± 2 ) × 10 14 cm 2 W 1 for the spectral tilts of H19, H21, and H23. The lower bound of this range is in agreement with short trajectory α parameters in tunneling-driven HHG [13,16]. In agreement with previous studies [22,24], we conclude that the trajectory picture of HHG is valid in XUV-initiated HHG and that short trajectories dominate the odd harmonic signal.
In addition, we compare our experimental findings with the CCTSM, which takes Coulomb effects and the XUV excitation into account. To this end, we calculate the α parameter for the “downhill” and “uphill” short trajectories. Figure 4c,d show α for H19 and H21, respectively, with incident harmonic H15. We find that α is nearly constant with intensity. In order to compare the experimental and CCTSM results, we determine δ Ω for XUV-initiated HHG from incident harmonics H13 and H15, assuming again a 25 fs pulse. Figure 4e,f display the CCTSM results, overlaid with the experimental and TDSE results, respectively. Downhill (black curves) and uphill (blue curves) short trajectories yield almost indistinguishable frequency shifts. The calculated tilt is in good agreement with experiments and the TDSE for H23, while at lower harmonics the slope of the calculated tilt decreases and changes sign, unlike the experimental observations.

4.3. Frequency Shifts of Long Trajectory Harmonics

Figure 4a reveals that some HHG signals are strongly shifted with respect to the harmonic frequencies (marked by “A” in Figure 4a,b). Particularly in H19, the effect is very pronounced, with a total shift up to half a harmonic order. At negative delays, we find a strong blue shift, whereas at positive delays a red shift dominates. Converting the frequency shifts to α parameters (Equation (1)) yields α 24 ± 8 × 10 14 cm 2 W 1 , reflecting the contribution of long trajectories [13,16]. Indeed, the α parameters and frequency shifts of long trajectories calculated by the CCTSM model are in good agreement with experiments and the TDSE (see Figure 4c–f). Here, downhill and uphill long trajectories yield similar values, with downhill long trajectories creating a slightly larger frequency shift than uphill long trajectories.
The qualitative agreement between the experiments and the CCTSM also suggests that the strongly frequency-shifted feature found at H16.4 for Δ t ∼+7 IR cycles is due to a long trajectory (see Figure 4e). The experimental α parameter extracted at Δ t ∼6.2 IR cycles is 34 × 10 14 cm 2 W 1 . A similar feature is found in the TDSE calculation (see Figure 4b), albeit at smaller delays. The IR intensity at Δ t ∼6.2 IR cycles in our model pulse is about 2 × 10 13 W cm 2 , which means that the excited states of helium are still intact and cannot be described as a quasi-continuum as in the CCTSM. We propose that the mechanism of XUV-initiated HHG is slightly different in this case. Here, the XUV field transfers a population to a discrete excited state of helium, for example the 2 p state, which is in resonance with H15. Subsequently, the electron is accelerated from the excited state and recombines to the ground state under the influence of the IR field. This process is known as excited-state HHG and has been observed in IR-driven HHG from argon [38].

4.4. Time Delay between Short and Long Trajectories

The spectral separation between long and short trajectory HHG signals enables a comparison of their sub-cycle oscillations with XUV–IR delay. The interference of quantum paths from different ionization channels, corresponding to the harmonics of the incident XUV pulse train, leads to oscillations of the HHG signal with Δ t . The phase information of these oscillations was used to reconstruct the temporal buildup of the electron wavepacket in the presence of the strong IR field [24]. To this end, the oscillations of the XUV-initiated HHG signal were analyzed around Δ t = 0 where short trajectories dominate. In the present work, we focus on the sub-cycle oscillation delays between the long and short trajectories, which are present when Δ t is tuned to the rising or falling edge of the IR pulse. A clear shift is visible in H19 and H21, where the XUV–IR oscillations of the short trajectories lag behind those of the strongly shifted long trajectories. Figure 4g shows the spectra zoomed into H21 for an XUV–IR delay of 3 IR cycles. Here, we find a delay of about 450 as between the short trajectories and the blue-shifted long trajectories. This value is in qualitative agreement with the CCTSM calculations. Assuming that the same ionization channels are responsible for short and long trajectories, we find a delay of about 250 as for an instantaneous intensity of 6.5 × 10 13 W cm 2 , with the short trajectories lagging behind the long ones. This observation is consistent with the fact that the ionization times of the long trajectories precede those of the short trajectories in the three-step picture.

5. Conclusions and Outlook

In summary, we resolve the intensity dependence of XUV-initiated HHG, demonstrating that it plays an important role in tuning the central frequencies of the emitted harmonics. The multidimensionality of the measurement, where we control the XUV–IR delay and therefore the instantaneous intensity, allows us to isolate the role of both the short and long trajectories and resolve their sub-cycle dependences. The agreement between the experimental results and the theoretical calculations provides an important validation of the underlying mechanism—indeed XUV-initiated HHG can be described via a semiclassical three-step model, reflecting its close analogy with tunneling-driven HHG.
Looking ahead, XUV-initiated HHG has the potential to be a powerful spectroscopic method for ultrafast dynamics. It lifts the limitations of tunneling-driven HHG, not only by decoupling ionization and recollision, but also giving access to inner-shell electrons within the framework of HHG spectroscopy [39,40,41,42]. The observation of long trajectories and the ability to isolate them from short trajectories extends the range of the attosecond clock provided by the travel time of the electrons. Using mid-infrared driving pulses, the range of the clock might span up to ten femtoseconds, sufficient to observe Auger decay processes.

Author Contributions

N.D. conceived and supervised the study; D.A. designed the experimental setup; D.A. and M.K. built the experimental setup, performed the experiments and analyzed the data; M.K. performed the theoretical calculations; B.D.B. supported the operation of the laser system; All authors discussed the results and contributed to the final manuscript.

Funding

N.D. is the incumbent of the Robin Chemers Neustein Professorial Chair. N.D. acknowledges the Minerva Foundation, the Israeli Science Foundation, the Crown Center of Photonics, and the European Research Council for financial support. M.K. acknowledges financial support from the Minerva Foundation and the Koshland Foundation.

Acknowledgments

We acknowledge helpful discussions with Ken Schafer, Mette Gaarde, and Thomas Pfeifer.

Conflicts of Interest

The authors declare no conflict of interest.

Abbreviations

The following abbreviations are used in this manuscript:
CCTSMCoulomb-corrected three-step model
FWHMFull-width at half maximum
HHarmonic
HHGHigh-harmonic generation
IRInfrared
RABBITTReconstruction of attosecond beating by interference of two-photon transitions
TDSETime-dependent Schrödinger equation
XFROGCross-correlation frequency resolved optical gating
XUVExtreme ultraviolet

Appendix A. Harmonic Phase in the Coulomb-Corrected Three-Step Model

Here we describe the calculation of the trajectories, the harmonic phase, and the delay-dependent sub-cycle oscillations in the CCTSM. For convenience, we use atomic (Hartree) units throughout this paragraph ( e = = m = 1 ). In the CCTSM, trajectories are determined by numerical integration of Newton’s equation of motion with a combined Coulomb-laser potential in one dimension. Helium is modeled by a soft core potential [43]:
V ( z ) = Z eff a 2 + z 2 ,
where z is the radial coordinate, Z eff = 1.353 is the effective charge, and a 2 = 0.001 is the soft core parameter. We also tested other model potentials, e.g., [36], but did not find a significant difference. Each incident harmonic n of the IR driver gives rise to an ionization channel. For each ionization channel, electrons are released at the origin ( z = 0 ) with initial velocities v 0 = ± 2 ( I p V ( 0 ) + n ω ) , with the sign reflecting the ambiguity of downhill and uphill trajectory branches ( I p : atomic ionization potential; ω : angular frequency of the IR field). Numerical integration then gives rise to long and short trajectories, with ionization times t 0 ( i ) and recollison times t 1 ( i ) . The phase of an outgoing harmonic N is dictated by a specific ionization channel associated with the incident harmonic n and a specific trajectory (index i):
ϕ ( i ) ( N ω ) = N ω t 1 ( i ) S ( t 1 ( i ) , t 0 ( i ) ) I p t 1 ( i ) t 0 ( i ) n ω t 0 ( i ) ,
where S ( t 1 ( i ) , t 0 ( i ) ) is the classical action accumulated by the electron along its trajectory. The sub-cycle oscillations with XUV–IR delay follow from a coherent summation of all trajectories producing the outgoing harmonic N. For the comparison of long and short trajectories (see Section 4.4), we sum downhill and uphill trajectories corresponding to all four ionization channels, weighted by their quantum diffusion. We employ the reconstructed ionization channel transition amplitudes from Reference [24].

Appendix B. Pulse Parameters for the Numerical Integration of the TDSE

Here we detail the definitions of the light fields employed in the TDSE calculations. The IR field is given by:
E IR = E IR , 0 cos 2 ω t 2 N IR cos ω t ,
where E IR , 0 = 44.7 V nm 1 is the amplitude and ω is the angular frequency of the IR field. A cycle number of N IR = 26 results in a pulse with a duration of 25 fs (FWHM intensity duration).
The APT is modeled as a pulse train consisting of harmonic orders H11–H17 with a cos 4 envelope function. The APT is defined by its vector potential:
A XUV ( t ) = A XUV , 0 cos 4 ω ( t Δ t ) 2 N XUV n a n cos [ n ω ( t Δ t ) ] ,
with the XUV–IR delay Δ t ; the cycle number is N XUV = 12 , which corresponds to an APT duration τ XUV = 8 fs (FWHM intensity duration); and the total vector potential amplitude is A XUV , 0 = 1.1 × 10 7 V m 1 s 1 , which corresponds to an APT peak intensity of 1 × 10 10 W cm 2 . The intensity of the APT is in the linear regime of XUV excitation. The partial amplitudes a n are given by a 11 = 0.2214 , a 13 = 0.4227 , a 15 = 0.3172 , and a 17 = 0.0432 . We calculate the time-dependent dipole d ( t ) as a function of XUV–IR delay and perform a Fourier transformation in order to retrieve the resulting XUV dipole spectrum S ( Ω ) = Ω 4 | d ( Ω ) | 2 , where Ω is the angular frequency.

References

  1. Corkum, P.B.; Krausz, F. Attosecond science. Nat. Phys. 2007, 3, 381–387. [Google Scholar] [CrossRef]
  2. Krausz, F.; Ivanov, M. Attosecond physics. Rev. Mod. Phys. 2009, 81, 163–234. [Google Scholar] [CrossRef]
  3. Calegari, F.; Sansone, G.; Stagira, S.; Vozzi, C.; Nisoli, M. Advances in attosecond science. J. Phys. B Atom. Mol. Opt. Phys. 2016, 49, 062001. [Google Scholar] [CrossRef] [Green Version]
  4. Ferray, M.; L’Huillier, A.; Li, X.F.; Lompre, L.A.; Mainfray, G.; Manus, C. Multiple-harmonic conversion of 1064 nm radiation in rare gases. J. Phys. B Atom. Mol. Opt. Phys. 1988, 21, L31–L35. [Google Scholar] [CrossRef]
  5. Corkum, P.B. Plasma perspective on strong field multiphoton ionization. Phys. Rev. Lett. 1993, 71, 1994–1997. [Google Scholar] [CrossRef] [PubMed] [Green Version]
  6. Schafer, K.J.; Yang, B.; DiMauro, L.F.; Kulander, K.C. Above threshold ionization beyond the high harmonic cutoff. Phys. Rev. Lett. 1993, 70, 1599–1602. [Google Scholar] [CrossRef]
  7. Lewenstein, M.; Balcou, P.; Ivanov, M.Y.; L’Huillier, A.; Corkum, P.B. Theory of High-harmonic Generation by Low-frequency Laser Fields. Phys. Rev. A 1994, 49, 2117–2132. [Google Scholar] [CrossRef]
  8. Bellini, M.; Lyngå, C.; Tozzi, A.; Gaarde, M.B.; Hänsch, T.W.; L’Huillier, A.; Wahlström, C.G. Temporal Coherence of Ultrashort High-Order Harmonic Pulses. Phys. Rev. Lett. 1998, 81, 297–300. [Google Scholar] [CrossRef] [Green Version]
  9. Gaarde, M.B.; Salin, F.; Constant, E.; Balcou, P.; Schafer, K.J.; Kulander, K.C.; L’Huillier, A. Spatiotemporal separation of high harmonic radiation into two quantum path components. Phys. Rev. A 1999, 59, 1367–1373. [Google Scholar] [CrossRef] [Green Version]
  10. Salières, P.; Carré, B.; Le Déroff, L.; Grasbon, F.; Paulus, G.G.; Walther, H.; Kopold, R.; Becker, W.; Milošević, D.B.; Sanpera, A.; et al. Feynman’s Path-Integral Approach for Intense-Laser-Atom Interactions. Science 2001, 292, 902–905. [Google Scholar] [CrossRef]
  11. Gaarde, M.B.; Tate, J.L.; Schafer, K.J. Macroscopic aspects of attosecond pulse generation. J. Phys. B Atom. Mol. Opt. Phys. 2008, 41, 132001. [Google Scholar] [CrossRef]
  12. Zaïr, A.; Holler, M.; Guandalini, A.; Schapper, F.; Biegert, J.; Gallmann, L.; Keller, U.; Wyatt, A.S.; Monmayrant, A.; Walmsley, I.A.; et al. Quantum Path Interferences in High-Order Harmonic Generation. Phys. Rev. Lett. 2008, 100, 143902. [Google Scholar] [CrossRef] [PubMed]
  13. Balcou, P.; Dederichs, A.S.; Gaarde, M.B.; L’Huillier, A. Quantum-path analysis and phase matching of high-order harmonic generation and high-order frequency mixing processes in strong laser fields. J. Phys. B Atom. Mol. Opt. Phys. 1999, 32, 2973. [Google Scholar] [CrossRef]
  14. Mairesse, Y.; de Bohan, A.; Frasinski, L.J.; Merdji, H.; Dinu, L.C.; Monchicourt, P.; Breger, P.; Kovačev, M.; Taïeb, R.; Carré, B.; et al. Attosecond Synchronization of High-Harmonic Soft X-rays. Science 2003, 302, 1540–1543. [Google Scholar] [CrossRef] [PubMed]
  15. Mauritsson, J.; Johnsson, P.; López-Martens, R.; Varjú, K.; Kornelis, W.; Biegert, J.; Keller, U.; Gaarde, M.B.; Schafer, K.J.; L’Huillier, A. Measurement and control of the frequency chirp rate of high-order harmonic pulses. Phys. Rev. A 2004, 70, 021801. [Google Scholar] [CrossRef]
  16. Varjù, K.; Mairesse, Y.; Carré, B.; Gaarde, M.B.; Johnsson, P.; Kazamias, S.; López-Martens, R.; Mauritsson, J.; Schafer, K.J.; Balcou, P.; et al. Frequency chirp of harmonic and attosecond pulses. J. Mod. Opt. 2005, 52, 379–394. [Google Scholar] [CrossRef]
  17. Corsi, C.; Pirri, A.; Sali, E.; Tortora, A.; Bellini, M. Direct Interferometric Measurement of the Atomic Dipole Phase in High-Order Harmonic Generation. Phys. Rev. Lett. 2006, 97, 023901. [Google Scholar] [CrossRef] [PubMed]
  18. Schafer, K.J.; Gaarde, M.B.; Heinrich, A.; Biegert, J.; Keller, U. Strong Field Quantum Path Control Using Attosecond Pulse Trains. Phys. Rev. Lett. 2004, 92, 023003. [Google Scholar] [CrossRef] [PubMed]
  19. Gaarde, M.B.; Schafer, K.J.; Heinrich, A.; Biegert, J.; Keller, U. Large enhancement of macroscopic yield in attosecond pulse train-assisted harmonic generation. Phys. Rev. A 2005, 72, 013411. [Google Scholar] [CrossRef]
  20. Biegert, J.; Heinrich, A.; Hauri, C.P.; Kornelis, W.; Schlup, P.; Anscombe, M.P.; Gaarde, M.B.; Schafer, K.J.; Keller, U. Control of high-order harmonic emission using attosecond pulse trains. J. Mod. Opt. 2006, 53, 87–96. [Google Scholar] [CrossRef] [Green Version]
  21. Heinrich, A.; Kornelis, W.; Anscombe, M.P.; Hauri, C.P.; Schlup, P.; Biegert, J.; Keller, U. Enhanced VUV-assisted high harmonic generation. J. Phys. B Atom. Mol. Opt. Phys. 2006, 39, S275–S281. [Google Scholar] [CrossRef]
  22. Gademann, G.; Kelkensberg, F.; Siu, W.K.; Johnsson, P.; Gaarde, M.B.; Schafer, K.J.; Vrakking, M.J.J. Attosecond control of electron-ion recollision in high harmonic generation. New J. Phys. 2011, 13, 033002. [Google Scholar] [CrossRef]
  23. Brizuela, F.; Heyl, C.; Rudawski, P.; Kroon, D.; Rading, L.; Dahlström, J.; Mauritsson, J.; Johnsson, P.; Arnold, C.; L’Huillier, A. Efficient high-order harmonic generation boosted by below-threshold harmonics. Sci. Rep. 2013, 3, 1410. [Google Scholar] [CrossRef] [PubMed] [Green Version]
  24. Azoury, D.; Krüger, M.; Orenstein, G.; Larsson, H.R.; Bauch, S.; Bruner, B.D.; Dudovich, N. Self-probing spectroscopy of XUV photo-ionization dynamics in atoms subjected to a strong-field environment. Nat. Commun. 2017, 8, 1453. [Google Scholar] [CrossRef] [PubMed] [Green Version]
  25. Johnsson, P.; Mauritsson, J.; Remetter, T.; L’Huillier, A.; Schafer, K.J. Attosecond Control of Ionization by Wave-Packet Interference. Phys. Rev. Lett. 2007, 99, 233001. [Google Scholar] [CrossRef] [PubMed]
  26. Mauritsson, J.; Johnsson, P.; Mansten, E.; Swoboda, M.; Ruchon, T.; L’Huillier, A.; Schafer, K.J. Coherent Electron Scattering Captured by an Attosecond Quantum Stroboscope. Phys. Rev. Lett. 2008, 100, 073003. [Google Scholar] [CrossRef] [PubMed]
  27. Miaja-Avila, L.; Saathoff, G.; Mathias, S.; Yin, J.; La-o vorakiat, C.; Bauer, M.; Aeschlimann, M.; Murnane, M.M.; Kapteyn, H.C. Direct Measurement of Core-Level Relaxation Dynamics on a Surface-Adsorbate System. Phys. Rev. Lett. 2008, 101, 046101. [Google Scholar] [CrossRef] [PubMed]
  28. Radcliffe, P.; Arbeiter, M.; Li, W.B.; Düsterer, S.; Redlin, H.; Hayden, P.; Hough, P.; Richardson, V.; Costello, J.T.; Fennel, T.; et al. Atomic photoionization in combined intense XUV free-electron and infrared laser fields. New J. Phys. 2012, 14, 043008. [Google Scholar] [CrossRef] [Green Version]
  29. Schütte, B.; Arbeiter, M.; Mermillod-Blondin, A.; Vrakking, M.J.J.; Rouzée, A.; Fennel, T. Ionization Avalanching in Clusters Ignited by Extreme-Ultraviolet Driven Seed Electrons. Phys. Rev. Lett. 2016, 116, 033001. [Google Scholar] [CrossRef]
  30. Bengtsson, S.; Larsen, E.W.; Kroon, D.; Camp, S.; Miranda, M.; Arnold, C.L.; L’Huillier, A.; Schafer, K.J.; Gaarde, M.B.; Rippe, L.; et al. Space-time control of free induction decay in the extreme ultraviolet. Nat. Photonics 2017, 11, 252–258. [Google Scholar] [CrossRef]
  31. Yun, H.; Mun, J.H.; Hwang, S.I.; Park, S.B.; Ivanov, I.A.; Nam, C.H.; Kim, K.T. Coherent extreme-ultraviolet emission generated through frustrated tunnelling ionization. Nat. Photonics 2018, 12, 620–624. [Google Scholar] [CrossRef]
  32. He, F.; Ruiz, C.; Becker, A.; Thumm, U. Attosecond probing of instantaneous ac Stark shifts in helium atoms. J. Phys. B Atom. Mol. Opt. Phys. 2011, 44, 211001. [Google Scholar] [CrossRef] [Green Version]
  33. Singh, K.P.; Rost, J.M. Global control of attosecond photoionization of atoms through XUV dispersion. Phys. Rev. A 2015, 91, 013415. [Google Scholar] [CrossRef]
  34. Hostetter, J.A.; Tate, J.L.; Schafer, K.J.; Gaarde, M.B. Semiclassical approaches to below-threshold harmonics. Phys. Rev. A 2010, 82, 023401. [Google Scholar] [CrossRef]
  35. Bauer, D.; Koval, P. Qprop: A Schrödinger-solver for intense laser-atom interaction. Comput. Phys. Commun. 2006, 174, 396–421. [Google Scholar] [CrossRef]
  36. Tong, X.M.; Lin, C.D. Empirical formula for static field ionization rates of atoms and molecules by lasers in the barrier-suppression regime. J. Phys. B Atom. Mol. Opt. Phys. 2005, 38, 2593. [Google Scholar] [CrossRef]
  37. Hernández-García, C.; Plaja, L. Resolving multiple rescatterings in high-order-harmonic generation. Phys. Rev. A 2016, 93, 023402. [Google Scholar] [CrossRef]
  38. Beaulieu, S.; Camp, S.; Descamps, D.; Comby, A.; Wanie, V.; Petit, S.; Légaré, F.; Schafer, K.J.; Gaarde, M.B.; Catoire, F.; et al. Role of Excited States In High-order Harmonic Generation. Phys. Rev. Lett. 2016, 117, 203001. [Google Scholar] [CrossRef] [PubMed]
  39. Leeuwenburgh, J.; Cooper, B.; Averbukh, V.; Marangos, J.P.; Ivanov, M.Y. High-Order Harmonic Generation Spectroscopy of Correlation-Driven Electron Hole Dynamics. Phys. Rev. Lett. 2013, 111, 123002. [Google Scholar] [CrossRef]
  40. Leeuwenburgh, J.; Cooper, B.; Averbukh, V.; Marangos, J.P.; Ivanov, M.Y. Reconstruction of correlation-driven electron-hole dynamics by high-harmonic-generation spectroscopy. Phys. Rev. A 2014, 90, 033426. [Google Scholar] [CrossRef]
  41. Brown, A.C.; van der Hart, H.W. Extreme-Ultraviolet-Initated High-Order Harmonic Generation: Driving Inner-Valence Electrons Using Below-Threshold-Energy Extreme-Ultraviolet Light. Phys. Rev. Lett. 2016, 117, 093201. [Google Scholar] [CrossRef] [PubMed]
  42. Clarke, D.D.A.; van der Hart, H.W.; Brown, A.C. Extreme-ultraviolet-initiated high-order harmonic generation in Ar+. Phys. Rev. A 2018, 97, 023413. [Google Scholar] [CrossRef]
  43. Chen, S.; Ruiz, C.; Becker, A. Double ionization of helium by intense near-infrared and VUV laser pulses. Phys. Rev. A 2010, 82, 033426. [Google Scholar] [CrossRef]
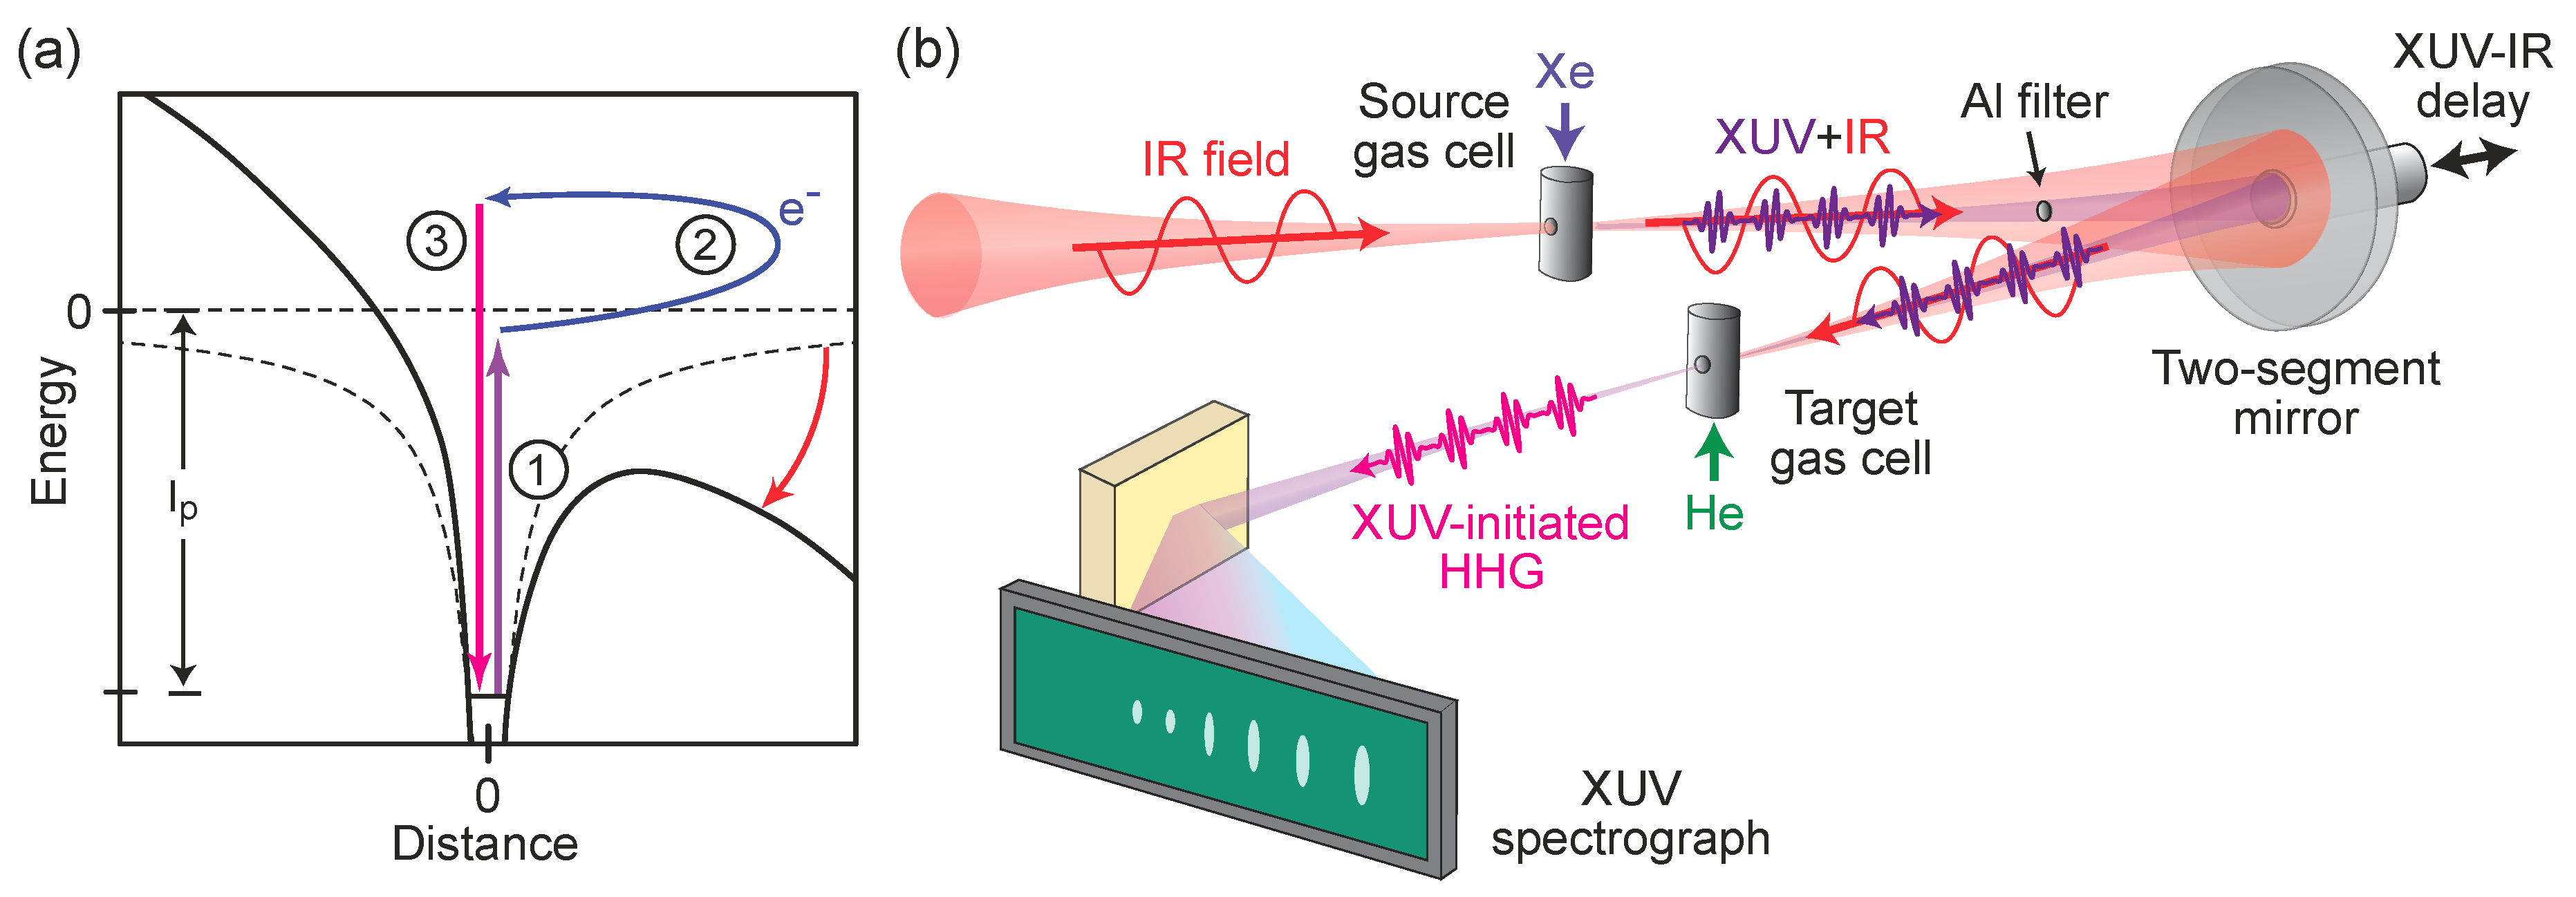
Figure 1. Principle of extreme ultraviolet (XUV)-initiated high-harmonic generation (HHG). (a) The absorption of an XUV photon (violet arrow) promotes an electron to the vicinity of the ionization threshold I p (step 1). A strong infrared (IR) field drives the electron on a recollision trajectory (step 2), leading to the emission of an XUV photon with higher energy (pink arrow; step 3). (b) Experimental setup. An IR laser pulse (red waveform) is focused into a gas cell filled with xenon, producing an attosecond XUV pulse train (violet waveform). A thin aluminum filter spatially separates the XUV and IR fields. A two-segment mirror controls the delay between the two fields and refocuses the beams into the target gas cell, filled with helium. The resulting XUV-initiated high harmonics (pink waveform) are spectrally analyzed in an XUV grating spectrograph.
Applsci 09 00378 g001
Figure 2. XUV-initiated HHG spectra in experiments and theory. (a) Experimental data. Measured spectrum without (red curve) and with (blue curve) helium in the target gas cell. XUV-initiated HHG is clearly visible up to H25. H11–H15 exhibit pronounced pedestal structures that are due to an experimental artifact. (b) Time-dependent Schrödinger equation (TDSE) calculation results. Dipole spectrum without (red curve) and with (blue curve) the IR field.
Applsci 09 00378 g002
Figure 3. XUV-initiated HHG spectra as a function of the XUV–IR delay. (a) Experimental data. The arrows indicate characteristic features in the spectrum: A, strongly frequency-shifted spectral components, with positive (negative) shifts for negative (positive) XUV–IR delays; B, sub-cycle temporal delay of the oscillations of the shifted spectral components with respect to odd harmonic signals. The white dotted curve sketches the cutoff as it follows the envelope of the 25 fs IR pulse. The pedestal artifacts from Figure 2 are also visible in this plot. (b) TDSE calculation results. The characteristic features are also found in the single atom response calculation. Some TDSE features are not found in the experiment, for example most of the signal is between the odd harmonics at negative delays. As a guide to the eye we display white-dashed boxes around the A-type features found in the experiments.
Applsci 09 00378 g003
Figure 4. Delay-dependent frequency shifts around harmonics H17 to H23. (a) Experimental data. We normalize the signal for each harmonic order separately. The arrows indicate characteristic features in the spectrum: A, strongly frequency-shifted spectral components, with positive (negative) shifts for negative (positive) XUV–IR delays; B, sub-cycle temporal delay of the oscillations of the shifted spectral components with respect to the odd harmonic signal. (b) TDSE calculation results. (c) The Coulomb-corrected three-step model (CCTSM) α parameter for H19 as a function of intensity. The black (blue) circles indicate downhill (uphill) short trajectories and the red (green) circles indicate downhill (uphill) long trajectories. (d) The same as frame (c), but for H21. (e) CCTSM results overlaid with the experimental color plot. The black (blue) curves indicate downhill (uphill) short trajectories and the red (green) curves indicate downhill (uphill) long trajectories. (f) CCTSM results overlaid with the TDSE color plot. (g) Zoom into H21 from frame (a). The XUV–IR oscillations of the short trajectories are lagging behind those of the much fainter blue-shifted long trajectories by about 450 as.
Applsci 09 00378 g004