Article

Angiography Simulation and Planning Using a Multi-Fluid Approach

1
Shanghai Film Academy, Shanghai University, Shanghai 200072, China
2
Département d’informatique et de recherche opérationnelle, Université de Montréal, Montréal, QC H3C 3J7, Canada
3
The Faculty of Science, Design and Technology, Pool House, University of Bournemouth, Poole BH12 5BB, UK
4
The Faculty of Engineering and Informatics, University of Bradford, Bradford BD7 1DP, UK
*
Author to whom correspondence should be addressed.
Appl. Sci. 2019, 9(3), 379; https://doi.org/10.3390/app9030379
Submission received: 29 November 2018 / Revised: 27 December 2018 / Accepted: 16 January 2019 / Published: 22 January 2019
(This article belongs to the Section Applied Biosciences and Bioengineering)

Abstract

:
Angiography is a minimally invasive diagnostic procedure in endovascular interventions. Training interventional procedures is a big challenge, due to the complexity of the procedures with the changes of measurement and visualization in blood flow rate, volume, and image contrast. In this paper, we present a novel virtual reality-based 3D interactive training platform for angiography procedure training. We propose a multi-fluid flow approach with a novel corresponding non-slip boundary condition to simulate the effect of diffusion between the blood and contrast media. A novel syringe device tool is also designed as an add-on hardware to the 3D software simulation system to model haptics through real physical interactions to enhance the realism of the simulation-based training. Experimental results show that the system can simulate realistic blood flow in complex blood vessel structures. The results are validated by visual comparisons between real angiography images and simulations. By combining the proposed software and hardware, our system is applicable and scalable to many interventional radiology procedures. Finally, we have tested the system with clinicians to assess its efficacy for virtual reality-based medical training.

1. Introduction

Cardiovascular diseases are the number-one cause of death in the developed world. Endovascular intervention is a modern treatment to the condition with advantages of limited hemorrhage, minimal wound, faster recovery, and fewer complications compared with traditional open surgery [1]. Angiography is an essential examination procedure in endovascular interventions to obtain clear medical images of lesion locations to assess the cardiovascular damage, and to identify the location of tumors and peripheral vascular narrowing [2]. Training of angiography and indeed endovascular interventions in general is a big challenge, due to limited training resources and the complexity of the procedure. Virtual reality-based training has become an alternative for medical training. With computer-based simulators, students can practice some basic skills repeatedly with multiple medical cases and computerized objective assessments. However, the simulation realism (i.e., how well the simulation results can closely represent the real-life cases) remains a big challenge. The realism of virtual reality-based training systems is determined by simulation software and hardware system (e.g., haptics and physical feedback). This paper addressed the challenge from both software and hardware aspects.
Luboz et al. [3] mainly focused on training techniques before angiography and proposed a simulator for Seldinger technique, in which a simulated pulse was included for needle puncture palpation and two haptic devices were used for the insertion of guidewire and catheter. Duriez et al. [4] modelled catheters using a finite element model (FEM) and adopted Poiseuille’s law to compute the vascular flow with an advection equation for contrast media propagation. Wang et al. [5] have taken into account the Newton’s laws and other main properties of guidewires and used centerlines for contrast media propagation. These previous works, however, have not dealt with the influence of contrast media injection dosage, injection speed, and dynamic interactions between the complex two-fluids flow and complex vascular structures, which are important aspects for realistic angiography simulations. A syringe device with a constant injection speed has been described in [6], the contrast media was modelled as radius-adaptive particles along vascular centerlines, and the propagation of the particles was controlled under the blood flow via Poisseuille’s law, but the simulation was limited with a constant injection speed.
Validation of simulation-based training systems by medical doctors who are the end users of the systems are critical for any system to be adopted in clinic practice. The commercial simulator “Vascular Interventional System Trainer (VIST)” has been evaluated by physicians [7,8]. This simulator consists of a mannequin, two monitors, joysticks for controlling fluoroscopy and a syringe for the injection of contrast media. From a recent related patent [9] of this system, the blood vessel was constructed as several vessel segments by an arranged hierarchy, such as unilateral stenosis of blood vesselswhich hardly presents the complex property of blood vessels. Furthermore, the diffusion simulation of the contrast media was implemented by a mapping table executed in a pre-processor with pre-designed and segmented blood vessels. Although this method can quickly simulate a plausible angiography effect, it is hard to simulate and analyze the statue of the fluid flow at complex lesion locations in real blood vessels using this method. In our prior work [10,11], we have used patient blood vessel models generated from 3D rotational X-ray images in a DICOM dataset. Patient specific data-sets are helpful for training and pre-operative planning.
Virtual contrast media was created by injecting air through a syringe without the simulation of force feedback. U. Höfer et al. [12] proposed a “CATHI-system”. Schuetz et al. [13] combined “CATHI-system” with a full-scale human patient simulator and performed simulator courses to validate the system realism. A real syringe for the injection of the contrast media was also adopted but without its implementation details. The simulation of the contrast media was also calculated by the Poiseuille’s law. In addition, commercial simulators are still far too expensive to be used in everyday practice.
In this paper, we present a new 3D interactive angiography training and simulation framework by extending the previous system [10] to target the enhancement of simulation realism specifically with innovations on both software and hardware aspects. This integrated approach can, not only realistically simulate angiography processes with a new multi-phase fluid flow modelling approach but can also greatly improve the hand-eye coordinations and the physical interactions of the medical procedure via an innovative hardware device.

2. Overview of Simulation Framework

As shown in Figure 1a, the proposed system consists of three main components: a simulation software system, a syringe device tool, and a haptic device.
(1)
The software system components, see Figure 1b, include three simulation modules: the human-computer interaction (HCI) module, the physics simulation module, and the visualization module.
  • In the HCI module, a virtual guidewire/catheter is steered by a “Geomagic touch” haptic device [11], and the syringe tool is to deliver the contrast fluid media. Realistic haptic feedback is modelled by the haptic device, simulating the force feedback via the software simulation module.
  • The physics simulation module contains a discrete elastic rod model for physically based guidewire simulation [10,14]. The discrete elastic rod model is capable of real-time realistic simulation of complex dynamic interactions of guidewires within blood vessel geometry [15], which allows efficient computation the haptics effect. Contrast media injection model and its simulation are further integrated into the system.
  • The visualization module renders the simulation results generated by the physics and HCI modules in real time using GPU graphics rendering techniques.
(2)
Figure 2 demonstrates the syringe device tool and the corresponding circuit, which mainly includes a power module, a stepper motor module, a potentiometer, an air pressure sensor, a force sensing resistor, an Advanced RISC Machine (ARM) processor, an air cylinder, a lead screw and a coronary control syringe normally used in the real medical operations.
  • The analog-to-digital converter (ADC) interface of ARM processor samples the voltage of slide potentiometer and the piston of syringe is fixed with the slide potentiometer for injection together with the same distance. When moving the piston, the voltage of the slide potentiometer changes, thereby using the sampled voltage data to calculate the injection dosage and injection speed of contrast media in real time.
  • The force feedback from the syringe is mainly influenced by the cardiac blood pressure. Therefore, the air cylinder is adopted to imitate the condition inside the blood vessel. We employ a stepper motor to control the piston rod of the air cylinder to change its inner air pressure. In this device, the lead screw is adopted to convert the rotary motion of the stepper motor to a linear motion of screw. Then, the stepper motor can push and release the piston of the air cylinder to produce corresponding blood pressures in inner air cylinder to allow the user to feel the pressure force when he/she pushes the piston of the syringe.
Using the physical devices as shown in Figure 1a, medical trainees can operate virtual guidewires and catheters, and directly inject contrast media using the syringe tool, and the rendering results are displayed on the monitor to complete the whole process of a virtual angiography procedure. Therefore, the system setup is trying to replicate the real operation as closely as possible.

3. Diffusion Simulation of Contrast Media

Contrast media in interventional radiology enhances vascular imaging to help doctors visualize blood vessels under the X-ray for making reliable diagnosis. The injected contrast media is mixed with the blood flow inside the blood vessel without chemical reactions. The contrast media diffuses into the blood and mixes with it to form a two-fluids mixture, which is simulated using fluid simulation algorithms.
multi-fluid simulation is a hard-computational problem, since the two-fluids flow consists of contrast media and blood both are miscible fluids with each other. We ignored the related immiscible fluid methods to focus on the miscible fluid simulation. Lattice Boltzmann Method (LBM) [16] has been proposed to deal with miscible multi-fluid flows, but the method has a significantly high memory cost. Both grid-based fluid simulation solvers [17,18] and smoothed particle hydrodynamics (SPH) algorithms [19,20] have adopted the volume fraction concept [21] to simulate multi-fluid flows. Bao et al. [17], Kang et al. [18] and Liu et al. [19] took different phases or components as a whole mixture moving at the same bulk velocity, and therefore mixing different phases or components due to concentration differences only. Considering the underlying distribution of motions and forces of a multi-fluids flow, Ren et al. [20] introduced a drift velocity of phases to capture the underlying interactions between phases. This approach achieved good visual effects and can be done in real time with particles, but this mixture model did not consider the influence of the simulation boundary.
The previous angiography simulators [6] and angiography simulation methods [4,22] simulated the diffusion of the contrast media within the blood using simple model to save the computation cost. These methods treated the blood vessel as regular tubes which consists of the blood vessel center structure and the radius of every tube. However, the blood vessel is not regular tubes, especially at the location of lesions. It is difficult to use the Poiseuille’s law to simulate the real complex blood vessel extracted from the patient. Moreover, ignoring the interactive dynamics of two-phase flows of the contrast media and the blood, simulation results of these methods lacks vital details of the angiography process within complex blood vessel structures. Therefore, we adopt the miscible mixture model [20] to simulate the blood-contrast media as a two-fluids flow and introduced a non-slip boundary handling technique. Unlike previous angiography simulations, our proposed method can simulate the diffusion of the contrast media with accurate dynamics in real time with an accurate pressure, velocity field of the simulation space and detailed development of the fluids inside a blood vessel.

3.1. Multi-Fluids Mixture Model

Our multi-fluid flows mixture model of the blood-contrast media is essentially based on a SPH fluid simulation algorithm. The state of each particle i is computed at every time step by solving following fluid dynamics equations [23].
( α k t + ( u m · ) α k ) i = ( α k · u m ) i ( · ( α k u m k ) ) i
( u m t + ( u m · ) u m ) i = ( p m ρ m ) i + g + ( · T m ρ m ) i + ( · T D m ρ m ) i + ( F e ρ m ) i
where, α k is the volume fraction, u m is the mixture velocity, u m k is the drift velocity, ρ m = k α k ρ k is the mixture density, p m is the mixture pressure, g is the gravity, T m is the viscous stress tensor of mixture, T D m is the convective momentum transfer between phases, and F e is the external force.
The left-hand of Equation (1) is the substantial derivative of the volume fraction of phase k with regard to the mixture velocity u m , and the left-hand of Equation (2) represents the substantial derivative of the mixture velocity u m . Therefore, we solve these two equations by computing the right-hand of the equations with an explicit time integration. The drift velocity u m k is introduced to describe the change of the volume fraction of each phase, and the phase k of particle i of u m k expression is:
( u m k ) i = τ ( ρ k k c k i ρ k ) a i τ ( p k i k c k i p k i ) σ ( α k i α k i k c k i α k i α k i )
where the coefficient τ is used to control the inertia and pressure effects, a higher value will cause stronger inertia and pressure effects, σ is set to control the diffusion effects, the higher the value is, the stronger the diffusion effect. ρ k is the rest density of phase k, c k i = α k i ρ k i ρ m i is the mass fraction of phase k and the acceleration a i is:
a i = g ( ( u m · ) u m u m t ) i
which represents the difference between the gravity and the substantial derivative of the mixture velocity.
To deal with the miscible fluid simulation, the miscible phase can move within each other by different pressures. Thus, the pressure of phase k of particle i in Equation (3) is expressed as:
p k i = α k i p m i
p m i = κ ( ρ ¯ i ρ m i )
ρ ¯ i = j m j W i j
where ρ i ¯ is the interpolated density over all mixture particles under a smoothing kernel function W i j , we adopt a poly6 kernel function for the density interpolation and a spiky kernel function for all other quantity interpolations in Müller [24], κ is the gas constant, m j is the mass of particle j.
Before solving the governing equation, the drift velocity of the mixture fluid needs to be determined. For each particle i, we have
( p k ) i = j m j ρ ¯ j ( p k j p k i ) W i j
( α k ) i = j m j ρ ¯ j ( α k j α k i ) W i j
where W i j is the gradient of the smoothing kernel function. Therefore, the drift velocity u m k can be computed from Equation (3) by using p k and α k . Then the right-hand terms of the continuity equation for particle i are:
( α k · u m ) i = j m j ρ ¯ j α k j + α k i 2 ( u m j u m j ) · W i j
( · ( α k u m k ) ) i = j m j ρ ¯ j ( α k j u m k j + α k i u m k i ) · W i j
and the internal forces of the mixture fluids in the momentum equation of particle i are:
( p m ) i = j m j p m i + p m j 2 ρ ¯ j W i j
( · T m ) i = j m j ρ ¯ j ( μ i + μ j ) ( u m j u m i ) ( r j r i ) · W i j ( r j r i ) 2
( · T D m ) i = j m j ρ ¯ j k [ ρ k ( α k j u m k j ( u m k j · W i j ) + α k i u m k i ( u m k i · W i j ) ) ]
Considering the friction and the stickiness of the blood vessel wall as well as the influence of the blood pressure, the expression of external force F e is modified to:
F e = f r + f s + f b
f r = μ F N u m i T | u m i T |
F N = η · | δ | n
f s = Δ t k α k v k d i ( 1 d i d s ) · n , d i < d s 0 , d i d s
where in Equation (16), a frictional force f r is produced when fluid particles collide with the inner blood vessel wall. μ is a static friction coefficient of the inner blood vessel wall. u m i T is the tangential velocity of a particle i in collision. In Equation (17), F N is the normal pressure of the blood vessel wall when colliding with fluid particles. We introduce a penalty function [15] to resolve the collision. η is the contact stiffness, δ is the penetration depth of the particles. In Equation (18), f s is the viscosity force [25] of the inner blood vessel wall to the fluid particles, and it only exists when d i < d s , where d i is the shortest distance between the particle i and the blood vessel wall, Δ t is the simulation time step, v k is the viscosity coefficient of the inner blood vessel wall to all phases, n is the normal of the inner blood vessel wall. f b is the thrust applied to fluid particles by the blood pressure, which is expressed by setting the inlet and outlet pressures as well as the initial velocity of the inlet blood.

3.2. Boundary Conditions

The simulation of a SPH fluid always shows artifacts at the boundary. Therefore, many boundary handling techniques [26,27] for SPH-based fluid simulations have been proposed. The blood vessel is an elastic object and its deformation is influenced by the heart beat and movements of nearby tissues. It is extremely challenging to achieve a real-time performance for training while addressing the fluid-elastic deformation coupling problem with complex conditions. Therefore, in our 3D angiography simulation, we treat the blood vessel wall as a static solid and do not consider the influence of heart beating at present. In the future, we plan to incorporate real-time soft tissue modelling algorithm to address the fluid-elastic deformation coupling [28]. By treating the blood vessel wall as solid allows the fluid velocity at all fluid-solid boundaries is equal to that of the solid boundary [29]. Therefore, the fluid flow satisfies the non-slip boundary condition at a static solid boundary. Moreover, the density of a SPH fluid will exist obviously deficiency at the boundary which makes the fluid flow unstable.
To address these problems at the boundary, we introduce a simple approach that requires very little extra computations for handling boundary conditions. In addition, this method can be applied to arbitrary blood vessel models for SPH fluid models that use multi-layer boundary particles to cover the blood vessel and use the SPH formulation directly for density corrections and non-slip conditions.

3.2.1. Boundary Constructions

To satisfy the non-slip boundary condition and for the density condition, we construct multiple boundary particle layers to cover the vessel walls. The position of boundary particles (without surface points) is calculated by the following three steps.
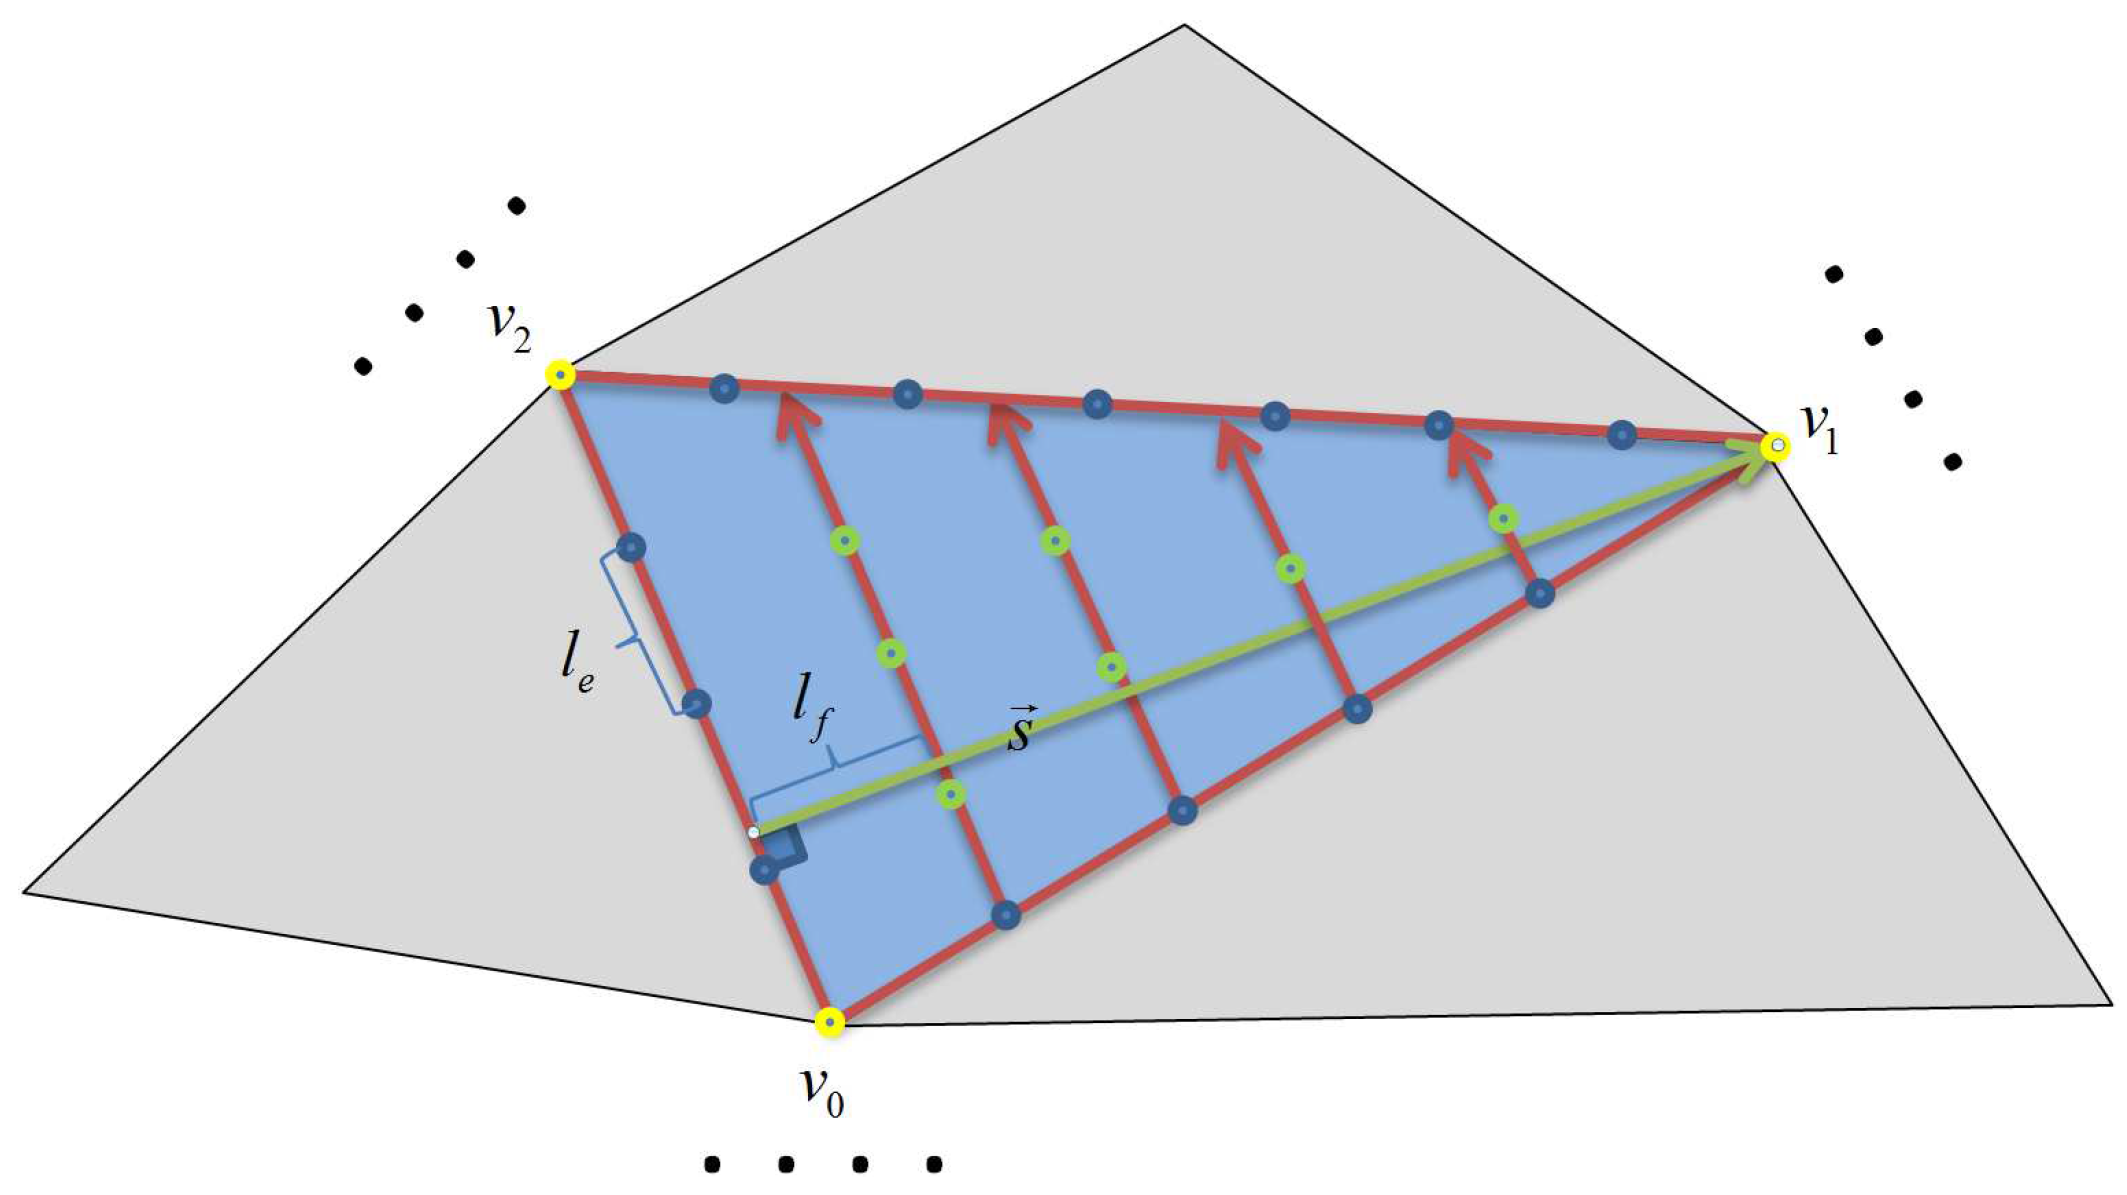
First, we pre-sampled the blood vessel mesh as the method in [30]. The sampling of a single triangle is shown in Figure 3. We obtain contour sampling points of the triangle by its three vertices (yellow points). The number of edge sampling points (blue points) is n e = | v a v b | and these edge sampling points are distributed along the edges with interval e = | v a v b | n e , where v a and v b are two triangle vertices, is the sampling interval. For the interior of the triangle, we choose the shortest edge e s and its normal direction s = e s × ( e l × e s ) | e s × ( e l × e s ) | for the triangle sampling, where e l is the longest edge of the triangle. Therefore, the sweeping steps n f = h f along a sweep direction s with an interval l f = h f n f , where h f is the height of the shortest edge of the triangle, and the same sampling method for the triangle edge is adopted to sample the interior sampling points(green points) for each sweep step.
Second, we extrapolate these sampling points by their corresponding normal. The sampling points of triangle vertices and edges are extrapolated by the mean normal of their circumambient triangles and the interior sampling points of a triangle are using this triangle normal for extrapolation. These sampling triangle points are extrapolated from 1 to n times along their corresponding outward normal with a distance . The maximum of n satisfies n < h 2 and ( n + 1 ) > h 2 , where h is the radius of the smooth kernel. Therefore, the position of the extrapolated points is the position of the boundary particles, the outward normal is the extrapolation vector of the boundary particles and n is its nearest triangle distance.
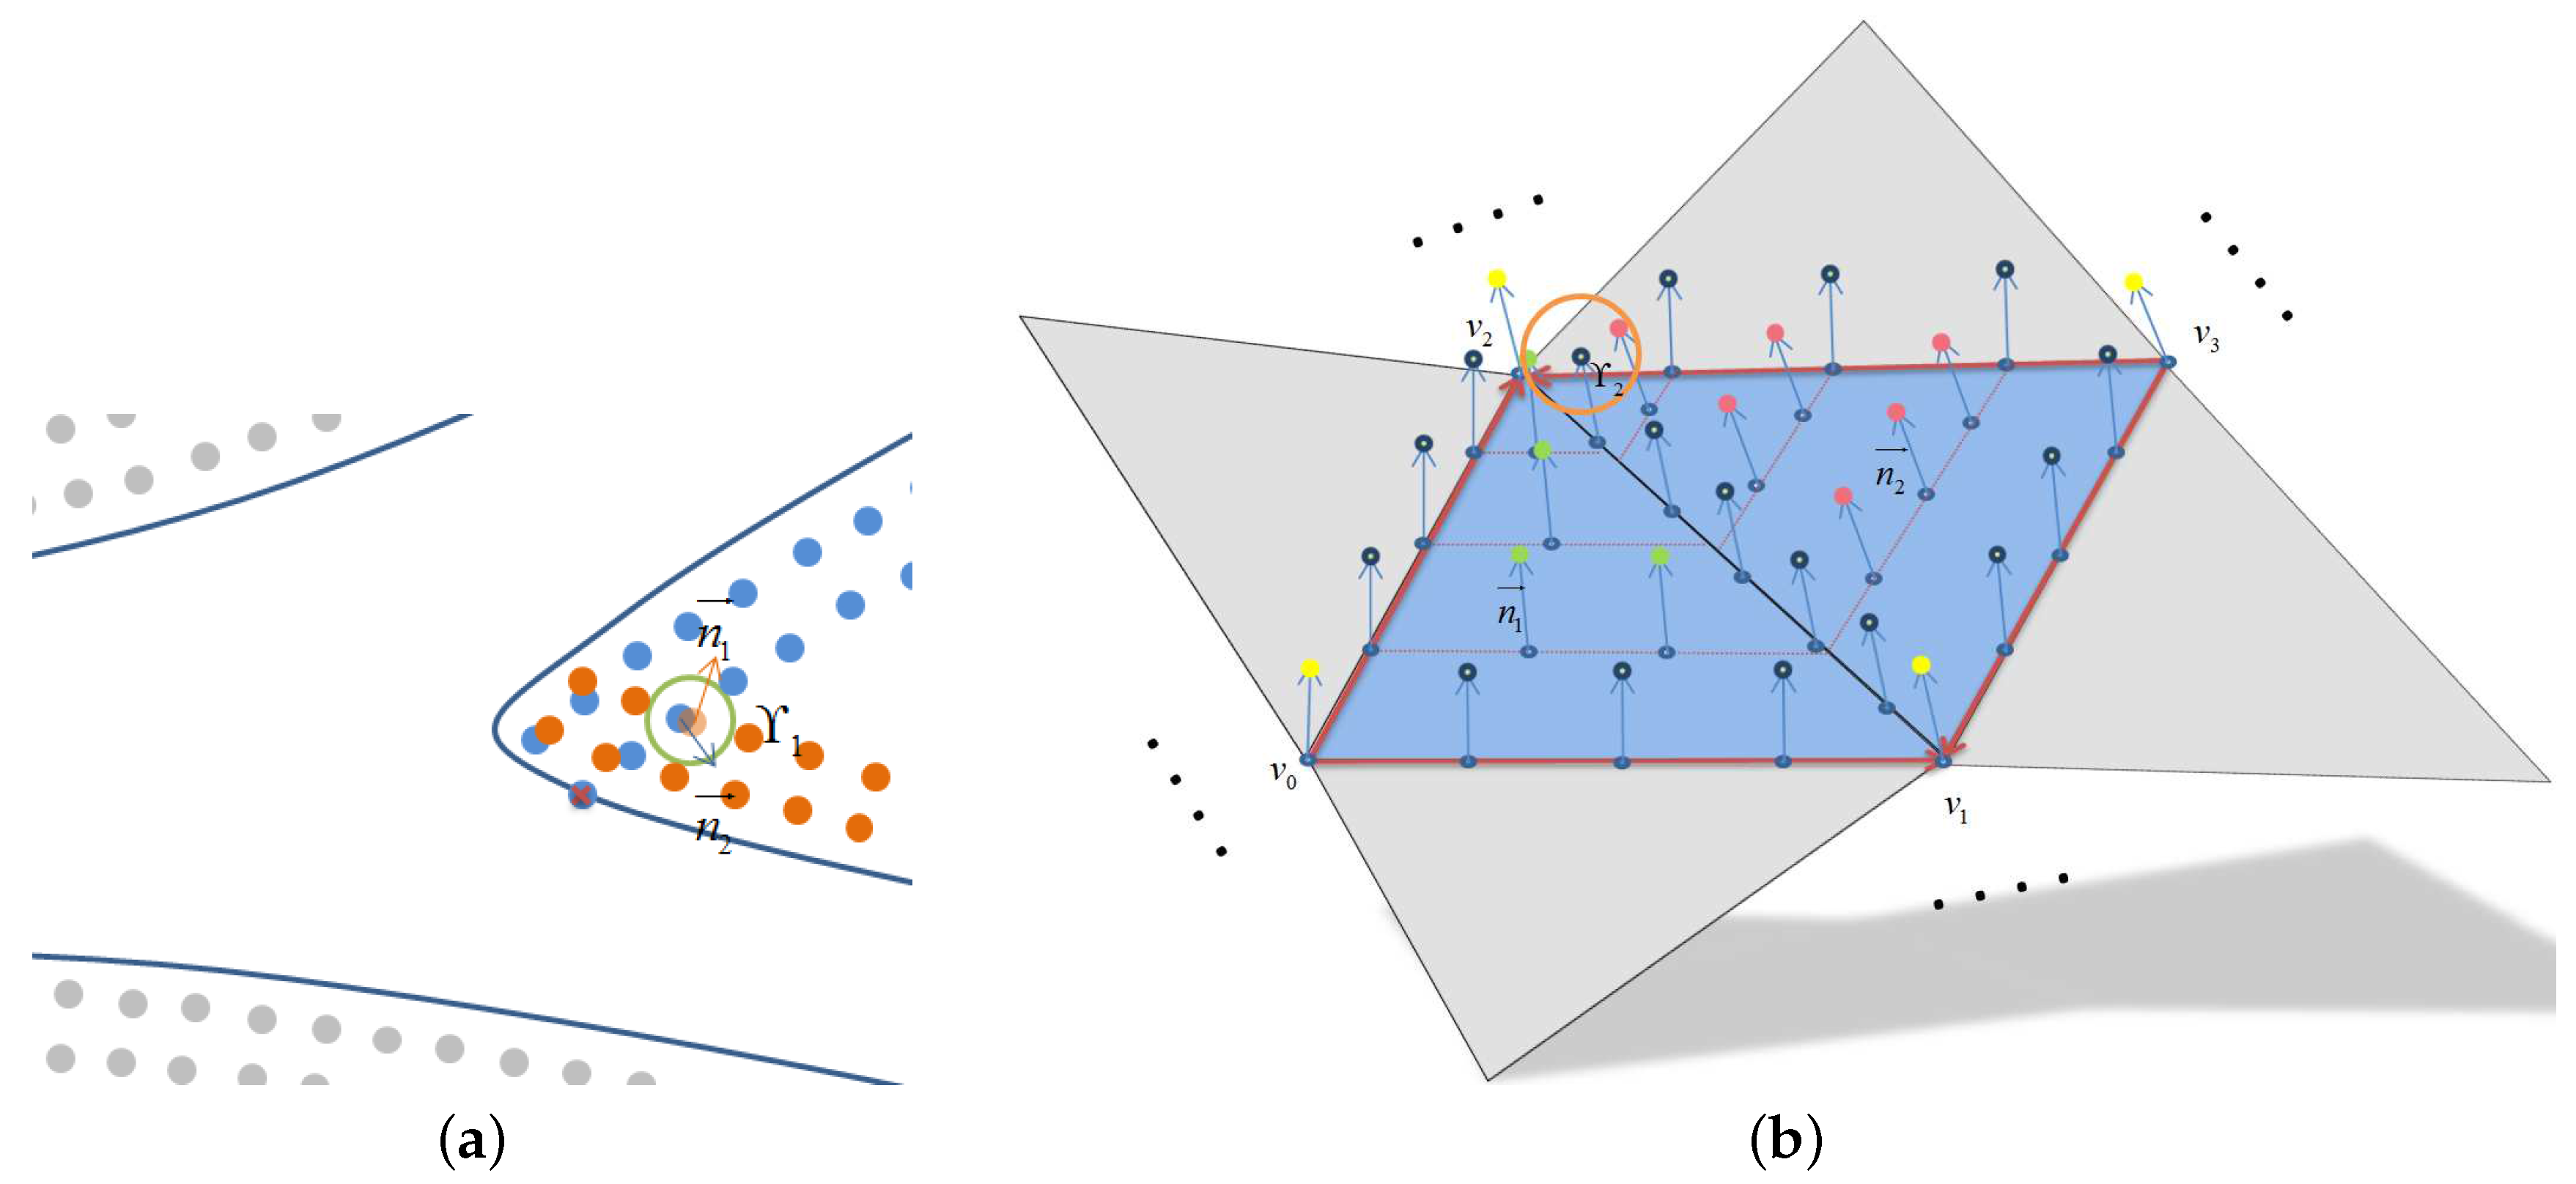
Finally, due to the complexity of the blood vessel structure, we optimize these extrapolated particles since they may aggregate locally. The boundary particles are constructed to fix the deficiency of the fluid near the boundary, such as the density and the pressure. We build several layers of boundary particles to fix this problem. The construction of boundary particles bases on the sampling of the triangle mesh extrapolates these sampling points. However, these extrapolated points will aggregate in two situations in bifurcation region and neighbor triangle region. Therefore, we use the radius threshold Υ 1 and Υ 2 as radius threshold to optimize the particles for these two situations, as shown in Figure 4. During the optimization, if the distance between the current particle and another particle is smaller than the corresponding threshold, we replace these two particles by a new particle with a center position of the previous two particles and set the extrapolation vector and the nearest triangle distance by the corresponding mean value of the two previous particles. The detailed steps are as follows:
First, the boundary particles extrapolated into the model are removed. Second, the dense regions of the boundary particles are produced at the bifurcation of the vessel as shown in Figure 4a and the neighbor of the triangles is shown in Figure 4b. We use do value of the extrapolation vector of the particles ( n 1 · n 2 ) to judge the dense region at bifurcation or the other. We set the radius threshold Υ 1 and Υ 2 to optimize the closest particles for the dense region of the bifurcation and the neighbor triangle respectively, where Υ 1 < , Υ 2 < , replacing these two neighbor particles by a new particle with a center position, and setting the extrapolation vector and the nearest triangle distance by the corresponding mean value of the two previous particles.

3.2.2. The Application of Boundary Condition

Having constructed the boundary, boundary particles are used to correct the density of the fluid particles at the boundary and apply the non-slip boundary condition to the fluid particles.
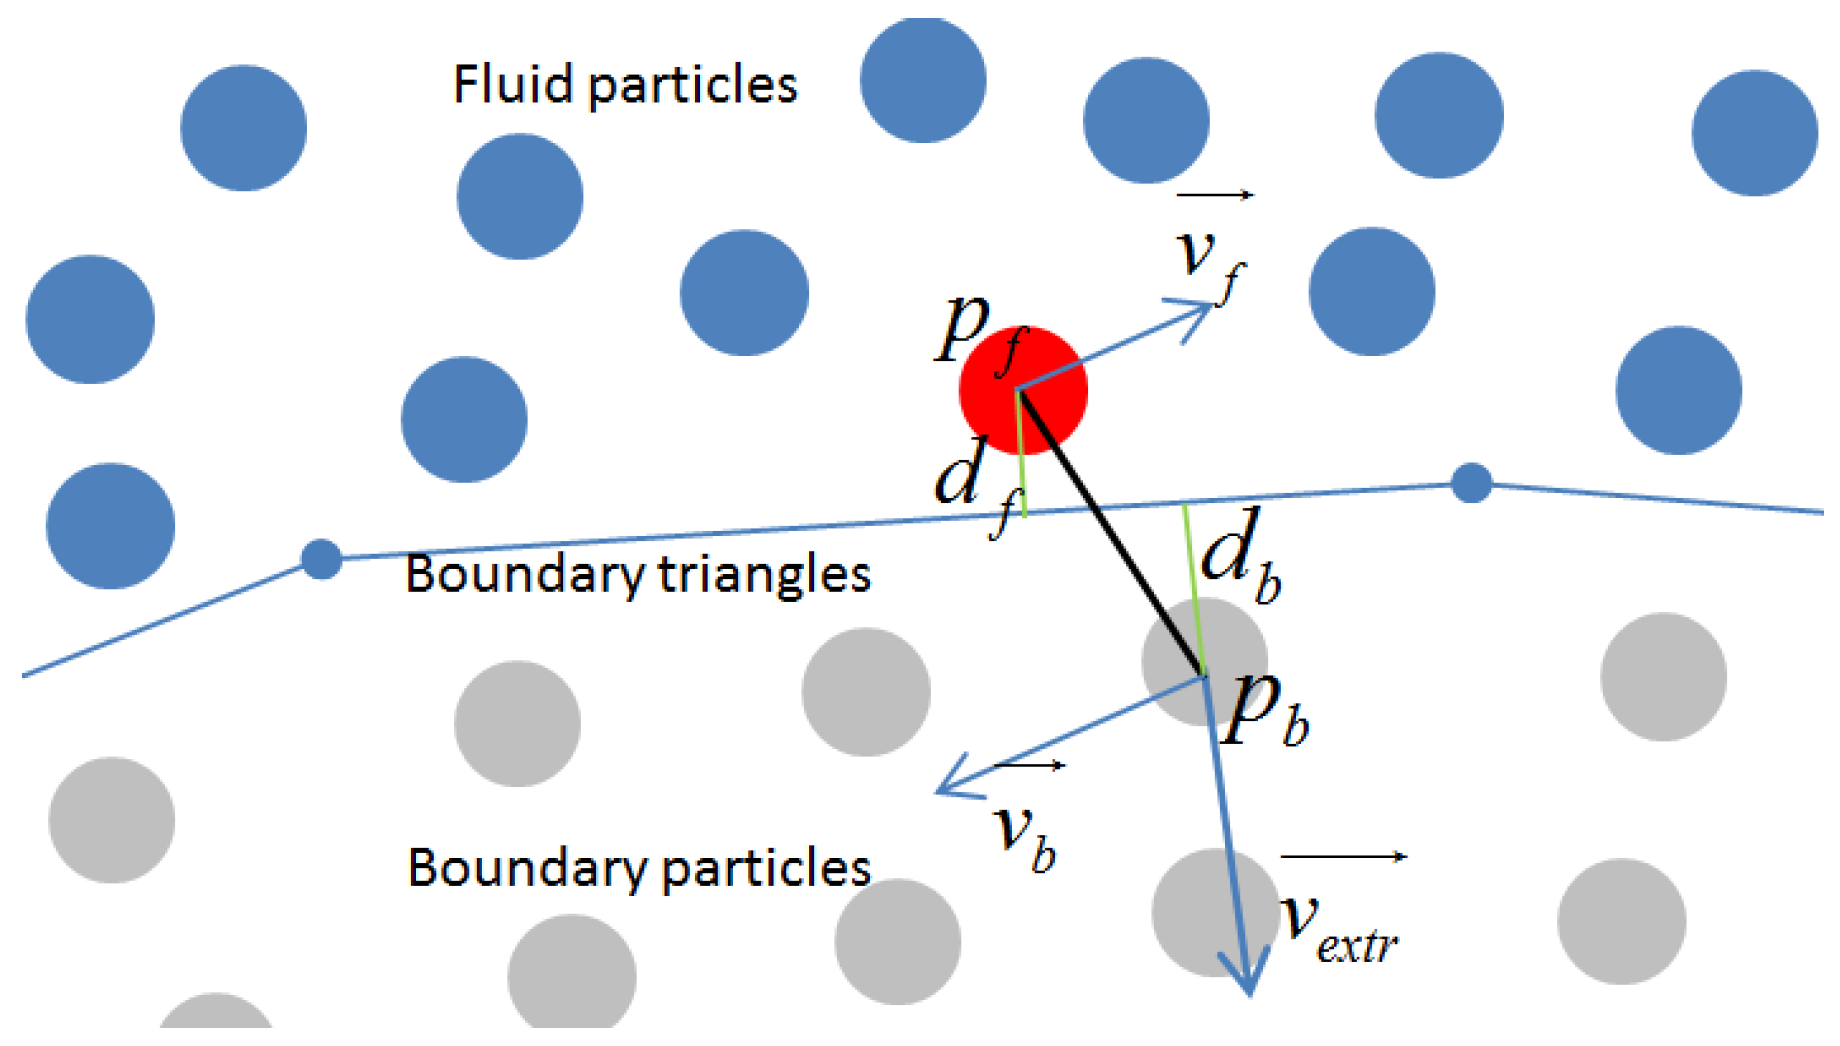
The boundary particle attributions should be updated. The mass and the position of boundary particles are fixed, and its density and pressure are assigned by the closest fluid particle with corresponding attributes. The non-slip boundary condition is applied by a functional form for the viscous force due to a solid boundary based on [31]. Thus, the artificial velocity of boundary particles v b , as shown in Figure 5, is:
v b = m a x ( β , d b d f ) · v f
where β < 0 set to restrict the magnitude of v b , d b is the distance of the boundary particle to the nearest triangle and d f is the distance of the fluid particle to nearest triangle. To reduce the computational cost, we adopt the boundary particle property of the nearest triangle distance to represent d b approximately. The fluid particle to the nearest triangle distance d f is, thus, expressed as:
d f = | ( p b p f ) · v e x t | | v e x t | d b
where p b and p f are positions of boundary particles and fluid particles, respectively. In addition, v e x t is the boundary particles’ property of the extrapolation vector.
After updated properties of boundary particles, the mass of the particles contributes to the density of the fluid particle i at the boundary within the radius of a smooth kernel. The pressure of boundary particles contributes to the computation of the pressure gradient in Equation (2), and its velocity is used to calculate the divergence of the viscous stress tensor using a fixed boundary viscosity coefficient.
The mixed fluids effect only occurs within fluid particles, the fluid particles do not transfer the volume fraction to the boundary particles. Therefore, the pressure and the velocity of boundary particles are only used for the corresponding force item.

4. Results and Discussions

We have designed three experiments to show the result of our contrast media diffusion algorithm. Experiment 1 shows the contrast media diffusion simulation under two regular vessel models to express the relationship between the rendering results and the corresponding accurate numerical results of the pressure and the velocity. In Experiment 2, we show angiography simulation results under various injection volumes and injection velocities of the contrast media in complex cardiac blood vessels, and then compared with a real angiography image sequence. In Experiment 3, several experts were asked to test the simulator with objective feedback using questionnaires.

4.1. Experiment 1

The structures of human vascular are complex, including many branches and stenosis, especially shapes and structures of lesions in blood vessels are difficult to model. Two typical vessel models were designed to simulate these complex structures, showing the validity of interactions of the blood-contrast media as two-fluids flows in vessels. The realism of the simulation results were assessed based on three assessment criteria: (1) rendering results; (2) results of the pressure and (3) the result of the velocity. As can be seen that the pressure was not significantly different near the boundary and the velocity was lower at the boundary which makes contrast media diffusion slower.

4.1.1. Stenosis Vessels

In Figure 6a, we imitated the development condition of the stenosis cardiovascular by using a stenosis cylinder. The diameter and length of the stenosis cylinder were 0.4 cm and 3 cm, respectively. Lumen diameter of the target coronary artery for angiography simulation was about 0.34 cm around injection position. At the initial state, the pressure on both sides of the stenosis was significantly larger than that of at the stenosis, and blood flows were moving faster at the stenosis, satisfying the Bernoulli’s principle. When increasing the contrast media injection speed, the velocity of the blood flow around the vascular approach increased too, and blood particles were pushed forward, increasing the pressure at the front of the stenosis. Contrast media diffused fast after entering the vessel and mixed with the blood to become a blood-contrast media mixture. During this process, the pressure propagated quickly and the condition of the pressure and the velocity of the contrast media were restored to the previous values, and the contrast media at the center of the vessel propagated faster than that at the boundary. While the contrast media diffusing, it had been pushed forward by the influx of the blood flow and diffuses forward and backward further. The pressure condition and the velocity were stable and similar to the contrast media injected before.
The results of the simulation, thus, was a close representation of the real-life case. We then tested the simulation algorithm under different structural conditions to see if the realistic results could be reproduced.

4.1.2. Y-Type Vessels

In Figure 6b, we imitated the development condition of the cardiovascular branch by using the Y-type cylinder. The inlet diameter of Y-type cylinder was 0.2 cm. To make the equality of the rate of flow between he inlet and outlets, we designed the outlet diameter as 0.1* 2 cm. In addition, we set the outflow pressure for both outlets of Y-type 1 kpa. At the initial state, since the radius of the vessel before the bifurcation was twice of that after the bifurcation, the pressure before bifurcation was thus larger but with a slower velocity compared to the velocity after the bifurcation. After the bifurcation, the flow velocity at the bottom bifurcation was much quicker than that at the top of the bifurcation under the influence of the gravity. After the contrast media was injected, the evolution of the pressure and the velocity were similar to those at the stenosis vessel, but the contrast media diffuses more quickly at the bottom bifurcation due to the influence of the gravity.

4.2. Experiment 2

In this experiment, the injection volume and the injection velocity of the contrast media were the main influence on angiography simulation results. Therefore, we simulated a multi-fluids mixture model with two conditions: (1) various injection dosages; and (2) various injection velocities. The results obtained under these conditions were then compared with the real coronary angiography image sequences. In this experiment, we set the blood inflow speed of the coronary artery 24 cm/s.

4.2.1. Influence of Injection Dosage

In Figure 7, we injected various dosages of the contrast media into cardiac blood vessels with the same injection velocity (e.g., 6.5 mL/s), and the corresponding numerical statistics were the number of particles used in the simulation, the injection dosage, and the injection time as shown in Table 1. At the start, we injected the contrast media for 0.10 s with 0.65 mL already being injected into the vessels as show in Figure 7a. At the second time, the injection time increased to 0.20 s and the injection dosage of the contrast media has reached 1.30 mL as shown in Figure 7b. At the last time, the time increased to 0.30 s with the injection dosage 1.95 mL as shown in Figure 7c. These three developing phases of the contrast media were under the same blood velocity, and the final angiography diffusion results all were shown at the time of 0.60 s. From the simulation results in Figure 7, we could see that the changing effects on blood vessels i.e., it become darker and clearer with the increasing injection dosage of the contrast media.
Again, the simulation results are very realistic, and the performance of the simulation is real-time and suitable for medical training.

4.2.2. Influence of Injection Velocity

In Figure 8, we injected the contrast media into cardiac blood vessels with the same contrast media dosage(1.95 mL) and various velocities using the same the corresponding numerical statistics as described in the experiment on the influence of the injection dosage (e.g., the number of particles, the injection velocity, and the injection time) as shown in Table 2. First, we finished the injection at the time of 0.60 s with the injection velocity of 3.25 mL/s as shown in Figure 8a. We increased the injection velocity to 6.50 mL/s and the time of finishing the injection decreased to 0.30 s as shown in Figure 8b. Finally, the velocity increased to 13.00 mL/s with the injection time finished at 0.15 s as shown in Figure 8c. These three phases of the contrast media were under the same blood velocity, and the angiography results all were shown at the time of 0.80 s. Based on the simulation results shown in Figure 8, we can see that the developing range of the contrast media reached the same position of the cardiac blood vessel, but faster injection velocity(shorter injection time) with the same dosage of the contrast media would make the frontier darker.

4.2.3. Virtual and Real Angiography Results Comparison

The real coronary angiography image sequences are shown in Figure 9a and approximate corresponding simulation results of our virtual training system are shown in Figure 9b. At the beginning, the coronary arteries are not very clear in the Figure 9(b1). In addition, then the contrast media were injected into the vessels and it is continually pushed forward by the blood flow. The density of the contrast media becomes higher at the tip of the catheter and the frontier of the development is lighter than the back-end, as shown in Figure 9(a2,a3,b2–b4). After finishing the injection, the back-end is diluted by the incoming blood flow and the frontier become darker than the back-end, as shown in Figure 9(a4,b5,b6).
In our simulator, we adopted the real patient heart model and blood vessels model, which was generated from 3D rotational X-ray images in a DICOM dataset. For getting better angiography simulation results, we removed the capillaries and kept the arterial trunks around the heart. From Figure 9, we can see that the whole process of contrast media diffusion in the blood vessels between real coronary angiography and angiography simulation is close. It demonstrated the capabilities of our proposed software and hardware solutions for delivering a feasible digital system to meet the demand for medical training. To further evaluate our proposed system, we conducted an end user evaluation to test the simulator with medical doctors.

4.3. Subjective Assessment by Experts

Our 3D angiography simulation system is mainly developed for angiography procedures training for trainees and medical students. We firstly asked experienced doctors to test and validated the system before testing on trainees, including an out-of-range input value test. Because experts can give accurate evaluations, not only on the simulation results, but also about system functions. We then further improved the simulation methods and the injection device according to the expert’s feedback. Trainees have been asked to test for effective and robust training. Trainees from two hospital were recruited to test our simulator and divided into two groups according to their stages of medical training. In the United States of America, an eligible surgeons’ usual training intervention operation cycle is five years. Therefore, we asked the surgeons with five or more years clinic experience in the field of interventional radiology to assess our simulator, and the evaluation process is according to the above evaluation pattern. (1) Five intermediate operators: eligible young interventional surgeons with between five and fifteen years of clinic experience; (2) Six senior experts, each has more than fifteen years of clinic experience in the field of interventional radiology.
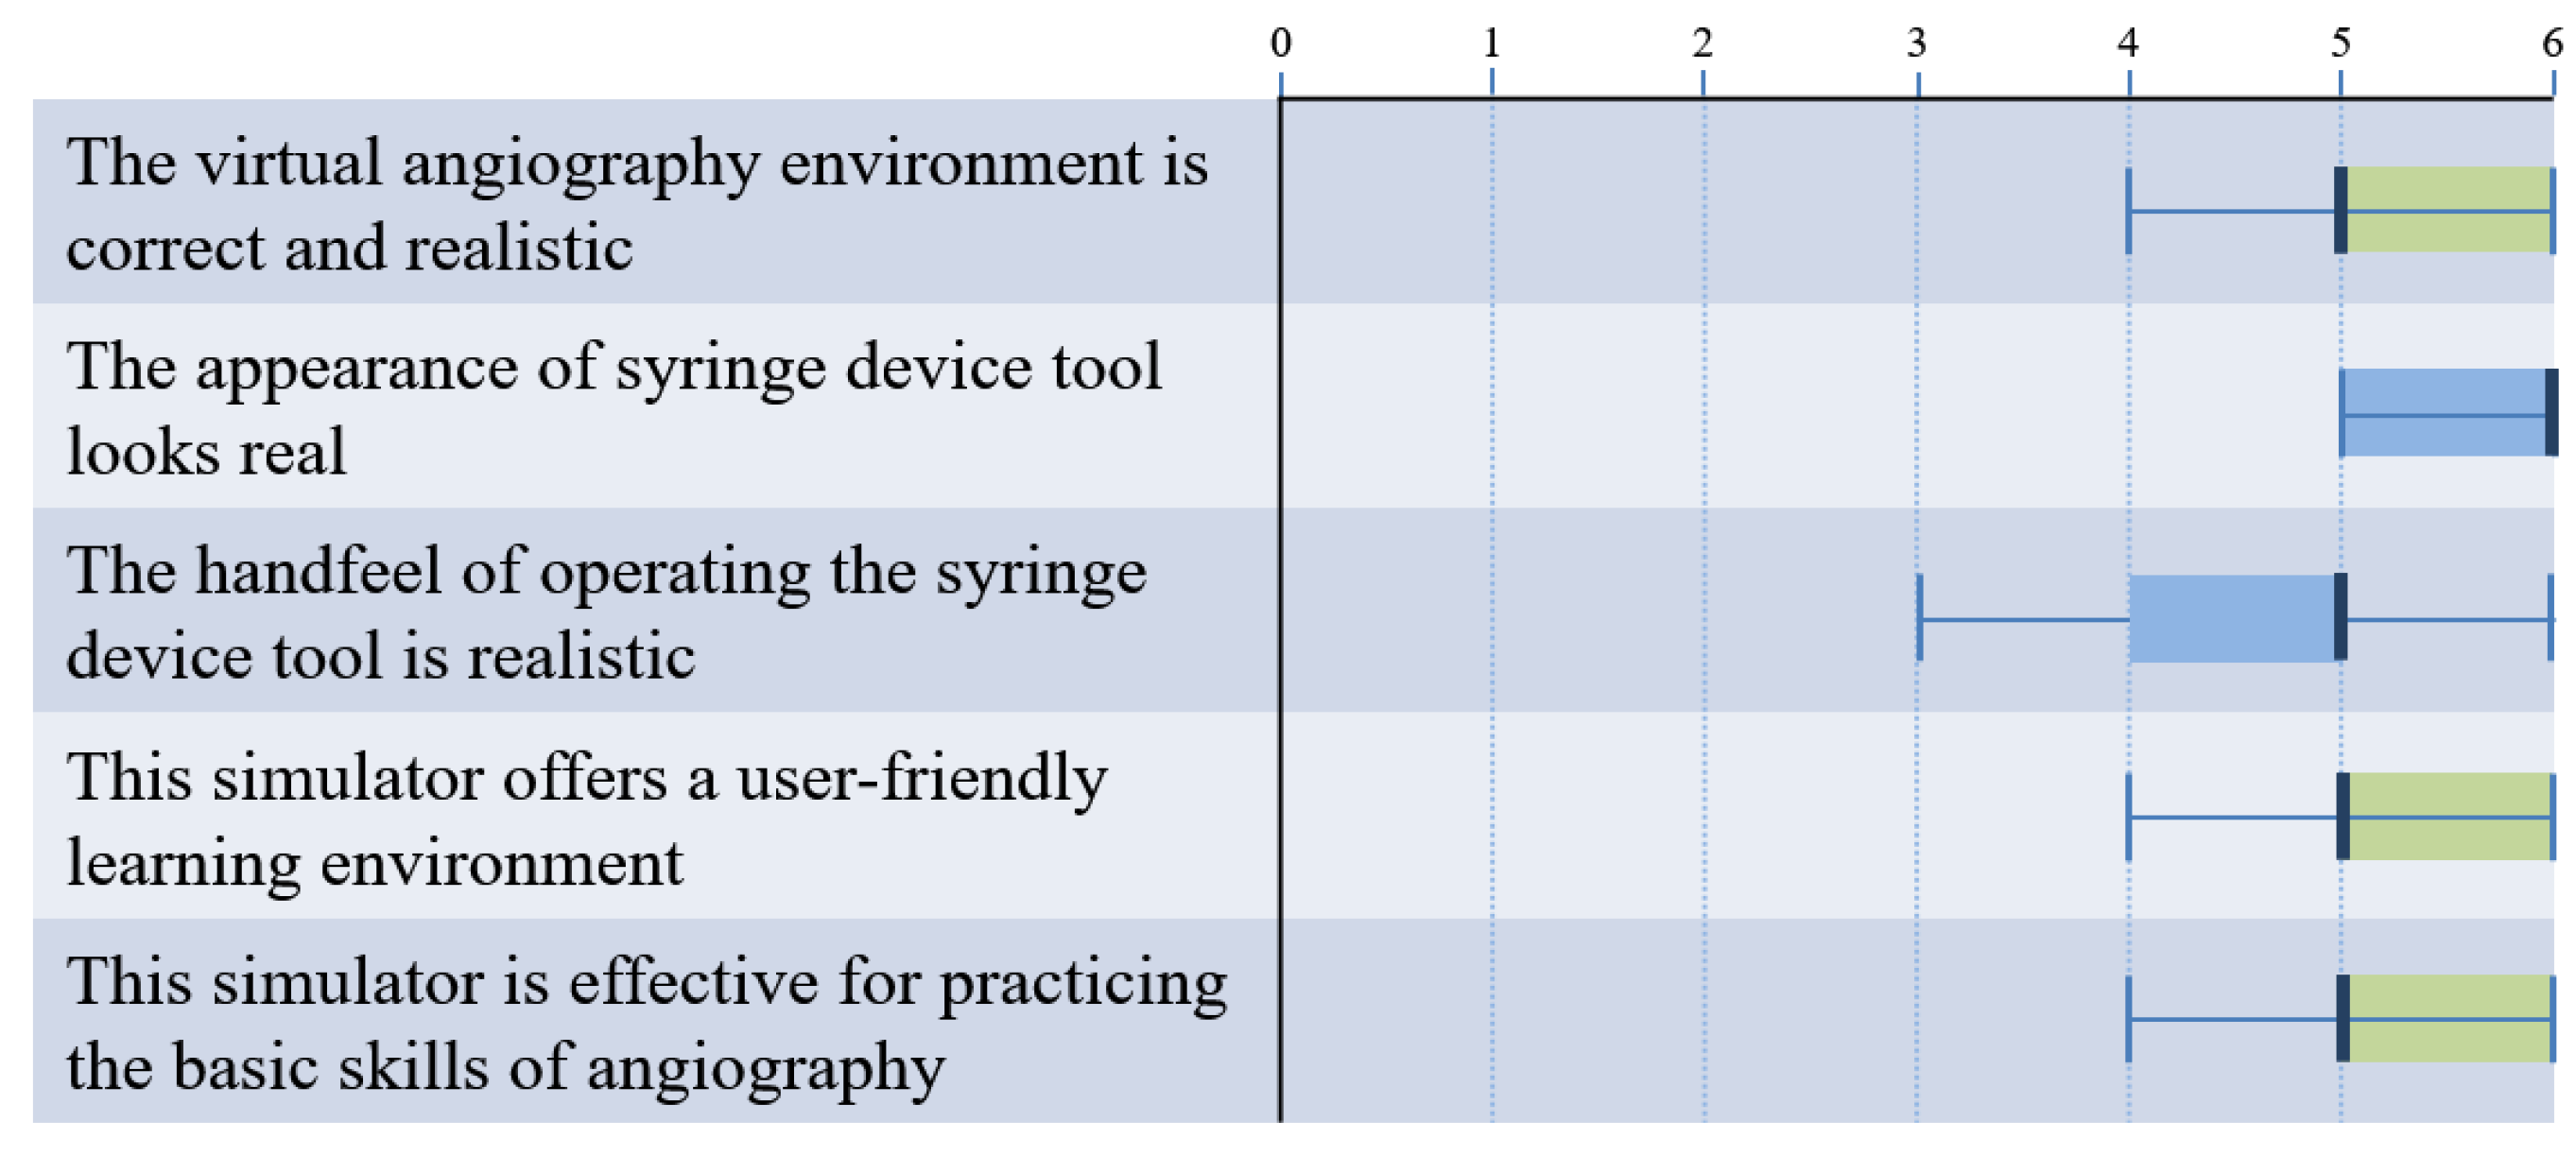
After all surgeons completed the evaluation experiments, we designed a 20-point questionnaire to collect objective feedback. Participants ranked statements on a seven-points Likert scale from 0 to 6, where 0 meant “strongly disagree”, 6 meant “ strongly agree”. The results of feedback assessment are shown in Figure 10, which presents boxplots. (In boxplots, the light vertical bar presents the minimum and maximum score of the corresponding question, the heavy vertical bar is the median, and the blue and green boxes shows the lower and upper quarterlies, respectively.)
In our simulator, we adopted the real patient blood vessels model, the realistic physical model of guidewire and catheter, and blood-contrast media mixture model. Therefore, it provides a realistic virtual-based simulation system for trainees and the median score of question 1 meets the expectation. Since we used the real physical control syringe as the main component of syringe device tool, seven experts scored six and four scored five in question 2. In the real angiography, the doctor needs to push the syringe hard when injection due to the blood pressure existing. We adopted the stepper motor to control the inner air pressure to imitate the coronary pressure to make realistic force feedback from the syringe. In this question, most surgeons agree with the force feedback of our simulator. We consider the potential influence factors for the realistic “hand-feel” as follows: (1) the contrast media is a fluid but the syringe uses air within the syringe for injection; (2) the simulated coronary pressure is not fully realistic as the real heart coronary pressure; and (3) the long catheter to the coronary artery will influence the force feedback of the syringe. In summary, the simulation of the contrast media is the most important influence for the realistic “hand-feel”. The next step is to extend our tool to improve the simulation in the future work. Overall, our system is well suited for training many interventional angiography procedures for clinical skills preparation. The proposed combination of the software and hardware solutions using physical tools is novel. All participants have given high cores on our system for training the basic clinical skills of angiography with a user-friendly learning environment.

5. Conclusions

In this paper, we present several key technology innovations in developing an angiography simulator for medical training and planning. We proposed the real-time simulation of the blood-contrast media as a two-fluids mixture using realistic modified SPH fluid simulation algorithm. A comparative study has been conducted to evaluate the results generated by our simulator with real-life images. Finally, the validity and efficacy of the 3D interactive virtual angiography system are assessed by medical doctors who have different clinic experiences. Feedback were obtained and usability of the integrated system as an effective interactive simulation platform for clinical teaching and training were assessed.
The proposed system consists of several system components of interventional radiology procedures, including the injection device, virtual guidewire, virtual catheter, 3D heart models, blood vessels models, and contrast media diffusion simulation algorithm. Our system is applicable and scalable to many interventional radiology procedures, such as angiography, and balloon angioplasty, etc.
We will continue to improve computational algorithms and address key technologies to make a complete and practical virtual training simulator for cardiovascular interventional procedures.

Author Contributions

Methodology, D.H., P.T., W.T. and T.R.W.; software, D.H. and P.T.; writing—original draft preparation, D.H., P.T., W.T. and T.R.W.; writing—review and editing, D.H., P.T., W.T. and T.R.W.

Funding

This research was funded by the National Natural Science Foundation of China grant number 61402278, the Shanghai Natural Science Foundation of China grant number 14ZR1415800, Research Program of Shanghai Engineering Research Center of Motion Picture Special Effects grant number 16dz2251300, Shanghai University Film Peak Discipline, and Shanxi Natural Science Technology Foundation grant number 2016JZ026.

Conflicts of Interest

The authors declare no conflict of interest.

References

  1. Lunderquist, A.; Ivancev, K.; Wallace, S.; Enge, I.; Laerum, F.; Kolbenstvedt, A.N. The acquisition of skills in interventional radiology by supervised training on animal models: a three-year multicenter experience. Cardiovasc. Interv. Radiol. 1995, 18, 209–211. [Google Scholar] [CrossRef]
  2. Bunce, N.; Mohiaddin, R. An Atlas of Contrast-Enhanced Angiography: Three-Dimensional Magnetic Resonance Angiography; Taylor & Francis: Oxford, UK, 2003. [Google Scholar]
  3. Luboz, V.; Zhang, Y.; Johnson, S.; Song, Y.; Kilkenny, C.; Hunt, C.; Woolnough, H.; Guediri, S.; Zhai, J.; Odetoyinbo, T. ImaGiNe Seldinger: First simulator for Seldinger technique and angiography training. Comput. Methods Programs Biomed. 2013, 111, 419–434. [Google Scholar] [CrossRef] [PubMed] [Green Version]
  4. Duriez, C.; Cotin, S.; Lenoir, J.; Neumann, P. New approaches to catheter navigation for interventional radiology simulation. Comput. Aided Surg. 2006, 11, 300–308. [Google Scholar] [CrossRef] [PubMed]
  5. Wang, F.; Duratti, L.; Samur, E.; Spaelter, U.; Bleuler, H. A computer-based real-time simulation of interventional radiology. In Proceedings of the 2007 29th Annual International Conference of the IEEE Engineering in Medicine and Biology Society, Lyon, France, 22–26 August 2007; pp. 1742–1745. [Google Scholar]
  6. Wang, Y. Simulation of Blood Flow and Contrast Medium Propagation for a Vascular Interventional Radiology Simulator. Master’s Thesis, Department of Computing, Imperial College, London, UK, 2009. [Google Scholar]
  7. Nicholson, W.J.; Cates, C.U.; Patel, A.D.; Niazi, K.; Palmer, S.; Helmy, T.; Gallagher, A.G. Face and content validation of virtual reality simulation for carotid angiography: Results from the first 100 physicians attending the Emory NeuroAnatomy Carotid Training (ENACT) program. Simul. Healthc. 2006, 1, 147–150. [Google Scholar] [CrossRef] [PubMed]
  8. Jensen, U.J.; Jensen, J.; Olivecrona, G.K.; Ahlberg, G.; Tornvall, P. Technical skills assessment in a coronary angiography simulator for construct validation. Simul. Healthc. 2013, 8, 324–328. [Google Scholar] [CrossRef] [PubMed]
  9. Grund-Pedersen, J.; Ohlsson, F. Interventional Simulator Control System. U.S. Patent US 8,491,307 B2, 2013. [Google Scholar]
  10. Tang, W.; Lagadec, P.; Gould, D.; Wan, T.R.; Zhai, J.; How, T. A realistic elastic rod model for real-time simulation of minimally invasive vascular interventions. Vis. Comput. 2010, 26, 1157–1165. [Google Scholar] [CrossRef]
  11. Huang, D.; Tang, W.; Wan, T.R.; John, N.W.; Gould, D.; Ding, Y.; Chen, Y. A new approach to haptic rendering of guidewires for use in minimally invasive surgical simulation. Comput. Animat. Virtual Worlds 2011, 22, 261–268. [Google Scholar] [CrossRef]
  12. Höfer, U.; Langen, T.; Nziki, J.; Zeitler, F.; Hesser, J.; Müller, U.; Voelker, W.; Männer, R. Cathi-catheter instruction system. In CARS 2002 Computer Assisted Radiology and Surgery; Springer: Berlin, Germany, 2002; pp. 101–106. [Google Scholar]
  13. Schuetz, M.; Moenk, S.; Vollmer, J.; Kurz, S.; Mollnau, H.; Post, F.; Heinrichs, W. High degree of realism in teaching percutaneous coronary interventions by combining a virtual reality trainer with a full scale patient simulator. Simul. Healthc. 2008, 3, 242–246. [Google Scholar] [CrossRef] [PubMed]
  14. Tang, W.; Wan, T.R.; Gould, D.; How, T.; John, N.W. A stable and real-time nonlinear elastic approach to simulating guidewire and catheter insertions based on cosserat rod. IEEE Trans. Biomed. Eng. 2012, 59, 2211–2218. [Google Scholar] [CrossRef] [PubMed]
  15. Huang, D.; Wang, Y.; Tang, P.; Xie, Z.; Tang, W.; Ding, Y. Modeling and Simulation of Multi-frictional Interaction Between Guidewire and Vasculature. In Image and Graphics; Springer: Berlin, Germany, 2015; pp. 524–537. [Google Scholar]
  16. Park, J.; Kim, Y.; Wi, D.; Kang, N.; Shin, S.Y.; Noh, J. A unified handling of immiscible and miscible fluids. Comput. Animat. Virtual Worlds 2008, 19, 455–467. [Google Scholar] [CrossRef] [Green Version]
  17. Bao, K.; Wu, X.; Zhang, H.; Wu, E. Volume fraction based miscible and immiscible fluid animation. Comput. Animat. Virtual Worlds 2010, 21, 401–410. [Google Scholar] [CrossRef]
  18. Kang, N.; Park, J.; Noh, J.; Shin, S.Y. A hybrid approach to multiple fluid simulation using volume fractions. Comput. Graph. Forum 2010, 29, 685–694. [Google Scholar] [CrossRef]
  19. Liu, S.; Liu, Q.; Peng, Q. Realistic simulation of mixing fluids. Visual Comput. 2011, 27, 241–248. [Google Scholar] [CrossRef]
  20. Ren, B.; Li, C.; Yan, X.; Lin, M.C.; Bonet, J.; Hu, S.M. Multiple-fluid SPH simulation using a mixture model. ACM Trans. Graph. (TOG) 2014, 33, 171. [Google Scholar] [CrossRef]
  21. Müller, M.; Solenthaler, B.; Keiser, R.; Gross, M. Particle-based fluid-fluid interaction. In Proceedings of the 2005 ACM SIGGRAPH/Eurographics symposium on Computer Animation, Los Angeles, CA, USA, 29–31 July 2005; pp. 237–244. [Google Scholar]
  22. Wu, X.; Allard, J.; Cotin, S. Real-time modeling of vascular flow for angiography simulation. In Medical Image Computing and Computer-Assisted Intervention–Miccai 2007; Springer: Berlin, Germany, 2007; pp. 557–565. [Google Scholar]
  23. Yeoh, G.H.; Tu, J. Computational Techniques for Multiphase Flows; Elsevier: Amsterdam, The Netherlands, 2009. [Google Scholar]
  24. Müller, M.; Charypar, D.; Gross, M. Particle-based fluid simulation for interactive applications. In Proceedings of the 2003 ACM SIGGRAPH/Eurographics Symposium on Computer Animation. Eurographics Association, San Diego, CA, USA, 26–27 July 2003; pp. 154–159. [Google Scholar]
  25. Clavet, S.; Beaudoin, P.; Poulin, P. Particle-based viscoelastic fluid simulation. In Proceedings of the 2005 ACM SIGGRAPH/Eurographics Symposium On Computer Animation, Los Angeles, CA, USA, 29–31 July 2005; pp. 219–228. [Google Scholar]
  26. Akinci, N.; Ihmsen, M.; Akinci, G.; Solenthaler, B.; Teschner, M. Versatile rigid-fluid coupling for incompressible SPH. ACM Trans. Graph. (TOG) 2012, 31, 62. [Google Scholar] [CrossRef]
  27. Fujisawa, M.; Miuralunderquist1995acquisition, K.T. An Efficient Boundary Handling with a Modified Density Calculation for SPH. Comput. Graph. Forum 2015, 34, 155–162. [Google Scholar] [CrossRef] [Green Version]
  28. Tang, W.; Wan, T.R. Constraint-based soft tissue simulation for virtual surgical training. IEEE Trans. Biomed. Eng. 2014, 61, 2698–2706. [Google Scholar] [CrossRef] [PubMed]
  29. Day, M.A. The no-slip condition of fluid dynamics. Erkenntnis 1990, 33, 285–296. [Google Scholar] [CrossRef]
  30. Akinci, N.; Cornelis, J.; Akinci, G.; Teschner, M. Coupling elastic solids with smoothed particle hydrodynamics fluids. Comput. Animat. Virtual Worlds 2013, 24, 195–203. [Google Scholar] [CrossRef]
  31. Morris, J.P.; Fox, P.J.; Zhu, Y. Modeling low Reynolds number incompressible flows using SPH. J. Comput. Phys. 1997, 136, 214–226. [Google Scholar] [CrossRef]
Figure 1. Overview of the proposed 3D interactive virtual angiography simulator and its key software components. (a): System overview; (b): Software components.
Applsci 09 00379 g001
Figure 2. The proposed syringe device tool.
Applsci 09 00379 g002
Figure 3. The sampling of triangles.
Applsci 09 00379 g003
Figure 4. The dense region of extrapolated boundary particles. (a) A bifurcation region; (b) Neighbor triangle regions
Applsci 09 00379 g004
Figure 5. Construction of an artificial velocity for boundary particles.
Applsci 09 00379 g005
Figure 6. Contrast media diffusion simulation in two typical vessels. (a) Stenosis vessels; (b) Y-type vessels.
Applsci 09 00379 g006
Figure 7. 3D virtual angiography results with various injection dosages. (a) Result with an injection dosage 0.65 mL, and the total injection time 0.10 s; (b) Result with an injection dosage 0.65 mL, and the total injection time 0.20 s; (c) Result with an injection dosage 1.95 mL, and the total injection time 0.30 s.
Applsci 09 00379 g007
Figure 8. 3D virtual angiography results with various injection velocities. (a) Result at the time 0.60 s with an injection velocity 3.25 mL/s; (b) Result at 0.30 s with an injection velocity 6.50 mL/s; (c) Result at the time 0.15 s with an injection velocity 13.00 mL/s.
Applsci 09 00379 g008
Figure 9. Real angiography image sequences vs. our simulator results. (a) Real angiography image sequences; (b) Virtual SPH-based angiography results.
Applsci 09 00379 g009
Figure 10. The average score of expert assessment.
Applsci 09 00379 g010
Table 1. Injection conditions with various injection dosages.
Angiography Results(a)(b)(c)
Particle number200400600
Injection dosage0.65 mL1.30 mL1.95 mL
Injection velocity6.50 mL/s6.50 mL/s6.50 mL/s
Total injection time0.10 s0.20 s0.30 s
Table 2. Injection conditions with various injection velocities.
Angiography Results(a)(b)(c)
Particle number600600600
Injection dosage1.95 mL1.95 mL1.95 mL
Injection velocity3.25 mL/s6.50 mL/s13.00 mL/s
Time of finishing injection0.60 s0.30 s0.15 s