Article

Study on Optical Properties and Internal Quantum Efficiency Measurement of GaN-based Green LEDs

1
Department of Electronic Engineering, Tsinghua University, Beijing 100084, China
2
Xiamen Changelight Co., Ltd., Xiamen 361101, China
3
Department of Physics, Xiamen University, Xiamen 361101, China
*
Authors to whom correspondence should be addressed.
Appl. Sci. 2019, 9(3), 383; https://doi.org/10.3390/app9030383
Submission received: 27 December 2018 / Revised: 11 January 2019 / Accepted: 15 January 2019 / Published: 23 January 2019
(This article belongs to the Special Issue Internal Quantum Efficiency of III-Nitride Light-Emitting Diodes)

Abstract

:
In this paper, the optical properties of GaN-based green light emitting diode (LED) are investigated and the internal quantum efficiency (IQE) values are measured by temperature dependent photoluminescence (TDPL) and power dependent photoluminescence (PDPL) methods. The "S-shaped” shift of peak wavelength measured at different temperature disappears gradually and the spectra broadening can be observed with increasing excitation power. The IQE calculation results of TDPL, which use the integrated intensity measured at low temperature as unity, can be modified by PDPL in order to acquire more accurate IQE values.

1. Introduction

GaN-based light emitting diodes (LEDs) have been widely studied for their great advantages in solid state lighting and display, among which blue LEDs, whose internal quantum efficiency (IQE) values can exceed 90%, have achieved great success attributed to the improvement of epitaxy growth technology and device structures [1,2,3,4,5,6,7,8]. However, the IQE values of green LEDs are still relatively low since the difficulty of growing high-quality single crystal caused by huge lattice mismatch. Therefore, how to evaluate IQE readily and accurately is of vital importance in relevant scientific progress.
Temperature dependent photoluminescence (TDPL), power dependent photoluminescence (PDPL), and time resolved photoluminescence (TRPL) are three commonly used optical methods to determine IQE values. When performing TDPL experiment, integrated intensities at different temperature are recorded and the one measured at low temperature (LT) is used as unity to obtain IQE values, which is premised on the hypothesis that nonradiative recombination is fully frozen at LT [9,10,11]. In PDPL experiment, integrated intensities at different excitation power are recorded and the variation curves between excitation power and integrated intensities is fitted in terms of ABC model to acquire the relationships between coefficients of different recombination channels [12], which will be explained in detail later. Ultrafast lasers are used in TRPL to obtain photoluminescence (PL) decay curves after excitation, whose mechanism is intricate and controversial [13,14,15,16,17].
The measurement of IQE is challenging, since it cannot be measured directly, and different indirect means have their own problems and scope of application, for example, assuming IQE value is equal to 100% at LT is unreasonable in TDPL method. To make the conclusion more convictive, two or more methods are resorted to at the same time. Given that TDPL and PDPL are much simple and can be performed at the same time, we combine these two methods and put forward an easy-to-implement approach to acquire more accurate IQE values, which uses IQE value calculated with PDPL experiment at LT to rectify the results of TDPL experiment.

2. Materials and Methods

The sample investigated in this work is a commercial green InGaN/GaN MQW epitaxial wafer grown by metal organic chemical vapor deposition (MOCVD) on a c-plane sapphire substrate manufactured by Xiamen Changelight Co., Ltd. A schematic illustration of the experiment setup is shown in Figure 1a. The sample was mounted on the cold head of optical helium closed-cycle cryostat where the temperature can be tuned from 10 K to 300 K. A steady-state 405-nm laser diode whose output power can range from 0 mW to 250 mW was chosen as the excitation source and the laser was focused by a lens with a focal length of 30 cm. A sharp knife was mounted on a motorized linear translation stage placed at the focal point of the lens. The position of the knife was changed continuously to cut the laser with its edge and the change of the power was monitored with a power meter, which is shown in the inset of Figure 1b. Considering the transverse distribution of the laser is gaussian, the derivative of the results obtained by the power meter could be calculated and fitted that with gaussian function to acquire the spot radii. The spot radii on the sample were about 0.05585 mm, 0.05602 mm, and 0.05554 mm at excitation power of 250 mW, 150 mW, and 50 mW, respectively determined by this knife-edge method [18] which did not change much when changing the output power. The photoluminescence (PL) signals were collected and reflected to the entrance of a HORIBA Jobin Yvon Triax 550 monochromator with lens #2, mirror and lens #3 shown in Figure 1a. The incident PL signals were dispersed with a grating for spectral resolution and the intensities of different wavelengths were detected by a GaAs photomultiplier tube (PMT) which was connected to a computer to collect data.

3. Results

3.1. Photoluminescence Behavior

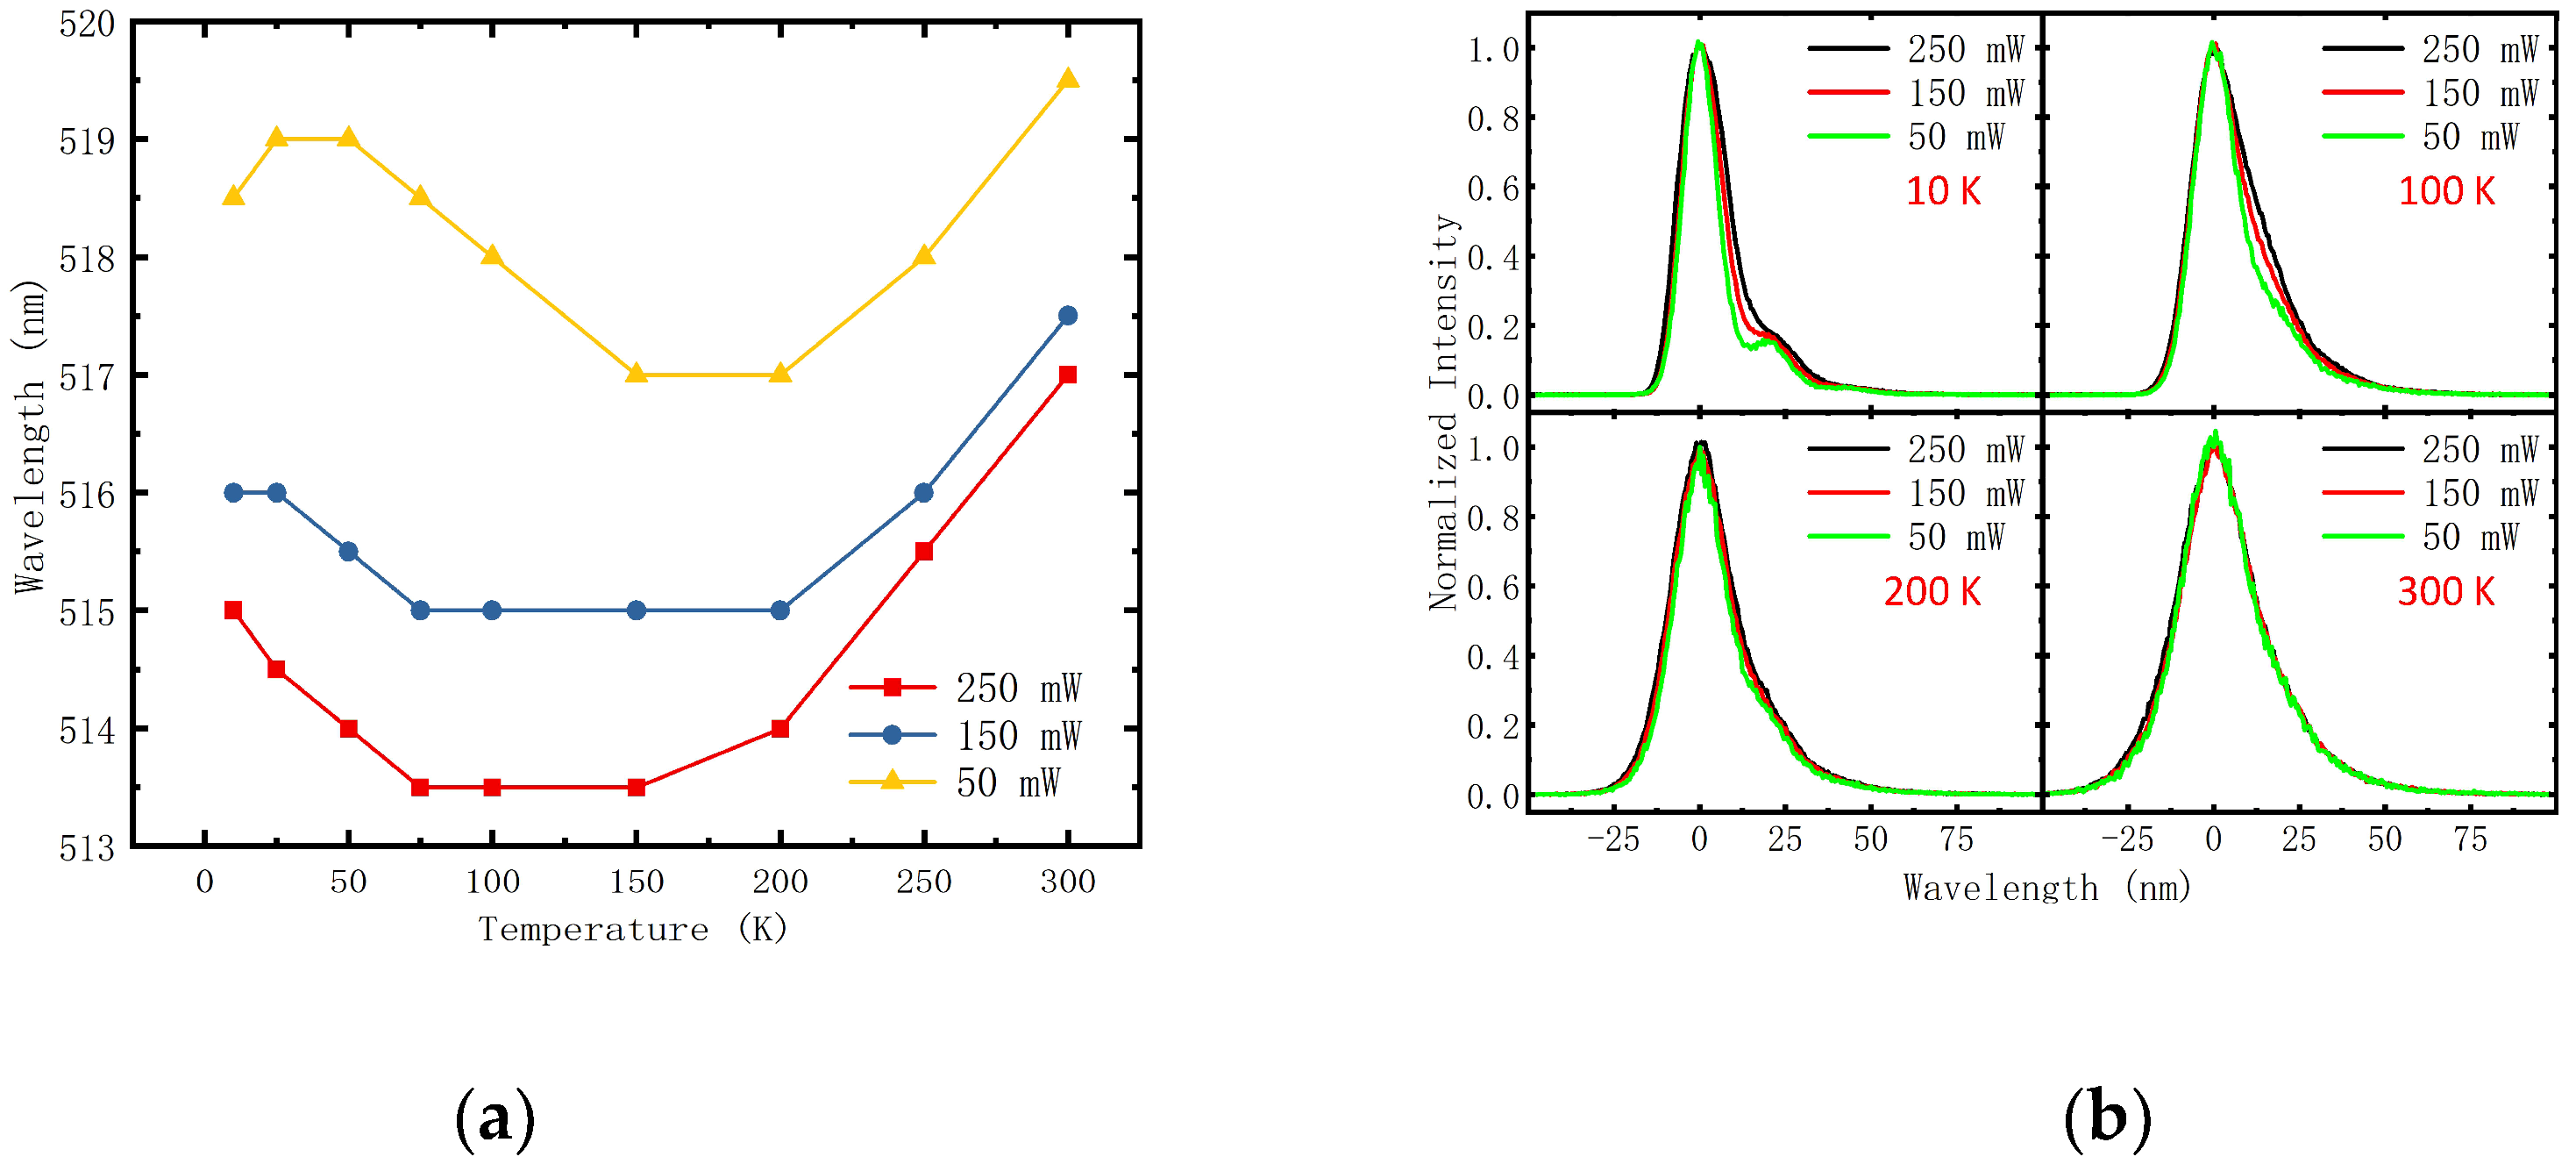
The spectra at different temperature and excitation power are shown in Figure 2, in which central wavelengths (CWs) at LT are designated with blue lines. Shifting of CWs and broadening of spectra with increasing temperature and excitation power can be observed. To investigate these changes, CWs and featured spectra are extracted, which are shown in Figure 3.
In Figure 3a, “S-shaped” shift of CW can be observed at excitation power of 50 mW, but the red shift process disappears when increasing excitation power. It is well established that localization accounts for “S-shaped” shift and relaxation down into lower energy tail states of carriers at lower temperature range results in red shift in the initial stage [19,20]. When the excitation power is higher, more carriers are generated and states at lower energy tail are more likely to be occupied when relaxing from higher energy level in about 100 fs, which means the red shift process cannot be observed at higher excitation power. This can be further proved by comparing the spectrum widths, which are shown in Figure 3b, of which spectra are normalized and shifted to a same CW. At lower temperature, spectra remain unchanged at higher energy side and broaden at lower energy side with increasing excitation power, which indicates that more lower energy states are occupied at higher excitation power. When the temperature is higher, the spectra broaden for many reasons, such as shorter carrier lifetime induced by increasing nonradiative recombination and the fact that discrepancy of spectrum widths cannot be observed. In addition to this, CWs shift to shorter wavelengths with increasing excitation power over the entire temperature range, which is originated from band filling effect.

3.2. Determination of IQE Values

In TDPL experiment, IQE values at different temperature can be expressed as
IQE TDPL ( T , P ) = I ( T , P ) I ( LT , P )
where I ( T , P ) denotes integrated intensity at the temperature T and excitation power P and I ( LT , P ) denotes integrated intensity at the lowest temperature, e.g., LT equals 10 K in this study. This expression reflects the proportions of IQE values at different temperatures correctly, which are relative values. However, this is based on the fact that there is no nonradiative recombination at LT, which is not always reasonable and needs further verification. To correct this latent mistake, PDPL experiment can be performed to calculate the IQE value at LT and modify the TDPL results. According to Dai et al. [21], the relationship between carrier generation rate G and excitation power P can be expressed as
G = P ( 1 R ) α A spot h ν
where R denotes the reflection ratio, α denotes the absorption coefficient, A spot denotes the area of the laser spot, and h ν denotes photon energy. It is generally accepted that the non-equilibrium carriers generated are likely to recombine through three channels, that is, nonradiative recombination, bimolecular radiative recombination, and Auger nonradiative recombination. So, the rate equation can be expressed as
G = A n + B n 2 + C n 3
where A , B , and C are nonradiative recombination coefficient, bimolecular radiative recombination coefficient, and Auger nonradiative recombination coefficient, respectively, which is called the ABC model [22]. Whether Auger recombination can be neglected or not depends on carrier density, which equals the product of carrier generation rate and carrier lifetime. Here we should take Auger recombination into consideration, which can be proved by fitting the P I curves with the contribution of Auger recombination. Assume that integrated intensity I is proportional to carriers involved in radiative recombination, namely I = β B n 2 where β is a scale factor related to light extraction efficiency. Thus, the relationship between P and I can be expressed as
P = m G = m A B β I + m β I + m C ( B β ) 3 2 I 3 2 = Q 1 I + Q 2 I + Q 3 I 3 2
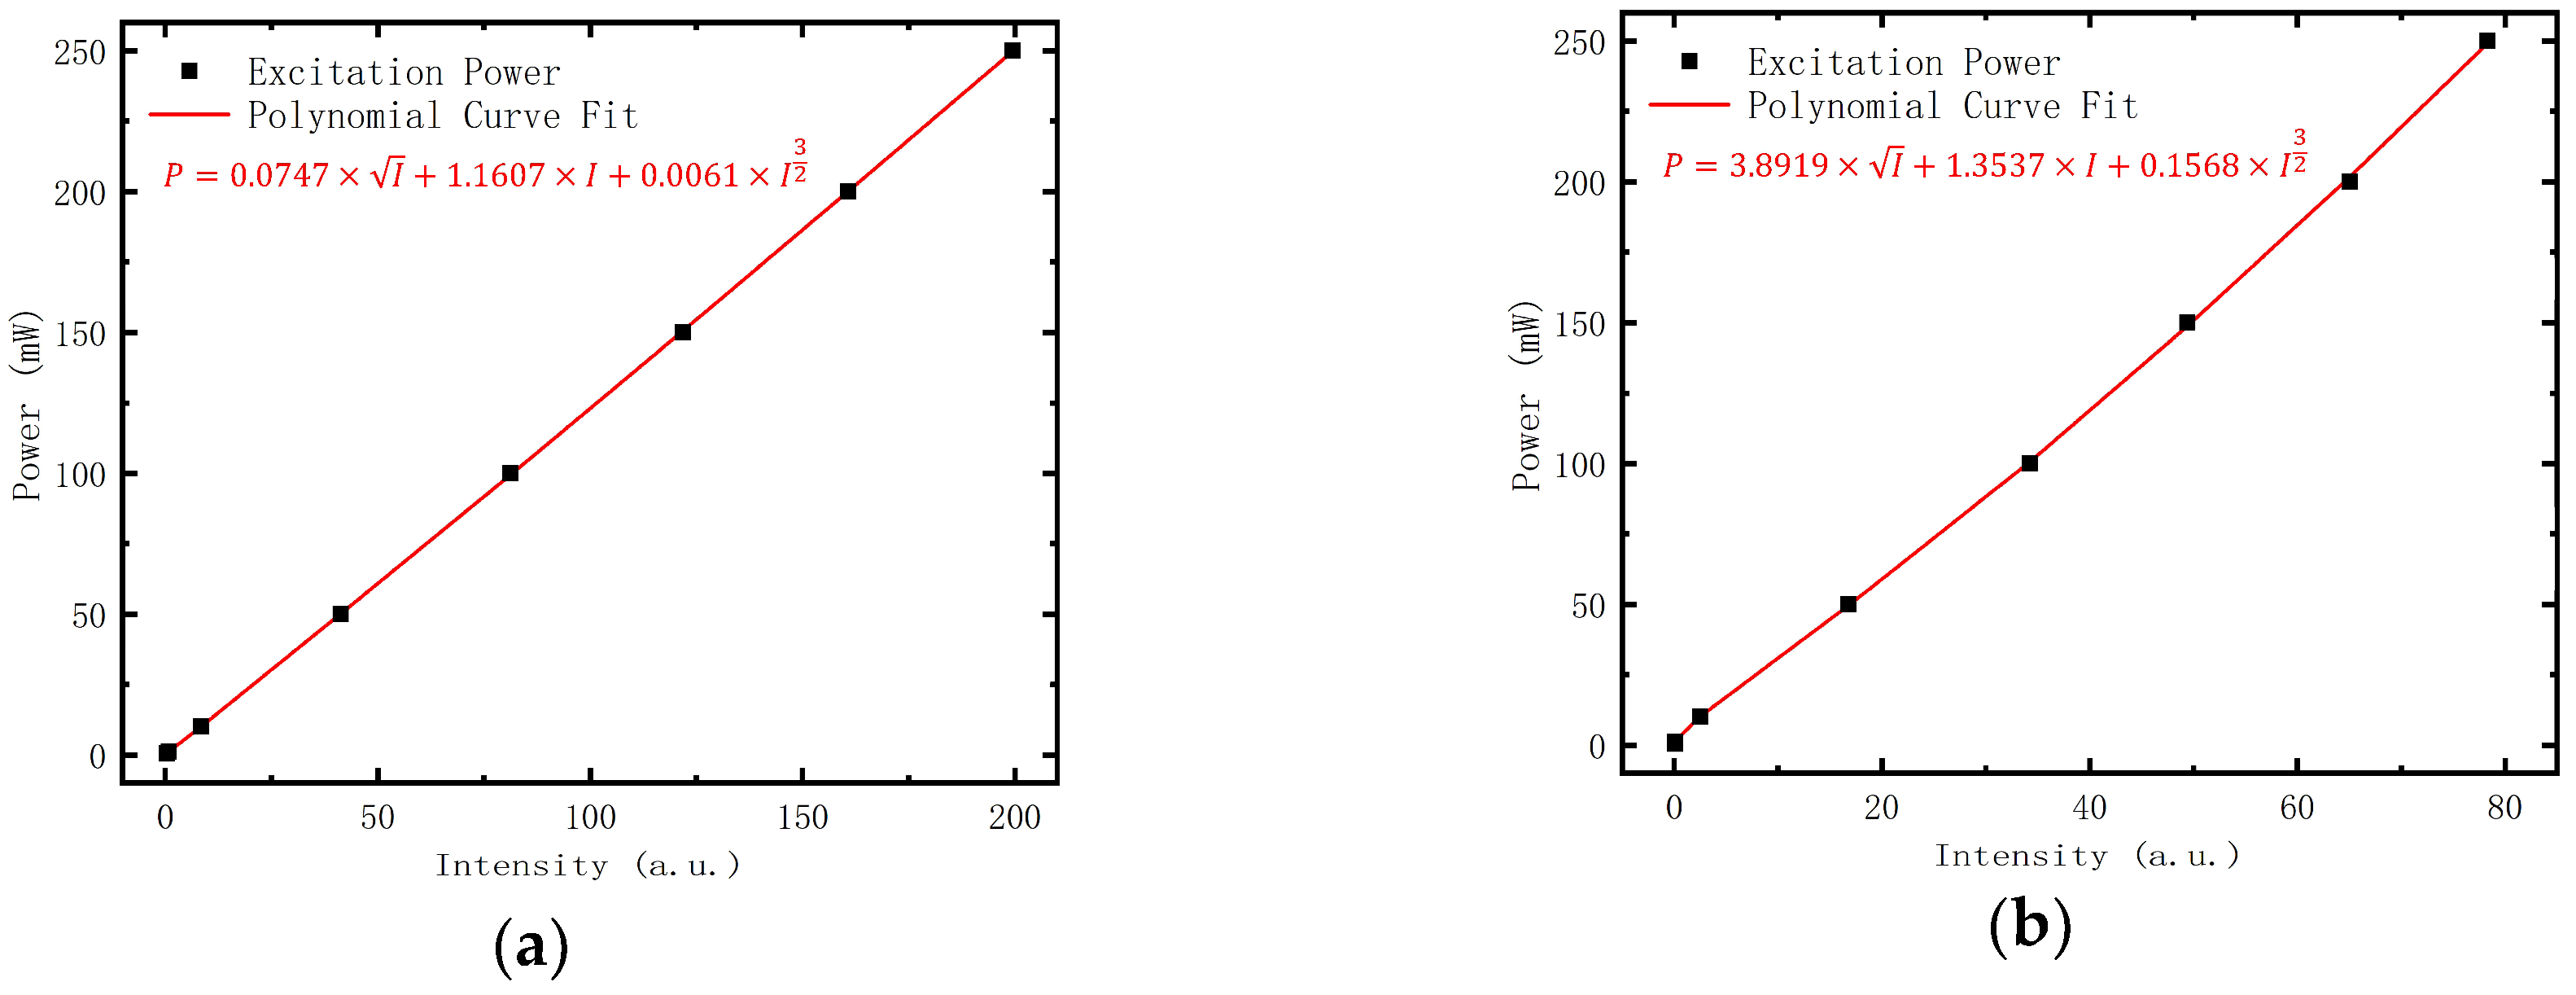
Polynomial curve fit is used to extract fitting coefficients Q 1 , Q 2 , and Q 3 , which is shown in Figure 4. Rearrange this equation with these fitting coefficients and we can express P as a function of m B n . Solve this cubic equation using numerical approach and IQE can be derived as
IQE PDPL ( T , P ) = B ( T ) n ( T , P ) 2 G ( T , P ) = ( m ( T ) B ( T ) n ( T , P ) ) 2 P
Figure 5a shows the IQE values stemming from TDPL experiment and IQE values decrease monotonically with increasing temperature, which reflects the proportion of nonradiative recombination increases as the temperature rises. The IQE values calculated decrease slightly with increasing excitation power, which means nonradiative recombination centers (NRCs) are saturated even at relatively low excitation power and Auger recombination starts to dominate.
Figure 5b shows the IQE values stemming from PDPL experiment at LT and room temperature (RT) and IQE values at LT are not 100%. Assuming that IQE values at LT measured by PDPL experiment IQE PDPL ( LT , P ) are reasonable, we can calculate the absolute IQE values at RT as
IQE a ( T , P ) = IQE PDPL ( LT , P ) × IQE TDPL ( T , P )
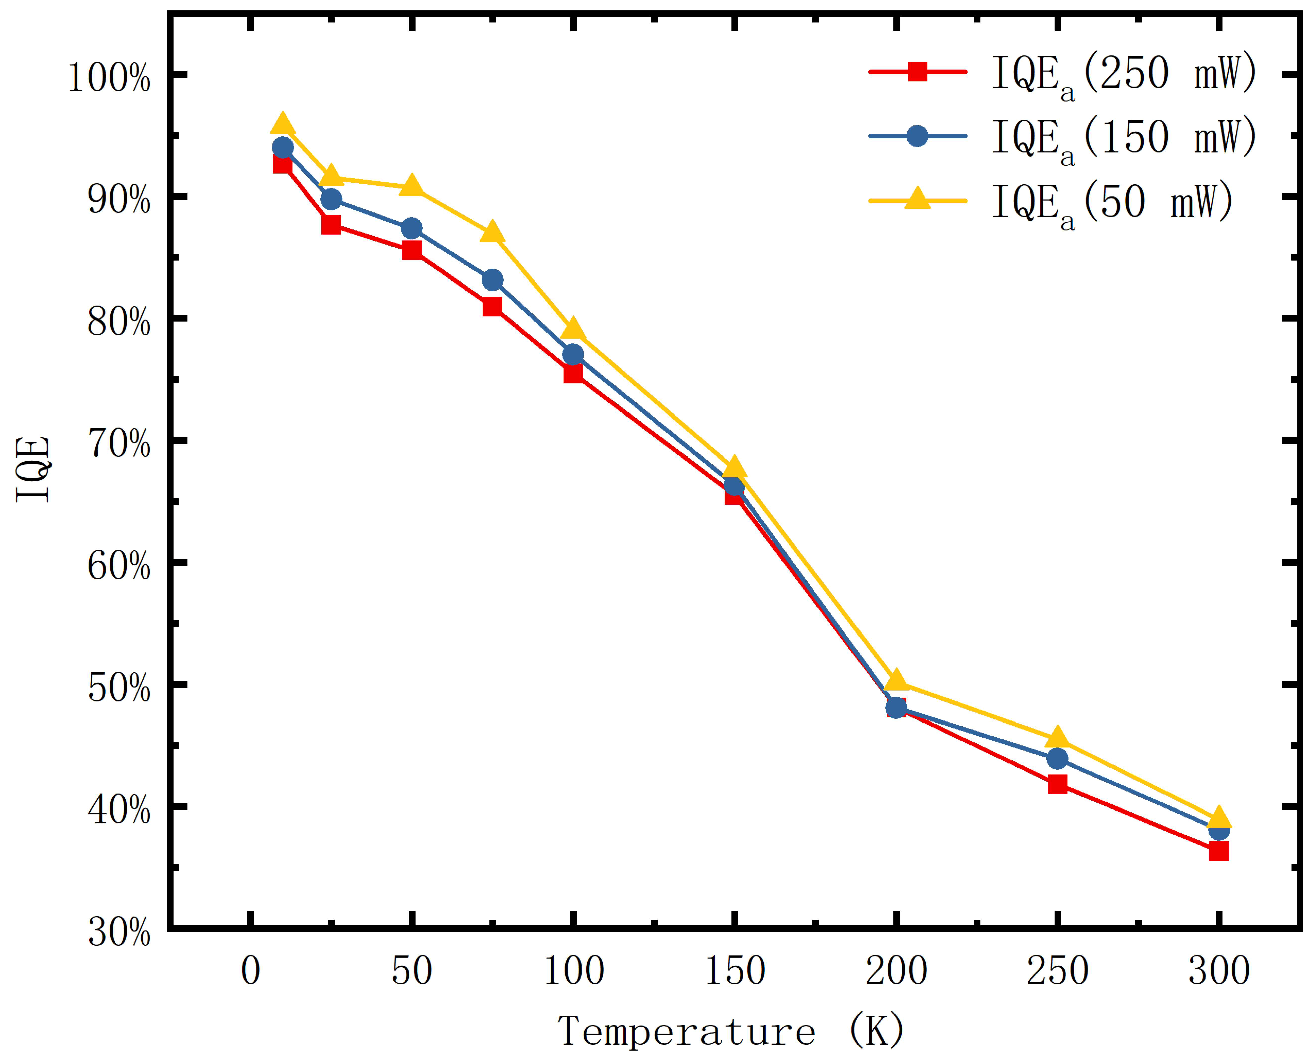
which should be close to IQE values at RT measured by PDPL experiment IQE PDPL ( RT , P ) to make sure PDPL results are trustworthy. For instance, IQE PDPL ( LT , 250   mW ) equals 92.68% and the proportion of IQE values at LT and RT we acquired by TDPL experiment IQE TDPL ( RT , 250   mW ) equals 39.26%. So, the more accurate IQE value at RT can be calculated as IQE a ( RT , 250   mW ) = 92.68 % × 39.26 % = 36.39 % . The modified results, which are in line with PDPL results at RT, are shown in Figure 6. It is reasonable to believe that the IQE values obtained are relatively more accurate.

4. Discussion

The origins of deviation and the applicable conditions of this method should be discussed. In Equation (2), the coefficient ( 1 R ) α A spot h ν , is regarded as a constant at different excitation power, to which we should pay particular attention. In fact, different excitation power corresponds to different absorption coefficient resulting from band filling effect, bandgap renormalization effect, and other nonlinear interactions. The change of absorption coefficient will affect refractive index n due to Kramers–Kronig relations, which influences reflection ratio R ~ ( n 1 ) 2 ( n + 1 ) 2 (shown in Figure 7). As a result, it is better to use P i = ( 1 R ) α P as the variable, which we can measure when we change the output power of laser (see Figure 1a).
Furthermore, the explanation of PDPL results is based on the ABC model which aims at the radiative recombination process of free electron-hole pairs, namely bimolecular recombination. It is well known that exciton recombination plays an important role in GaN-based materials, of which rate equation is different from bimolecular recombination. Therefore, when utilizing PDPL method with GaN-based blue LEDs, care should be taken with its applicable conditions. However, for green LEDs whose indium components are higher than blue LEDs, the piezoelectric polarization induced by lattice mismatch is stronger, which leads to the enhancement of quantum confined Stark effect (QCSE) [23,24]. In consequence, electrons in conduction band and holes in valence band are separated more seriously, which means it is harder to form excitons and carriers are prone to bimolecular recombination. So, this method is generally feasible with GaN-based green LEDs.

5. Conclusions

In conclusion, the optical properties of GaN-based green LED are investigated and an easy-to-implement approach to acquire more accurate IQE values is put forward. This method is based on the combination of the TDPL method, which reflects the proportions of IQE values at different temperature correctly, and PDPL method, which can provide absolute IQE values at LT and RT. If the rectified results of TDPL experiment agree with PDPL results, this method is self-consistent and the IQE values acquired are reasonable.
Finally, the influence of changing reflection ratio at different excitation power is discussed, which is a probable improvement of PDPL experiment. The applicability of this method when dealing with GaN-based green LEDs is demonstrated, since QCSE is stronger in these devices, which prevents excitons from forming.

Author Contributions

Conceptualization, L.W.; methodology, B.L. and L.W.; validation, Z.H., C.S., Y.H., B.X., J.W. and H.L.; resources, K.C. and X.Z.; data curation, J.L. and J.K.; writing—original draft preparation, B.L.; writing—review and editing, B.L and L.W.; supervision, L.W. and Y.L.

Funding

This research was funded by National Key Research and Development Program (Grant No. 2016YFB0401803), S&T Challenging Project (Grant No. 2016003), National Natural Science Foundation of China (Grant Nos. 61574082, 61621064, 61822404 and 51561165012), China Postdoctoral Science Foundation (Grant No. 2018M640129) and Tsinghua University Initiative Scientific Research Program (2015THZ02-3).

Conflicts of Interest

The authors declare no conflict of interest.

References

  1. Nakamura, S.; Senoh, M.; Mukai, T. P-Gan/N-Ingan/N-Gan Double-Heterostructure Blue-Light-Emitting Diodes. Jpn. J. Appl. Phys. 1993, 32, L8–L11. [Google Scholar] [CrossRef]
  2. Nakamura, S.; Mukai, T.; Senoh, M. High-Brightness Ingan/Algan Double-Heterostructure Blue-Green-Light-Emitting Diodes. J. Appl. Phys. 1994, 76, 8189–8191. [Google Scholar] [CrossRef]
  3. Nakamura, S. Ingan/Algan Blue-Light-Emitting Diodes. J. Vac. Sci. Technol. A 1995, 13, 705–710. [Google Scholar] [CrossRef]
  4. Nakamura, S.; Senoh, N.; Iwasa, N.; Nagahama, S.I. High-Brightness Ingan Blue, Green and Yellow Light-Emitting-Diodes with Quantum-Well Structures. Jpn. J. Appl. Phys. 1995, 34, L797–L799. [Google Scholar] [CrossRef]
  5. Suihkonen, S.; Svensk, O.; Lang, T.; Lipsanen, H.; Odnoblyudov, M.A.; Bougrov, V.E. The effect of InGaN/GaN MQW hydrogen treatment and threading dislocation optimization on GaN LED efficiency. J. Cryst. Growth 2007, 298, 740–743. [Google Scholar] [CrossRef] [Green Version]
  6. Kim, H.G.; Cuong, T.V.; Na, M.G.; Kim, H.K.; Kim, H.Y.; Ryu, J.H.; Hong, C.H. Improved GaN-Based LED light extraction efficiencies via selective MOCVD using peripheral microhole Arrays. IEEE Photonic Technol. Lett. 2008, 20, 1284–1286. [Google Scholar] [CrossRef]
  7. Crawford, M.H. LEDs for Solid-State Lighting: Performance Challenges and Recent Advances. IEEE J. Sel. Top. Quant. 2009, 15, 1028–1040. [Google Scholar] [CrossRef]
  8. Lee, J.; Tak, Y.; Kim, J.Y.; Hong, H.G.; Chae, S.; Min, B.; Jeong, H.; Yoo, J.; Kim, J.R.; Park, Y. Growth of high-quality InGaN/GaN LED structures on (111) Si substrates with internal quantum efficiency exceeding 50%. J. Cryst. Growth 2011, 315, 263–266. [Google Scholar] [CrossRef]
  9. Watanabe, S.; Yamada, N.; Nagashima, M.; Ueki, Y.; Sasaki, C.; Yamada, Y.; Taguchi, T.; Tadatomo, K.; Okagawa, H.; Kudo, H. Internal quantum efficiency of highly-efficient InxGa1-xN-based near-ultraviolet light-emitting diodes. Appl. Phys. Lett. 2003, 83, 4906–4908. [Google Scholar] [CrossRef]
  10. Martinez, C.E.; Stanton, N.M.; Kent, A.J.; Graham, D.M.; Dawson, P.; Kappers, M.J.; Humphreys, C.J. Determination of relative internal quantum efficiency in InGaN/GaN quantum wells. J. Appl. Phys. 2005, 98. [Google Scholar] [CrossRef]
  11. Kirste, R.; Collazo, R.; Callsen, G.; Wagner, M.R.; Kure, T.; Reparaz, J.S.; Mita, S.; Xie, J.Q.; Rice, A.; Tweedie, J.; et al. Temperature dependent photoluminescence of lateral polarity junctions of metal organic chemical vapor deposition grown GaN. J. Appl. Phys. 2011, 110. [Google Scholar] [CrossRef]
  12. Xing, Y.C.; Wang, L.; Wang, Z.L.; Hao, Z.B.; Luo, Y.; Sun, C.Z.; Han, Y.J.; Xiong, B.; Wang, J.; Li, H.T. A comparative study of photoluminescence internal quantum efficiency determination method in InGaN/GaN multi-quantum-wells. J. Appl. Phys. 2017, 122. [Google Scholar] [CrossRef]
  13. Smith, M.; Chen, G.D.; Lin, J.Y.; Jiang, H.X.; Khan, M.A.; Chen, Q. Time-resolved photoluminescence studies of InGaN epilayers. Appl. Phys. Lett. 1996, 69, 2837–2839. [Google Scholar] [CrossRef]
  14. Chichibu, S.F.; Azuhata, T.; Sota, T.; Mukai, T.; Nakamura, S. Localized quantum well excitons in InGaN single-quantum-well amber light-emitting diodes. J. Appl. Phys. 2000, 88, 5153–5157. [Google Scholar] [CrossRef]
  15. Iwata, Y.; Banal, R.G.; Ichikawa, S.; Funato, M.; Kawakami, Y. Emission mechanisms in Al-rich AlGaN/AlN quantum wells assessed by excitation power dependent photoluminescence spectroscopy. J. Appl. Phys. 2015, 117. [Google Scholar] [CrossRef]
  16. Ngo, T.H.; Gil, B.; Valvin, P.; Damilano, B.; Lekhal, K.; De Mierry, P. Internal quantum efficiency in yellow-amber light emitting AlGaN-InGaN-GaN heterostructures. Appl. Phys. Lett. 2015, 107. [Google Scholar] [CrossRef]
  17. Xing, Y.C.; Wang, L.; Yang, D.; Wang, Z.L.; Hao, Z.B.; Sun, C.Z.; Xiong, B.; Luo, Y.; Han, Y.J.; Wang, J.; et al. A novel model on time-resolved photoluminescence measurements of polar InGaN/GaN multiquantum-well structures. Sci. Rep. 2017, 7. [Google Scholar] [CrossRef]
  18. De Araujo, M.A.C.; Silva, R.; de Lima, E.; Pereira, D.P.; de Oliveira, P.C. Measurement of Gaussian laser beam radius using the knife-edge technique: Improvement on data analysis. Appl. Opt. 2009, 48, 393–396. [Google Scholar] [CrossRef]
  19. Cho, Y.H.; Gainer, G.H.; Fischer, A.J.; Song, J.J.; Keller, S.; Mishra, U.K.; DenBaars, S.P. “S-shaped” temperature-dependent emission shift and carrier dynamics in InGaN/GaN multiple quantum wells. Appl. Phys. Lett. 1998, 73, 1370–1372. [Google Scholar] [CrossRef]
  20. Wang, Z.L.; Wang, L.; Xing, Y.C.; Yang, D.; Yu, J.D.; Hao, Z.B.; Sun, C.Z.; Xiong, B.; Han, Y.J.; Wang, J.; et al. Consistency on Two Kinds of Localized Centers Examined from Temperature-Dependent and Time-Resolved Photoluminescence in InGaN/GaN Multiple Quantum Wells. ACS Photonics 2017, 4, 2078–2084. [Google Scholar] [CrossRef]
  21. Dai, Q.; Schubert, M.F.; Kim, M.H.; Kim, J.K.; Schubert, E.F.; Koleske, D.D.; Crawford, M.H.; Lee, S.R.; Fischer, A.J.; Thaler, G.; et al. Internal quantum efficiency and nonradiative recombination coefficient of GaInN/GaN multiple quantum wells with different dislocation densities. Appl. Phys. Lett. 2009, 94. [Google Scholar] [CrossRef]
  22. Karpov, S. ABC-model for interpretation of internal quantum efficiency and its droop in III-nitride LEDs: A review. Opt. Quant. Electron. 2015, 47, 1293–1303. [Google Scholar] [CrossRef]
  23. Che, S.; Yuki, A.; Watanabe, H.; Ishitani, Y.; Yoshikawa, A. Fabrication of Asymmetric GaN/InN/InGaN/GaN Quantum-Well Light Emitting Diodes for Reducing the Quantum-Confined Stark Effect in the Blue-Green Region. Appl. Phys. Express 2009, 2, 021001. [Google Scholar] [CrossRef]
  24. Tsai, S.C.; Lu, C.H.; Liu, C.P. Piezoelectric effect on compensation of the quantum-confined Stark effect in InGaN/GaN multiple quantum wells based green light-emitting diodes. Nano Energy 2016, 28, 373–379. [Google Scholar] [CrossRef]
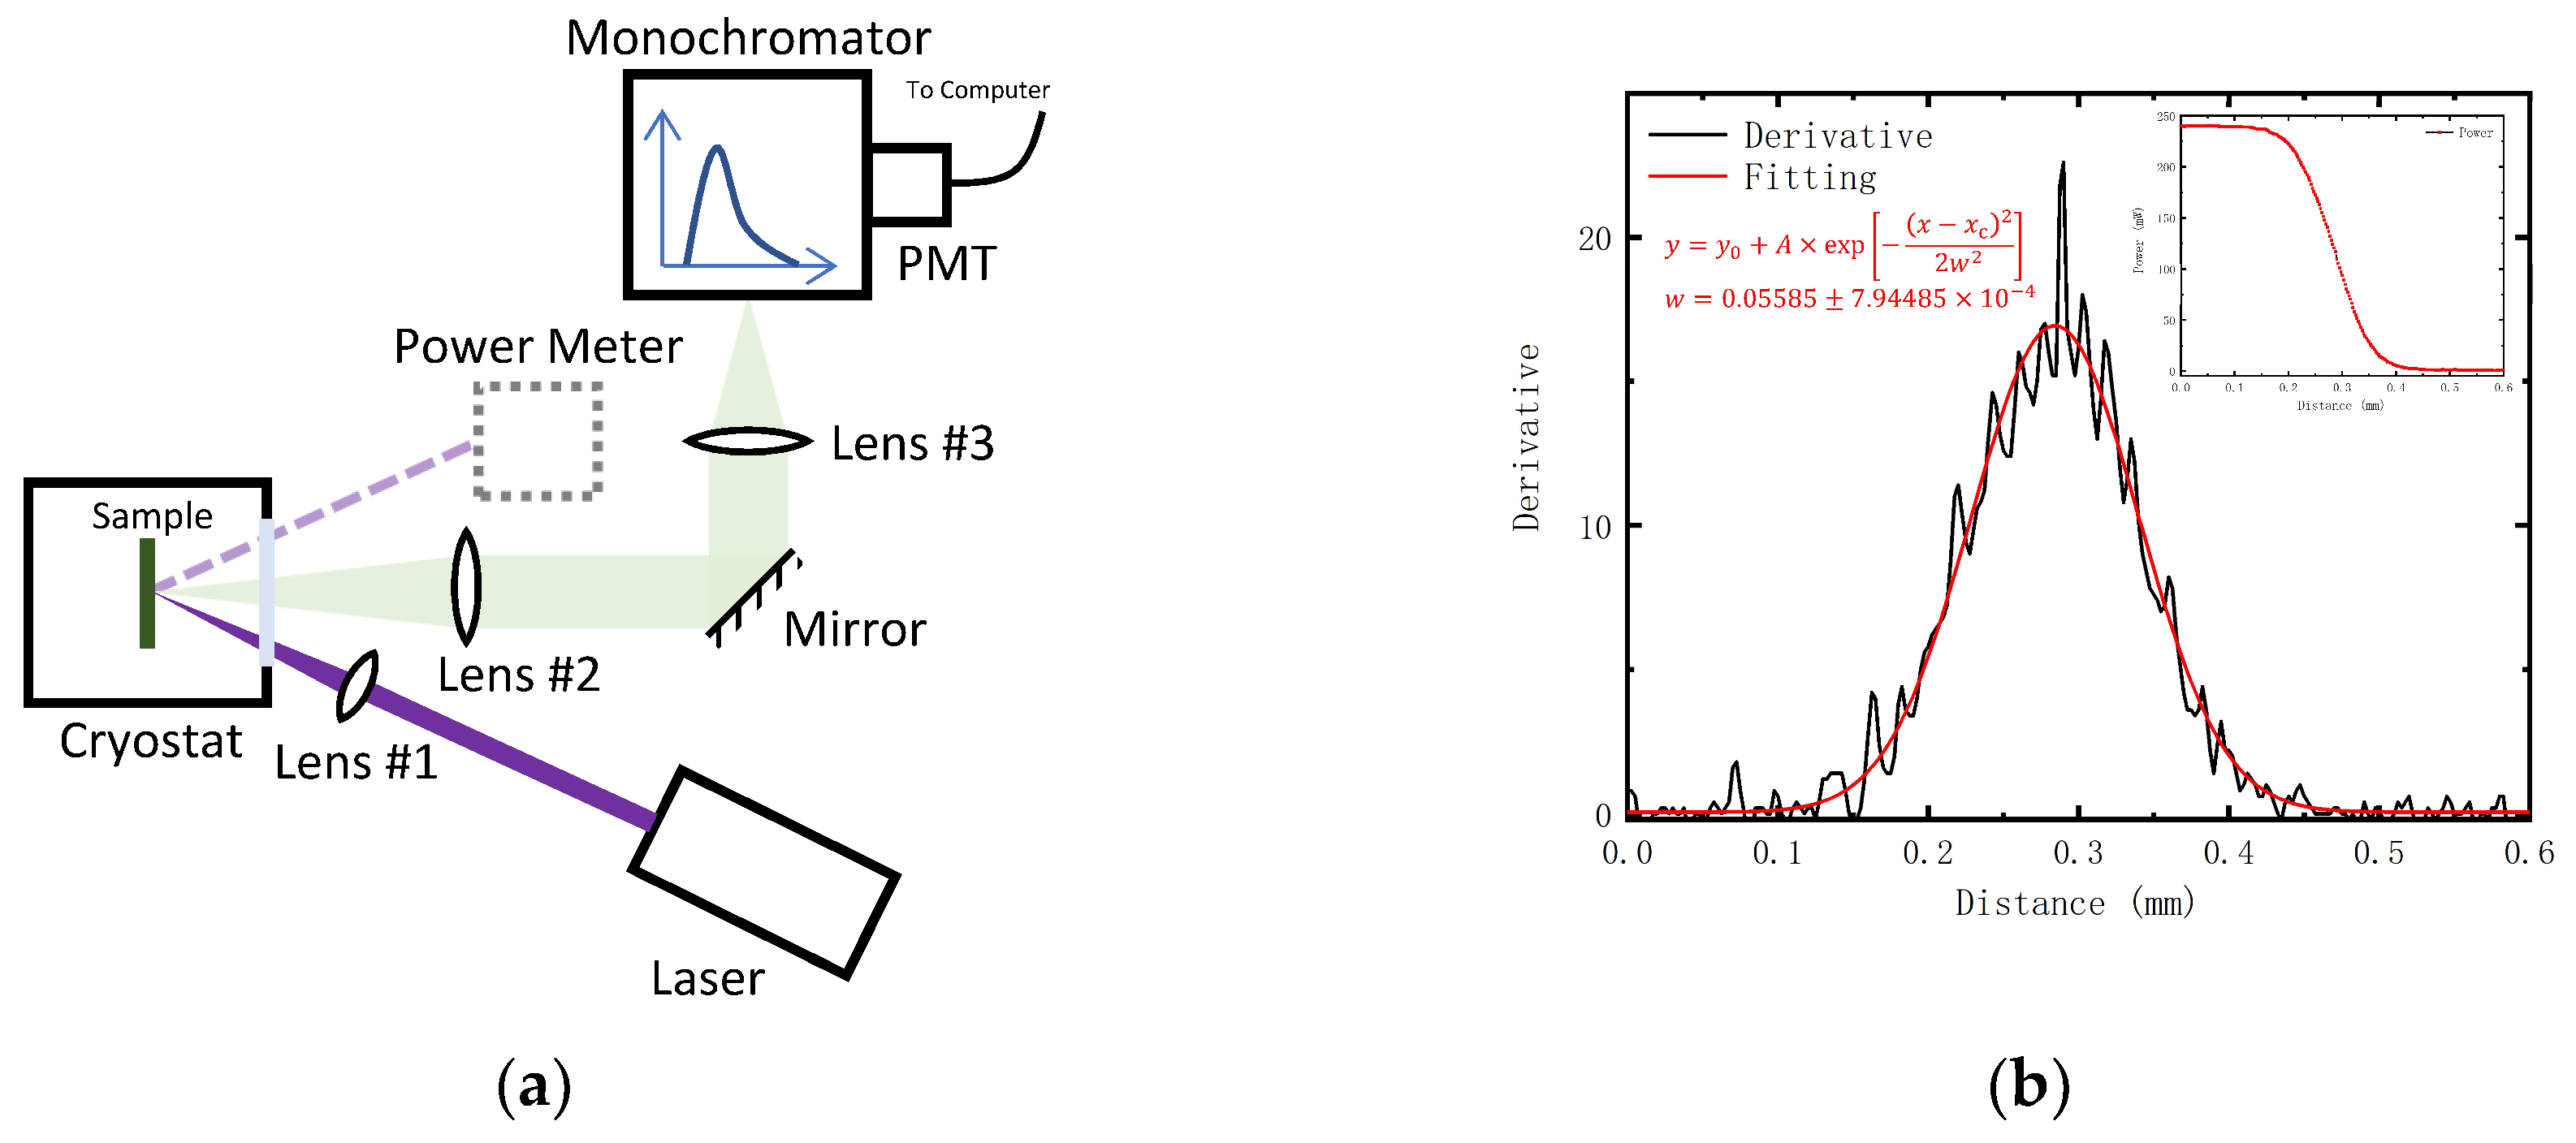
Figure 1. (a) A schematic of the experimental apparatus in which the power meter shown with dashed line is used to improve the accuracy of the experiment mentioned in the section of discussion; (b) The gaussian fit result of derivative of measured data at excitation power of 250 mW as described in the inset to determine the spot radius on the sample using the knife-edge method.
Applsci 09 00383 g001
Figure 2. The spectra at different temperature and excitation power of (a) 250 mW, (b) 150 mW and (c) 50 mW. The blue lines designating central wavelengths (CWs) at low temperature (LT) are shown to observe the shift clearly.
Applsci 09 00383 g002
Figure 3. (a) Central wavelengths (CWs) at different temperature and three fixed excitation power; (b) Spectra at different temperature and three fixed excitation power which are normalized and shifted to a same CW.
Applsci 09 00383 g003
Figure 4. (a) Polynomial curve fit of power dependent photoluminescence (PDPL) results at low temperature (LT); (b) Polynomial curve fit of PDPL results at room temperature (RT). Auger recombination (the third term of the polynomial) should be considered otherwise the coefficient of determination will become worse.
Applsci 09 00383 g004
Figure 5. (a) The internal quantum efficiency (IQE) values calculated by temperature dependent photoluminescence (TDPL) results at different temperature and three fixed excitation power; (b) The IQE values calculated by power dependent photoluminescence (PDPL) results at different excitation power and two fixed temperature.
Applsci 09 00383 g005
Figure 6. The modified internal quantum efficiency (IQE) values at different temperature and three fixed excitation power which are in line with power dependent photoluminescence (PDPL) results at room temperature (RT).
Applsci 09 00383 g006
Figure 7. The reflected power and reflection ratio at different incident excitation power of another green light emitting diodes (LED) sample pumped with the same laser which demonstrates the dependence of excitation power and reflection ratio.
Applsci 09 00383 g007