1. Introduction
The ultrasonic Lamb wave technique has been successfully applied in the nondestructive testing (NDT) of plates. It has the advantage of a long propagation distance, which is particularly suitable for testing large areas through the thickness of the waveguide [
1,
2,
3,
4]. However, several challenges still exist in Lamb wave nondestructive testing. Lamb waves are multimodal waves within a frequency region with a dispersive nature because their velocities are frequency dependent. In the actual testing, Lamb wave signals have different modes for any given plate thickness and excitation frequency, and the dispersion of each mode is different; that is, different frequency components of a specific propagation mode propagate at different speeds, which leads to the signal stretching in time and reducing the spatial resolution [
5]. It can be seen from the dispersion characteristics that the phase velocities of some modes are very close under certain excitation conditions. Lamb wave signals are often overlapped in both time and frequency domains, and signal interpretations are often difficult.
In recent years, many signal processing methods have been applied to the dispersion compensation and mode separation of Lamb waves [
6,
7,
8,
9,
10]. Hilbert-Huang transform (HHT) [
9] obtained high time-frequency resolution through empirical mode decomposition [
10] and Hilbert spectrum. Xu et al. [
11] used the spectral phase and signal delay function to model the guided wave dispersion and used the single-mode compensation function to compensate the mixed guided wave signals, making the single-mode dispersion signal back to the excitation signal. They effectively extracted each of the multimodal guided waves. However, in the actual measurement, the specific excitation signals are unknown, resulting in a large error in the separation result. To separate dispersive multimodal Lamb waves overlapped in time and frequency domains, the separation method based on dispersion compensation and fractional differential [
12,
13,
14] is presented. Chen et al. [
15] and Xu et al. [
16] proposed the wavelet ridge algorithm to extract the time-frequency ridges of modes, reconstructing their waveforms with their respective time-frequency information. The ridges extracted for adjacent modes with similar dispersion characteristics are often overlapped, which increases the difficulty of identification. Song et al. [
17] proposed the multimodal guided wave signal separation in long bones based on the time-frequency blind signal separation. The experiment only derives the relevant group velocity problem based on the separated signal, and does not give an intuitive separation result to the actual measurement signal. Moreover, the time-frequency distribution may be interfered with by factors such as cross terms, resulting in a decrease in the accuracy of the separation result.
In order to separate multimodal overlapped Lamb waves effectively, this paper proposes a mode separation method by means of the combination of dispersion compensation with independent component analysis (ICA) [
18] of fourth-order cumulant. ICA is a type of blind signal separation method, and it can avoid the influence of cross terms in the time-frequency distribution method. In the proposed method, taking two-mode overlapped signals as an example, the single-mode dispersion compensation is performed according to the measured distance difference between the two sets of signals. The two sets of signals are returned to the same distance. The fourth-order cumulant ICA method is further used to process the Lamb wave signals of different superposition situations at the same distance. The corresponding mode signal contained in the two sets of signals at the same position is separated. The different modes are compensated and separated successively, thereby achieving the multimodal signal separation.
3. Results
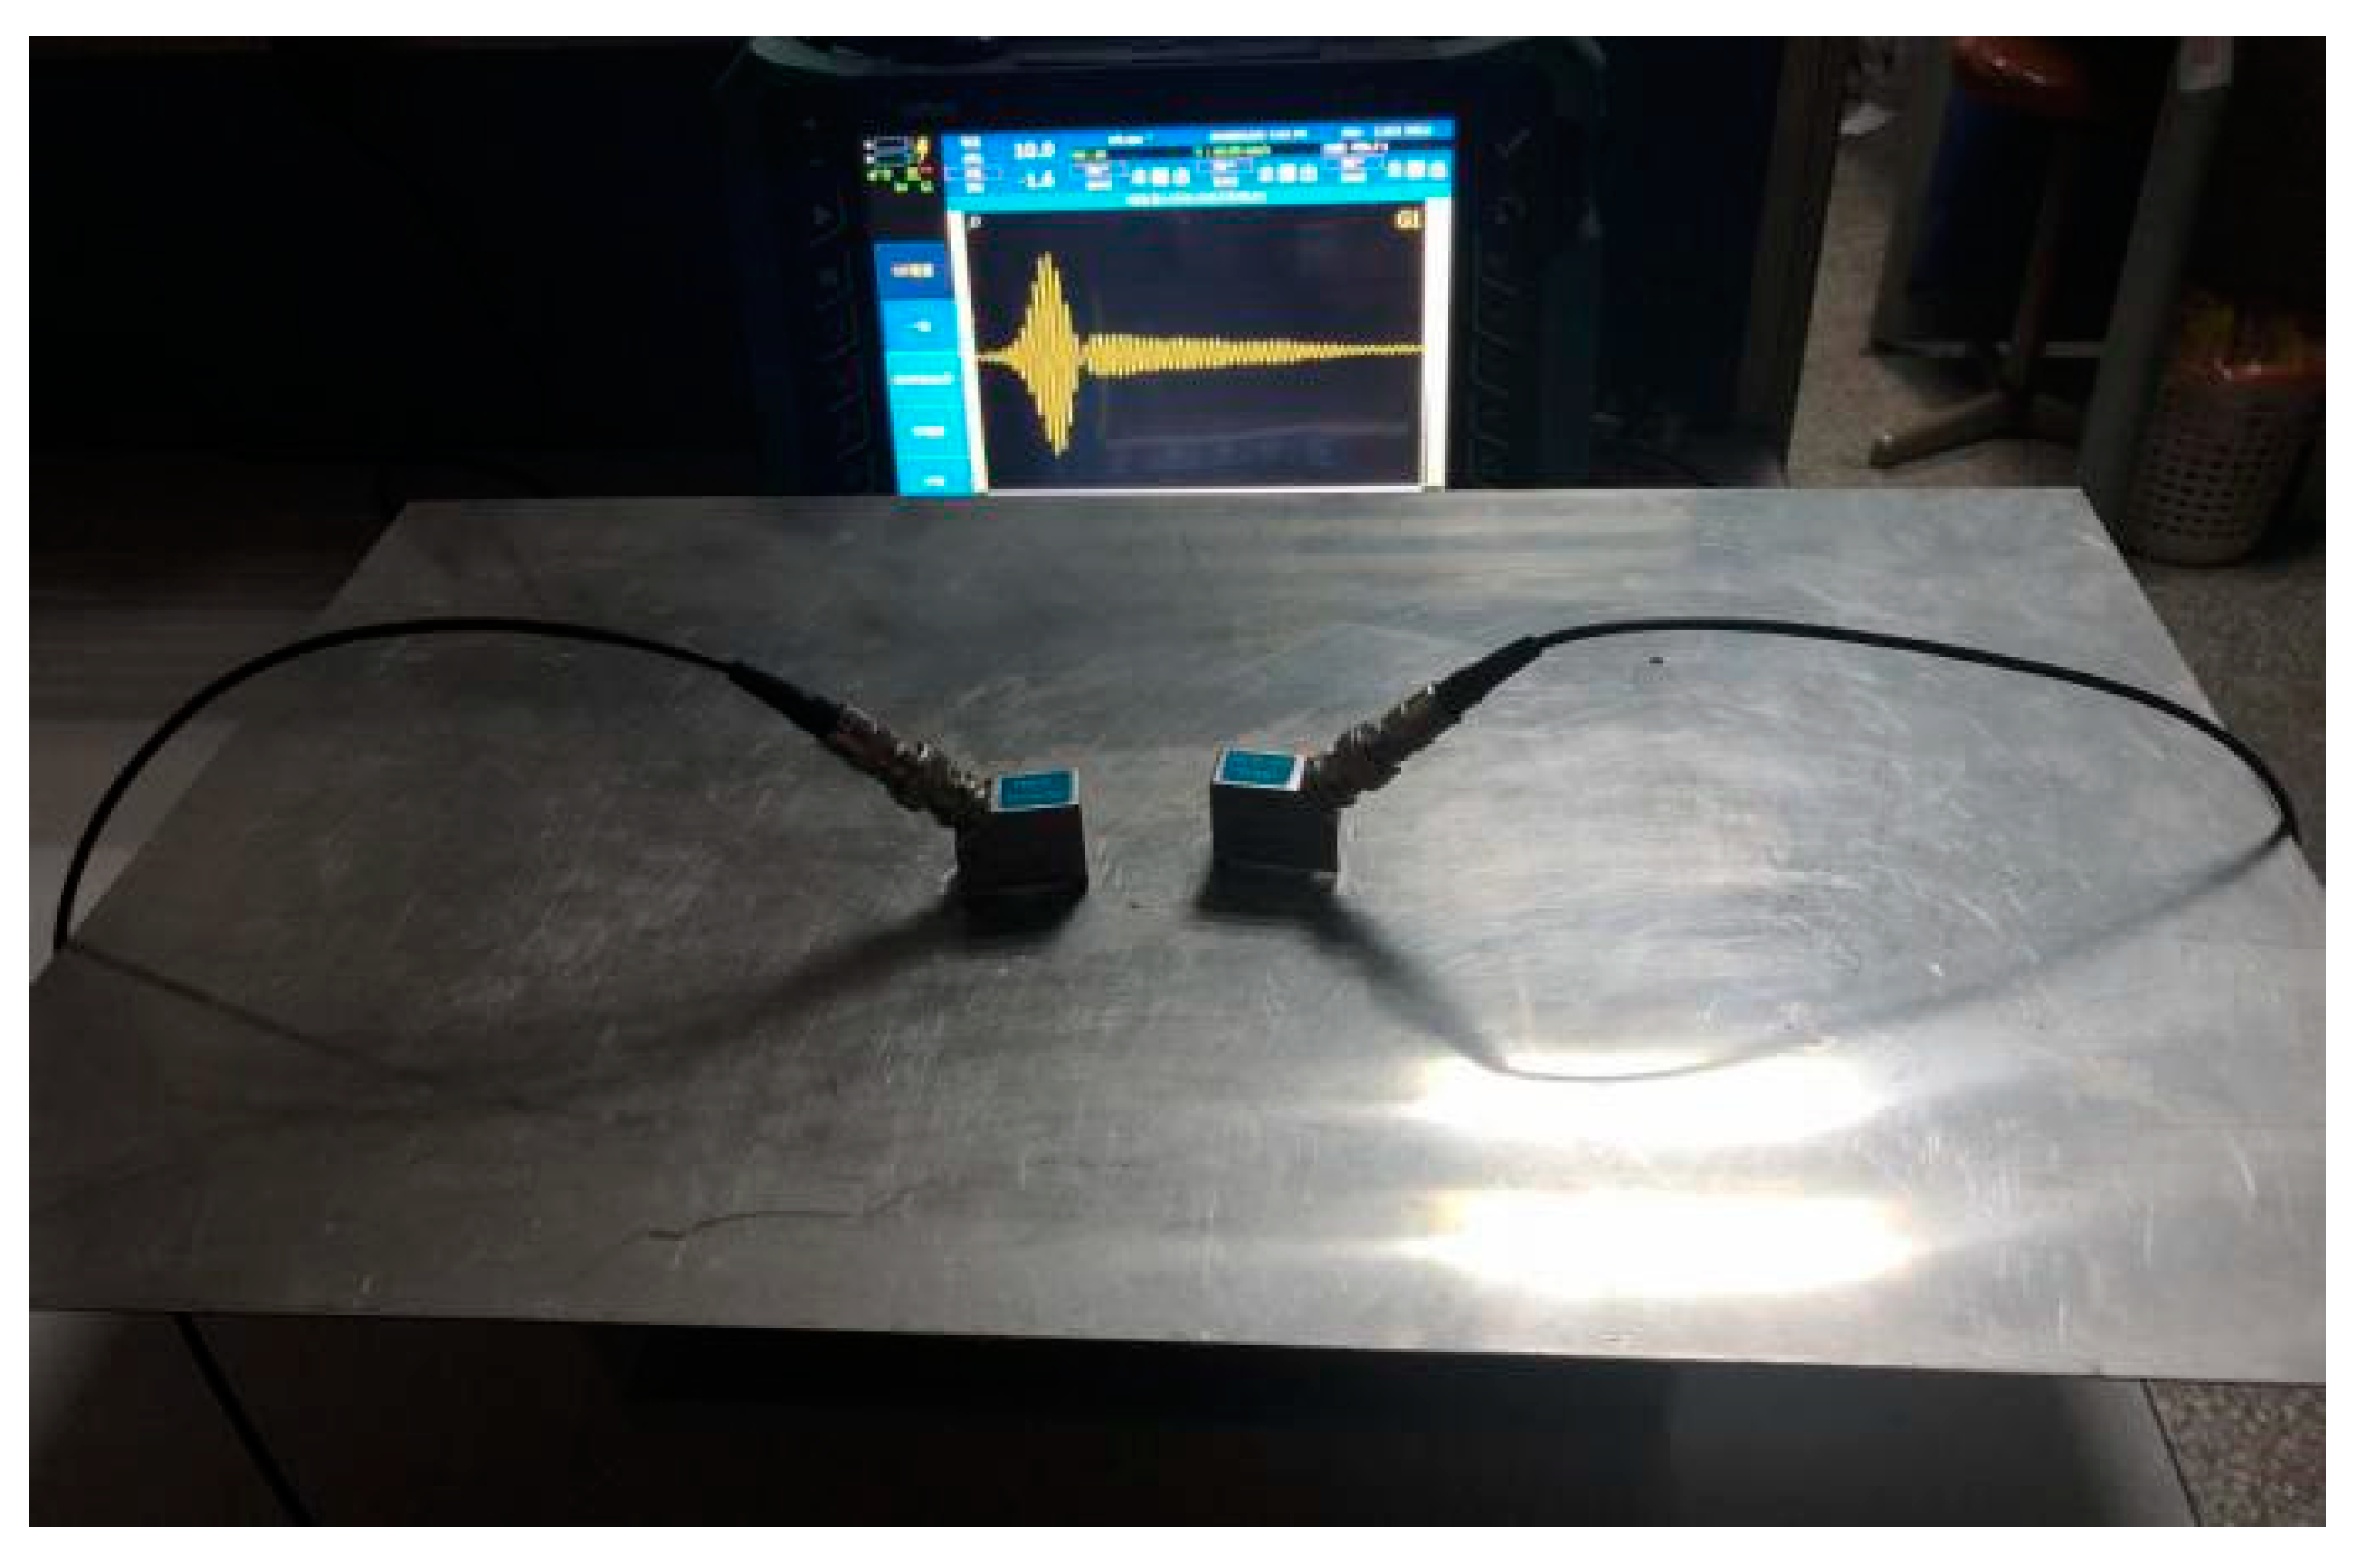
In order to verify the feasibility of the above method, it has been applied to experimentally obtained Lamb wave signals. The Olympus MX2 flaw detector was used to send the excitation signal and receive mixed Lamb wave signals. The workpiece was a stainless-steel plate with the thickness of 1 mm. The multimodal Lamb waves were excited and received by oblique transducers of 10 mm × 10 mm with the central frequency of 2.5 MHz and the incident angle of 26°. A coupling agent was used to facilitate the effective transmission of acoustic energy between the transducers and the steel plate. The data measured by the detector were imported into the computer and processed on the Matlab platform. The whole experiment is shown in
Figure 1.
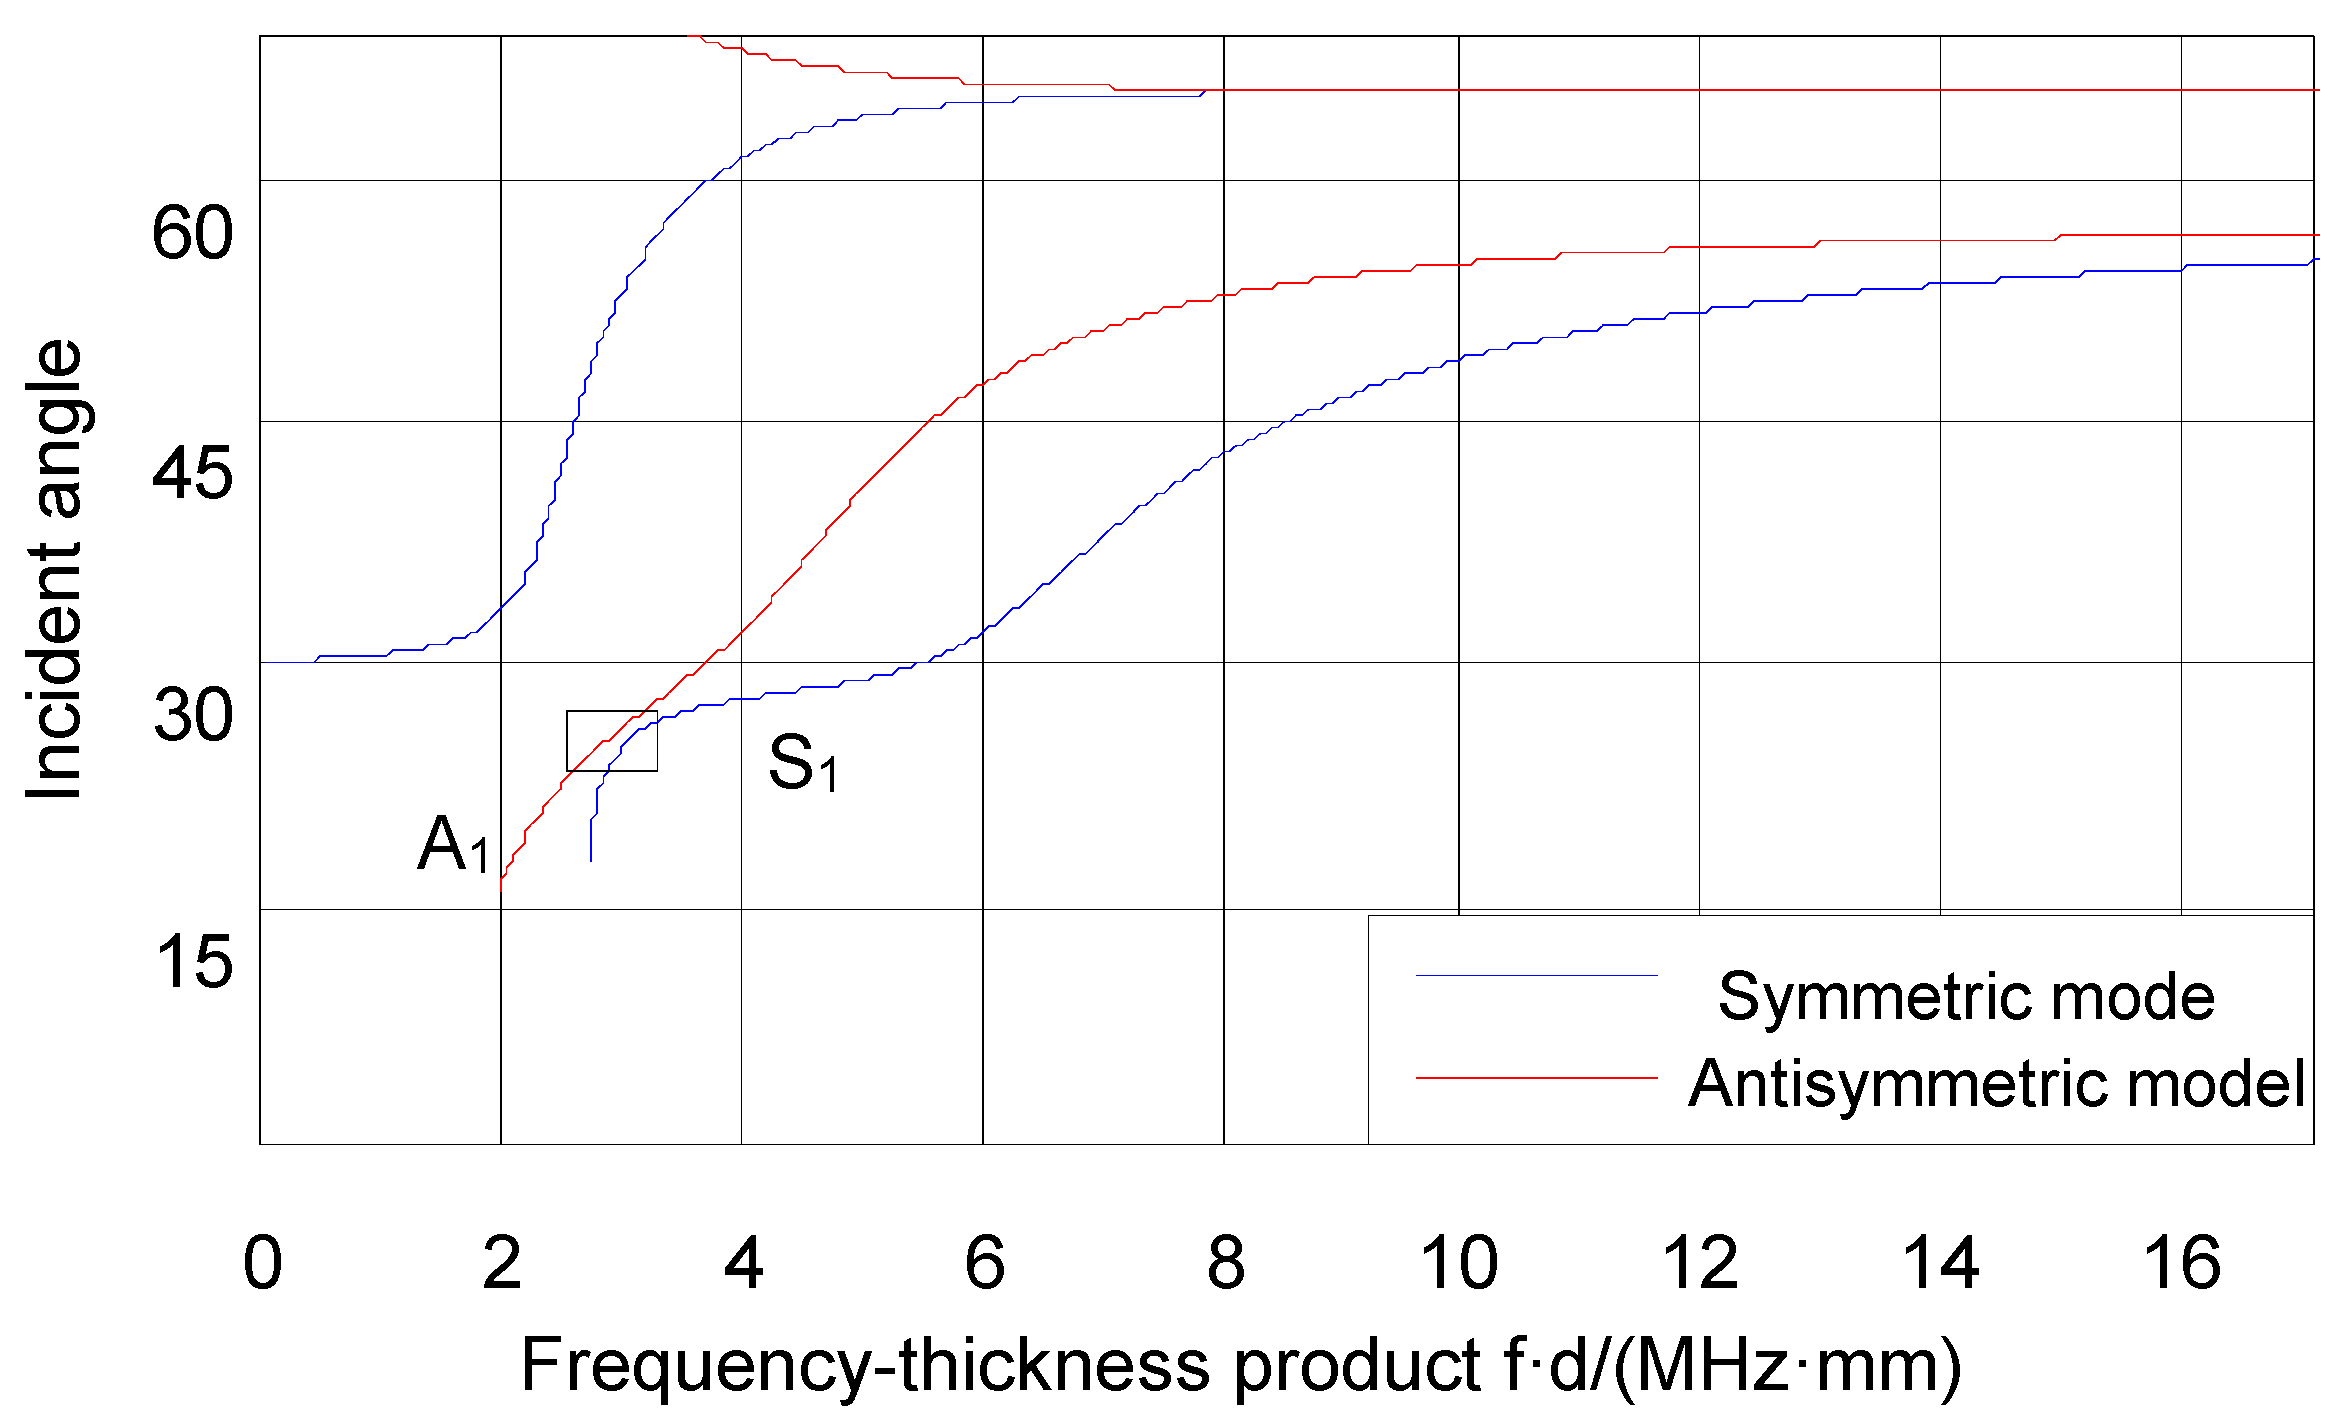
Theoretically, it can be known from the Lamb waves incident angle dispersion curve, as shown in
Figure 2, that
and
modes can be excited when the incidence angle is 26°. Although the two modes are very close to each other at a certain frequency domain, there is always no intersection, which will not lead to conversion between modes. Their corresponding center frequencies are 3 MHz and 3.15 MHz, respectively.
The multimodal Lamb wave signals at the propagation distance of 1.6 cm and 2.7 cm are recorded and shown in
Figure 3.
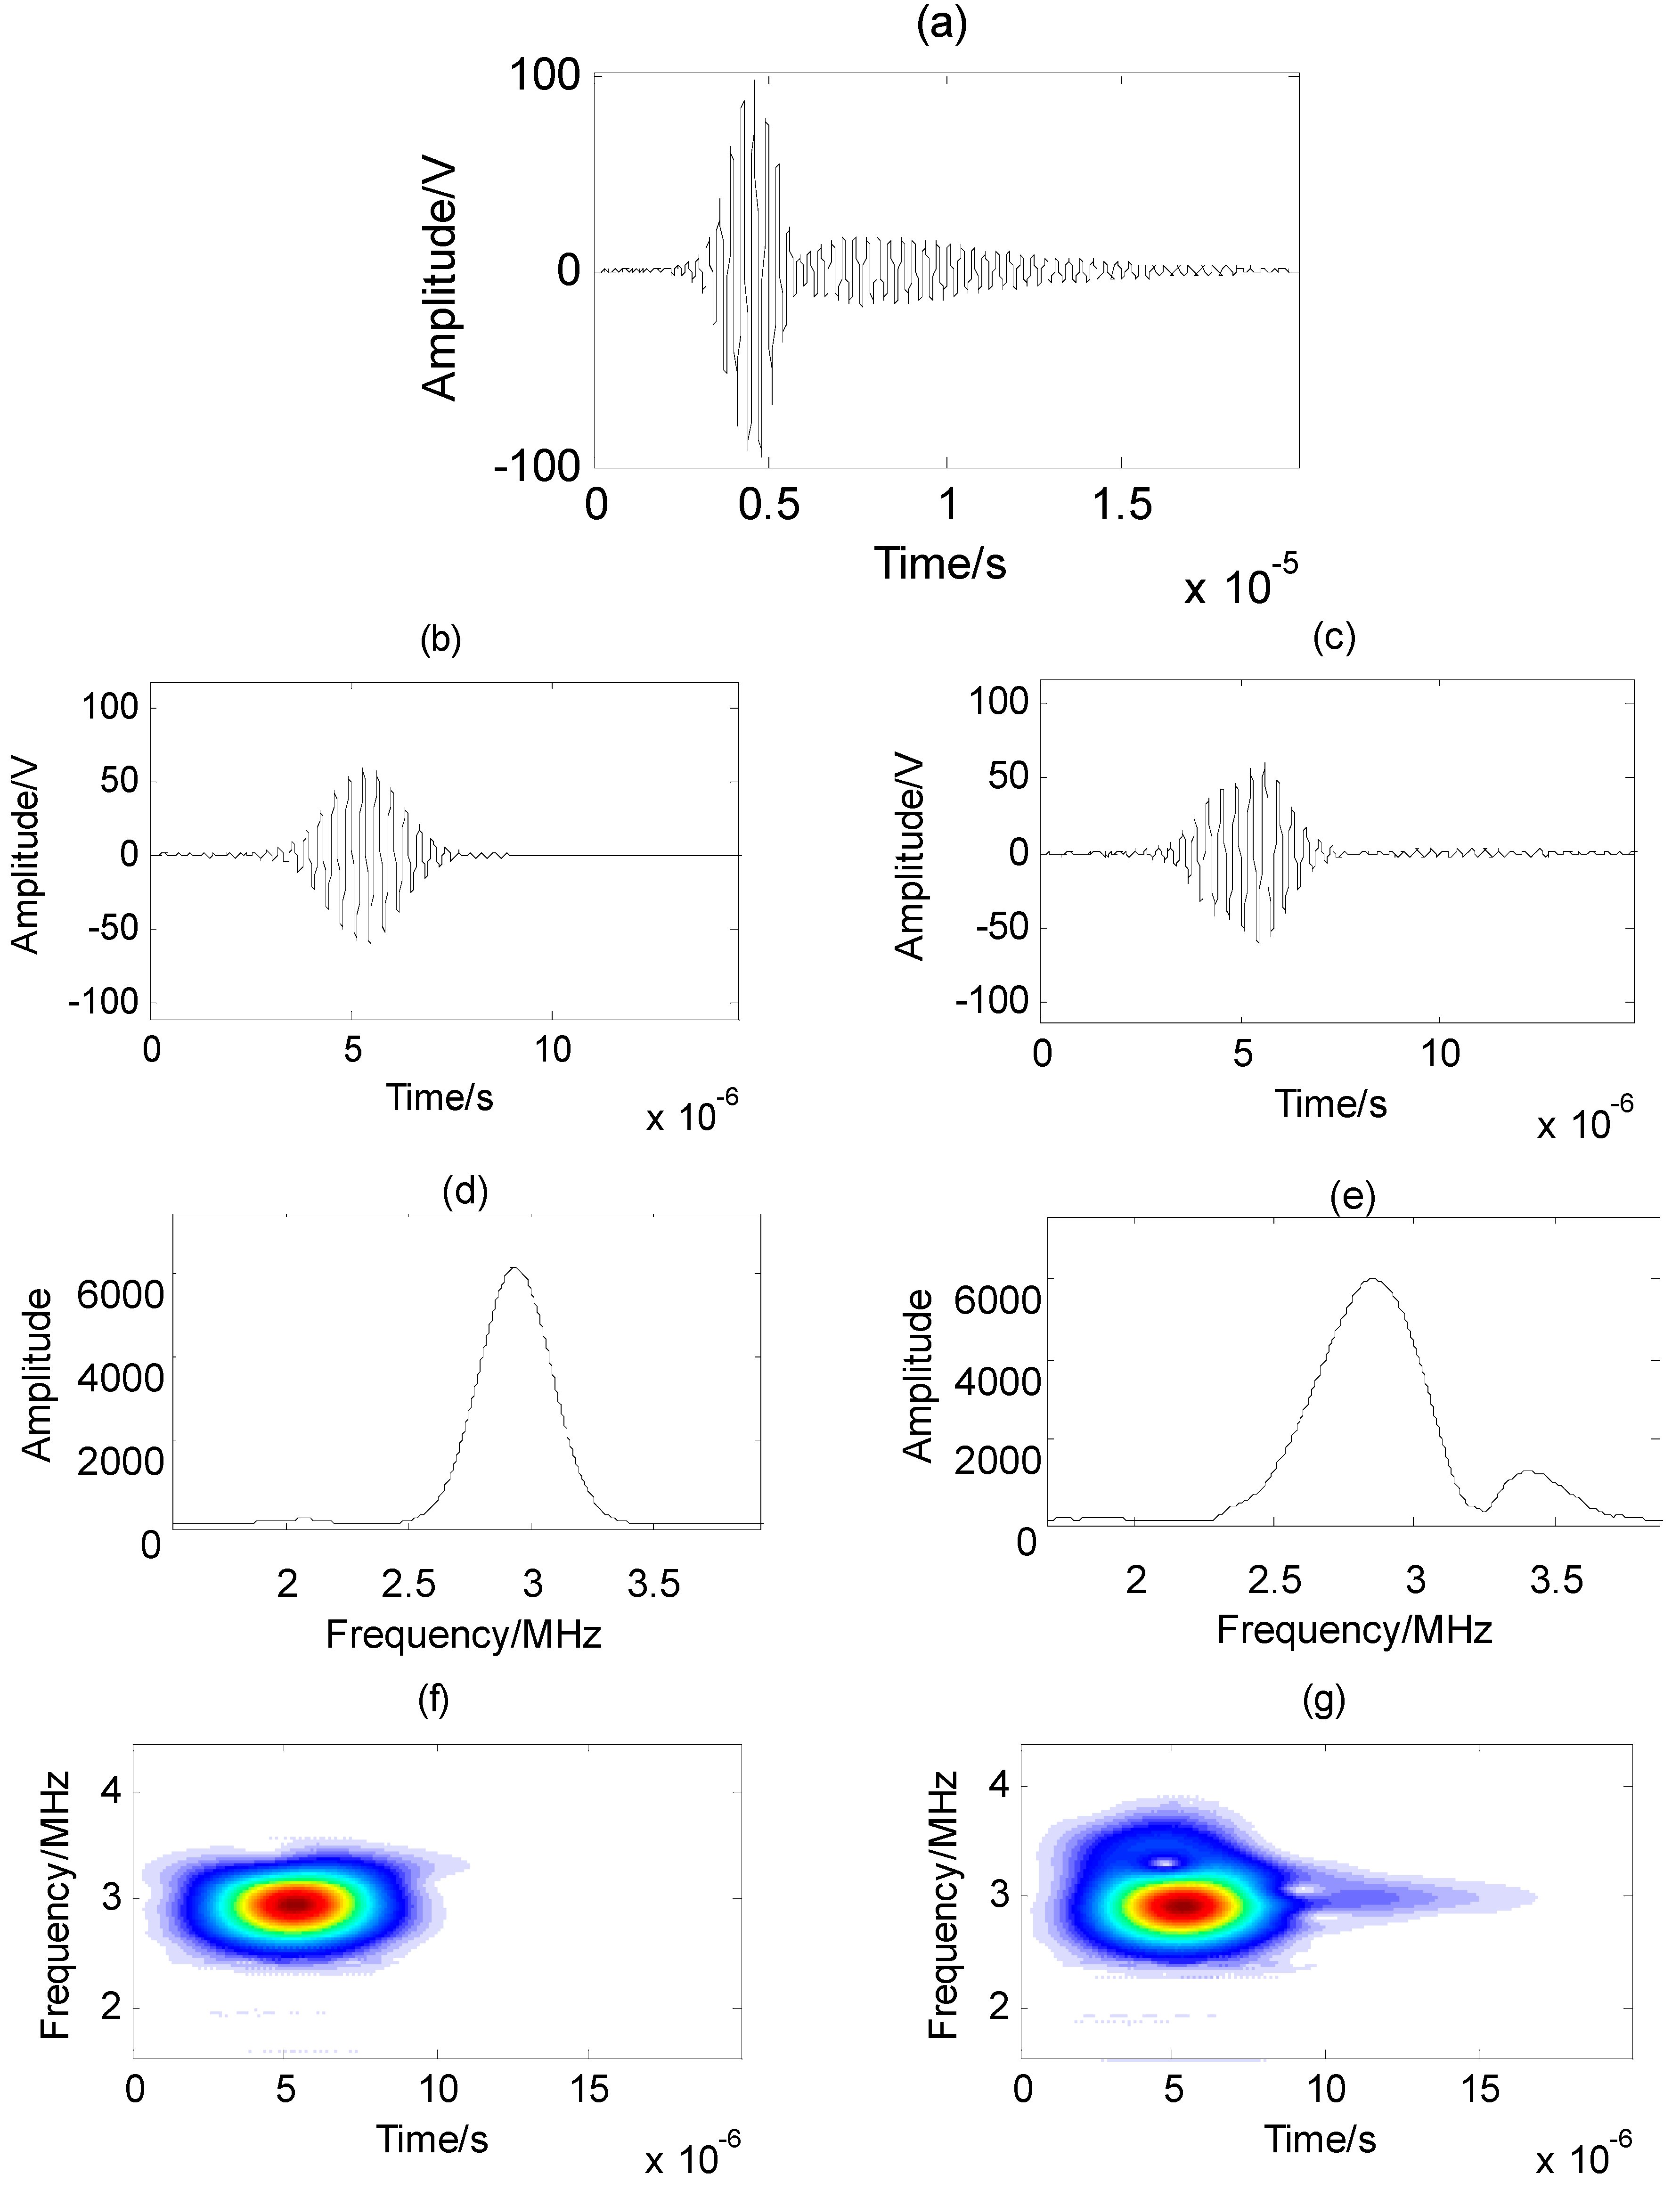
According to the above method, the A
1 mode signal at the distance of 1.6 cm is retrieved, as shown in
Figure 4. The multimodal Lamb wave signal at the distance of 2.7 cm after compensation using the
A1 mode dispersion characteristic is shown in
Figure 4a. The separated A
1 mode signal using the proposed method at the distance of 1.6 cm is shown in
Figure 4b. Its amplitude spectrum is shown in
Figure 4d, and its time-frequency distribution is shown in
Figure 4f. The separated A
1 mode signal using the time-frequency blind signal separation method at the distance of 1.6 cm is shown in
Figure 4c. Its amplitude spectrum is shown in
Figure 4e, and its time-frequency distribution is shown in
Figure 4g.
The S
1 mode signal at the distance of 1.6 cm is also retrieved, as shown in
Figure 5. The multimodal Lamb wave signal at the distance of 2.7 cm after compensation using the S
1 mode dispersion characteristic is show in
Figure 5a. The separated S
1 mode signal using the proposed method at the distance of 1.6 cm is shown in
Figure 5b. Its amplitude spectrum is shown in
Figure 5d and its time-frequency distribution is shown in
Figure 5f. The separated S
1 mode signal using the time-frequency blind signal separation method at the distance of 1.6 cm is shown in
Figure 5c. Its amplitude spectrum is shown in
Figure 5e, and its time-frequency distribution is shown in
Figure 5g.
In order to further verify the proposed method, the separated A
1 and S
1 mode signals are added and shown in
Figure 6a,b. The original measured mixed Lamb wave signal at the distance of 1.6 cm is also shown in the figure. In
Figure 6a, the reconstructed signal is obtained using the time-frequency blind signal separation method. In
Figure 6b, the reconstructed signal is obtained using the proposed method. The time-frequency distributions of the original signal and the reconstructed signal are shown in
Figure 6b,c, respectively.
4. Discussion
From
Figure 3, the signal start time at the distance of 1.6 cm is about 2.8 μs and the signal start time at the distance of 2.7 cm is about 3.6 μs. With the increase in distance, both A
1 and S
1 modes will continue to disperse. The amplitude of the signals will decrease, and the duration will extend.
The A
1 mode signal at the distance of 1.6 cm is retrieved, as shown in
Figure 4. The multimodal Lamb wave signal at the distance of 2.7 cm after compensation using the A
1 mode dispersion characteristic is shown in
Figure 4a. The signal start time after compensation has been compensated back to around 2.8 μs. The separated A
1 mode signal using the proposed method at the distance of 1.6 cm is shown in
Figure 4b. The separated A
1 mode signal using the time-frequency blind signal separation method at the distance of 1.6 cm is shown in
Figure 4c. Their amplitude spectra are shown in
Figure 4d,e, respectively. Their time-frequency distributions are shown in
Figure 4f,g, respectively. It can be seen from the time signals that the extracted signal using the time-frequency blind signal separation method has large errors due to the influence of Lamb wave dispersion and the source signal cross-term interference or local correlation under the calculation of global time-frequency distribution. It can be seen from the amplitude spectra and the time-frequency distributions that the separated A
1 mode signal using the time-frequency blind signal separation method still contains some part of the S
1 mode signal. There is still some part of the S
1 mode amplitude on the right side of the amplitude spectrum, and the tail energy remains in the time-frequency distribution. Therefore, the separation precision is low. However, the accuracy of separation is improved by using the proposed method. The separation result has better smoothness, which is consistent with the dispersion of the A
1 mode Lamb wave. From
Figure 4f, the time-frequency of the extracted A
1 mode signal is non-stationary. From
Figure 4d, the central frequency of the extracted A
1 mode signal is 2.98 MHz, and the frequency range is from 2.5 to 3.35 MHz.
The S
1 mode signal at the distance of 1.6 cm is retrieved, as shown in
Figure 5. The multimodal Lamb wave signal at the distance of 2.7 cm after compensation using the S
1 mode dispersion characteristic is shown in
Figure 5a. The separated S
1 mode signal using the proposed method at the distance of 1.6 cm is shown in
Figure 5b. The separated S
1 mode signal using the time-frequency blind signal separation method at the distance of 1.6 cm is shown in
Figure 5c. Their amplitude spectra are shown in
Figure 5d,e, respectively. Their time-frequency distributions are shown in
Figure 5f,g, respectively. It can be seen from the time signals that the extracted signal using the time-frequency blind signal separation method has large errors due to the influence of Lamb wave dispersion and the source signal cross-term interference or local correlation under the calculation of global time-frequency distribution. There are even some irregular signals in the time signal. It can be seen from the amplitude spectra and the time-frequency distributions that the separated S
1 mode signal using the time-frequency blind signal separation method still contains some part of the A
1 mode signal and lacks some part of its mode signal. Therefore, the separation precision is low. However, the accuracy of separation is improved by using the proposed method. The separation result has better smoothness, which is consistent with the dispersion of the S
1 mode Lamb wave. The right part of the amplitude spectrum is slightly irregular, which means it has some minor errors. From
Figure 5f, the time-frequency of the extracted S
1 mode signal is non-stationary. From
Figure 5d, the central frequency of the extracted S
1 mode signal is 3.14 MHz, and the frequency range is from 2.7 to 3.55 MHz.
The experimental results from
Figure 4 and
Figure 5 show that the proposed method can separate the single mode contained in the multimodal mixed signals. The separated signals and spectra indicate that the results have better smoothness. The dispersion degree of the A
1 mode is slow, delaying on the time domain, and the time waveform changes less along the distance. On the contrary, the phase speed of the S
1 mode changes quickly in the low frequency band; the time signal changes significantly along the distance, and the amplitude becomes smaller and the duration longer with the increase of the distance.
Figure 4d and
Figure 5d show the amplitude spectra of the separated A
1 mode and S
1 mode. Except for a slight irregularity at both ends, it is in line with the theoretical analysis of the Lamb wave dispersion. The A
1 mode center frequency is 2.98 MHz, and the S
1 mode is 3.14 MHz.
In order to further verify the proposed method, the separated A
1 and S
1 modes are added and compared with the experimental original measured signal at the distance of 1.6 cm in
Figure 6. From
Figure 6a, to the time-frequency blind signal separation method, the reconstructed signal is very different from the original signal. The result is obvious because the extracted signal mode signals are inaccurate and incomplete. In this method, the dispersion of Lamb waves are not considered resulting in the inaccuracy and incompleteness of single mode separation. On the contrary, to the proposed method, from
Figure 6b, it can be seen that the mixed signals after separation and addition is the same as the original signal. The start and end time points are also the same. The front part of the reconstructed signal is more consistent with that of the original signal, and only a few peaks are slightly larger than the original signal. The tail of the signal is slightly less than that of the original signal. Considering that the tail of the signal is almost the main component of the S
1 mode and its dispersion degree is relatively fast, there may have been incomplete compensation in the dispersion compensation, which might lead to errors in the signal separation.
Figure 6c,d are the time-frequency distributions of the original Lamb wave signal and the reconstructed Lamb wave signal, respectively. It can be seen that their time-frequency energy distributions are consistent. The maximum energy distribution is about 4.5 μs, which implies that the separated A
1 mode and S
1 mode are consistent with the original single modes.


