Featured Application
The developed pullout force formula and the understanding of damage mechanisms are expected to optimize the design of the ultra-high-performance fiber reinforced concrete (UHPFRC) with twisted fibers.
Abstract
This paper aims to develop a pullout force formula and increase the understanding of the damage mechanisms of ultra-high-performance fiber reinforced concrete (UHPFRC) with twisted steel fibers (TSFs) through a pull-out test and finite element analysis (FEA). The formula was first obtained through a theoretical force analysis with model assumptions that are based on the experimental data in the literature. A microscale in-situ X-ray computed tomography (µXCT) was used to prepare 3D images of the cross-section of concrete before and after TSFs with three embedment lengths were pulled out. The tested pullout force values were used for comparison with the developed formula values. The µXCT images show the concrete matrix was preserved after the TSF was pulled out, indicating the stable pullout force values at the strain hardening stage was mainly caused by the fiber untwisting. FEA results show this untwisting behavior occurs on the effective untwisting length of TSF close to the exterior concrete surface. The theoretical formula values were found match well with the testing data. The developed formula is potentially used to analyze the pullout behavior of TSF with different geometries; thus, the design of the UHPFRC with TSFs can be optimized in the field.
1. Introduction
Fibers with different types, shapes, aspect ratios have been used to enhance the mechanical properties of concrete regarding its fracture toughness, flexural strength, tensile strength and energy absorbing capacity under impact [1,2,3,4,5,6,7,8]. This improvement of mechanical properties is achieved by producing the strain-hardening behavior and by increasing the strain capacity of the fiber-mixed composite with supplementary cementitious materials such as silica fume and ground granulated blast-furnace slag. It was reported that the maximum compressive strength and tensile strength of the steel fiber reinforced concrete (FRC) could be as high as 292 MPa and 37 MPa, respectively and that the strain at peak stress up to 1.1% was obtained [2]. These values are at least 5–10 times higher than those of the conventional concrete without steel fibers. As a result, this ultra-high-performance fiber reinforced concrete (UHPFRC) has been widely used in different structural members such as slabs, beams, columns and beam-column joints for various construction applications [9].
Due to the superior performance and the increased applications of UHPFRC, extensive studies have been performed to understand the mechanical properties of UHPFRC and the corresponding reinforcement mechanism. The current studies focus on the optimization of the factors that influence the fiber-matrix bond strength, cementitious matrix packing density and the tensile response of UHPFRC through either the direct tensile tests of dog bone specimens or the flexural bending tests. These factors mainly include fiber type [10,11], fiber volume fraction [11], fiber embedment length [12], fiber morphology [1,12,13,14], fiber orientation [15,16], loading rate [3,13], cementitious material property [17], fiber-matrix interface property [12] and curing of cementitious material [12]. For example, Wille et al. [3] showed that energy absorption capacity significantly increased with the fiber volume fraction of up to 3%. It should be noted that most of the above studies adopt material-level experimental studies which however are often expensive and difficult to carry out, particularly at meso/micro scales [18]. For instance, it is challenging to carry out strain measurements on short discontinuous fibers, causing the difficulty in developing the bond-shear stress-slip relationship between fibers and cementitious matrix. This could limit the detailed understanding of material’s damage mechanisms and thus considerably limit the wider application of fibers.
Compared to the smooth or hooked steel fibers used as reinforcement in high-performance cementitious composites, a relatively new type of steel fibers with twisted morphology has been proposed to further enhance the mechanical properties of HPFRC [1,11,13]. This twisted steel fiber with optimized section geometry (triangular and square section) was experimentally explored regarding its superior performance in contributing the pull-out load and strain hardening capacity. Note that the pull-out test is commonly used to evaluate the bond strength, pull-out response and strain hardening behavior. The twisted fibers could theoretically provide a larger lateral surface area than smooth or hooked steel fibers and thus increase frictional and adhesive bond forces at the fiber-matrix interface. Consequently, the twisted fibers generated peak pullout forces on the order of 3-5 times those of straight, smooth fibers [1]. Note that their high-performance-concrete strength values are generally less than 100 MPa. Due to the complexity of fiber morphology, the fabrication of the fiber materials becomes challenging. For example, only the rectangular-section twisted steel fibers are available in Chinese material market, leading to the difficulty in investigating a variety of twisted steel fiber geometries in experimental studies. Also, the pullout test with detailed measurements on fiber strain, bond shear force, untwisting torque at meso/micro scales is still in an early stage. Several studies have presented the typical pullout force response of HPFRC with twisted fibers [1,13], while a theoretical or empirical formula of pullout force has not been established, particularly for UHPFRC with the ultra-high compressive strength of more than 150 MPa.
The objective of this study is to develop a pullout force formula and thus to enhance the understanding of the damage and fracture mechanisms of UHPFRC with twisted fibers through a pull-out test and numerical modeling. The pull-out response of twisted fibers through the cementitious matrix was first reviewed and then analytically modelled considering elastic-plastic mechanics. The analytical model empirically assumes the tri-linear relationship of pullout force and pullout deformation. A microscale in-situ X-ray computed tomography (µXCT) was used to provide visual evidence for the failure pattern. The formula was verified by the pullout test results. The untwisting mechanism of the single twisted fiber during the pullout process was also investigated by conducting an image analysis and a finite element analysis (FEA). The developed pullout force formula and the understanding of damage mechanisms are expected to optimize the design of the UHPFRC with twisted fibers.
2. Analytical Model
2.1. Model Assumption
The twist geometry of twisted fiber and the physicochemical bond between fiber and concrete matrix cause the pullout response complicated. To understand the general pullout behavior, the typical pullout force data for the UHPFRC with twisted steel fibers were reviewed and shown in Figure 1a. The data were collected from the existing experimental studies from Naaman and his coworkers [1]; our experimental data will be used to verify the developed analytical model in Section Experimental and verification. Based on the previous experimental data, we empirically assume that the relationship of pullout force and pullout displacement is a tri-linear response with three stages, as shown in Figure 1b.
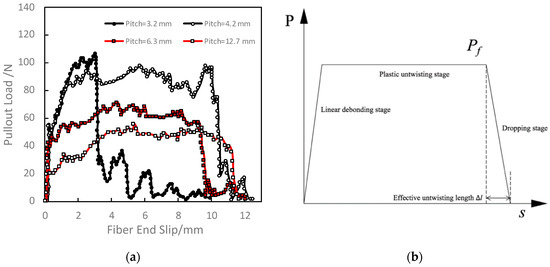
Figure 1.
Typical pullout curve and its simplified trilinear model for twisted steel fiber-UHPC matrix: (a) typical pullout curve; and (b) simplified trilinear model for twisted steel fiber-UHPC.
The first stage is the linear debonding stage, where the pullout force is increasing linearly with the pullout displacement. During the pullout process, the shear force increases up to the fiber-matrix bond strength and debonding occurs at the fiber-matrix interface after the shear force exceeds the bond strength. At the end of this elastic stage, the twisted fiber completes the debonding and starts to untwist, entering into a plastic untwisting stage. The pullout force is assumed constant as Pf in this process when the remaining embedment length Le is larger than the effective untwisting length Δl. Only the friction on the interface of the effective untwisting length is considered. In addition, the steel fiber is assumed as an ideal plastic material and there is no damage in high-strength UHPC matrix during the pull-out process. At the end of this process, the pullout force is dropped to zero with a high dropping rate, entering a dropping stage.
2.2. Model Derivation
The cross-section of a twisted fiber can be rectangular, triangular or polygonal. The commonly-used rectangular and triangular shape are analyzed in this study. As the force analysis process is similar for the rectangular or triangular shape, the detailed analysis process of rectangular fiber shape is first carried out, followed by the summary of triangular fiber shape.
2.2.1. Fiber with a Rectangular Section
As shown in Figure 2, for a twisted steel fiber with the 2a × 2b rectangular section, the contact stress of the matrix on fiber surface is assumed to be linearly distributed on a section. The contact stress at the corner point is N1 (y) and its distribution is antisymmetric in the other parallel face. Take dx to be the increment at the long side and it is subjected to compression stress from the cementitious matrix as
where p is the compression stress, b is the length of the long side. The line load can be obtained by integrating p along the long side as
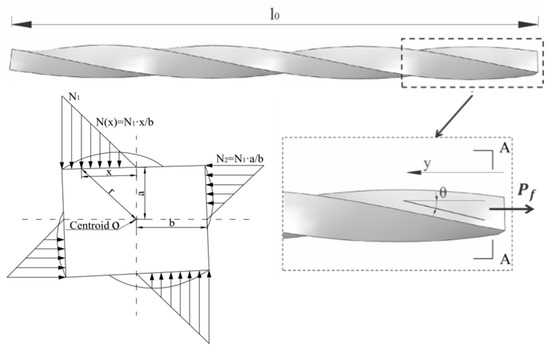
Figure 2.
Force analysis sketch of twisted steel fiber of rectangular section.
Considering the angle θ of the long side twisted surface (Figure 2), the component of the pressure in the fiber axial y directions
The normal force px on the twisted surface is
As the fine sands were mixed in the matrix without coarse aggregates, the contact between TSF and matrix is relatively uniform. Thus, we assume that the sliding friction coefficient μ between the matrix and the steel fiber is constant, the friction force in the fiber axial direction is
The friction coefficient μ is determined by referring to the experimental results by Baltay and Gjelsvik [19]. The friction coefficient at concrete-steel interface is mainly determined by the processing methods of steel and it was ranged from 0.35 to 0.58. In this model, the friction coefficient of 0.5 at concrete-steel interface for UHPFRC was set in the model in this study.
The twisted surface angle at the short side is θ′. Thus, the axial resultant force of the four sides (line load) is
The untwisting pullout force Pf is thus obtained by integrating on the effective untwisting length Δl:
Similarly, the twisted torque T can be expressed as
It assumed that the compressive stress evenly distributed along the fiber axial direction (Δl direction), that is, N1(y) = N1. Equations (7) and (8) can be simplified to
Figure 3 shows the geometric relation of a pitch. For any point K on the steel fiber surface, it travels through a pitch l0 in the embedment length direction (y direction) by a distance of . We can obtain
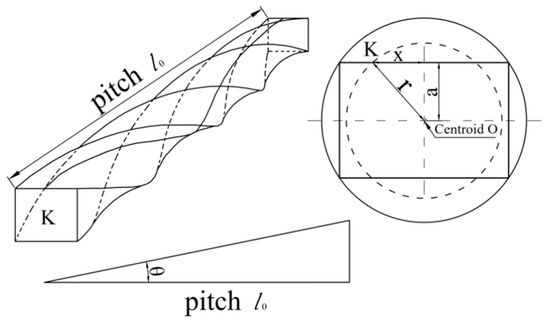
Figure 3.
Sketch of twisted surface angle for rectangular section fiber.
Substituting Equations (11)–(14) into Equations (9) and (10), the untwisting pullout force and the torque can be obtained as
By considering the Mises yield criterion, we can obtain
where: σp is the uniaxial tensile yield strength of steel fiber (2500 MPa in this paper); σ is the axial normal stress of steel fiber, σ = Pf /A, A = 4ab; τ is the untwisting-torque caused tangential stress of steel fiber.
The plastic limit torque M of the rectangular section beam is well known as
At the yield limit state (i.e., T = M) in the plastic untwisting stage, Equation (16) can be rewritten as
If the dimension of twisted fiber (i.e., a, b, l0), uniaxial tensile yield strength of twisted fiber σp, the effective untwisting length Δl are known (note that Δl can be estimated from the typical pullout curve shown in Figure 1b), the untwisting pullout force Pf and the torque T can be obtained from the Equations (15), (16) and (19).
2.2.2. Fiber with a Triangular Section
Figure 4 shows the force analysis sketch for the TSF with triangular section. The relevant equation forms of triangular section are consistent with those of rectangular section. By replacing the section variables, the untwisting pullout force and the torque for the UHPFRC with triangular-section twisted fibers can be obtained as:
where,
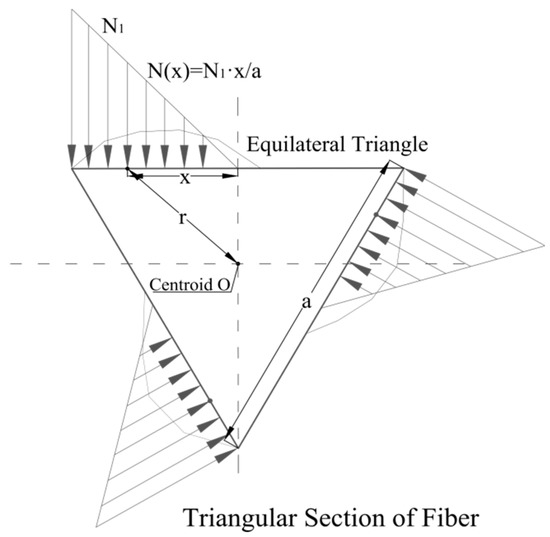
Figure 4.
Force analysis sketch of twisted steel fiber of triangular section.
The beam plastic torque limit of triangular section (with section area ) is:
Considering the yield limit state (i.e., ) in the plastic untwisting stage, the untwisting pullout force and the torque for the twisted fiber with triangular section can be obtained from the Equations (20), (21) and (22).
3. Experimental and Verification
To verify the theoretical understanding of pullout force and enhance the understanding of untwisting behavior as well as the mechanical performance of matrix, this section shows the experimental work and the comparison between theory and experiment.
3.1. Concrete Samples
The UHPRC samples had water-binder ratio of 0.2 with ordinary Portland cement (P.O 52.5, produced by Hangzhou Qianchao Cement Factory, China) and silica fume that was used as cementitious materials. Quartz sand with particle size of 0.1-0.5 mm and quartz powder with an average particle size of 26 μm were used as filling agents. Solid polycarboxylate-based superplasticizer (BASF Melflux 1641F with high efficiency of plasticization) was mixed to improve the flowability of mixture. The mix was designed according to the general mix design for UHPRC such as [20]. The detailed mix proportions of UHPRC are 822 kg/m3 cement, 904 kg/m3 quartz sand, 205 kg/m3 silica fume, 246 kg/m3 quartz powder, 205 kg/m3 water, 10 kg/m3 superplasticizer. The quartz sand, cement, silica fume and quartz powder were first dry mixed for 30 s in a pan mixer. Then, water and super-plasticizer were added and mixed for a further 3 min. The mixture was compacted on a vibrating table with adjustable intensity. The samples were cast in cubic steel molds, the surface of which was covered with wet hessian at room temperature for 24 h. Subsequently, the samples were demolded and sealed cured at room temperature for 28 days. The compression test was carried out and the results show that the average compressive strength reached up to 155 MPa, indicating the ultra-high performance of the designed sample.
3.2. Concrete Samples with a Single Twisted Steel Fiber
The twisted steel fibers with rectangular section were used in the experiment, as illustrated in Figure 3. The fiber length l, equivalent diameter De, fiber pitch l0, tensile strength and elastic modulus E are 45 mm, 0.5 mm, 0.53 × 0.37 mm2, 0.1961 mm2, 10 mm, 2500 MPa and 206 GPa, respectively. Only rectangular-section twisted steel fiber in high-performance fiber concrete was studied in this paper as the twisted steel fibers with triangular section cannot be purchased in the Chinese market.
There are three fiber embedment lengths of 15, 20 and 25 mm and six replicate specimens (T15/20/25-1, -2, -3, -4, -5, -6) were prepared for each fiber embedment length to obtain the representative testing values. The minimum fiber embedment length of 15 mm is 50% higher than the fiber pitch value of 10 mm; while the maximum fiber embedment length of 25 mm is 2.5 times fiber pitch and approximately half of fiber length. This arrangement ensures the whole pullout force curve can be completely obtained.
Eighteen fiber reinforced specimens in total were prepared in the following process: First, a twisted fiber with a hook anchor was fixed in the middle of a steel mold and the concrete mixture prepared in above Section Concrete samples was poured into the mold for compaction. After 24 h, the first half specimen was demolded. The second half specimen with a certain embedment length of fiber (i.e., 15, 20 and 25 mm) was then cast and carefully demolded after 24 h. The whole sample was then conditioned for 28 days. As the concrete strength during the sample preparation is low, cares should be taken to protect the fiber-matrix interface from being damaged during the operation. To ensure no rotation of sample during the pullout process, both sides of sample were restrained using a fixture. The single fiber pullout experiment was then carried out according to the testing standard [21]. The loading actuator controls the displacement values, which are used as the fiber end slip. Note that the maximum pullout force value of approximately 250 N is so small that the fiber deformation can be negligible. Displacement control at a low pull velocity of 0.01 mm/s was used in our quasi-static loading experiment.
The concrete matrix of samples before and after the pullout test was scanned and high-resolution images were obtained by using the Nikon XTH320 µXCT facility at Zhejiang University. The scanning of the specimen before pullout test was to observe the fiber-matrix interface; while the scanning of the matrix after pullout was to observe the embedded channel of the twisted steel fiber.
A series of two-dimensional images were first obtained and then three-dimensional images were reconstructed by using VGStudio MAX 3.0 software [22]. The images were then analyzed and compared (before pullout vs. after pullout) to observe the damage situation of the fiber-matrix interface and understand the pullout mechanism of twisted steel fiber. The following scanning parameters were used: exposure time (500 ms), voltage (200 kV), current (100 μA) and scanning resolution (approximately 30 μm).
3.3. Experimental Results
3.3.1. Image Analysis
Figure 5 shows the XCT images of the typical cross-sections of sample with fiber (before pullout, white color) and without fiber (after pullout, black color). As expected, due to the twisting geometry, the 2D images of twisted fibers show the uneven width of fiber channel. It is interesting to observe that the fiber-matrix interface is relatively smooth without considerable damage. The fiber channel area in the image with steel fiber before the pullout test is 12.154 mm2, which is rather close to that without fiber after the pullout test (12.239 mm2). Note that the scanning resolution is approximately 30 μm, so that any micro-damage with features less than 30 μm is out of sight in the obtained images. As short microcracks less than 30 μm in concrete are related to concrete durability performance instead of mechanical property performance [23,24], the matrix-fiber interface could be regarded to be not damaged within the mechanical analysis scope of this study. While future study can be performed to understand the influence of microcracks on the property of twisted steel fiber such as the crack-induced steel corrosion after the mass transport channel is formed.
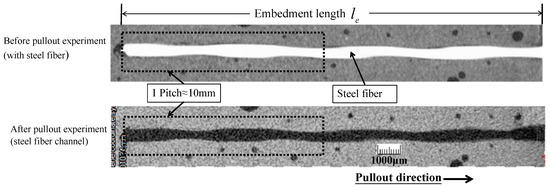
Figure 5.
Typical XCT section scanning images of concrete matrix before and after twisted steel fiber pullout experiment.
During the axial pulling process of TSF from the matrix, the fiber was gradually moving out of the solid matrix. No metal piece was peeled off during the pullout process. The untwisting phenomenon was found after around 1–3 min of pulling and the whole twisting shape disappeared completely after pullout, as shown in Figure 6. This untwisting phenomenon is consistent with the existing numerical studies from researchers such as Ellis et al. [14] who numerically investigated the pullout response of the single twisted fiber with a triangular cross-section. As the untwisting behavior inside the concrete is invisible, we then conduct a numerical study in Section Numerical analysis to understand the untwisting characteristics inside the concrete.
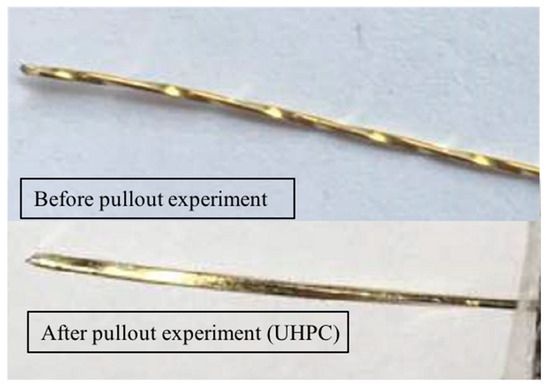
Figure 6.
Comparison of twisted steel fiber shapes before and after pullout.
3.3.2. Untwisting Mechanism
The above untwisting phenomenon is found to be related to the pullout force response and is discussed in this section. The eighteen pullout force versus fiber displacement Pf -s curves of specimens with three different embedment lengths were obtained. The results show that these curve patterns are similar and thus the average data lines for each embedment length are shown in Figure 8. The patterns of the pullout curves are generally consistent with those in Figure 1, while the maximum pullout force is around 200-250N that is more than one order of magnitude compared to the typical pullout force values collected from Naaman and his coworkers [1]. The compressive strength of UHPRC is 155 MPa, more than approximately 55% higher the value of high-performance concrete tested by Naaman and his coworkers. Thus, the ultra-high mechanical property of UHPRC could increase the high pullout force as shown in Figure 7. In addition, the matrix-fiber interface in UHPRC has a high bond strength, which could also contribute the high pullout force.
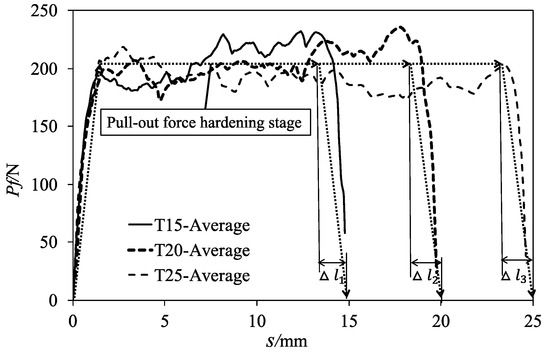
Figure 7.
Averaged experimental pullout curves.
Although there are variations of pullout force for the six replicate samples, the general pattern of pullout force-fiber displacement curve shows there are three distinguishable stages that can be identified. Both our pullout experimental data and the testing data from Naaman and his coworkers show a similar tri-linear-stage pattern, as shown in Figure 1. The model assumption of our study (Section Modal assumption) is thus reasonable.
To understand the untwisting mechanism and the pullout mechanism, the three trilinear stages of pullout force versus fiber displacement curves are presented in Figure 7 and analyzed as:
- Linear debonding stage: The pullout force increased linearly with the fiber end displacement, similar to the elastic stage for the normal concrete [25]. This process takes around 1–3 min. There is no relative displacement between matrix and TSF, indicating the matrix-fiber interface remains intact with no debonding occurs. Thus, the strong bonding between fiber and its surrounding matrix produces a united resistance to the external pulling force from both TSF and matrix. By the end of this linear process, debonding initiates at the matrix-fiber interface where the pullout force-loading displacement relationship becomes weakly nonlinear.
- Plastic untwisting stage: After the debonding occurs, debonding slip rotation of TSF is believed to start. This movement is a kind of screw-like movements at the embedded fiber part after debonding. As there is no relative rotation at the sample ends due to the constraint from the fixture, a torque is generated. This torque leads to the plastic ‘untwisting’ deformation in the fiber part near the outlet and thus the stable untwisting pull-out force. This pull-out force hardening stage was also reported by Wille et al. [17]. As shown in Figure 7, there are slight fluctuations in the untwisting pullout force. The fluctuations may result from the inhomogeneity of the matrix-fiber interface and the stress concentration on the rectangular corner of TSF. This stress concentration may be difficult to penetration by the matrix [1]. The super-high strength of matrix prevents the TSF from damaging the matrix due to the undesirable sites of stress concentration.
- Dropping stage: When the remaining embedment length of the fiber is less than the effective untwisting length Δl, the pull-out force rapidly decreases to zero when the torque is released.
3.3.3. Pullout Force Calculation
Due to the variations of pullout forces at different fiber displacements (as shown in Figure 7, a representative pullout force is calculated for quantitative analysis and comparison study with theoretical values. The average pull-out force of the whole pullout process (as shown in Figure 8) is defined as,
where is the total pull-out energy during the whole process, that is, the area enclosed by the pullout curve; is the fiber embedment length; s is the fiber pullout displacement; is the pull-out force when the pullout displacement is equal to s. and are obtained from the two intersection points between and the actual pullout curve. represents the starting point of the untwisting stage and represents the end point of untwisting stage. Thus, the untwisting pullout force in the plastic untwisting stage can be estimated as
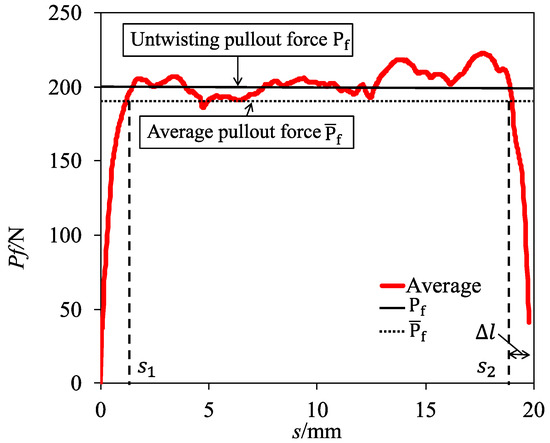
Figure 8.
Sketch of calculation method for pullout force.
The effective untwisting length Δl is equal to the value of minus . Note the fiber axial extension during pullout is not considered in the calculation of Δl as the extension equal to the is negligible. For example, when the is 200 N and is 25 mm, the extension equals 0.1 mm. According to the above calculation method, the experiment results are analyzed and shown in Table 1. These values are then compared to the those calculated by the developed formula of pullout force in Section Analytical model.

Table 1.
Results of single fiber pullout tests his is a table.
3.4. Comparison between Test and Analytical Solution
As the experimental data has a certain degree of discreteness, the mean value of each embedment length is compared with the analytical results. To obtain the analytical results of untwisting pullout force Pf, the dimension of twisted fiber (i.e., a=0.265 mm, b=0.185 mm, l0=10 mm), the uniaxial tensile yield strength of twisted fiber σp=2500 MPa, the effective untwisting length Δl from Table 1 are inputted into the Equations (15), (16) and (19).
Figure 9 shows the comparison between the testing values of the pullout force and the analytical solution. The results are in good agreement. The mean values of the three groups of different embedment lengths are 4.2%, 6.1% and 1.3% higher than the analytical solution. This might because the analytical model neglected the tangential frictional resistance after the debonding between the UHPC matrix and the twisted steel fiber; only the friction on the fiber-fiber interface at the effective untwisting length is considered. The pullout force can reach 200 N, which is generally larger than the existing studies [13,14,17]. This increase may be due to the higher mechanical properties of pure concrete without fibers and the better matrix-fiber interface produced in this study.
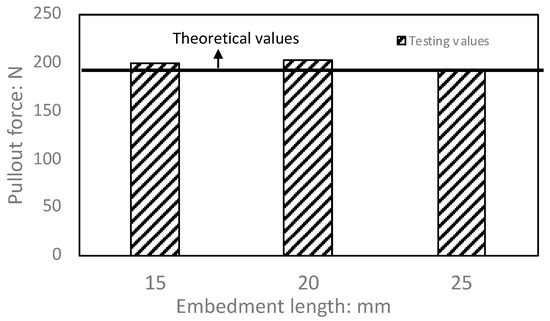
Figure 9.
Comparison between the testing values and theoretical values of pullout forces.
4. Numerical Analysis
In this section, a numerical modeling of UHPC with single TSF is presented. The aim of this analysis was to understand the invisible untwisting behavior of TSF inside the concrete, which cannot be observed through the above experiment.
4.1. Structure Model
The FEA model for UHPC with single TSF is established by using ABAQUS and illustrated in Figure 10a and its meshing is shown in Figure 10b. The model is composed of three parts, that is, concrete matrix, TSF and their interface. The TSF has an embedment length of 20 mm, a free end with a short length of 1 mm and a rectangular section of 0.53 × 0.37 mm2. To perform a dense meshing on the concrete area close to TSF, a solid column with a diameter twice as big as the equivalent diameter of TSF was partitioned.
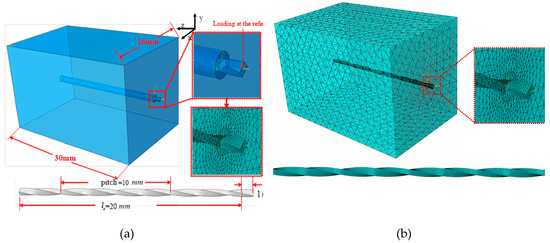
Figure 10.
The FEA model for UHPC with single TSF, (a) illustration, (b) meshing.
The interface between concrete matrix and TSF was modelled as interfacial transition zone (ITZ), the thickness of which is twice the equivalent diameter of TSF. The steel fiber element is C3D8 hexahedral element with average side length of 90 μm. The concrete and ITZ elements are C3D4 tetrahedral elements and their side length increases from 50 μm to 1.5 mm when they are away from the TSF. The meshing sensitivity was analyzed and the results show that this fine meshing used in this simulation is sufficient to produce stable pullout force results.
4.2. Material Model
The Elastic Perfectly Plastic model of steel fiber was adopted, as shown in Figure 11. The density, Young’s modulus, Poisson’s ratio and yield stress of steel fiber are 7800 kg/m3, 206 GPa, 0.3 and 2500 MPa, respectively.
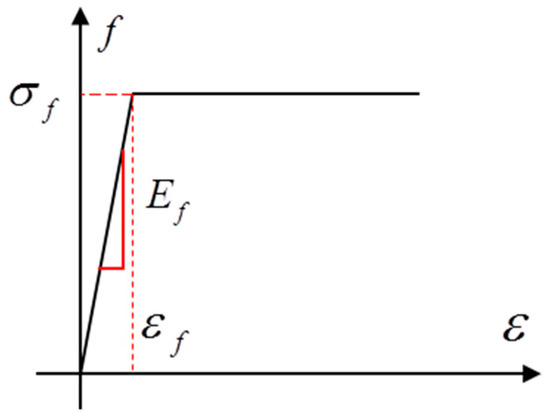
Figure 11.
The Elastic Perfectly Plastic model of steel fiber.
Testing results in experimental section show that the matrix channel was not damaged after the steel fiber was pulled out, indicating that the steel fiber debonded from the concrete-fiber interface without damaging the concrete. Therefore, the concrete material was simulated by using its Elastic Perfectly Plastic model with density of 2400 kg/m3, Young’s modulus of 46 GPa, yield stress (close to the compressive strength) of 155 MPa and Poisson’s ratio of 0.2. The stress-strain behavior of this Elastic Perfectly Plastic model for concrete is similar to steel, as shown in Figure 11.
The friction model of matrix-fiber interface was simulated by using load-independent, isotropic Coulomb friction law. If the equivalent shear stress τeq reach the critical shear value τcrit, the interface starts debonding.
where τ1 and τ2 are two orthogonal tangential shearing stress on the interface, pcontact is the normal force at interface, μ is the friction coefficient, which is determined by referring to the experimental results by Baltay and Gjelsvik [19]. The friction coefficient at concrete-steel interface is mainly determined by the processing methods of steel and it was ranged from 0.35 to 0.58. Thus, the friction coefficient of 0.5 at concrete-steel interface was set in the model in this study.
4.3. Loading and Boundary Condition
A reference point was coupled with TSF and then the displacement loading was applied to the reference point. The four concrete side faces were simply supported, the left side of concrete was fixed and the right side of concrete was not restrained.
The pullout process was simulated as a quasi-static process by using dynamic explicit method in ABAQUS/Explicit. The mass scaling technology was applied to decrease computation cost. To ensure the quasi-static pullout process is maintained, the kinetic energy of TSF should be sufficiently small. This is achieved by maintaining the ratio of kinetic energy to internal energy of less than 5%. Consequently, the fiber displacement at the reference point was controlled as 0.01 mm/s.
4.4. Numerical Results
The FEA results of fiber pullout force were then compared with the average experimental results for the fiber embedment length of 20 mm, as shown in Figure 12. The numerical results match well with the testing results in the Linear debonding stage and the early stage of fiber untwisting; while, the pullout force slightly decreased and stabilized with further pullout displacements from 6 mm to 20 mm, causing a lower simulated pullout force compared to the testing value. The higher testing pullout force may be caused by the creep-induced resistance from the 28-day curing concrete, while this creep was not considered in our FEA model. In addition, the tangential frictional resistance after the debonding between the UHPC matrix and the twisted steel fiber is not considered in the FEA model; while minor tangential frictional resistance may still exist, producing the extra pullout force in the testing results.
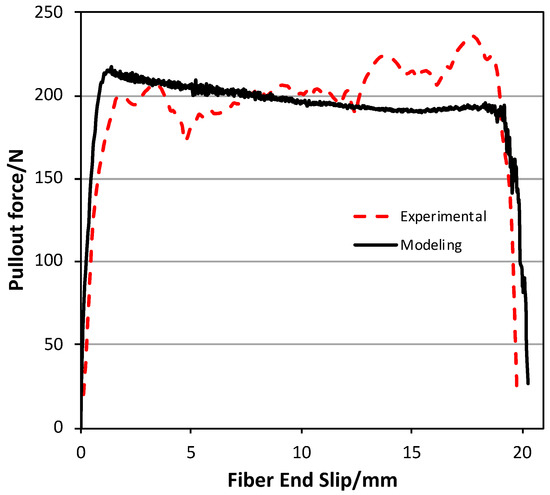
Figure 12.
Comparison between numerical and experimental results for the case with fiber embedment length of 20 mm.
Figure 13 shows the evolution of Mises stress response over the pullout course at pullout displacements of 0, 4.0 mm, 8.0 mm, 12.0 mm. 16.0 mm and 20.0 mm. Interestingly, the untwisting phenomenon was found within the effective untwisting fiber length of around 1.7 mm away from the exterior concrete surface. The untwisting was completed when the whole fiber was pulled out at the end of the simulation. The above observation is consistent with our experimental study and others such as Ellis et al. [14].
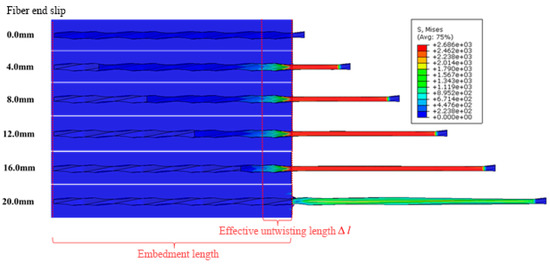
Figure 13.
The Mises stress evolution over the pullout process.
The above numerical and testing results reveal the strain hardening behavior of UHPFRC with TSFs is caused by the fiber untwisting at the effective untwisting length near the exterior concrete surface. This supports the assumption in our theoretical model that only considers the friction on the fiber-fiber interface at the effective untwisting length, neglecting the tangential frictional resistance after the debonding between the UHPC matrix and the twisted steel fiber. Table 1 displays that the tested effective untwisting length is insensitive to the fiber embedment length. To further optimize the pullout behavior, further study on the strategies of extending effective untwisting length can be thus performed.
The friction at matrix-fiber interface and its adhesive bond are critical to increase the pullout force. Consequently, the matrix-fiber interface with optimum property is needed. For the same mix proportion, an optimum mixing and casting is thus required to produce an intact interface with a minimum number of pores and other defects. Figure 5 shows a number of pores that were caused during the casting process, though we conducted a careful casting procedure, similar to studies such as [23]. The dense mixture with a low water-binder ratio might increase the difficulty of escaping the bubble during the casting. Future study can be carried out to improve the casting quality of UHPFRC and investigate the influence of air bubbles on the matrix-fiber interface and thus the pullout force.
The significant strain hardening in the plastic untwisting stage causes an optimized property of UHPFRC with TSFs. This strain hardening causes a significant increase in energy dissipation area enclosed by the pullout curves. Thus, the twisting is an ideal way to improve the strain hardening property and the UHPFRC with TSFs may be applied well in the concrete structures subjected to earthquakes or shocking to absorb dynamic energy.
5. Conclusions
In this paper, a theoretical formula for pullout force was first derived according to the force analysis of twisted steel fiber (TSF) of rectangular section and triangular section. The model assumptions were explicitly made based on the experiment data obtained from the existing studies. Then the experiment on the ultra-high-performance fiber reinforced concrete (UHPFRC) with TSF at three embedment lengths was performed to gain insights into the strain hardening characteristics due to untwisting mechanism. A simplified numerical study was also performed to understand the untwisting behavior inside the concrete. The microscopic X-ray tomography was used to compare the internal microstructure of the UHPC matrix before and after pullout. The following conclusion can be made:
- The pullout process of a single TSF in UHPFRC can be divided into a linear debonding stage, plastic untwisting stage and a dropping stage, so the pullout force versus displacement curve can be simplified as a trilinear curve.
- A significant strain hardening characteristic occurred due to the plastic deformation of TSF and its untwisting deformation during the pullout process. This untwisting deformation occurred on the fiber (within the effective untwisting fiber length) close to the exterior concrete surface.
- The fiber channel inside the matrix was not damaged after pullout, indicating a strong pullout resistance of matrix-fiber interface due to the high mechanical strength of matrix and strong bonding between matrix and TSF.
- The pullout force is independent of the embedment length of TSF and dependent of the geometry of fiber cross-section as well as the friction at matrix-fiber interface and its adhesive bond.
- The developed analytical formula was verified by the experimental data and thus can be used to gain insights into the mechanism of pullout process and to understand the parameters that influence the mechanical property of UHPFRC with TSFs.
Author Contributions
Conceptualization, J.Y. and G.L.; methodology, J.Y. and G.L.; software, J.Y.; validation, J.Y. and G.L.; formal analysis, J.Y. and G.L.; investigation, J.Y.; resources, G.L.; data curation, J.Y.; writing—original draft preparation, J.Y.; writing—review and editing, G.L.; visualization, J.Y.; supervision, G.L.; project administration, G.L.; funding acquisition, J.Y. and G.L.
Funding
This project was supported by the funding from the National Natural Science Foundation of China (Grant No. 51379185) and National Basic Research Program of China (973 Program, 2013CB036901).
References
- Naaman, A.E. Engineered steel fibers with optimal properties for reinforcementof cement composites. J. Adv. Concr. Technol. 2003, 1, 241–251. [Google Scholar] [CrossRef]
- Wille, K.; Naaman, A.E.; El-Tawil, S.; Parra-Montesinos, G.J. Ultra-high performance concrete and fiber reinforced concrete: Achieving strength and ductility without heat curing. Mater. Struct. 2012, 45, 309–324. [Google Scholar] [CrossRef]
- Wille, K.; El-Tawil, S.; Naaman, A.E. Properties of strain hardening ultra high performance fiber reinforced concrete (UHP-FRC) under direct tensile loading. Cement Concr. Compos. 2014, 48, 53–66. [Google Scholar] [CrossRef]
- Yu, R.; Spiesz, P.; Brouwers, H.J. Energy absorption capacity of a sustainable Ultra-High Performance Fibre Reinforced Concrete (UHPFRC) in quasi-static mode and under high velocity projectile impact. Cement Concr. Compos. 2016, 68, 109–122. [Google Scholar] [CrossRef]
- Venkateshwaran, A.; Tan, K.H.; Li, Y. Residual flexural strengths of steel fiber reinforced concrete with multiple hooked-end fibers. Struct. Concr. 2018, 19, 352–365. [Google Scholar] [CrossRef]
- Zhao, M.; Zhao, M.; Chen, M.; Li, J.; Law, D. An experimental study on strength and toughness of steel fiber reinforced expanded-shale lightweight concrete. Constr. Build. Mater. 2018, 183, 493–501. [Google Scholar] [CrossRef]
- Qu, D.; Cai, X.; Chang, W. Evaluating the Effects of Steel Fibers on Mechanical Properties of Ultra-High Performance Concrete Using Artificial Neural Networks. Appl. Sci. 2018, 8, 1120. [Google Scholar] [CrossRef]
- Kang, S.T.; Kim, J.; Lee, B. Effects of Water Reducing Admixture on Rheological Properties, Fiber Distribution and Mechanical Behavior of UHPFRC. Appl. Sci. 2019, 9, 29. [Google Scholar] [CrossRef]
- Wang, D.; Ju, Y.; Zheng, W.; Shen, H. Seismic Behavior and Shear Bearing Capacity of Ultra-High Performance, Fiber-Reinforced Concrete (UHPFRC) Beam-Column Joints. Appl. Sci. 2018, 8, 810. [Google Scholar] [CrossRef]
- Ferreira, S.R.; Pepe, M.; Martinelli, E.; de Andrade Silva, F.; Toledo Filho, R.D. Influence of natural fibers characteristics on the interface mechanics with cement based matrices. Compos. Part B Eng. 2018, 140, 183–196. [Google Scholar] [CrossRef]
- Kim, M.J.; Kim, S.; Yoo, D.Y. Hybrid Effect of Twisted Steel and Polyethylene Fibers on the Tensile Performance of Ultra-High-Performance Cementitious Composites. Appl. Sci. 2018, 10, 879. [Google Scholar] [CrossRef]
- De Andrade Silva, F.; Mobasher, B.; Soranakom, C.; Toledo Filho, R.D. Effect of fiber shape and morphology on interfacial bond and cracking behaviors of sisal fiber cement based composites. Cement Concr. Compos. 2011, 33, 814–823. [Google Scholar] [CrossRef]
- Kim, D.J.; El-Tawil, S.; Naaman, A.E. Loading rate effect on pullout behavior of deformed steel fibers. ACI Mater. J. 2008, 105, 576. [Google Scholar] [CrossRef]
- Ellis, B.D.; McDowell, D.L.; Zhou, M. Simulation of single fiber pullout response with account of fiber morphology. Cement Concr. Compos. 2014, 48, 42–52. [Google Scholar] [CrossRef]
- Lee, Y.; Kang, S.T.; Kim, J.K. Pullout behavior of inclined steel fiber in an ultra-high strength cementitious matrix. Constr. Build. Mater. 2010, 24, 2030–2041. [Google Scholar] [CrossRef]
- Alkaysi, M. Strength and Durability of Ultra-High Performance Concrete Materials and Structures. Ph.D. Thesis, University of Michigan, Ann Arbor, MI, USA, 2016. [Google Scholar]
- Wille, K.; Naaman, A.E. Effect of ultra-high-performance concrete on pullout behavior of high-strength brass-coated straight steel fibers. ACI Mater. J. 2013, 110, 451. [Google Scholar] [CrossRef]
- Qsymah, A.; Sharma, R.; Yang, Z.; Margetts, L.; Mummery, P. Micro X-ray Computed Tomography Image-based Two-scale Homogenisation of Ultra High Performance Fibre Reinforced Concrete. Constr. Build. Mater. 2017, 130, 230–240. [Google Scholar] [CrossRef]
- Baltay, P.; Gjelsvik, A. Coefficient of friction for steel on concrete at high normal stress. J. Mater. Civ. Eng. 1990, 2, 46–49. [Google Scholar] [CrossRef]
- Hassan, A.M.; Jones, S.W.; Mahmud, G.H. Experimental test methods to determine the uniaxial tensile and compressive behaviour of ultra high performance fibre reinforced concrete (UHPFRC). Constr. Build. Mater. 2012, 37, 874–882. [Google Scholar] [CrossRef]
- China Association for Engineering Construction Standardization. Test Methods Used for Steel Fiber Reinforced Concrete; CECS13:89; China Association for Engineering Construction Standardization: Beijing, China, 1989; pp. 30–35. (In Chinese) [Google Scholar]
- Volume Graphics Gmbh. VGStudio MAX 3.0; Volume Graphics Gmbh: Heidelberg, Germany, 2014. [Google Scholar]
- Wu, Z.; Wong, H.S.; Buenfeld, N.R. Effect of confining pressure and microcracks on mass transport properties of concrete. Adv. Appl. Ceram. 2014, 113, 485–495. [Google Scholar] [CrossRef]
- Wu, Z.; Wong, H.S.; Buenfeld, N.R. Influence of drying-induced microcracking and related size effects on mass transport properties of concrete. Cement Concr. Res. 2015, 68, 35–48. [Google Scholar] [CrossRef]
- Popovics, S. A numerical approach to the complete stress-strain curve of concrete. Cement Concr. Res. 1973, 3, 583–599. [Google Scholar] [CrossRef]
© 2019 by the authors. Licensee MDPI, Basel, Switzerland. This article is an open access article distributed under the terms and conditions of the Creative Commons Attribution (CC BY) license (http://creativecommons.org/licenses/by/4.0/).