Review

Characteristics of Coherent Optical Phonons in a Hexagonal YMnO3 Thin Film

by
Takayuki Hasegawa
Graduate School of Material Science, University of Hyogo, Koto, Kamigori, Ako-gun, Hyogo 678-1297, Japan
Appl. Sci. 2019, 9(4), 704; https://doi.org/10.3390/app9040704
Submission received: 19 December 2018 / Revised: 23 January 2019 / Accepted: 5 February 2019 / Published: 18 February 2019
(This article belongs to the Special Issue Photoinduced Cooperative Phenomena)

Abstract

:
This paper reviews our recent study on a coherent optical phonon in a hexagonal YMnO3 thin film together with related optical studies in hexagonal RMnO3 (R = Y, Lu, Ho) compounds. Coherent phonons have been observed in RMnO3 compounds by pump-probe spectroscopy with subpicosecond laser pulses, whereas the observation of coherent optical phonons was reported only in LuMnO3. Recently, we succeeded in the observation of the coherent optical phonon in a YMnO3 thin film. The generation process of the coherent optical phonon is assigned to a displacive mechanism, which is identical to that in LuMnO3. The coherent optical phonon is observed in the temperature range from 10 K to room temperature, while the oscillation intensity strongly decreases as the temperature increases to the Néel temperature of ~70 K from a lower temperature range. It is interesting that the temperature dependence is largely different from that in LuMnO3. We describe that the result can be qualitatively explained by the property of an isostructural transition around the Néel temperature in RMnO3 compounds. In addition, we briefly discuss ultrafast incoherent responses of excited electronic states from the viewpoint of the excitation photon energy of laser pulses.

1. Introduction

Ultrafast phenomena in condensed matters have attracted considerable attention in ultrafast science and technology. With the development of ultrafast spectroscopy, dynamics of various elementary excitations have intensively investigated [1,2]. Multiferroic materials in which two or more ferroic orders coexist [3,4,5] could bring an innovation in the ultrafast science field because the coupling nature between different degrees of freedom is expected to emerge novel dynamical properties of excited states. The discovery of the novel dynamics in the multiferroic material is one of recent frontier studies in the condensed matter physics [6].
Yttrium and rare-earth manganites RMnO3 (R = Lu, Ho, Er, Tm, Yb) crystallize in a hexagonal phase with space group P63cm [7]. These are multiferroic materials where the ferroelectric and antiferromagnetic characteristics coexist [8,9,10,11,12,13,14]. The ferroelectric transition temperature is 500–1000 K and the antiferromagnetic transition temperature is about 100 K. The correlation behaviour between electric and magnetic properties emerged in the temperature dependences of dielectric constant and loss tangent around the Néel temperature [8,9]. Through a lot of structural studies by neutron diffraction and X-ray diffraction experiments, the correlation is considered to arise from the strong coupling between spin and lattice degrees of freedom under the antiferromagnetic transition [13,14,15,16]. In the process of magnetic ordering, Mn atoms displace from their ideal position. Moreover, this displacement induces further displacements of other atoms in the unit cell. This lattice response produces the electromagnetic effect. On the other hand, the temperature dependence of phonon modes has investigated by Raman and infrared spectroscopies [17,18,19,20]. The existence of the spin-lattice coupling is suggested from anomalies of phonon frequency shifts. It is interesting that the property of the spin-lattice coupling depends on the rare-earth atom. For instance, the displacement direction of Mn atoms in YMnO3 is opposite in comparison with that in LuMnO3 under the process of ordering [14]. Moreover, the direction of the temperature-dependent frequency shift of an A1-symmetry optical phonon in YMnO3 is opposite to that in LuMnO3 below the Néel temperatures [19]. These behaviour indicates that hexagonal RMnO3 compounds have distinct properties depending on the rare-earth atom.
From the viewpoint of ultrafast phenomena, the lattice dynamics under the spin-lattice coupling regime is a fascinating subject. Coherently-excited phonons by ultrashort laser pulses, which are so-called coherent phonons, have intensively investigated in recent years [21,22,23,24,25,26]. The dynamics of coherent phonons exhibit interesting properties around the Néel temperature. The most prominent property is that the oscillation amplitude of the coherent phonon decreases as the temperature approaches to the Néel temperature [23,24,25]. This behaviour suggests the existence of a dynamical spin-lattice coupling, while the mechanism is still unclear. In order to elucidate the mechanism, it should accumulate further study results on the coherent phonon dynamics in hexagonal RMnO3 compounds. Although coherent acoustic phonons have observed in RMnO3 with R = Y, Lu and Ho [21,23,24,25], coherent optical phonons were reported only in LuMnO3 [22,24]. Therefore, the observation of coherent optical phonons in other hexagonal RMnO3 compounds is crucially important.
In this review, we present our recent study on the characteristics of a coherent optical phonon in a hexagonal YMnO3 thin film [27] together with related optical studies in RMnO3 compounds. In Section 2, two types of generation mechanisms of coherent phonons are briefly reviewed. In Section 3, the experimental procedure of time-resolved pump-probe spectroscopy for the observation of coherent phonons is described. In Section 4, experimental results are discussed. First, optical transition properties in RMnO3 are described. Second, time-domain signals of coherent optical phonons are discussed. Third, the characteristics of the temperature dependence of coherent optical phonons is discussed from the aspect of the spin-lattice coupling. In addition, ultrafast incoherent responses of excited electronic states, which were simultaneously observed with the coherent phonon signal, are discussed in related parts.

2. Generation Mechanisms of Coherent Phonons

Phonon modes in hexagonal RMnO3 compounds have investigated mainly by Raman spectroscopy [17,19,20,28]. A Raman scattering signal is evaluated as a function of energy difference between incident and scattered lights. This means that Raman spectroscopy is one of spectroscopic methods in the frequency domain. When the time duration of ultrashort laser pulses is shorter than the oscillation period of a phonon mode, it can generate the population of the phonon with the same initial phase. This is a coherent phonon. The dynamics of the coherent phonon can be observed in the time domain by using an ultrafast spectroscopic technique as described in Section 3. Since the observed result includes the dynamical property of the phonon, it can bring out a different aspect of the phonon property to that evaluated by Raman spectroscopy. We briefly describe two typical generation mechanisms of coherent phonons below.
Various models have proposed for the generation mechanism of coherent phonons. In the investigation of the generation mechanism, it is important clue that whether the target material is transparent or opaque to the excitation laser. In the case that an opaque range is excited, the photoexcitation of electrons occurs. The ultrashort laser excitation instantaneously creates dense excited electrons, which can change the equilibrium position of atoms. Atoms does not instantaneously respond to the change of the potential in accordance with the Franck Condon principle. After the completion of the excitation of electrons, atoms start moving and then oscillate around the new equilibrium position. This generation process is referred to as the displacive excitation of coherent phonons (DECP) mechanism [29].
Impulsive stimulated Raman scattering (ISRS) mechanism is a potential candidate under the excitation condition that the target material is transparent to the excitation photon energy [30,31]. First, we describe a Raman scattering process with a monochromatic laser. When the laser with the frequency of ω1 is incident to the material, electrons are instantaneously excited from a ground state to virtual intermediate state. Then, phonons with the frequency of Ω and scattered light with ω2 = ω1Ω are spontaneously emitted from the intermediate state. An ultrashort laser pulse inherently has a broad spectral component ∆ω. If ∆ω is wider than Ω, the light pulse can include the ω1 and ω2 components. Accordingly, the ω2 light can be emitted from the intermediate state by the stimulated emission process. This process generates coherent phonons with Ω. It is referred to as the ISRS mechanism. In contrast to the DECP mechanism, the ISRS mechanism can contribute in both the opaque and transparent ranges [32]. One of the effective method to investigate the generation mechanism is to measure the pump photon energy dependence of the coherent phonon around the absorption edge in the target material. Other approach to distinguish the generation mechanisms is to observe the phase of the coherent phonon oscillation. In DECP, atoms start moving from the former to new equilibrium positions and then oscillate around the new one. Therefore, the signal shows a cosine shape. On the other hand, the signal with ISRS shows a sine shape because atoms oscillate around their fundamental equilibrium position. For the precise determination of the phase, on the other hand, a pulsed light source that is much shorter time duration than the oscillation period of the coherent phonon is required.

3. Experimental Procedure of Time-Resolved Pump-Probe Spectroscopy

Time-resolved pump-probe spectroscopy is widely used to study electron and phonon dynamics [1]. Here, the laser pulse used for the generation of excited states is called pump pulse and that for detecting a change in physical quantities due to the excited states is called probe pulse. The pump and probe pulses are irradiated to the same position of a target material, while the arriving times of the pump and probe pulses are independently controlled. The change in reflectance or transmittance is recoded as a function of the delay of the arriving time of the probe pulse relative to the pump pulse. Because the oscillation of coherent phonons modulates the dielectric function in the target material, it induces a periodical change in reflectance or transmittance with the phonon frequency.
Figure 1 shows the schematic diagram of the setup for time-resolved reflection-type pump-probe spectroscopy used in our study. A light source was a mode-locked Ti:sapphire laser with a pulse duration of about 80 fs with a repetition rate of 76 MHz. The tuneable wavelength range was from about 710 to 830 nm, where the full width at half maximum (FWHM) of the spectrum was about 10 nm. The spectrum was evaluated in all pump-probe measurements by using a spectrometer with a resolution of 0.2 nm. The laser pulse passed through a dispersion compensating prism pair was split to the pump and probe pulses by a beam splitter (BS). The time delay τ between the pump and probe pulses was periodically scanned by a retroreflector attached to a shaker with a frequency of ~70 Hz. The full time window in the present system was ~5 ps. The polarization directions of the pump and probe pulses were orthogonal each other by using pairs of half-wave plate (HWP) and polarizing beam splitter (PBS). The pump and probe pulses were irradiated to the same position of the sample surface with a lens, where the incident angle of probe pulses was ~4° with respect to the surface normal. The change in intensity of the reflected probe pulse was detected by a balanced photodetector simultaneously measuring the intensity of reference pulses. A polarizer (P) was placed in the reflected beam pass to cut the reflection of the pump light from the sample. The detector output was recorded as a function of the time delay by a high-resolution recorder (12 bits) synchronized with the shaker. This time-resolved measurement technique is called fast-scan method [33]. The recorded signal was divided by the original reflected probe intensity to convert the time-resolved reflectivity change (∆R/R0). The discernible signal level of ∆R/R0 was ~1 × 10⁻⁶ with 40,000 times of signal averaging. Because the fast-scan method can measure the time-domain signal in a few picoseconds range with a high S/N ratio, it is a powerful tool for studying sub-picosecond (terahertz) range coherent oscillations [34]. In measurements of the dependence of the pump photon energy, we tuned the light source; the photon energies of pump and probe pulses are simultaneously changed.

4. Results and Discussions

4.1. Optical Transition Property

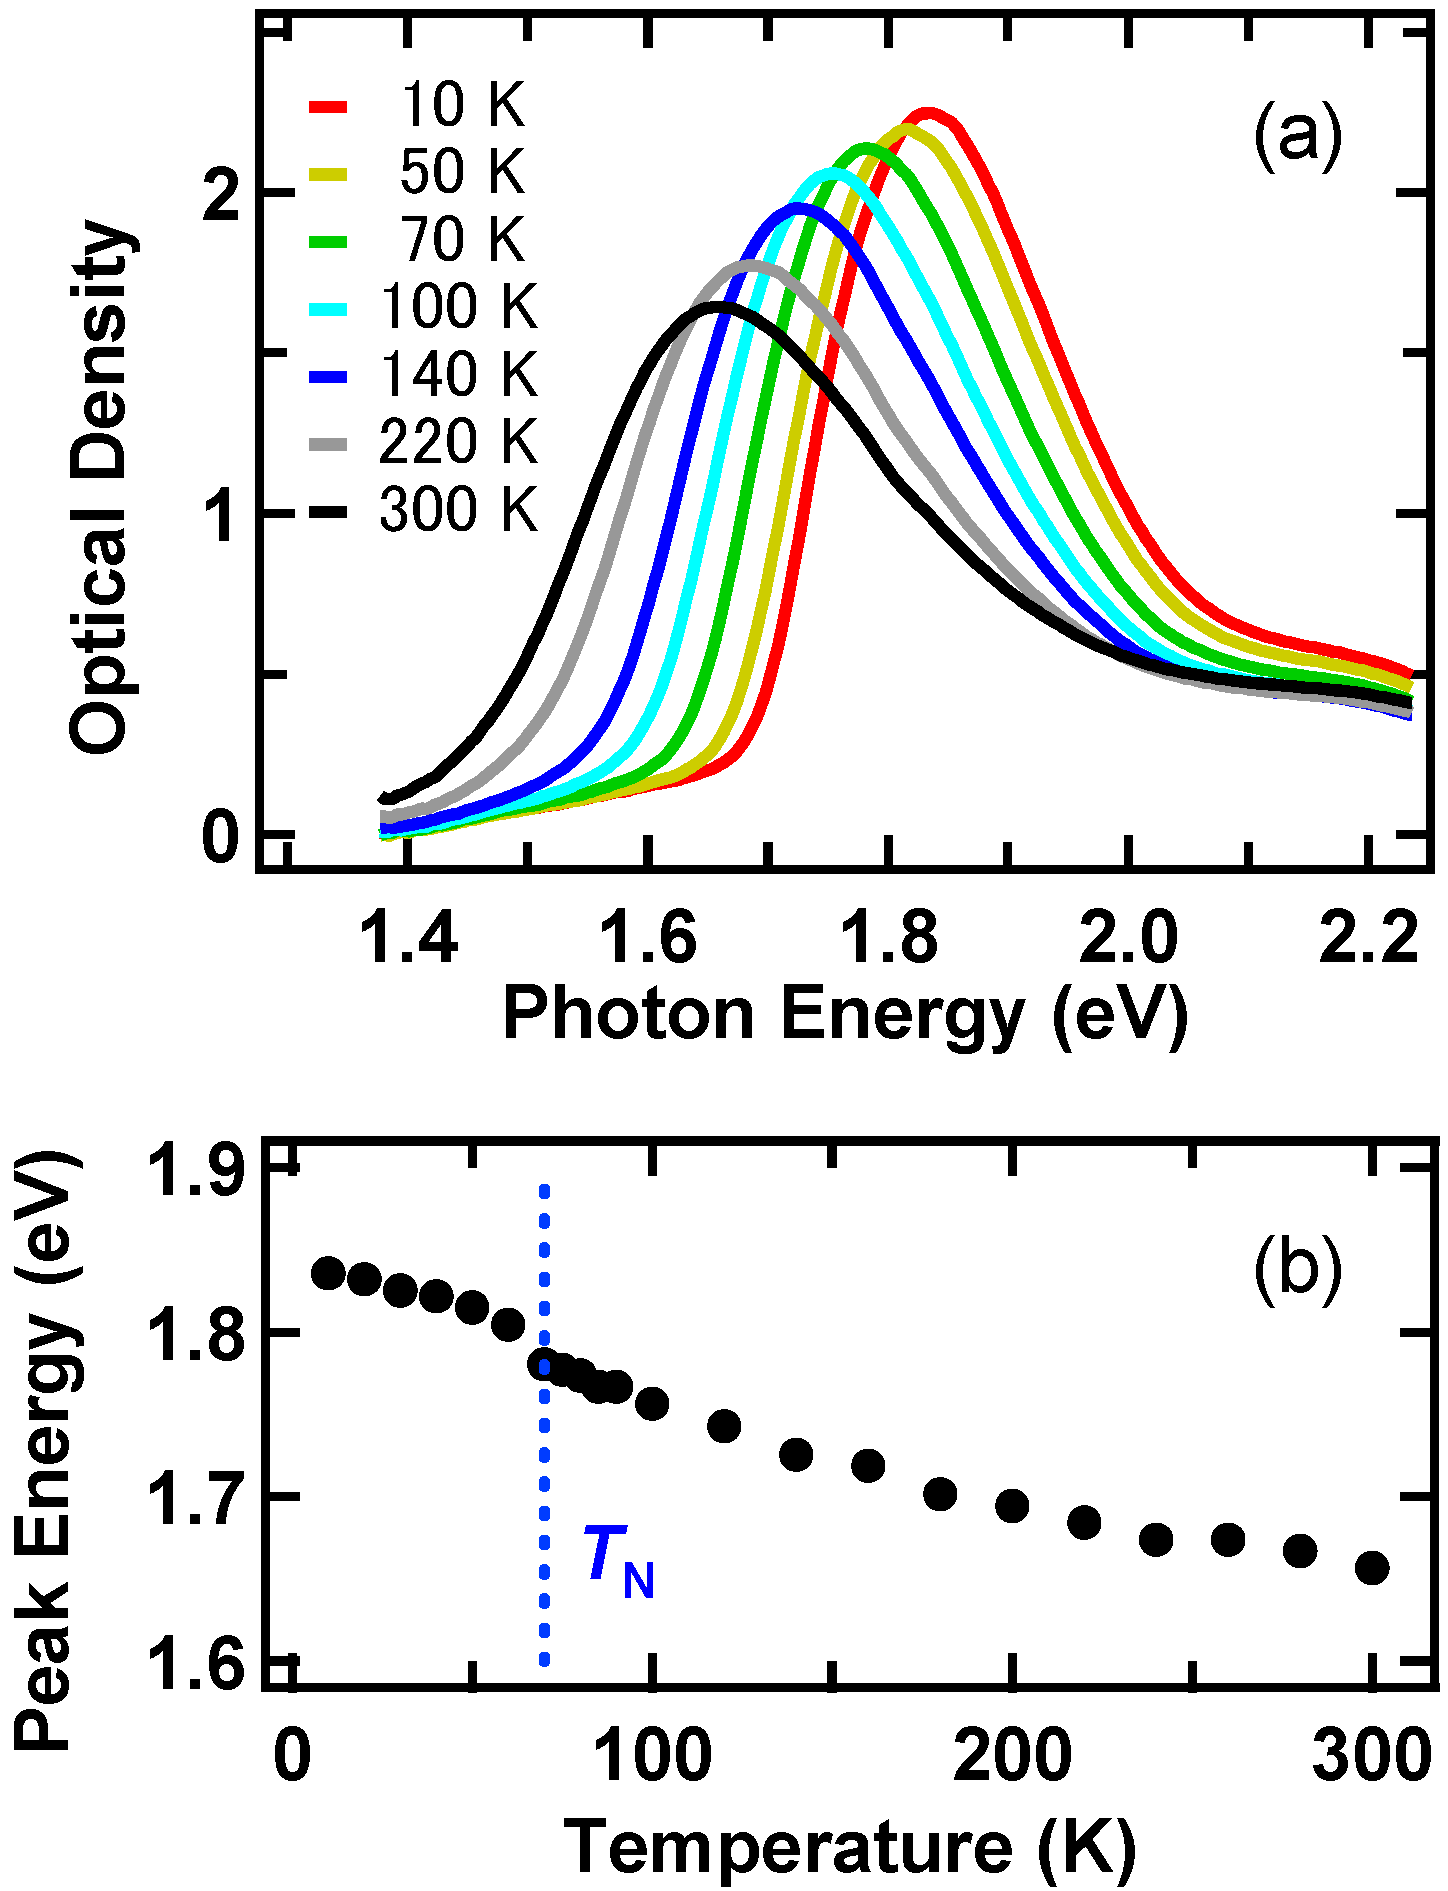
First, we describe optical transition properties in RMnO3. Figure 2a shows the absorption spectra at different sample temperatures in a hexagonal YMnO3 thin film with the thickness of ~300 nm epitaxially grown on a (111) MgO substrate by pulsed laser deposition [35,36]. A strong absorption band is observed at each temperature. The profile is consistent with previous reports of an absorption spectrum [37] and imaginary part of a dielectric function [38]. In hexagonal RMnO3, the crystal field of D3h symmetry splits Mn 3d orbitals into two e1g (xz, yz) orbitals, two e2g (xy, x2y2) orbitals and a1g (3z2r2) orbital. The e1g and e2g are occupied states while a1g is unoccupied state. Accordingly, the optical transitions occur from the e1g and e2g states to a1g state [39]. It is widely considered that the absorption peak at ~1.7 (2.3) eV is originated from the optical transition from the e2g to a1g (e1g to a1g) states [12,37,39]. The absorption band shows a lower energy shift with an increase in temperature. The peak energy of the absorption band is plotted in Figure 2b as a function of temperature, where the vertical dashed line indicates the Néel temperature: ~70 K [20]. The amount of the lower-energy shift is ~0.18 eV as increasing temperature from 10 to 300 K. In the pump-probe experiment with a fixed pump photon energy, we have to pay strict attention to this energy shift because the initial distribution of excited electron states can be changed by temperature; the feature of the initial distribution could affect ultrafast responses of the electron and phonon systems. Wu et al. measured ∆R/R0 signals as a function of temperature in various YMnO3 epitaxial films and estimated the energy gaps from the signal amplitude around the time origin [40]. Similarly, the effect of the absorption band shift is emerged in our study, which is discussed in Section 4.4.
In Figure 2b, the absorption peak shows an abrupt change around the Néel temperature. Such anomalies of absorption peak shifts were observed in hexagonal RMnO3 thin films with R = Gd, Tb, Dy, Ho and Lu [12]. These anomalies are attributed to that the electronic state is modulated by the antiferromagnetic ordering. On the other hand, in order to rigorously analyse the temperature-dependent peak shift, the line-shape analysis of the absorption band considering several absorption bands would be required. Figure 3a shows the optical conductivity spectra at 6 K and 300 K in a hexagonal HoMnO3 single crystal [41]. The inset shows a fitted result of the spectrum at 6 K considering four components. The four components were considered to be due to the transitions from two e2g states to a1g state and from two e1g states to a1g state. Figure 3b shows the peak positions of each component as a function of temperature. The temperature dependence of the peak energy is different from each other, which suggests the complexity of the mechanism of the absorption band shift. Moreover, the fitted result indicates that the band at ~1.7 eV is composed of at least two components (striking one at ~1.7 eV and weak one in a lower-energy range). The absorption spectra in Figure 2a may have similar components because it shows a similar asymmetric profile.

4.2. Observation of Coherent Optical Phonons

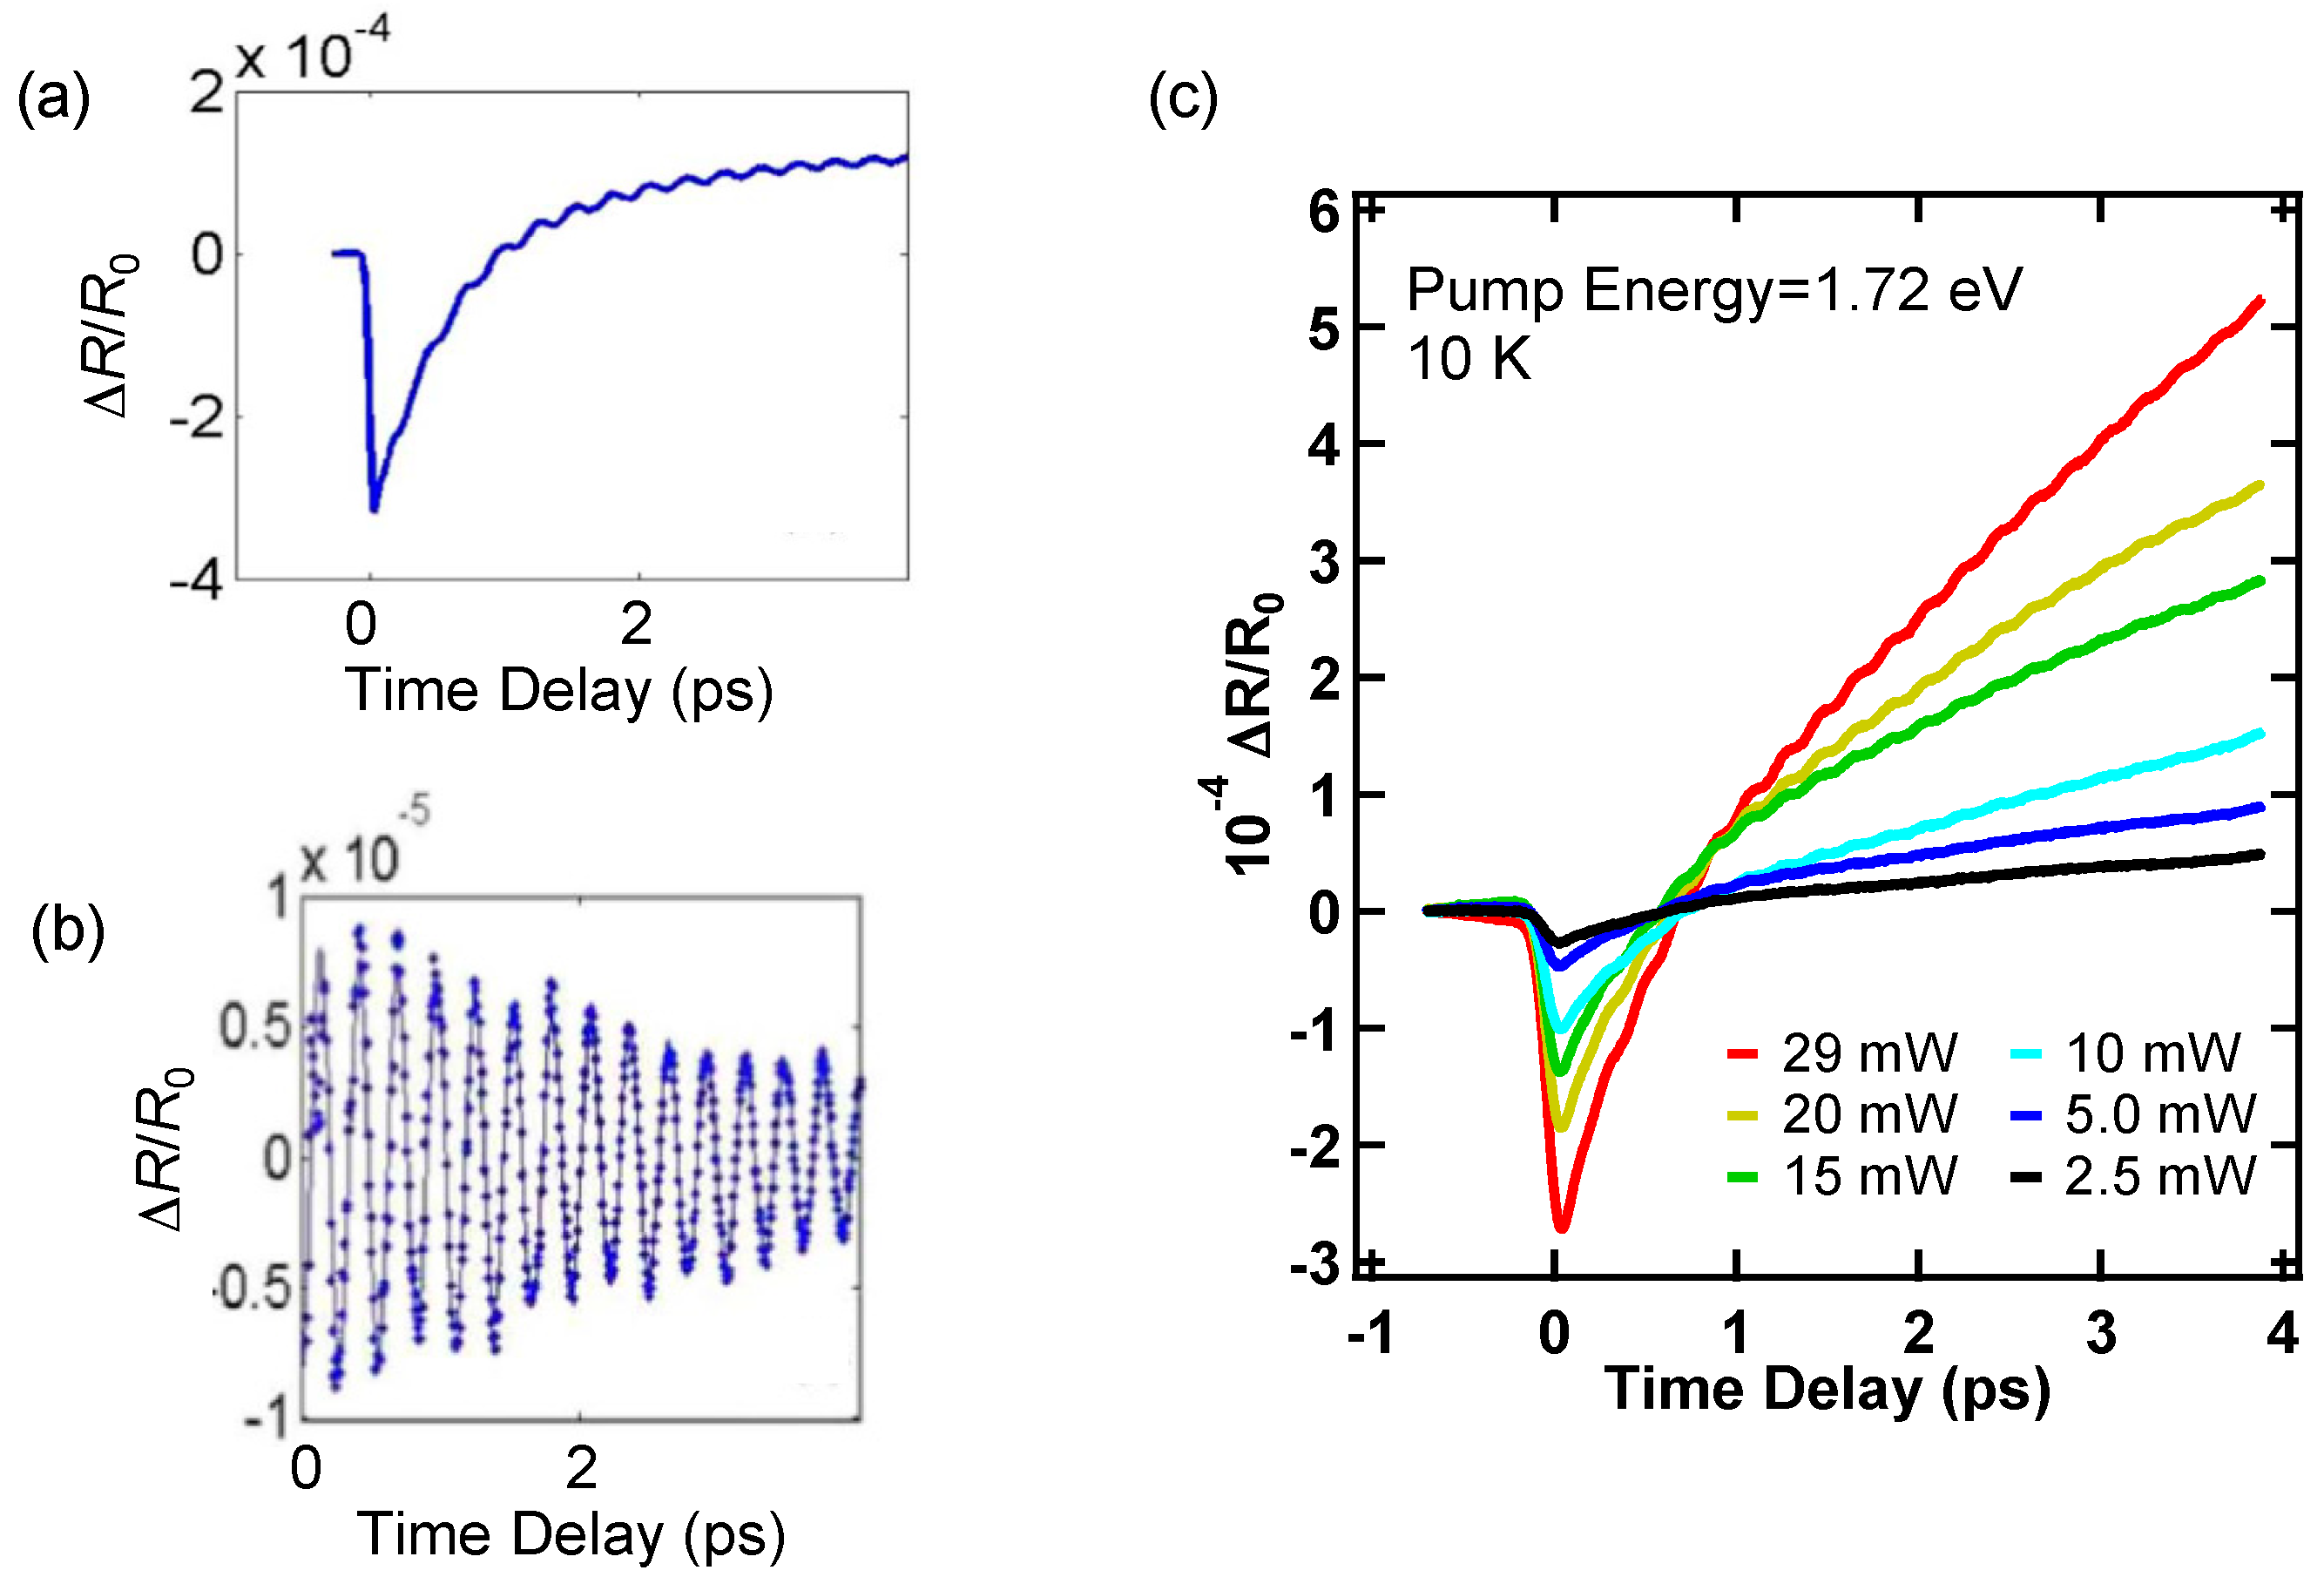
Hereafter, we describe the results of pump-probe experiments. The observation of a coherent optical phonon in LuMnO3 was first reported by Lou et al. [22]. They used reflection-type pump-probe spectroscopy with 20-fs optical pulses at room temperature. The pump photon energy was 1.55 eV, which is near the absorption peak of Mn3+ d-d transitions. Figure 4a shows the ∆R/R0 signal in a LuMnO3 single crystal at room temperature, where the pump and probe pulses were irradiated to the (0001) face. The signal shows a V-shaped profile with an oscillatory structure. The oscillatory signal extracted from Figure 4a is shown in Figure 4b. The frequency was evaluated to be ~3.6 THz. From measurements of the polarization dependences of pump and probe pulses on the oscillation and discussion based on related Raman tensors, the oscillatory signal was assigned to the coherent optical phonon with A1 symmetry. The coherent phonon signal shows a cosine shape, which indicates that the coherent phonon is generated by the DECP mechanism. In addition, the sharp drop of the ∆R/R0 signal around the time origin was discussed. They interpreted it as the change in absorption of the optical transition between e2g to a1g states. Figure 4c shows the ∆R/R0 signals in the YMnO3 thin film at different pump powers measured at 10 K. The pump photon energy was tuned to 1.72 eV that is sufficiently higher than the absorption edge. The ∆R/R0 signal has a V-shaped curve and an oscillatory structure, which are similar to those in Figure 4a. The ∆R/R0 signal can be decomposed into three components; a fast spike component, slowly-varying component and oscillating component. Wu et al. comprehensively analysed the ∆R/R0 signal in YMnO3 epitaxial films using by the following equation [40]:
Δ R R 0 ( T , t ) = A 1 ( T ) e t τ 1 + A s 1 ( T ) [ 1 e t τ s 1 ] e t τ 2 + A s 2 ( T ) [ 1 e t τ s 2 ] e t τ 3 + A o ( T ) e t τ d cos ( ω 0 t + φ 0 )
where the first to forth terms on the right-hand side correspond to the non-thermal electronic response, incoherent electron-phonon interaction, magnetization dynamics and coherent acoustic phonon oscillation, respectively. The non-thermal electronic response is originated from dense excited states, which quickly decays within 1 ps. The fast spike component in Figure 4c corresponds to the first term. The second term is a slow positive component. The thermalization process of electron and phonon systems has a fast rise time (τs1) of ~1 ps while the decay time (τ2) is few hundreds of picosecond. The third term is a slow negative component associated with the perturbation of the antiferromagnetic ordering due to the optical transition [25]. The disordering time (τs2) and reordering time (τ3) are few ps and few hundreds of picosecond, respectively. The slow component in Figure 4c shows a positive value in all the pump powers. Accordingly, the incoherent electron-phonon interaction (second term) would be dominant. The oscillation period of acoustic phonons is few tens of picosecond [21,23,25], which is much longer than the time window of Figure 4c. A clear oscillatory signal of acoustic phonons is observable with a longer time window. In the present ∆R/R0 signal, the acoustic-phonon signal may contribute to the rise of the slow components.
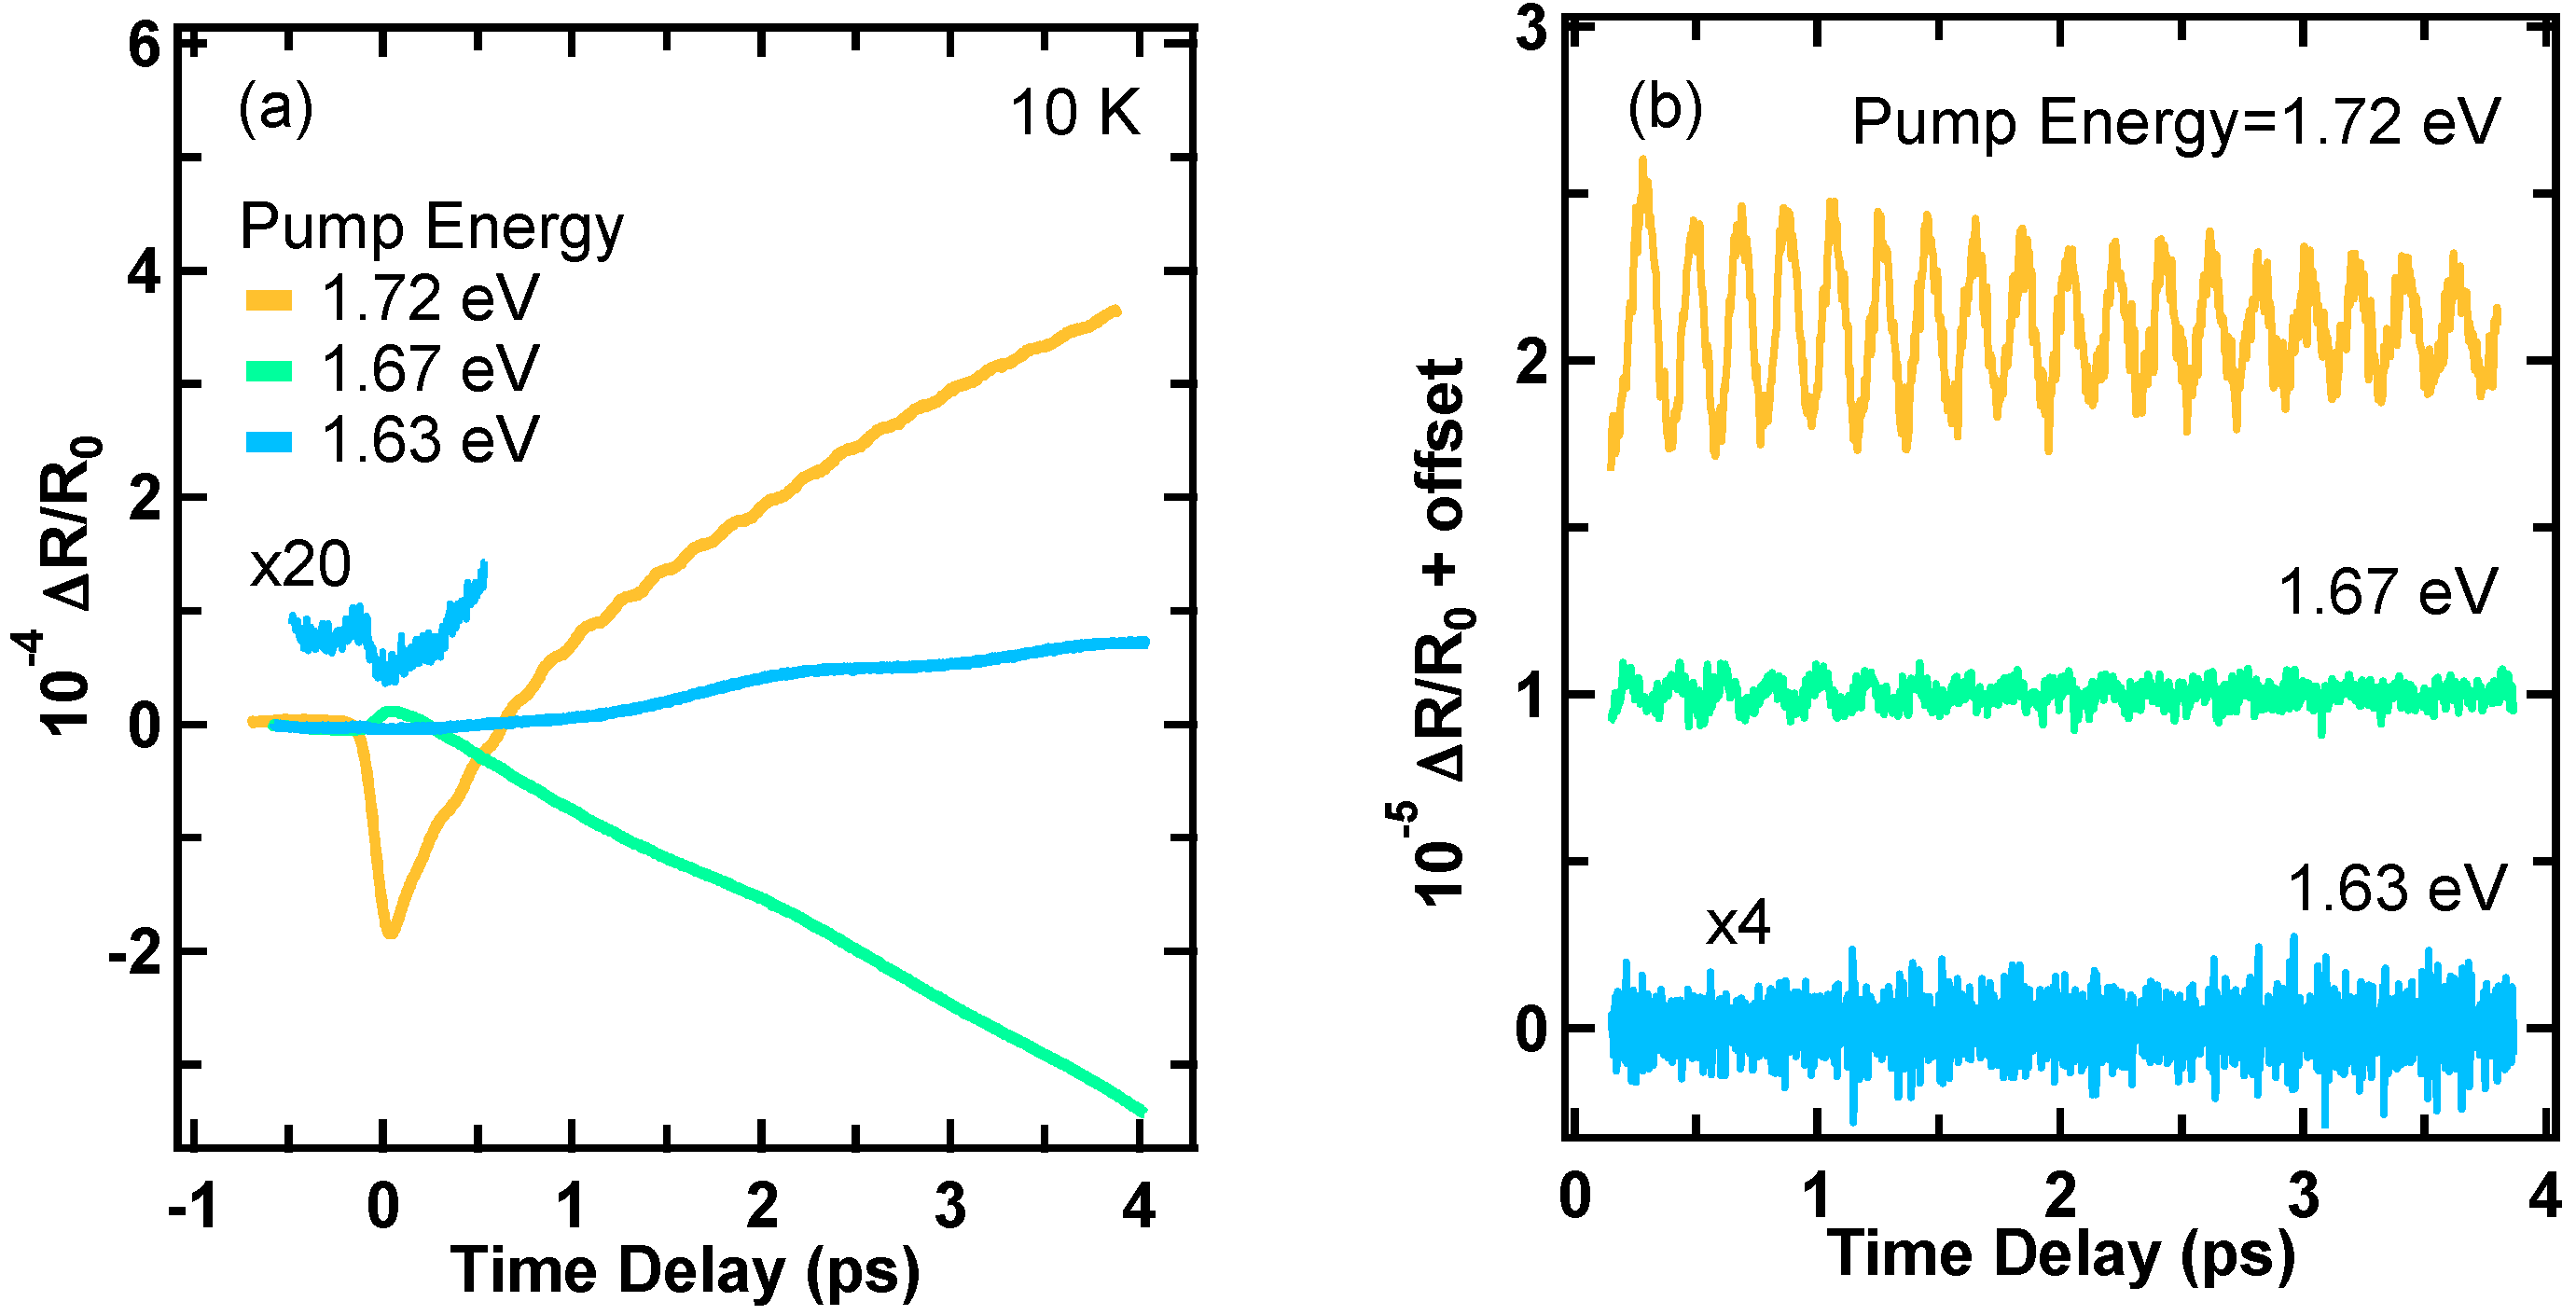
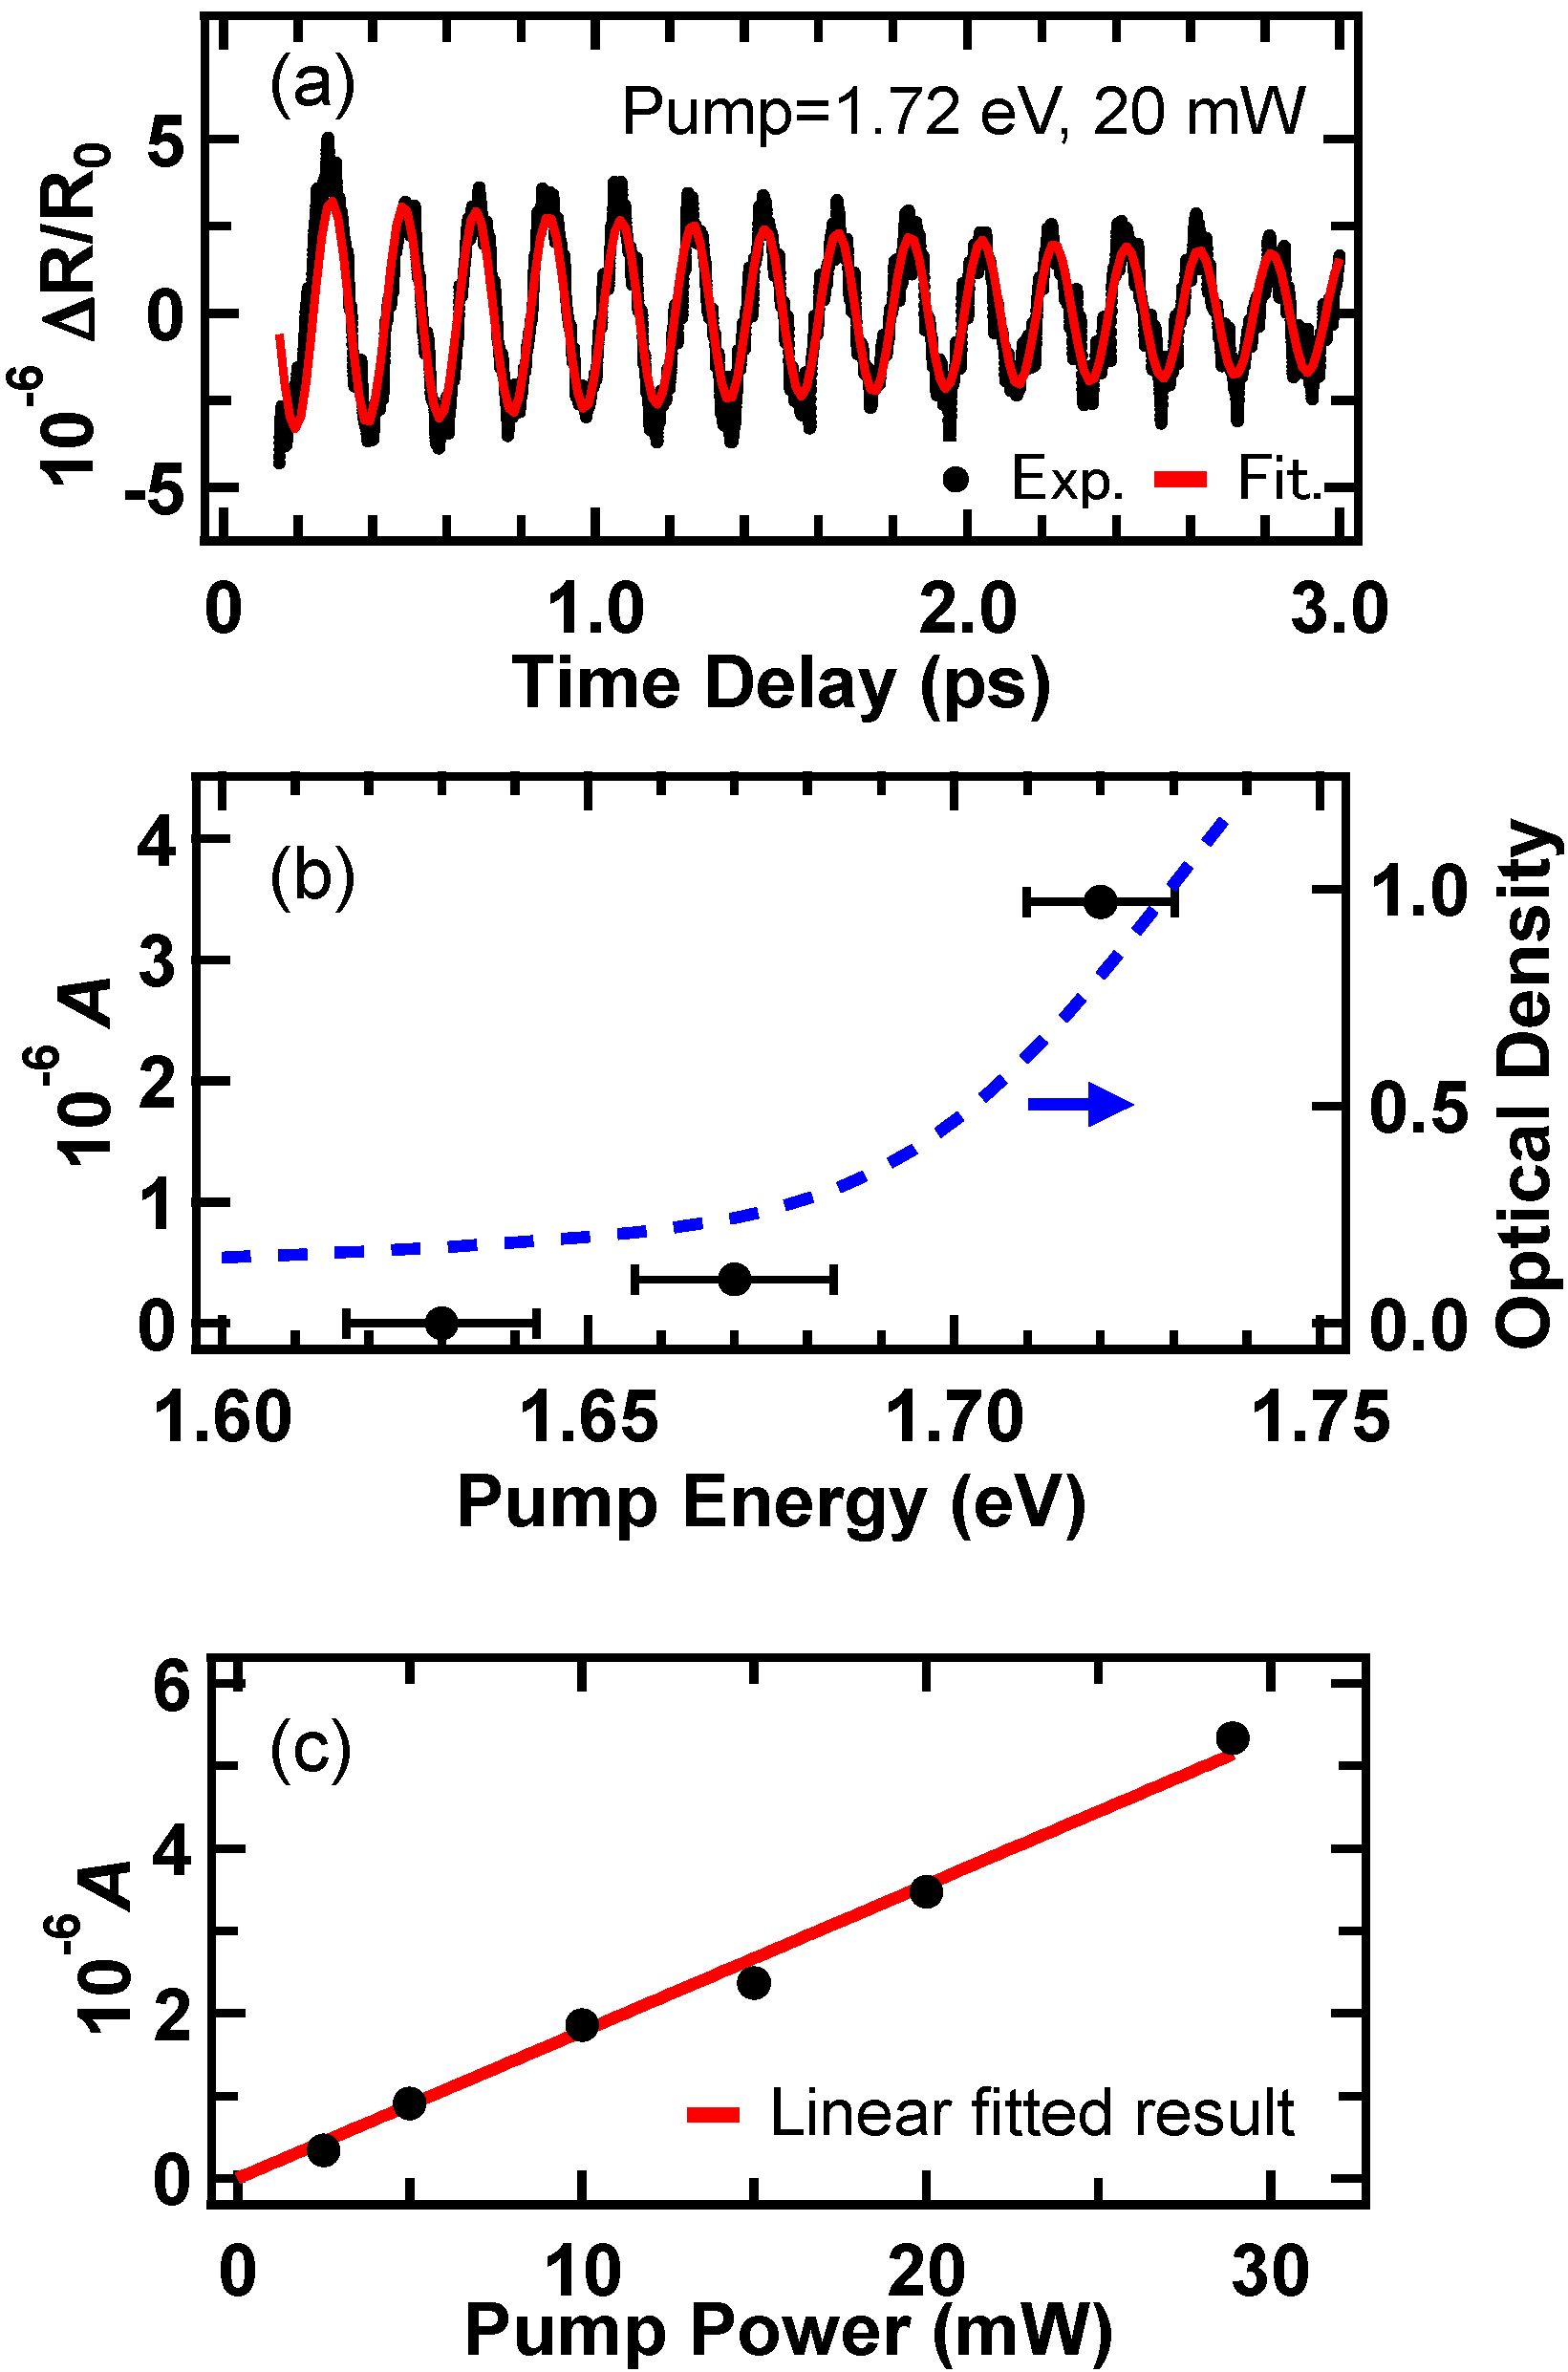
Figure 5a shows the ∆R/R0 signals in the YMnO3 thin film at different pump photon energies at 10 K. We tuned the pump photon energy to 1.63, 1.67 and 1.72 eV with the same pump power of 20 mW. We note that the optical density of the absorption band becomes lower as decreasing the pump photon energy from 1.72 to 1.63 eV. In the ∆R/R0 signals at 1.67 and 1.72 eV, the contribution of the photoexcitation is obvious from the striking fast and slow components. On the other hand, both polarities of the fast and slow components at 1.67 eV are different from those of the signal at 1.72 eV. The polarity reversal of the fast component was observed in the pump photon energy dependence around the band gap [40]. Based on Equation (1), the negative slow component at 1.67 eV corresponds to the magnetization dynamics. This fact implies that the excitation of lower energy region (the low-energy weak component) in the absorption band leads to the strong perturbation of the magnetic ordering and/or the reduction of the incoherent electron-phonon interaction. Figure 5b shows the oscillatory signals with the subtraction of the fast and slow components. The amplitude of the oscillatory signal strongly depends on the pump photon energy. In order to analyse the oscillatory signals, we fitted the signals by a damped harmonic oscillation curve: Aexp(−t/τp) cos(ωt + φ), where A, ω/2π, φ and τp are the amplitude, frequency, phase and decay time of the oscillation, respectively. The fitted result of the oscillatory signal pumping at 1.72 eV with 20 mW is shown in Figure 6a as an example. All the oscillatory signals were well fitted by the oscillation curve. This means that the oscillatory signal is composed of a single-frequency mode. The estimated frequency is ~5.1 THz (~170 cm−1), which is independent on the pump photon energy and power. This frequency almost agrees with the lowest-frequency one of optical phonon modes with A1 symmetry in hexagonal YMnO3 crystals observed by Raman spectroscopy [17,19,20], where the calculated frequency of the longitudinal mode is the same frequency as the transverse mode [28]. The observed coherent optical phonons in LuMnO3 are the lowest-frequency mode with A1 symmetry [22,24]. Moreover, the generation mechanism was assigned to DECP. As described in Section 2, the photoexcitation of electrons is essential to the DECP mechanism. Moreover, the amplitude of the coherent phonon generated by DECP tends to proportional to the pump power corresponding to the number of photoexcited electrons [42]. Figure 6b shows the pump photon energy dependence of A, where the bar indicates FWHM of the pump pulse spectrum. The dashed curve indicates the absorption spectrum at 10 K. The amplitude clearly shows the relation to the amount of photoexcitation. Figure 6c shows the pump power dependence of A. The amplitude is proportional to the pump power as indicated by the solid line. The coexistence of both properties shown in Figure 6b,c is consistent with the characteristics of the coherent phonon generated by the DECP mechanism. These facts demonstrate that the oscillatory signal is originated from the lowest frequency coherent optical phonon with A1 symmetry generated by the DECP mechanism.

4.3. Temperature Dependence of Coherent Optical Phonons

The temperature dependence of phonon modes in YMnO3 has intensively investigated by Raman spectroscopy [17,19,20] and infrared spectroscopy [18]. The temperature-dependent shift of the phonon frequency is the main concern; several phonon modes exhibit anomalies around the Néel temperature. This behaviour could be affected by the spin-lattice coupling that is relevant to the electromagnetic effect. Thus, the investigation of the coherent optical phonon as a function of temperature is extremely important. Here, we describe the characteristics of the temperature dependence of the coherent optical phonon.
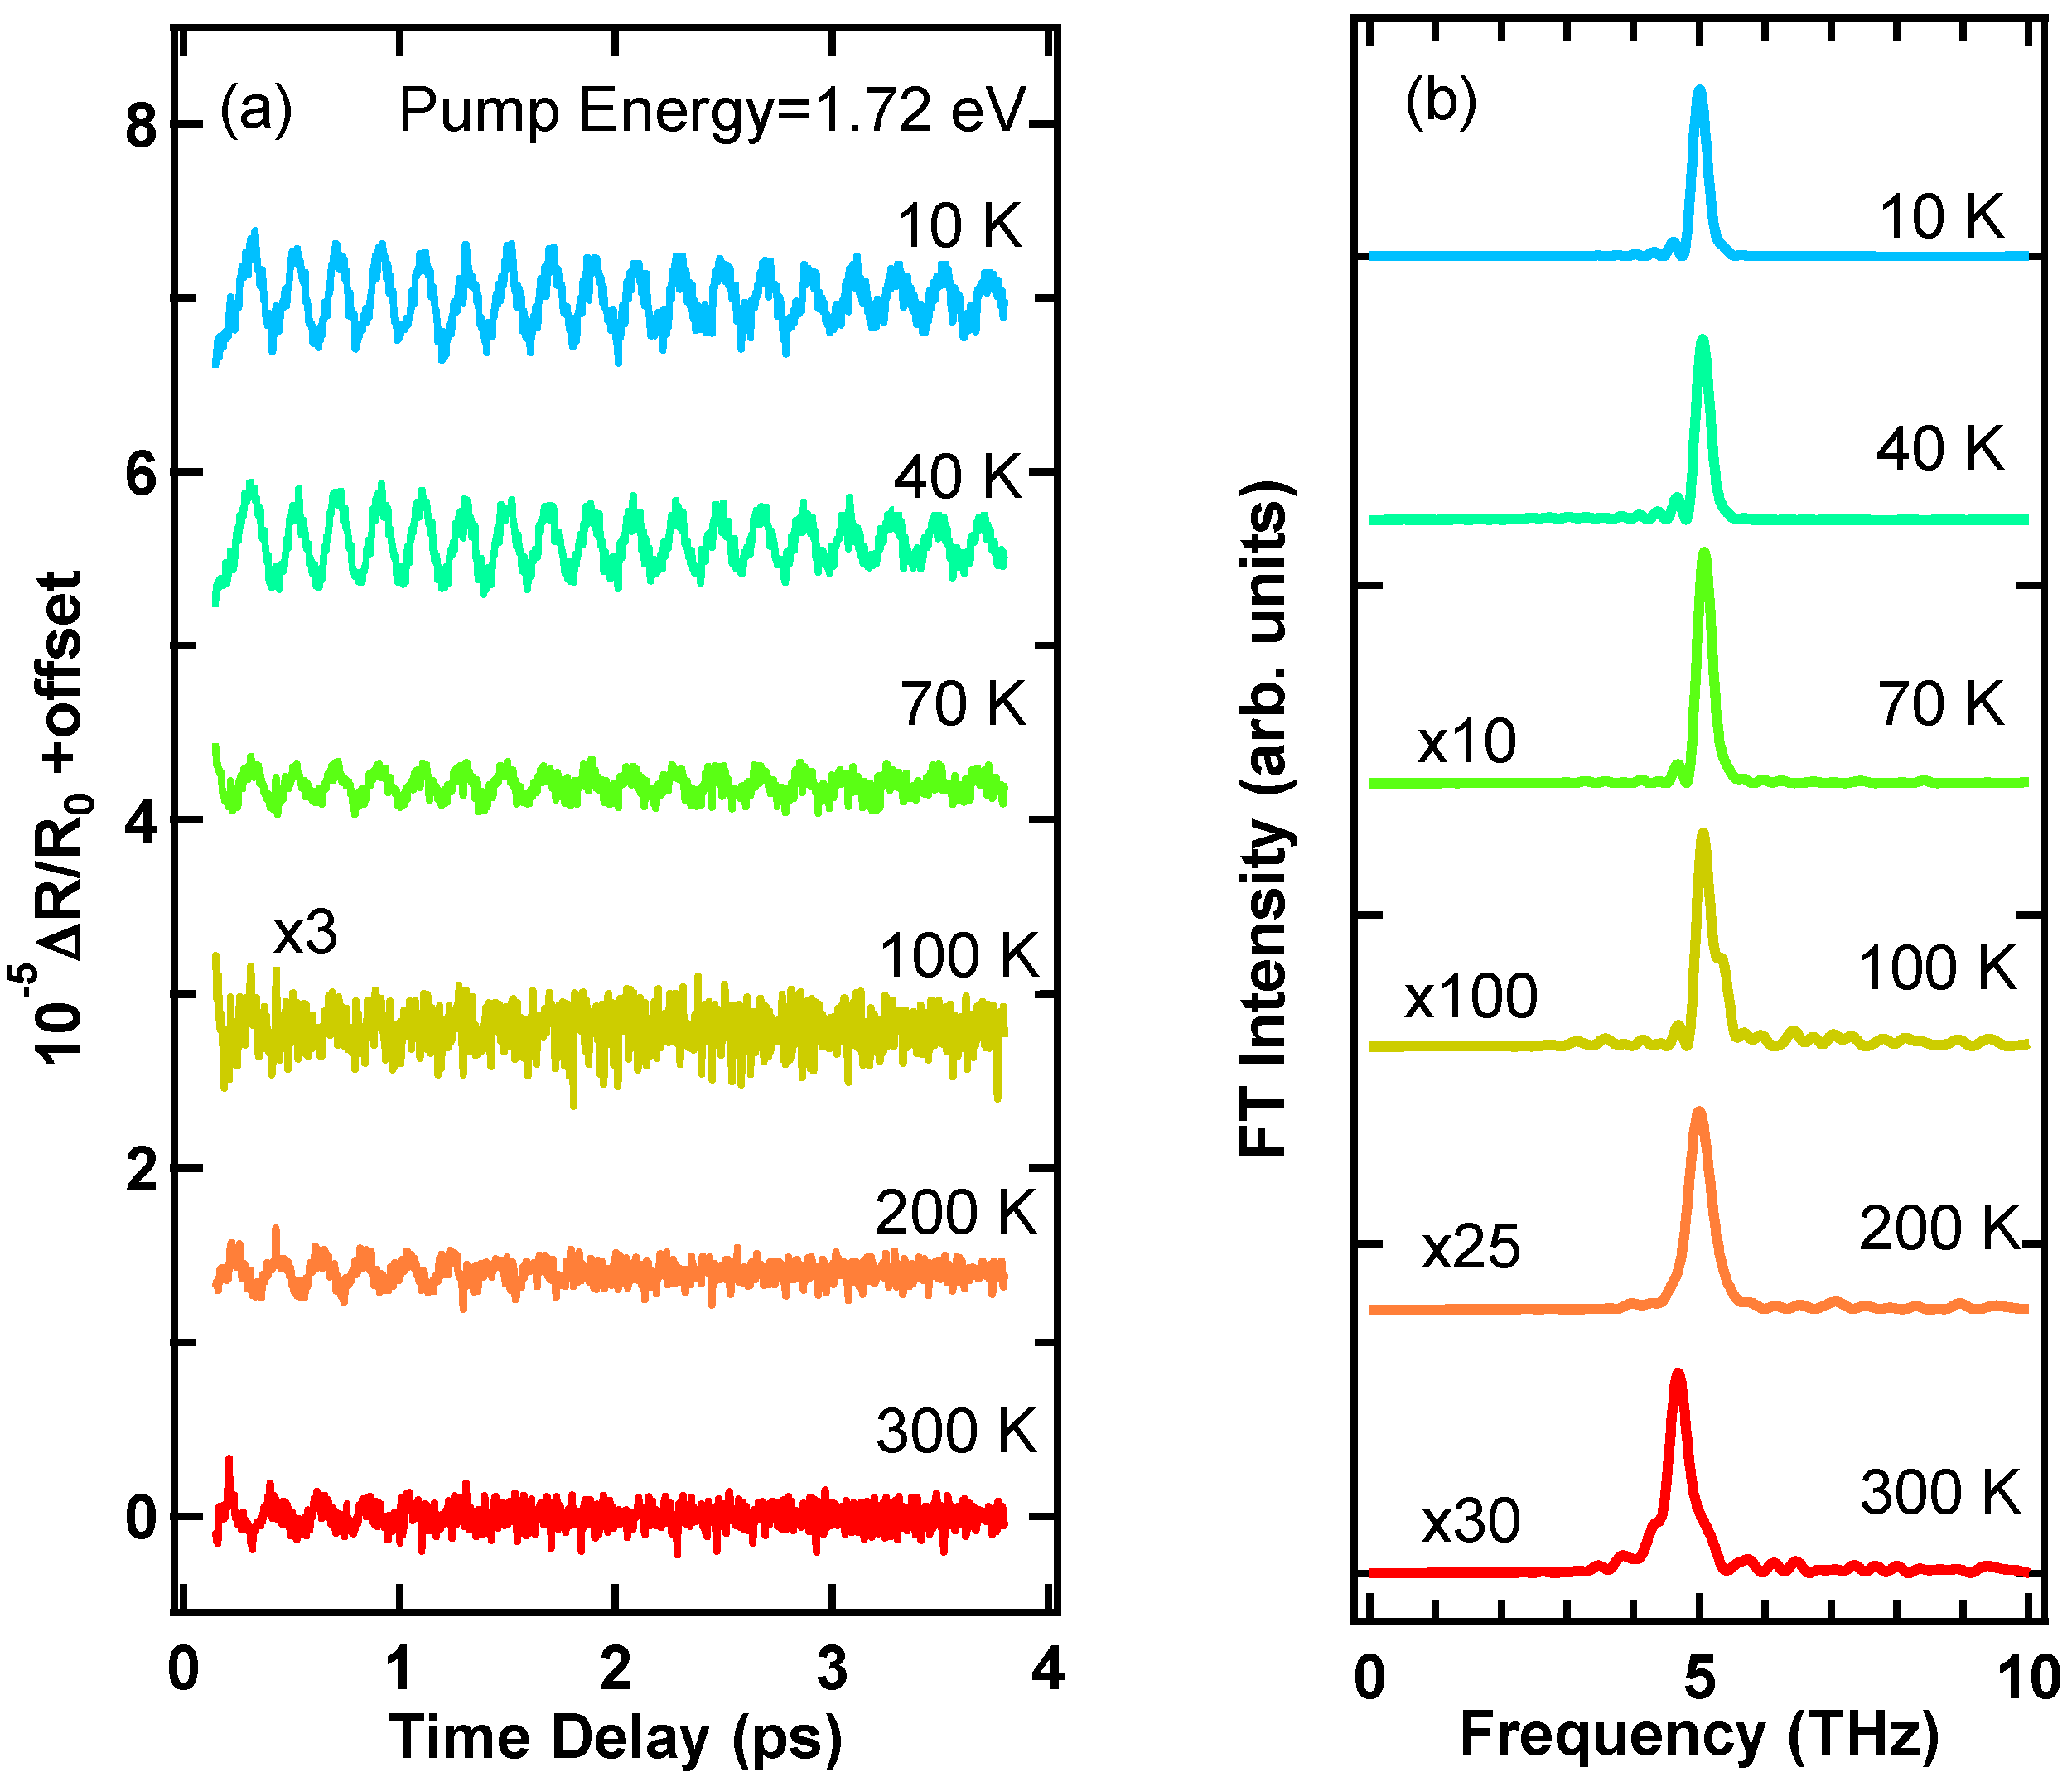
Figure 7 shows the ∆R/R0 signals in the temperature ranges from 10 to 90 K (a) and from 100 to 300 K (b) under the fixed pump photon energy of 1.72 eV. The oscillatory signals of the coherent optical phonon are discernible at several temperatures. Moreover, the fast and slow components show a strong temperature dependence, which is discussed in Section 4.4. Figure 8a shows the time-domain oscillatory signals numerically extracted from the ∆R/R0 signals in Figure 7. The amplitude of the coherent phonon strongly depends on the temperature. We performed the Fourier transform (FT) of the time-domain oscillatory signals to precisely evaluate the temperature dependence of the coherent phonon. The calculated FT power spectra are shown in Figure 8b. The peak frequency and intensity of the FT band depend on the temperature.
First, we discuss the temperature dependence of the peak frequency. Figure 9a shows the peak frequency of the FT spectrum as a function of temperature, where the length of the bar corresponds to FWHM of the FT band. The solid curve is a guide to the eye. The peak frequency has a small temperature dependence. The frequency shift is ~0.3 THz (~10 cm−1) as increasing from 10 to 300 K. The total amount of the shift almost agrees with that of the peak shift of the corresponding Raman spectrum [17]. In contrast to previous Raman studies, the anomaly of the frequency shift around the Néel temperature is unidentified in Figure 9a. The possible reason is that the accuracy of the estimated frequency is insufficient to observe the anomalous behaviour around the Néel temperature because of the intensity drop of the oscillation as described in the next paragraph. The slight broadening of the FT band is seen with increasing temperature. It is attributed to a build-up of energy relaxation processes of the optical phonon.
The FT intensity of the coherent optical phonon exhibits a complex temperature dependence. The integrated intensity of the FT band is plotted in Figure 9b as a function of temperature together with the Néel temperature (70 K) as the vertical dotted line, where the solid curve is a guide to the eye. It is indicated that the FT intensity decreases as the temperature increases to the Néel temperature from 10 K. The intensity has a minimum value at ~100 K and then it slightly recovers in a higher temperature range. The change in intensity of coherent phonons around the Néel temperature has reported in hexagonal RMnO3 compounds with R = Y, Lu and Ho [23,24,25,26]. On the other hand, they reported that coherent phonons are completely damped when the temperature passes through the Néel temperature. In contrast to these reports, the present coherent optical phonon can be observed in the temperature range from 10 to 300 K including the Néel temperature. Thus, the present data is of great importance for understanding the characteristics of the coherent phonon dynamics in hexagonal RMnO3 compounds.
The intensity of the coherent phonon generated by the DECP mechanism reflects the population of excited states. As described in Figure 2, the absorption band has the strong temperature dependence. Accordingly, the population of photogenerated electrons can be changed by temperature under the fixed pump photon energy of 1.72 eV. The amount of the lower energy shift of the absorption peak is ~50 meV as increasing temperature from 10 to 70 K, while the profile of the absorption band is almost unchanged. Therefore, we simply evaluated the contribution of the absorption band shift to the coherent phonon intensity by decreasing the pump photon energy by 50 meV at 70 K. Figure 10a shows the ∆R/R0 signals at the pump photon energy of 1.67, 1.70 and 1.72 eV at 70 K, where the maximum of the pump photon energy difference, 50 meV, corresponds to the energy shift of the absorption peak from 10 to 70 K. The time-domain oscillatory signals extracted from the ∆R/R0 signals are shown in Figure 10b, where the right-side inset shows the integrated intensities of the FT band of the time-domain oscillatory signals. It is evident that the pump-photon energy dependence of the FT intensity is negligibly small in comparison with the temperature dependence of that from 10 to 70 K as shown in Figure 9b. This fact demonstrates that the intensity drop of the coherent optical phonon around the Néel temperature is not related to the temperature dependence of the absorption band.
It is considered from the above discussion that the change in intensity of the coherent optical phonon is related to the antiferromagnetic ordering. In YMnO3, the Y atom is nonmagnetic while the Mn atom is directly related to the magnetic property. It is noted that the A1-symmetry optical phonon includes only the vibrations of Y atoms [28]. It seems strange that the oscillation intensity of the A1-symmetry optical phonon correlates with the antiferromagnetic ordering. This behaviour can be explained by the isostructural transition around the antiferromagnetic ordering as follows [14]. As decreasing temperature to the Néel temperature from a higher temperature range, Mn atoms displace from their ideal positions to get antiferromagnetic ordering and the other atoms also displace within the unit cell. The variation of the atom positions can change the characteristics of phonon properties. In YMnO3, there are two types of Y atoms locating at different lattice sites. The displacements of two Y atoms are not identical as a function of temperature, whereas they have extrema values at the same temperature of ~90 K. This temperature almost agrees with the temperature at which the oscillation intensity of the coherent optical phonon has the minimum value. On the assumption that the relative amount of the displacement of Y atoms from their position at 10 K corresponds to the decrement of the intensity of the coherent optical phonon, the dip-shaped dependence in Figure 9b can be qualitatively explained. Accordingly, the change in intensity of the coherent optical phonon around the Néel temperature is considered to be originated from the spin-lattice coupling under the isostructural transition.
The comparison of the temperature dependences of the coherent optical phonons in YMnO3 and LuMnO3 exhibits an interesting aspect. The temperature dependence of a coherent optical phonon in LuMnO3 was reported by Jang et al. [24]. Figure 11a shows the temperature dependence of the ∆R/R0 signal in a LuMnO3 film observed by reflection-type pump-probe spectroscopy with 20-fs pulses. The ∆R/R0 signal shows an oscillatory structure at several temperatures. The frequency of the oscillatory structure was estimated to be ~3.6 THz by the FT analysis. From the frequency, the oscillation was assigned to the lowest-frequency coherent optical phonon. Figure 11b shows the image map of the FT amplitude spectrum as a function of temperature. The frequency is slightly decreased with an increase in temperature, which is similar to Figure 9a. The image map shows that the amplitude has a maximum value at ~200 K and is completely damped in a temperature range below the Néel temperature (~90 K). We note that this behaviour is oppositely different to Figure 9b: the intensity strongly decreases in a temperature range above the Néel temperature. The opposite behaviour could be originated from the property of the isostructural transitions; namely, the displacement direction of Mn atoms in YMnO3 is opposite in comparison with that in LuMnO3 [14]. We believe that the difference of the isostructural transition properties leads to the distinct temperature dependence of the coherent optical phonon.
There are several reports on the temperature dependence of coherent acoustic phonons in RMnO3 compounds [21,23,24,25]. The generation process of observed acoustic phonons was considered to a propagating strained layer mechanism [43]. Lim et al. studied the oscillation period, phase and decay time of a coherent acoustic phonon as a function of temperature in a LuMnO3 film [21]. They found that the phase steeply changes near the Néel temperature. It is originated from a sudden change in complex refractive index around the d-d transition energy. Jang et al. studied the temperature dependences of coherent acoustic phonons in YMnO3 [23] and LuMnO3 films [24]. The amplitudes of coherent acoustic phonons in both samples have a maximum value around 190 K and disappear below the Néel temperature, which is similar to that of the coherent optical phonon in Figure 11b. On the other hand, the frequency of that in LuMnO3 does not show a monotonous change as a function of temperature. Moreover, when the temperature is well below the Néel temperature in both samples, another oscillatory structure with a different frequency appears. Such intriguing behaviours would lead to further studies on the phonon dynamics in a picosecond range.

4.4. Ultrafast Incoherent Responses of Excited Electron States

We discuss the temperature dependence of incoherent responses of excited electron states. Jin et al. studied the temperature dependence of a time-resolved transmittivity change in a YMnO3 film [37]. The signals were fitted by a double exponential decay curve, where the faster and slower decay components were interpreted as electron-lattice thermalization and spin-lattice interaction, respectively. The time constant of the slower component show a peculiar behaviour at ~120 K, which was considered to be due to a short-range spin ordering. Shih et al. reported the temperature dependence of the ∆R/R0 signal in a HoMnO3 single crystal [25]. They fitted the ∆R/R0 signal by using an equation that is similar to Equation (1). Most important finding is that the amplitude of the negative slow component shows a clear correlation to the position shift of Mn atoms as a function of temperature under the isostructural transition. Accordingly, ultrafast incoherent responses also offer a clue for deeper understanding of coupling phenomena. As shown in Figure 7, the fast and slow components have strong temperature dependences. In a lower temperature range, the signal has a V-shaped profile, while it gradually becomes L-shaped profile with an increase in temperature. The temperature at which the signal profile completely changes to L shape is ~80 K. This behaviour seems like the emergence of the correlation with the antiferromagnetic ordering. However, at 70 K, the signal profile recovers from the L shape to V shape by decreasing the pump photon energy as shown in Figure 10a. It is noted that the profile of the 1.67 eV-pumping signal at 70 K is roughly consistent with that of the 1.72 eV-pumping signal at 10 K shown in Figure 5a. As described above, the peak energy of the absorption band is decreased by ~50 meV as increasing temperature from 10 to 70 K. These facts indicate that the signal profile is determined by the energy difference between the pump photon energy and absorption band peak. As described in Figure 2, the absorption band suggests multiple components. Therefore, the distribution of photogenerated electrons strongly depends on the pump photon energy around the absorption band peak. Thus, the strong temperature dependence in Figure 7 is dominated by the temperature-dependent shift of the absorption band. The systematic study on the pump photon energy relative to the absorption band peak is essential to the investigation of incoherent response dynamics.

5. Summary

We have reviewed the characteristics of the coherent optical phonon in the hexagonal YMnO3 thin film and related optical studies on coherent phonons, ultrafast incoherent responses and steady-state optical transitions. In the hexagonal YMnO3 thin film, the fundamental absorption band was observed near 1.7 eV and it showed a lower energy shift with an increase in temperature. The spectral profile and peak shift property of the band are consistent with those in other RMnO3 compounds. The coherent phonon in the YMnO3 thin film was assigned to the lowest-frequency A1 optical phonon generated by the DECP mechanism. The symmetry and generation mechanism are identical to those in LuMnO3, which indicates the similarity between YMnO3 and LuMnO3. On the other hand, the temperature dependence of the oscillation intensity is oppositely different between these compounds; the coherent phonon intensity in YMnO3 (LuMnO3) is damped above (below) the Néel temperature. These behaviour can be explained by the isostructural transition depending on the rare-earth atom. In addition, we discussed incoherent responses of excited electron states that offer a clue for deeper understanding of coupling phenomena. We found the relation between the ultrafast incoherent response and pump photon energy. This reflects the distribution of photogenerated electrons depending on the energy difference between the pump photon energy and absorption band peak. The results presented in this review offer a new point of view for understanding ultrafast phenomena in hexagonal RMnO3 compounds and for applying ultrafast applications.

Funding

This research received no external funding.

Acknowledgments

Author acknowledges M. Nakayama for measurements of fundamental optical transition properties and valuable discussions. Author is also grateful to N. Fujimura for the sample preparation and valuable discussions.

Conflicts of Interest

The author declares no conflict of interest.

References

  1. Shah, J. Ultrafast Spectroscopy of Semiconductors and Semiconductor Nanostructures, 2nd ed.; Springer: Berlin, Germany, 1999. [Google Scholar]
  2. Ulbricht, R.; Hendry, E.; Shan, J.; Heinz, T.F.; Born, M. Carrier dynamics in semiconductors studied with time-resolved terahertz spectroscopy. Rev. Mod. Phys. 2011, 83, 543–586. [Google Scholar] [CrossRef] [Green Version]
  3. Eerenstein, W.; Mathur, N.D.; Scott, J.F. Multiferroic and magnetoelectric materials. Nature 2006, 442, 759–765. [Google Scholar] [CrossRef] [PubMed]
  4. Wang, K.F.; Liu, J.-M.; Ren, Z.F. Multiferroicity: The coupling between magnetic and polarization orders. Adv. Phys. 2009, 58, 321–448. [Google Scholar] [CrossRef]
  5. Fiebig, M.; Lottermoser, T.; Meier, D.; Trassin, M. The evolution of multiferroics. Nat. Rev. Mat. 2016, 1, 1–14. [Google Scholar] [CrossRef]
  6. Kubacka, T.; Johnson, J.A.; Hoffmann, M.C.; Vicario, C.; de Jong, S.; Beaud, P.; Grübel, S.; Huang, S.-W.; Huber, L.; Patthey, L.; et al. Large-Amplitude Spin Dynamics Driven by a THz Pulse in Resonance with an Electromagnon. Science 2014, 343, 1333–1336. [Google Scholar] [CrossRef] [PubMed] [Green Version]
  7. Yakel, H.L.; Koehler, W.C.; Bertaut, E.F.; Forrat, E.F. On the Crystal Structure of the Manganese (III) Trioxides of the Heavy Lanthanides and Yttrium. Acta Cryst. 1963, 16, 957–962. [Google Scholar] [CrossRef]
  8. Huang, Z.J.; Cao, Y.; Sun, Y.Y.; Xue, Y.Y.; Chu, C.W. Coupling between the ferroelectric and antiferromagnetic orders in YMnO3. Phys. Rev. B 1997, 56, 2623–2626. [Google Scholar] [CrossRef]
  9. Katsufuji, T.; Mori, S.; Masaki, M.; Moritomo, Y.; Yamamoto, N.; Takagi, H. Dielectric and magnetic anomalies and spin frustration in hexagonal RMnO3 (R = Y, Yb, and Lu). Phys. Rev. B 2001, 64, 104419. [Google Scholar] [CrossRef]
  10. Fiebig, M.; Lottermoser, T.; Fröhlich, D.; Goltsev, A.V.; Pisarev, R.V. Observation of coupled magnetic and electric domains. Nature 2002, 419, 818–820. [Google Scholar] [CrossRef]
  11. Lottermoser, T.; Lonkai, T.; Amann, U.; Hohwein, D.; Ihringer, J.; Fiebig, M. Magnetic phase control by an electric field. Nature 2004, 430, 541–544. [Google Scholar] [CrossRef]
  12. Choi, W.S.; Moon, S.J.; Seo, S.S.A.; Lee, D.; Lee, J.H.; Murugavel, P.; Noh, T.W.; Lee, Y.S. Optical spectroscopic investigation on the coupling of electronic and magnetic structure in multiferroic hexagonal RMnO3 (R = Gd, Tb, Dy, and Ho) thin films. Phys. Rev. B 2008, 78, 054440. [Google Scholar] [CrossRef]
  13. Lee, S.; Pirogov, A.; Han, J.H.; Park, J.-G.; Hoshikawa, A.; Kamiyama, T. Direct observation of a coupling between spin, lattice and electric dipole moment in multiferroic YMnO3. Phys. Rev. B 2005, 71, 180413. [Google Scholar] [CrossRef]
  14. Lee, S.; Pirogov, A.; Kang, M.; Jang, K.-H.; Yonemura, M.; Kamiyama, T.; Cheong, S.-W.; Gozzo, F.; Shin, N.; Kimura, H.; et al. Giant magneto-elastic coupling in multiferroic hexagonal manganites. Nature 2008, 451, 805–809. [Google Scholar] [CrossRef] [PubMed]
  15. Fabrèges, X.; Petit, S.; Mirebeau, I.; Pailhès, S.; Pinsard, L.; Forget, A.; Fernandez-Diaz, M.T.; Porcher, F. Spin-Lattice Coupling, Frustration, and Magnetic Order in Multiferroic RMnO3. Phys. Rev. Lett. 2009, 103, 067204. [Google Scholar] [CrossRef]
  16. Singh, A.K.; Patnaik, S.; Kaushik, S.D.; Siruguri, V. Dominance of magnetoelastic coupling in multiferroic hexagonal YMnO3. Phys. Rev. B 2010, 81, 184406. [Google Scholar] [CrossRef]
  17. Fukumura, H.; Matsui, S.; Harima, H.; Kisoda, K.; Takahashi, T.; Yoshimura, T.; Fujimura, N. Raman scattering studies on multiferroic YMnO3. J. Phys. Condens. Matter 2007, 19, 365239. [Google Scholar] [CrossRef] [PubMed]
  18. Zaghrioui, M.; Phuoc, V.T.; Souza, R.A.; Gervais, M. Polarized reflectivity and lattice dynamics calculation of multiferroic YMnO3. Phys. Rev. B 2008, 78, 184305. [Google Scholar] [CrossRef]
  19. Vermette, J.; Jandl, S.; Mukhin, A.A.; Ivanov, V.Y.; Balbashov, A.; Gospodinov, M.M.; Pinsard-Gaudart, L. Raman study of the antiferromagnetic phase transitions in hexagonal YMnO3 and LuMnO3. J. Phys. Condens. Matter 2010, 22, 356002. [Google Scholar] [CrossRef]
  20. Toulouse, C.; Liu, J.; Gallais, Y.; Measson, M.-A.; Sacuto, A.; Cazayous, M.; Chaix, L.; Simonet, V.; de Brion, S.; Pinsard-Godart, L.; et al. Lattice and spin excitations in multiferroic h-YMnO3. Phys. Rev. B 2014, 89, 094415. [Google Scholar] [CrossRef]
  21. Lim, D.; Averitt, R.D.; Demsar, J.; Taylor, A.J.; Hur, N.; Cheong, S.W. Coherent acoustic phonons in hexagonal manganite LuMnO3. Appl. Phys. Lett. 2003, 83, 4800–4802. [Google Scholar] [CrossRef]
  22. Lou, S.-T.; Zimmermann, F.M.; Bartynski, R.A.; Hur, N.; Cheong, S.-W. Femtosecond laser excitation of coherent optical phonons in ferroelectric LuMnO3. Phys. Rev. B 2009, 79, 214301. [Google Scholar] [CrossRef]
  23. Jang, K.-J.; Lee, H.-G.; Lee, S.; Ahn, J.; Ahn, J.S.; Hur, N.; Cheong, S.-W. Strong spin-lattice coupling in multiferroic hexagonal manganite YMnO3 probed by ultrafast optical spectroscopy. Appl. Phys. Lett. 2010, 97, 031914. [Google Scholar] [CrossRef]
  24. Jang, K.-J.; Lim, J.; Ahn, J.; Kim, J.-H.; Yee, K.-J.; Ahn, J.S.; Cheong, S.-W. Ultrafast IR spectroscopic study of coherent phonons and dynamic spin–lattice coupling in multiferroic LuMnO3. New J. Phys. 2010, 12, 023017. [Google Scholar] [CrossRef]
  25. Shih, H.C.; Chen, L.Y.; Luo, C.W.; Wu, K.H.; Lin, J.-Y.; Juang, J.Y.; Uen, T.M.; Lee, J.M.; Chen, J.M.; Kobayashi, T. Ultrafast thermoelastic dynamics of HoMnO3 single crystals derived from femtosecond optical pump-probe spectroscopy. New J. Phys. 2011, 13, 053003. [Google Scholar] [CrossRef]
  26. Wang, Y.T.; Luo, C.W.; Kobayashi, T. Understanding Multiferroic Hexagonal Manganites by Static and Ultrafast Optical Spectroscopy. Adv. Condens. Mater. Phys. 2013, 2013, 104806. [Google Scholar] [CrossRef]
  27. Hasegawa, T.; Fujimura, N.; Nakayama, M. Ultrafast dynamics of coherent optical phonon correlated with the antiferromagnetic transition in a hexagonal YMnO3 epitaxial film. Appl. Phys. Lett. 2017, 111, 192901. [Google Scholar] [CrossRef]
  28. Iliev, M.N.; Lee, H.-G.; Popov, V.N.; Abrashev, M.V.; Hamed, A.; Meng, R.L.; Chu, C.W. Raman- and infrared-active phonons in hexagonal YMnO3: Experiment and lattice-dynamical calculations. Phys. Rev. B 1997, 56, 2488–2494. [Google Scholar]
  29. Zeiger, H.J.; Vidal, J.; Cheng, T.K.; Ippen, E.P.; Dresselhaus, G.; Dresselhaus, M.S. Theory for displacive excitation of coherent phonons. Phys. Rev. B 1992, 45, 768–778. [Google Scholar] [CrossRef]
  30. Yan, Y.-X.; Nelson, K.A. Impulsive stimulated light scattering. I. General theory. J. Chem. Phys. 1987, 87, 6240–6256. [Google Scholar] [CrossRef]
  31. Yan, Y.-X.; Nelson, K.A. Impulsive stimulated light scattering. II. Comparison to frequency-domain light-scattering spectroscopy. J. Chem. Phys. 1987, 87, 6257–6265. [Google Scholar] [CrossRef]
  32. Garrett, G.A.; Albrecht, T.F.; Whitaker, J.F.; Merlin, R. Coherent THz Phonons Driven by Light Pulses and the Sb Problem: What is the Mechanism? Phys. Rev. Lett. 1996, 77, 3661–3664. [Google Scholar] [CrossRef] [PubMed] [Green Version]
  33. Gulde, S.; Jochim, S.; Moll, N.; Mahrt, R.F. A pump-and-probe method for the characterization of nonlinear material parameters within Fabry-Pérot microcavities. J. Appl. Phys. 2006, 100, 043112. [Google Scholar] [CrossRef]
  34. Hasegawa, T.; Takagi, Y.; Nakayama, M. Electric field effects on excitonic quantum beats in a single quantum well embedded in a GaAs/AlAs superlattice. Phys. Rev. B 2011, 83, 205309. [Google Scholar] [CrossRef]
  35. Nakayama, M.; Furukawa, Y.; Maeda, K.; Yoshimura, T.; Uga, H.; Fujimura, N. Correlation between the intra-atomic Mn3+ photoluminescence and antiferromagnetic transition in an YMnO3 epitaxial film. Appl. Phys. Express 2014, 7, 023002. [Google Scholar] [CrossRef]
  36. Shigemitsu, N.; Sakata, H.; Ito, D.; Yoshimura, T.; Ashida, A.; Fujimura, N. Pulsed-Laser-Deposited YMnO3 Epitaxial Films with Square Polarization-Electric Field Hysteresis Loop and Low-Temperature Growth. Jpn. J. Appl. Phys. 2004, 43, 6613–6616. [Google Scholar] [CrossRef]
  37. Jin, Z.; Ma, H.; Li, G.; Xu, Y.; Ma, G.; Cheng, Z. Ultrafast dynamics of the Mn3+ d-d transition and spin-lattice interaction in YMnO3 film. Appl. Phys. Lett. 2012, 100, 021106. [Google Scholar] [CrossRef]
  38. Kalashnikova, A.M.; Pisarev, R.V. Electronic Structure of Hexagonal Rare-Earth Manganites RMnO3. JETP Lett. 2003, 78, 143–147. [Google Scholar] [CrossRef]
  39. Choi, W.S.; Kim, D.G.; Seo, S.S.A.; Moon, S.J.; Lee, D.; Lee, J.H.; Lee, H.S.; Cho, D.-Y.; Lee, Y.S.; Murugavel, P.; et al. Electronic structures of hexagonal RMnO3 (R = Gd, Tb, Dy, and Ho) thin films: Optical spectroscopy and first-principles calculations. Phys. Rev. B. 2008, 77, 045137. [Google Scholar] [CrossRef]
  40. Wu, K.H.; Chen, H.-J.; Chen, Y.T.; Hsieh, C.C.; Luo, C.W.; Uen, T.M.; Juang, J.Y.; Lin, J.-Y.; Kobayashi, T.; Gospodinov, M. Marked enhancement of Néel temperature in strained YMnO3 thin films probed by femtosecond spectroscopy. EPL 2011, 94, 27006. [Google Scholar] [CrossRef]
  41. Rai, R.C.; Cao, J.; Musfeldt, J.L.; Kim, S.B.; Cheong, S.-W.; Wei, X. Spin-charge coupling and the high-energy magnetodielectric effect in hexagonal HoMnO3. Phys. Rev. B 2007, 75, 184414. [Google Scholar] [CrossRef]
  42. Hase, M.; Mizoguchi, K.; Nakashima, S. Generation of coherent THz phonons in GeTe ferroelectrics. J. Lumin. 2000, 87–89, 836–839. [Google Scholar] [CrossRef]
  43. Thomsen, C.; Strait, J.; Vardeny, Z.; Maris, H.J.; Tauc, J.; Hauser, J.J. Coherent Phonon Generation and Detection by Picosecond Light Pulses. Phys. Rev. Lett. 1984, 53, 989. [Google Scholar] [CrossRef]
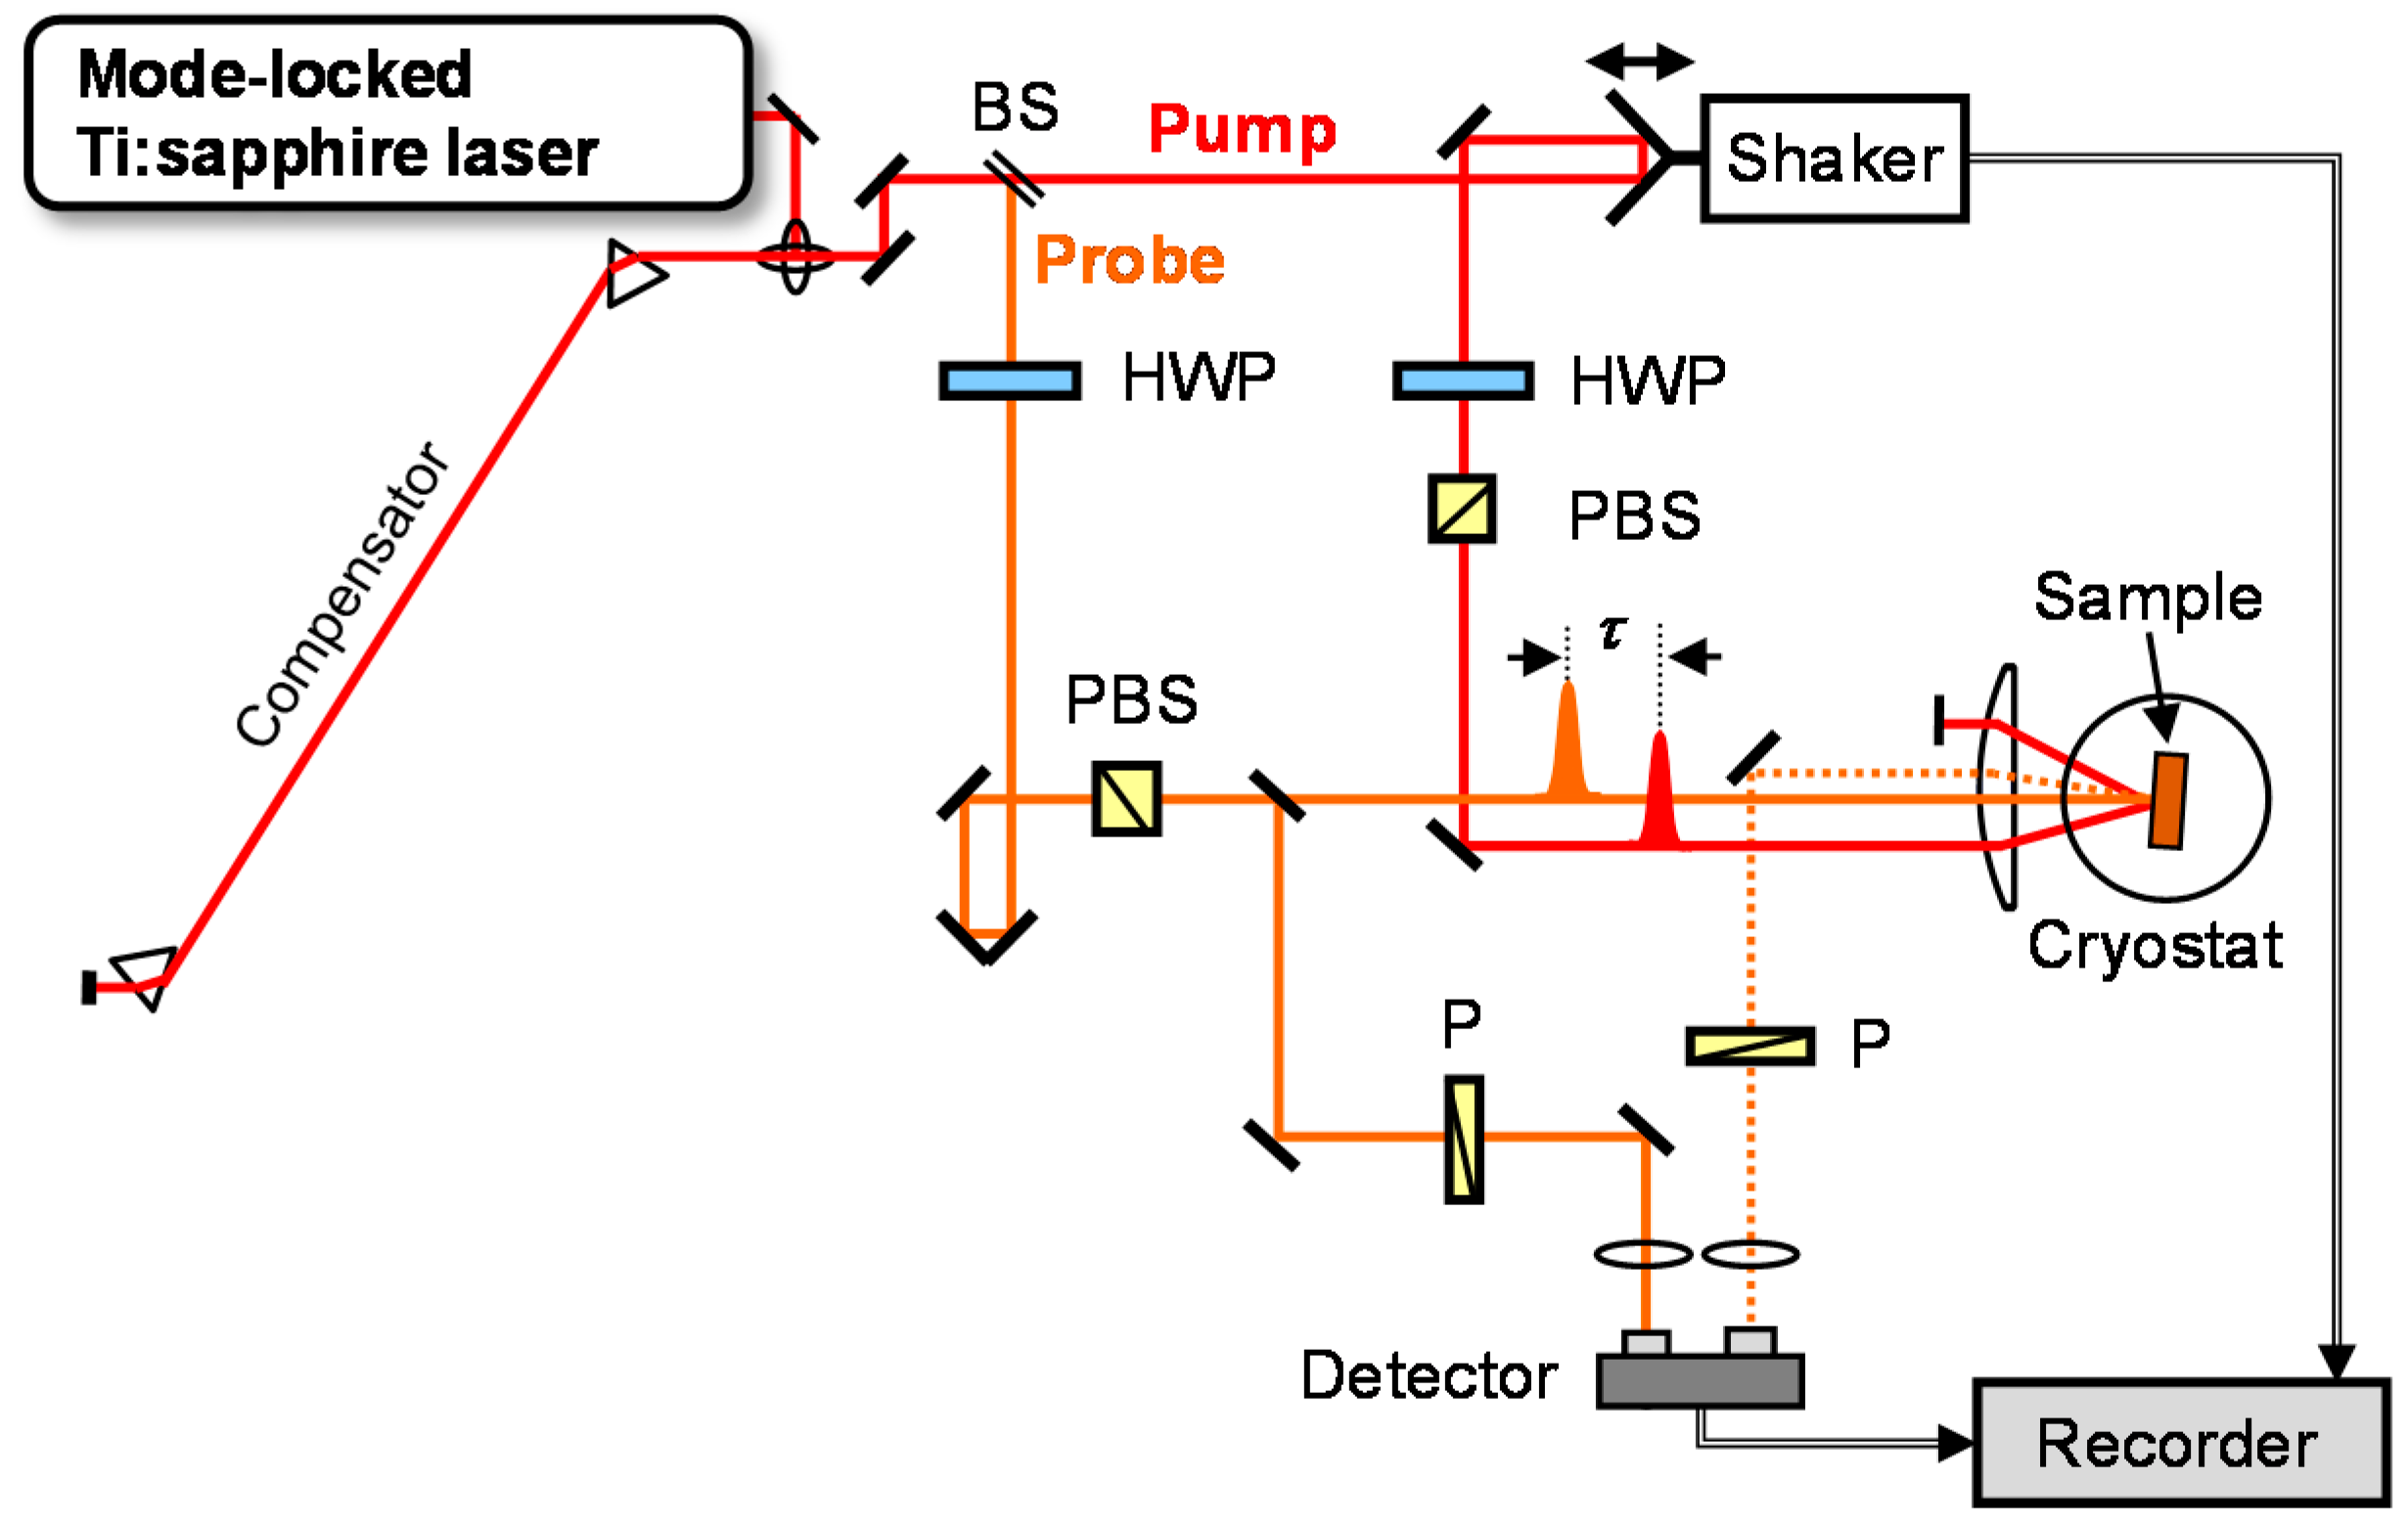
Figure 1. Schematic diagram of the setup for time-resolved reflection-type pump-probe spectroscopy.
Applsci 09 00704 g001
Figure 2. (a) Temperature dependence of the absorption spectrum in the YMnO3 thin film. (b) Peak energy of the absorption band as a function of temperature. The vertical dashed line indicates the Néel temperature.
Applsci 09 00704 g002
Figure 3. (a) Optical conductivity spectra at 6 K and 300 K in a hexagonal HoMnO3 single crystal. The inset shows a fitted result of the spectrum at 6 K considering four components. (b) Peak positions of each component in the inset of (a) as a function of temperature. Colour of the symbol corresponds to that of the component. Open and closed symbols were estimated from different experimental data. Reprinted figures with permission from [41] Copyright (2007) by the American Physical Society.
Applsci 09 00704 g003
Figure 4. (a) ∆R/R0 signal in a LuMnO3 single crystal at room temperature. (b) Oscillatory component of the signal in (a). Reprinted figures with permission from [22] Copyright (2009) by the American Physical Society. (c) Pump power dependence of the ∆R/R0 signal in the YMnO3 thin film at the pump photon energy of 1.72 eV at 10 K.
Applsci 09 00704 g004
Figure 5. (a) ∆R/R0 signals in the YMnO3 thin film at different pump photon energies at the pump power of 20 mW at 10 K. (b) Time-domain oscillatory signals with the subtraction of the fast and slow components.
Applsci 09 00704 g005
Figure 6. (a) Fitted result of the oscillatory signal of Figure 5b at 1.72 eV with 20 mW using a damped harmonic oscillation curve. (b) Pump photon energy dependence of the oscillation amplitude, where the bar indicates FWHM of the spectrum of pump pulses. The dashed curve indicates the absorption spectrum at 10 K. (c) Pump power dependence of the oscillation amplitude. The solid line is the linear fitted result.
Applsci 09 00704 g006
Figure 7. (a) Temperature dependence of the ∆R/R0 signal in the YMnO3 thin film at the pump photon energy of 1.72 eV with 20 mW in the temperature ranges from 10 to 90 K (a) and from 100 to 300 K (b).
Applsci 09 00704 g007
Figure 8. (a) Temperature dependence of the time-domain oscillatory signal extracted from the data in Figure 7. (b) FT power spectra of the time-domain oscillatory signals in (a).
Applsci 09 00704 g008
Figure 9. (a) Peak frequency of the FT spectrum in Figure 8b as a function of temperature, where the bar indicates FWHM of the FT band. (b) Integrated intensity of the FT band as a function of temperature, where the vertical dotted line indicates the Néel temperature. The solid curves in (a,b) are guides to the eye.
Applsci 09 00704 g009
Figure 10. (a) ∆R/R0 signals in the YMnO3 thin film at different pump photon energies at the pump power of 20 mW at 70 K. (b) Time-domain oscillatory signals obtained from (a). The inset indicates the integrated intensities of the FT bands of the oscillatory signals.
Applsci 09 00704 g010
Figure 11. (a) Temperature dependence of the ∆R/R0 signal in a LuMnO3 film. (b) Image map of the temperature dependence of the FT amplitude spectrum of the oscillatory structure in (a) [24]. © IOP Publishing and Deutsche Physikalische Gesellschaft. Reproduced by permission of IOP Publishing. CC BY-NC-SA.
Applsci 09 00704 g011