1. Introduction
Gearboxes are an essential part of a mechanical transmission system. The diagnosis of gear pitting faults has always been an important problem in the industry. In recent years, the development of sensing technology and the improvement of computing power have provided more tools for gear fault diagnosis.
Analysis of vibrational signals is the most common means of monitoring gear conditions. Vibrational signals have been used as a popular input in the diagnosis of gear pitting faults. Camerini et al. [
1] presented an automatic vibration-based program that utilizes health and usage monitoring system data for the early diagnosis of mechanical properties of drivetrain components. There is no general indication of the minimum training collection times required to accurately describe a set of condition indicators, which largely depend on the characteristics of the distribution. Kattelus et al. [
2] found that the vibration acceleration descriptor of the peak signal was related to the pitting of the gear contact. Traditional vibrational signals are significantly affected by the external environment. For example, the statistical vibration acceleration descriptor which indicates the random peak value in the vibration signal is more suitable to indicate the tooth wear than the spectral method. So other sensors are gradually applied to the diagnosis of gear pitting faults. Qu et al. [
3] presented the use of optic fiber sensors to detect the initial gear pitting fault. The results show that the optic fiber Bragg grating signal can effectively detect pitting faults under heavy load conditions. However, when the transmission has high structural stiffness, fiber Bragg gratings (FBGs) performance may be limited by relatively weak strain signals. Acoustic emission (AE) is a non-destructive diagnostic technique. Sharma et al. [
4] took advantage of the Hertz contact method to establish a relationship between the fault/defect size and the AE energy generated during the gear meshing process. The results of the study indicated that if the defect size increases, the AE level also increases. Zhou et al. [
5] compared the AE data with traditional vibration data. The results showed that the AE signals were more sensitive to defect excitation and the background noise was reduced in AE signals. The results of Elasha et al. [
6] showed that AE recognizes defects earlier than vibration analysis, regardless of the tortuous transmission path. The effect of AE could be limited by how close the AE sensor to the defect.
Many methods have been developed for pitting diagnosis of gears. The most representative research is the hidden semi-Markov model [
7]. In general, a hidden semi-Markov model is difficult to train. Therefore, other learning models such as support vector machine (SVM) [
8] and principal components (PCA) [
9] were used. Sanchez et al. [
10] presented a method for detecting 11 kinds of rotating machinery faults by feature sorting method and SVM. Thirty features were calculated from the analysis of the vibration signal and the electromyography. Classification accuracy was 98.7% achieved using SVM. Fan et al. [
11] studied gear tooth surface damage diagnosis based on analyzing the vibration signal of an individual gear tooth. The characteristics of damaged and normal teeth were studied by analyzing their waveforms. The results showed that almost all the damaged teeth were correctly detected by the proposed method, even if there were some misdiagnoses in the identification of the extent of the damage. However, the paper does not explore the exact classification of damage degree. Wang et al. [
12] presented a method for diagnosing the absolute deviation of gear faults. The method used single fault gear broken teeth, pitting corrosion and composite fault gear tooth damage setting dynamics model. The results of different broken teeth were obtained through simulation analysis. This method was to investigate the case of broken teeth, but the authors did not verify the early pitting corrosion of gear. Nevertheless, the above-mentioned methods require much domain expertise and prior knowledge and often rely on hand-crafted features. Often, these methods require a large amount of work in feature extraction.
The use of frequency features of vibration signals for gear fault diagnosis has been common over the past decade. Feng et al. [
13] obtained the amplitude and frequency demodulation spectra by applying the Fourier transform to the amplitude envelope and the instantaneous frequency of the selected sensitive intrinsic mode functions. The planetary gearbox fault was detected based on the features shown in the demodulated spectrum. Although frequency domain features can be directly related to fault type and level, these features are usually abstract representations and require additional pre-processing [
14]. By directly extracting the gear pitting fault signals in the time domain, the calculation cost and the time cost can be saved. Sun et al. [
15] used a backpropagation (BP) neural network to train the gears of four typical fault modes and obtained satisfactory results. The results showed that the BP neural network could effectively perform gear fault diagnosis. These methods can only extract the shallow features for gear fault diagnosis. There are limitations in mining deep features. Fortunately, with the development of deep learning, it is possible to extract fault features directly from the raw signals.
Deep learning has been rapidly developed in recent decades [
16]. Qu et al. [
17] integrated dictionary learning into a stacked autoencoder network for gear pitting fault diagnosis. They applied the sparse autoencoder algorithm to gear fault detection for the first time. Jiang et al. [
18] presented a CNN-based deep learning method that automatically learned effective fault features directly from the raw vibrational signals, and classifies fault types in a single frame to provide a wind turbine gearbox diagnostic system based on end-to-end learning. Under 10ten operating conditions, there were 2600 samples for each health condition, and each sample contained 2000 data points. Jing et al. [
19] used a convolutional neural network (CNN) to learn features directly from the frequency data of the vibrational signal. Feature learning using CNN can provide better results than manual feature extraction. Zhao et al. [
20] presented a local feature-based Gated Recurrent Unit (GRU) network to predict machine conditions. A compact spectral data acquisition instrument was used for signal acquisition with a sampling frequency of 1024 Hz and a sampling window of 512 seconds. The accuracy of gear failure was 95.8%. Dong et al. [
21] presented a method of parallel training depth model, which can train different parts of it at different speeds. By splitting the deep neural network model and training on different devices at different speeds, it can speed up the whole training process. The training accuracy of this method was about 70%. Chen et al. [
22] used four classical deep neural networks to classify and identify fault conditions in the transmission. It was shown that the vibration signal usually contains abundant information for fault detection, control, and maintenance planning of rotating machinery. Sun et al. [
23] used a dual-tree complex wavelet transform to acquire the characteristics of multi-scale signals. The CNN was then used to automatically identify fault features from multi-scale signal features. This method can distinguish 4 kinds of gear faults, but the classification of these 4 kinds of faults is relatively easy. However, the detection of early gear pitting fault was not explained in their paper. Their experimental results of gear fault identification showed the feasibility and effectiveness of the presented method. In a nutshell, the deep learning method has been used in the diagnosis of gear pitting faults and has made certain progress.
Vibration signals have been traditionally used for gear pitting fault diagnosis. Over the years, many signal processing and analysis methods for vibration signals have been developed and matured. Even though it has been reported that AE signals have certain advantages over the vibration signals in early gear fault diagnosis, advanced signal processing and analysis methods for AE signals have not been well developed. Recent development in deep learning provides an excellent opportunity to integrate the AE signals and vibration signals for gear pitting fault diagnosis. In this paper, AE signals are introduced in addition to vibrational signals for gear pitting fault diagnosis. Normally, for the conversion of the time domain signals into the frequency domain signals, additional preprocessing steps are needed. The advantage of deep learning is its capability in dealing directly with the raw signals. In this paper, one-dimensional CNN is integrated with GRU network to process of AE and vibration signals for gear pitting fault diagnosis. The combination of CNN and GRU can effectively utilize their respective advantages and obtain better results for gear pitting fault diagnosis. The method presented in this paper can effectively suppress the over-fitting in gear pitting fault diagnosis. The main contributions of this paper can be summarized as follows:
(1) The method presented in this paper directly uses the raw vibrational and the AE signals to diagnose the gear pitting faults without additional feature extraction processes.
(2) This method integrates CNN with GRU to make full use of their advantages.
(3) The method combines two different kinds of sensor data, the vibration signals and the AE signals, and makes full use of different sensor signal features for gear pitting fault diagnosis.
(4) The method presented in this paper uses less training data to make an accurate diagnosis of gear pitting faults with efficient training time.
The rest of this paper is organized as follows.
Section 2 describes the gear pitting fault diagnosis method presented in this paper. In
Section 3, a description of the experiment setup and the data collected for the validation of the proposed method is provided.
Section 4 analyzes and discusses the results. Finally,
Section 5 concludes the paper.
2. The Methodology
The general procedure of the proposed method for gear pitting fault diagnosis is presented in
Figure 1. The presented method is the integration of the one-dimensional CNN and the GRU network. The CNN is used to process the raw AE signals and the GRU network is used to process the vibration signals. Then the outputs of the CNN will be concatenated with the outputs of the GRU network. Finally, the concatenated outputs will be input into a softmax layer to perform gear pitting fault diagnosis. By using deep learning approaches such as CNN or GRU network, fault features will be extracted automatically while the raw sensor signals are being processed. The outputs coming out from the multiple hidden layers in a deep learning network represents fault features at different abstract levels. The unique contribution of the paper is that it is the first attempt of developing deep learning based approach for gear pitting fault diagnosis with both AE and vibration signals.
2.1. One-Dimensional Convolutional Neural Network
A typical CNN consists of an input layer, an output layer, a convolution layer, and a pooling layer [
24]. The convolution layer performs local feature extraction on the input feature map through the convolution kernel. The further downsampling will be performed by the pooling layer. The main features of CNN are local perception, weight sharing, and pooling. In CNN, the convolutional layer and the pooling layer appear alternately. The principle of the one-dimensional CNN is shown in
Figure 2.
Assuming that the first layer is a convolutional layer, the calculation formula of the one-dimensional convolutional layer is as follow:
where,
is the jth feature map of the lth layer,
represents the activation function, M represents the number of input feature maps,
represents the ith feature map of the
− 1 layer, * represents convolution operation,
represents a trainable convolution kernel, and
represents the jth bias of the lth layer.
With the consideration of the convergence speed and overfitting problem, this paper uses the rectified linear unit (ReLU) activation function. ReLU has a faster convergence rate than the Sigmoid in the gradient descent and can effectively prevent the over-fitting problem. The ReLU activation function is as follow:
After the pooling layer is connected to the convolution layer, the feature map is downsampled according to a certain pooling strategy to obtain a lower resolution feature map. The most commonly used pooling strategy is the maximum pooling. Maximum pooling reduces the number of output nodes and enhances the robustness of the network to input characteristics. The
+1th layer is the pooling layer. It is calculated as follow:
where, down (·) is a downsampling function.
2.2. Gated Recurrent Unit Network
GRU network is the optimized structure of the recurrent neural network (RNN) [
25]. However, when the input information is increased to a certain length, the RNN cannot connect to the relevant information. GRU network is aimed at solving the problem of long-range dependence and gradient disappearance of RNN. The GRU neural network with less threshold structure and better efficiency is directly selected for the diagnosis of gear pitting fault. Note that similar to GRU, a recurrent unit in RNN called long short term memory (LSTM) can also be used. Both LSTM and GRU have the same goal of tracking long-term dependencies effectively while mitigating the vanishing/exploding gradient problems. As pointed in Chung et al. [
26], after evaluating LSTM and GRU units on the tasks of polyphonic music modeling and speech signal modeling, they found GRU to be comparable to LSTM. Therefore, the GRU is used in this paper as a recurrent unit the same as LSTM. For this reason, it is expected that LSTM will give similar results as GRU.
RNNs are widely used in the field of natural language processing. Unlike traditional feedforward neural networks, RNN introduces directional loops that can handle correlated inputs. As so, it can be used to process sequence data. The basic structure of an RNN is shown in
Figure 3. In
Figure 3,
x,
h, and
s represent the input, output, and hidden states, respectively.
U,
V, and
W represent the weight matrix between the input and hidden layers, hidden layers and outputs, and the hidden layers, respectively.
The GRU unit specific update process is as follow: First, the two gates in the GRU that control the direction of the data flow are r and z. The update gate model in the GRU neural network is calculated in Equation (4):
In Equation (4), the represents the update gate, represents the output of the previous neuron, represents the input of the current neuron, represents the weight of the update gate, represents the weight of the current neuron, and σ represents the sigmoid function. The update gate is operated by and , and then it uses the sigmoid function to process. For the update gate , when the value is larger, more information in the previous neuron will be retained. If is close to 1, it is equivalent to copying the previous hidden layer information to the current layer. It can learn long distance dependence.
The reset gate model in the GRU neural networks is calculated in Equation (5):
In Equation (5), represents the reset gate, represents the output of the previous neuron, represents the input of the current neuron, represents the weight of the reset gate, represents the weight of the current neuron, and σ represents the sigmoid function. The reset gate r is operated by and , and then it uses the sigmoid function to process. For the reset gate, when its value is 0, it means to discard the information from the previous neuron.
The output value of the GRU hidden layer is in Equation (6):
In Equation (6), represents the output value to be determined in this neuron, represents the output of the previous neuron, represents the input of the current neuron, represents the weight of the update gate, and represents the hyperbolic tangent function. is used to control how much memory needs to be retained.
Finally,
controls how much information is forgotten from the hidden layer at the previous layer and how much hidden layer information
of the current layer needs to be added. Finally,
is obtained in Equation (7), and the hidden layer information of the last output is directly obtained.
In Equation (7), if the value of is 1 and the value of is 0, the GRU unit is equivalent to a standard RNN, which can handle short-range dependencies.
3. Gear Test Experimental Setup and Data Processing
Raw AE signals and vibration signals collected from gear pitting fault experiments were used to validate the effectiveness of the presented method for the diagnosis of gear pitting faults. The experiments were carried out on a gearbox test rig. The raw vibrational signals and AE signals of seven different gear pitting conditions were collected during the experiments. The gearbox test rig is shown in
Figure 4. It consists of two 45 kW Siemens servos, one of the servos is the driving motor, and the other is the loading motor. An acceleration sensor and an AE sensor were mounted on the surface of the gearbox housing. The main parameters of the gearbox are shown in
Table 1.
The gear speed was set to 1000 RPM, and 100 Nm torque was used in the experiments. The vibrational signals were collected with a sampling rate of 10.24 kHz. The AE signals were collected with a sampling rate of 51.2 kHz.
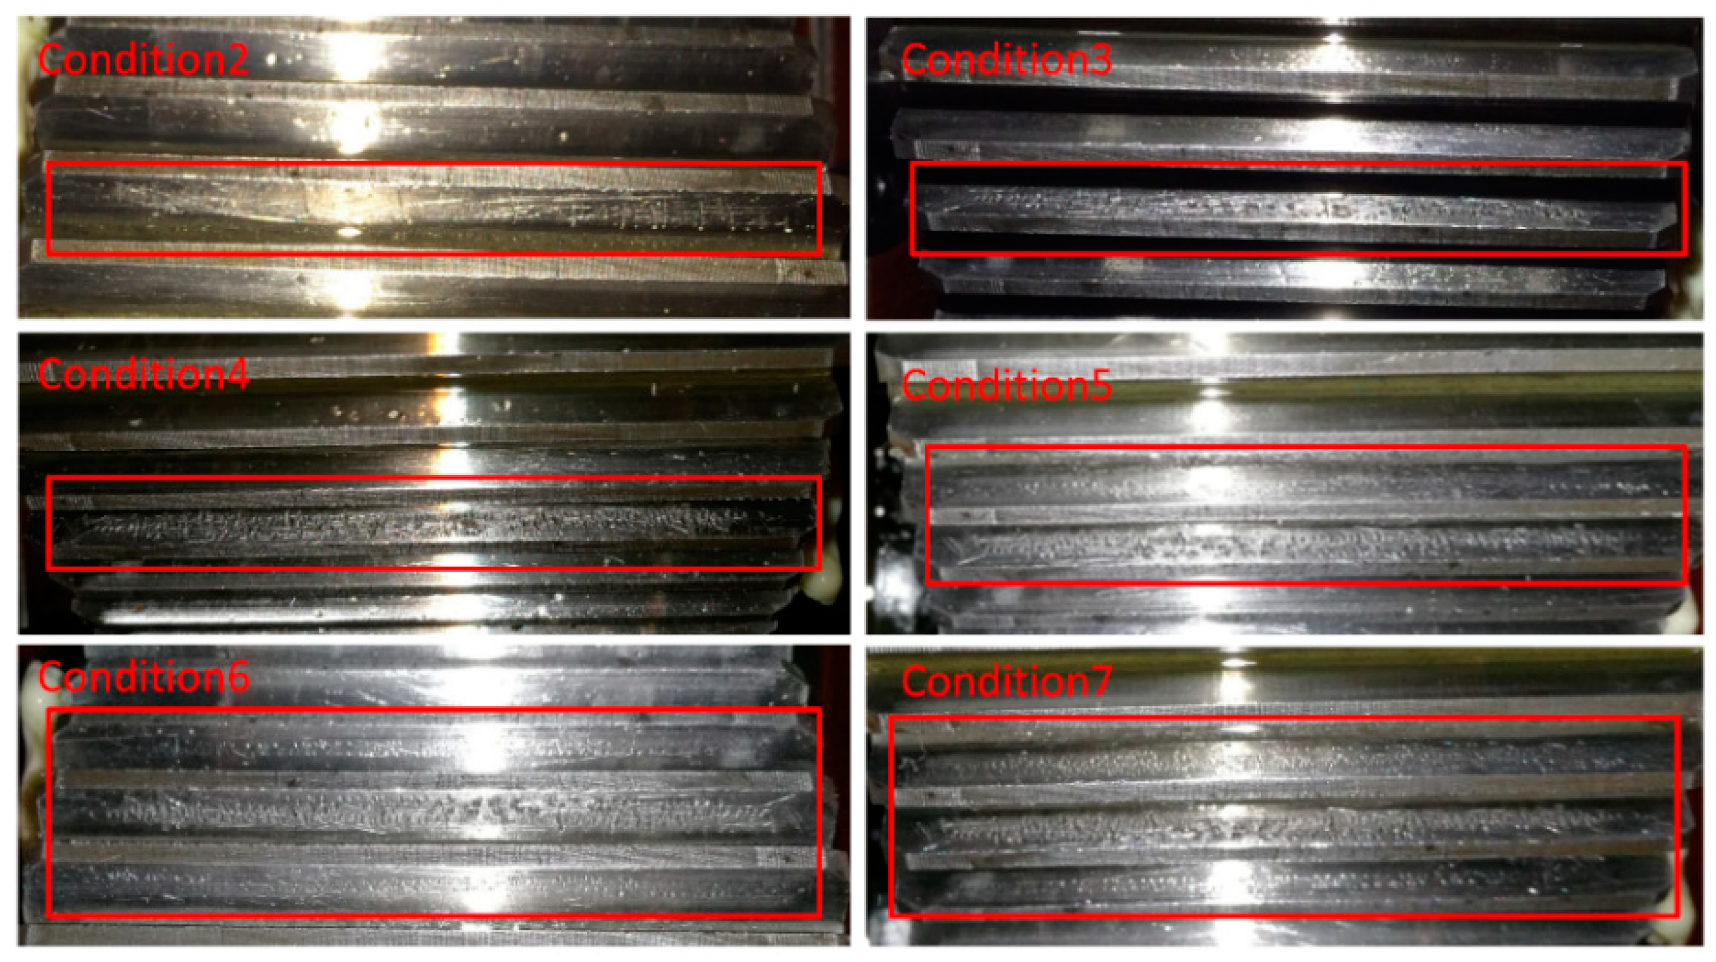
Table 2 shows the seven gear pitting conditions. Condition 1 represents a normal gear. In Condition 2, the pitting is about 10% of the area of a middle tooth, and the adjacent two teeth are normal. Condition 3 has a pitting of about 30% of the area of the middle gear tooth, and the adjacent two teeth are normal. Under Condition 4, the middle gear tooth pitting is about 50% of the area, and the adjacent two teeth are normal. Under Condition 5, the middle gear tooth pitting is about 50% of the area, the upper tooth pitting is about 10% of the area, and the lower tooth is normal. Under Condition 6, the pitting of the middle gear tooth is about 50% of the area, and the adjacent two teeth pitting is about 10% of their area. Under condition 7, the middle gear tooth pitting is about 50% of the area, upper tooth pitting is about 30% of the area, and the lower tooth pitting is about 10% of the area.
Figure 5 shows pictures of the gear pitting degree under each pitting condition.
The sample raw vibrational signals of the gears are shown in
Figure 6. As shown in
Figure 6, Conditions 1 and 3 have relatively distinct spikes and show slightly different from the remaining five vibrational signals. The raw vibration signals of the remaining five conditions are not significantly different.
The sample AE signals of gears are shown in
Figure 7. As can be seen from
Figure 7, there are no significant differences among raw AE signals of the seven conditions. It is almost impossible for the naked eye to distinguish the difference in the pitting conditions of the gears from the AE signals.
The number of samples for the vibration data/ AE data under each condition was 1000, with 800 for training set, 150 for validation, and 50 for testing. Each condition had the same number of samples. The CNN was connected using 4 convolutional layers, which was an arbitrary choice based on the experience. The number of channels in each layer was set 32, 64, 128, and 128, respectively. The kernel size of all convolutional layers was set as 7 and stride as 1. Padding took ‘Same padding’ in order to maintain the same data size. The pool size was set as 2 for all the pooling layers. For pooling, the strides were set as none and padding as ‘valid’. The AE signals used in the CNN contained 3072 features per sample. The GRU network used 6 stacked GRUs for training. The cell size of each GRU layer was set as 256, 256, 128, 128, 64, and 64, respectively. The vibrational signals used in the GRU network contained 616 features per sample. The batch size was set as 256. Both kernel initializer and recurrent initializer used the he-normal [
25] method. The loss function was set as categorical cross-entropy. A stochastic gradient descent algorithm was used as the optimizer. Except for the last layer, the ReLU function was used as the activation function for the layers. In the last layer, a softmax function was used to classify gear pitting faults. An NVIDIA GeForce GTX 1080 Ti graphics card was used in the PC for training purpose. The general procedure of the data processing using the presented method is shown in
Figure 8.
4. Results and Discussions
The validation results are provided in
Table 3. It can be shown from
Table 3 that if the CNN with AE signals were used to diagnose the gear pitting faults, high diagnostic accuracy would be obtained for training. Although the accuracy of the training is very high, the method has a serious overfitting phenomenon, and as a result, the accuracy of the testing is as low as 74.57%. Using the same CNN with AE signals and GRUs with vibration signals, not only good training and verification results were obtained, but also accurate gear pitting fault diagnosis results of 98.29% were obtained for testing. The results show that in comparison with other methods, the method presented in this paper can obtain diagnostic results more effectively.
The results in
Table 3 indicate that using the combination of CNN with AE signals and GRU with vibration signals or the combination of CNN with vibration signals and GRU with AE signals gave more accurate results than the following three methods: (1) using CNN with both vibration and AE signals, (2) using CNN with vibration signals alone, and (3) using CNN with AE signals alone. For other methods in
Table 3, the followings are the discussions regarding why some methods could not achieve a good gear pitting fault diagnosis accuracy. For the GRU network with vibration signals alone, it might be because the vibration signals were greatly interfered by the background noises, and the GRU has the ability to memorize the signals and hence possibly retain the noisy features. So the atypical feature of the received interference was regarded as a typical feature of the gear pitting faults. As a result, it might affect its effectiveness. For the GRU network with AE signals alone, since the sampling frequency of the AE signals is much than higher than the vibration signals, the sampled data of the AE signals was huge. In order to process the AE signals efficiently using the GRU network, the AE signal data was down sampled. So the data was partially distorted. As a result, the accuracy of the gear pitting fault diagnosis was low.
In
Table 4, the gear pitting fault diagnosis accuracies for each pitting fault condition obtained by the proposed method and other methods are provided.
From
Table 4, the method presented in this paper can achieve 100% diagnosis accuracy for five gear pitting fault conditions. For the other two gears, the pitting diagnosis accuracy reached 94%. In comparison with other methods in
Table 4, the presented method gives much better results than the last 4 methods in
Table 4 when only one type of signals is used. In comparison with the second and the third methods in
Table 4, the performance of the presented method is slightly better.
The method presented in this paper uses CNN to process AE data and GRU network to process vibration data. The reason is that the sampling frequency of the AE sensor is about 5 times of the vibration sensor. The number of features extracted from the AE signals is larger than that of the vibration signals. As discussed in
Section 2 in this paper, the number of the parameters of a CNN is relatively small, and the number of the parameters of the GRU network is relatively large. Hence, it is computationally beneficial to use CNN to process a relatively larger volume of AE data and GRU network to process the relatively small volume of vibration data. If the GRU network is used to process the relatively larger volume of the AE data, the dimensionality of the data has to be reduced. The reduction of the dimensionality may result in loss of effective diagnostic information. Therefore, the method proposed in this paper that uses CNN to process the AE signals and the GRU network to process the vibration signals gives the best gear pitting fault diagnosis performance.
To test the robustness of the proposed method for gear pitting fault diagnosis under different loading conditions, the diagnosis results were obtained by the proposed method at a constant speed of 1000 rpm with different loads and are provided in
Table 5. To obtain the results in
Table 5, the hyperparameters of the CNN and GRU network remain the same as those used for obtaining the results in
Table 3. From
Table 5, it can be seen that the training accuracy can reach 100% for all the loads. Since the accuracy results for the training are not significantly different from those for testing, there is not an over-fitting phenomenon for the results in
Table 5. The accuracy of the testing is all above 94.86%, achieving a good gear pitting fault diagnosis result. The loss in each case is very low. As can be seen from
Table 5, the training time in each case is not far away from the average of 838 s. As the load increases, there is an indication of a pattern of changes in fault diagnosis accuracy. This result shows that the performance presented method remains stable under different loads and shows the robustness and adaptability of the method for gear pitting fault diagnosis.
It is well known that among all the parameters of deep learning, the learning rate is one of the most critical parameters. It has a great influence on the effect of the model. In order to test the effect of learning rate on the gear pitting fault diagnosis performance of the presented method, 20 different learning rates with an increment of 0.1 were tested. The testing results are provided in
Table 6.
As shown in
Table 6, in the range from 0.4 to 2.3, it can be seen that a training accuracy of 100% was obtained for all the tested learning rates. The validation accuracy is all above 95.3%, and the standard deviation was computed as 0.0093. The testing accuracy is above 93.3%, and the standard deviation was computed as 0.0056. It can be seen from
Table 6 that the training loss is small for 20 tested learning rates. The average training time is about one thousand seconds. In summary, the presented method has a good performance for a large span of learning rate. This result once again verifies the effectiveness and robustness of the presented method for gear pitting fault diagnosis.
The confusion matrix of the obtained results is provided in
Figure 9. As can be seen from
Figure 9, the classification accuracy is 100% except for Condition 2 and Condition 6. 3 cases of Condition 2 were incorrectly diagnosed as Condition 6. Coincidentally, 3 cases of Condition 6 were incorrectly diagnosed: two as Condition 2 and one as Condition 7. The proposed method is accurate in classifying the gear pitting faults.
To show the effectiveness of the concatenated features obtained by CNN to extract features from AE signals and GRU network to extract features from vibration signals, samples for t-SNE visualization were processed. The 3D result of the t-SNE visualization is shown in
Figure 10. The 2D result of the t-SNE visualization is shown in
Figure 11. It can be seen from the two figures that the concatenated features of the seven gear pitting conditions were accurately clustered. The clear clusters formed by the concatenated features obtained by the proposed method shown in 3D and 2D pictures indicate the effectiveness of the proposed method for extracting features from the AE and vibration signals for gear pitting fault diagnosis.
Future research will include extending the developed method into fault diagnosis of other rotating components such as bearings involving multiple heterogeneous sensor signals such as motor current, torque, strain gauge, vibration, and AE signals. The future research will also include investigation of the influence of noise and other external environmental conditions on the sensor signals and consequently to their method of effective measurement. Testing with a much larger set of samples should be investigated in the future research.


