Article

Packing Characteristics of Aggregate with Consideration of Particle size and Morphology

1
Beijing Key Laboratory of Traffic Engineering, Beijing University of Technology, 100 Pingleyuan, Chaoyang District, Beijing 100124, China
2
National Center for Materials Service Safety, University of Science and Technology Beijing, 30 Xueyuan Road, Haidian District, Beijing 100083, China
3
Department of Civil and Environmental Engineering, Virginia Tech, Blacksburg, VA 24061, USA
*
Author to whom correspondence should be addressed.
Appl. Sci. 2019, 9(5), 869; https://doi.org/10.3390/app9050869
Submission received: 21 January 2019 / Revised: 22 February 2019 / Accepted: 22 February 2019 / Published: 28 February 2019
(This article belongs to the Section Civil Engineering)

Abstract

:
The packing characteristics of aggregates are very important for aggregate blend design, which is closely related to the performance of mixtures. In this study, an indoor packing experiment was designed to investigate the behaviors of single-size particle packing and two-size particle packing. The effects of particle composition, particle size and size ratio, particle morphology on packing characteristics were also evaluated. Two kinds of aggregates (crushed stone and gravel) with significant morphological differences were selected for the test. The angularity of the aggregates was quantitatively analyzed using the variance of mean curvature ( S C m 2 ) of particle surface in accordance with the 3-D scanning measurements. Based on the test results, the packing characteristics of aggregates were analyzed using the air void content (Va) and the packing function index (Ipf) proposed in this paper. It is shown that the analysis results of packed ideal spheres cannot be directly used to describe the packing characteristics of aggregates. Particle morphology has a significant impact on packing characteristics, especially on the Va. The Va of packed aggregates with poor angularity is significantly smaller than that with good angularity. Ipf can be used to quantitatively distinguish the packing function of particles. The test results show that the packing function of particles cannot be simply divided into the skeleton building and air voids filling. Generally, the particles in packed blend have both of these functions. The packing function of particles depends not only on the particle size, but also on the composition of particles with different size. When the size ratio and volume ratio are the same, the packing characteristics of the two-size particle blends will still change with the change of the particle size. The exploration of packing behaviors of single- size and two- size particle aggregates is helpful for analyzing the packing behaviors of blends with multi-size particles.

1. Introduction

The volume parameters of asphalt mixtures are always considered to be important design indicators in various design methods, which have significant impacts on the mechanical performances of asphalt mixtures [1,2,3,4]. Around 85% of the volume of hot mix asphalt is made of aggregates [5]. The aggregates with specific packing state construct the skeleton of the asphalt mixture and determine the ranges of volume parameters. Therefore, it is important to understand the packing characteristics of aggregates for blend design.
In current asphalt mixture design, the evaluation of the packing structure mainly depends on the indoor packing test and macro volume parameter analysis. These evaluation methods often rely on the geometric packing models of spheres, such as the Bailey method, which was developed from a two-dimensional geometric packing model of sphere [6]. In 2014, Yideti et al. [7] built a performance evaluation framework of graded macadam materials based on packing theory. There are some limitations in the application of the geometric packing models of spheres on the analysis of the packing characteristics of a mineral mixture. Studies show that the packing characteristics of different geometries are significantly different, for both regular packing and random packing [8,9,10]. Mineral particles are not ideal spheres. On the other hand, the interactions between particles are not considered in the geometric packing model, which is also an important factor affecting the packing characteristics of mineral aggregates.
By designing a series of combined packing experiments with different particle sizes, many researchers have carried out comparisons on packing characteristics of different aggregate gradations and explored the way to optimize mineral composition [11,12,13]. Miao et al. [14] defined the percentage of contribution to the packing volume (PCPV) index, and designed a packing test to quantify PCPV. Two-dimensional or three-dimensional images obtained from solid specimens is another way to study the packing characteristics of mineral materials. Using cross-sectional photography or X-ray CT scanning to obtain cross-sectional images is a basic approach in two-dimensional image research [15,16,17]. Reconstructing the three-dimensional meso-structure of the specimen using the X-ray CT scanning method is the basis for research in three-dimensional analysis [18,19,20]. For example, R. Al-Raoush (2007) [19] analyzed the distribution of particle centroid and size, coordination number (contact points), and some other micro-structural characteristics using the 3-D images.
Some researchers used computer simulation to analyze the packing characteristics of mineral materials. In 1999, P. Stroeven et al. [21] used self-developed software to simulate the random packing of multi-size spheres. In 2010, K. Sobolev et al. [22] used a genetic algorithm to simulate the dense packing of cement concrete aggregate. In 2011, Shen et al. [23] used the DEM method to carry out packing analysis of multi-size spheres. In 2013, Xu et al. [24] analyzed the effect of particle shape and particle size distribution on the microstructure of fresh cement slurry by packing it with a virtual random sequence. In the same year, Xu et al. [25] also analyzed the influences of particle shape, size distribution, and volume ratio on wall effect of concrete. In 2014, Liu et al. [26] studied the influence of aggregate particle shape on the diffusion properties of mortar using random packing analysis. In the same year, Boler et al. [27] simulated the packing of railway ballast by using the three-dimensional DEM program (BLOKS3D), and analyzed the influence of particle size distribution and particle shape on the packing characteristics. In 2016, Han et al. [28] constructed digital specimens of multi-size spherical and square particles using a variety of algorithms. In the same year, Ma et al. [29] proposed a method to construct digital specimens of meso-structure of fully graded cement concrete. Xiao et al. [30] used the three-dimensional DEM program BLOKS3D to analyze the contact force between particles in granular materials.
The current studies of indoor laboratory test, image analysis [31,32,33], computational simulation [34,35,36], modification test [37,38], and performance evaluation [39,40,41] on most aggregate materials and asphalt-based materials are focused on the characteristics of a given mixture. For the mineral mixtures, some studies have also carried out comparisons on the packing characteristics of packed aggregate blends with different composition. These research results have deepened the understanding of packing characteristics of aggregate blends to a certain extent, but have not yet formed a unified framework for packing characteristics analysis. In this paper, considering particle morphology, particle size and combination, the indoor single-size and two-size particles packing test was designed, and the basic law of aggregate packing behavior was analyzed. It is hoped that this study will be beneficial to the construction of a framework for aggregate packing characteristics analysis.

2. Aggregates and Test Design

2.1. Aggregates

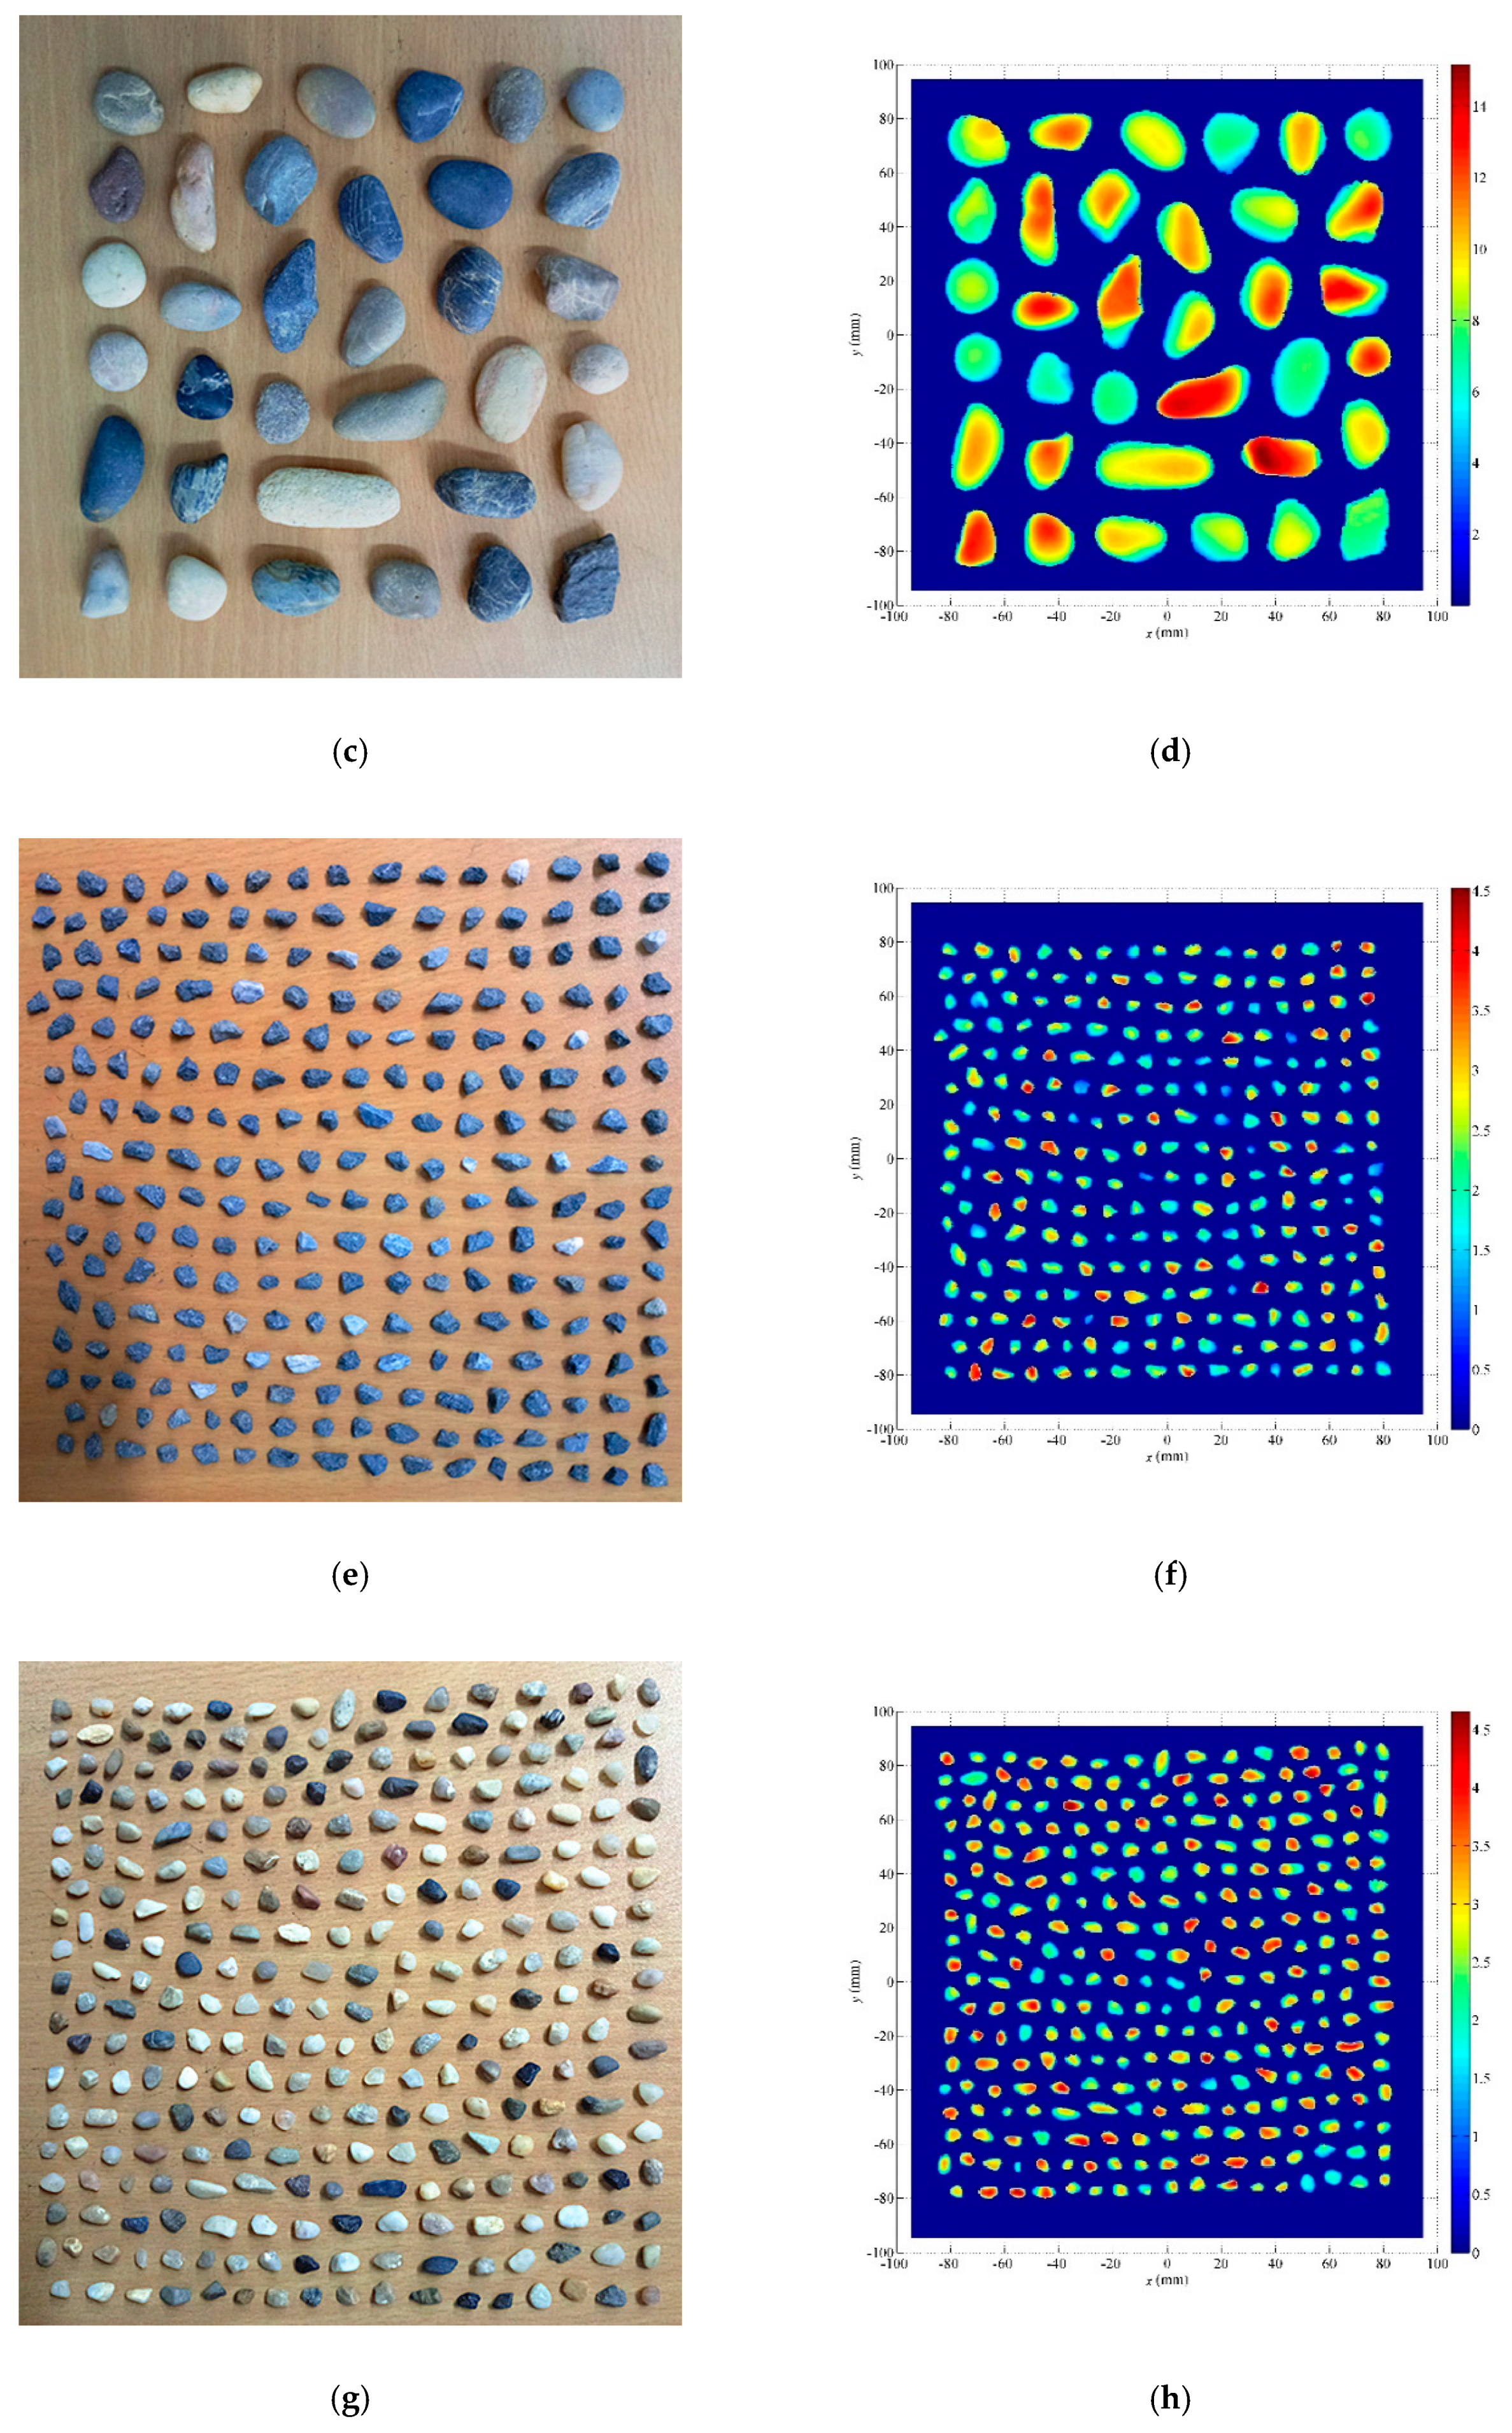
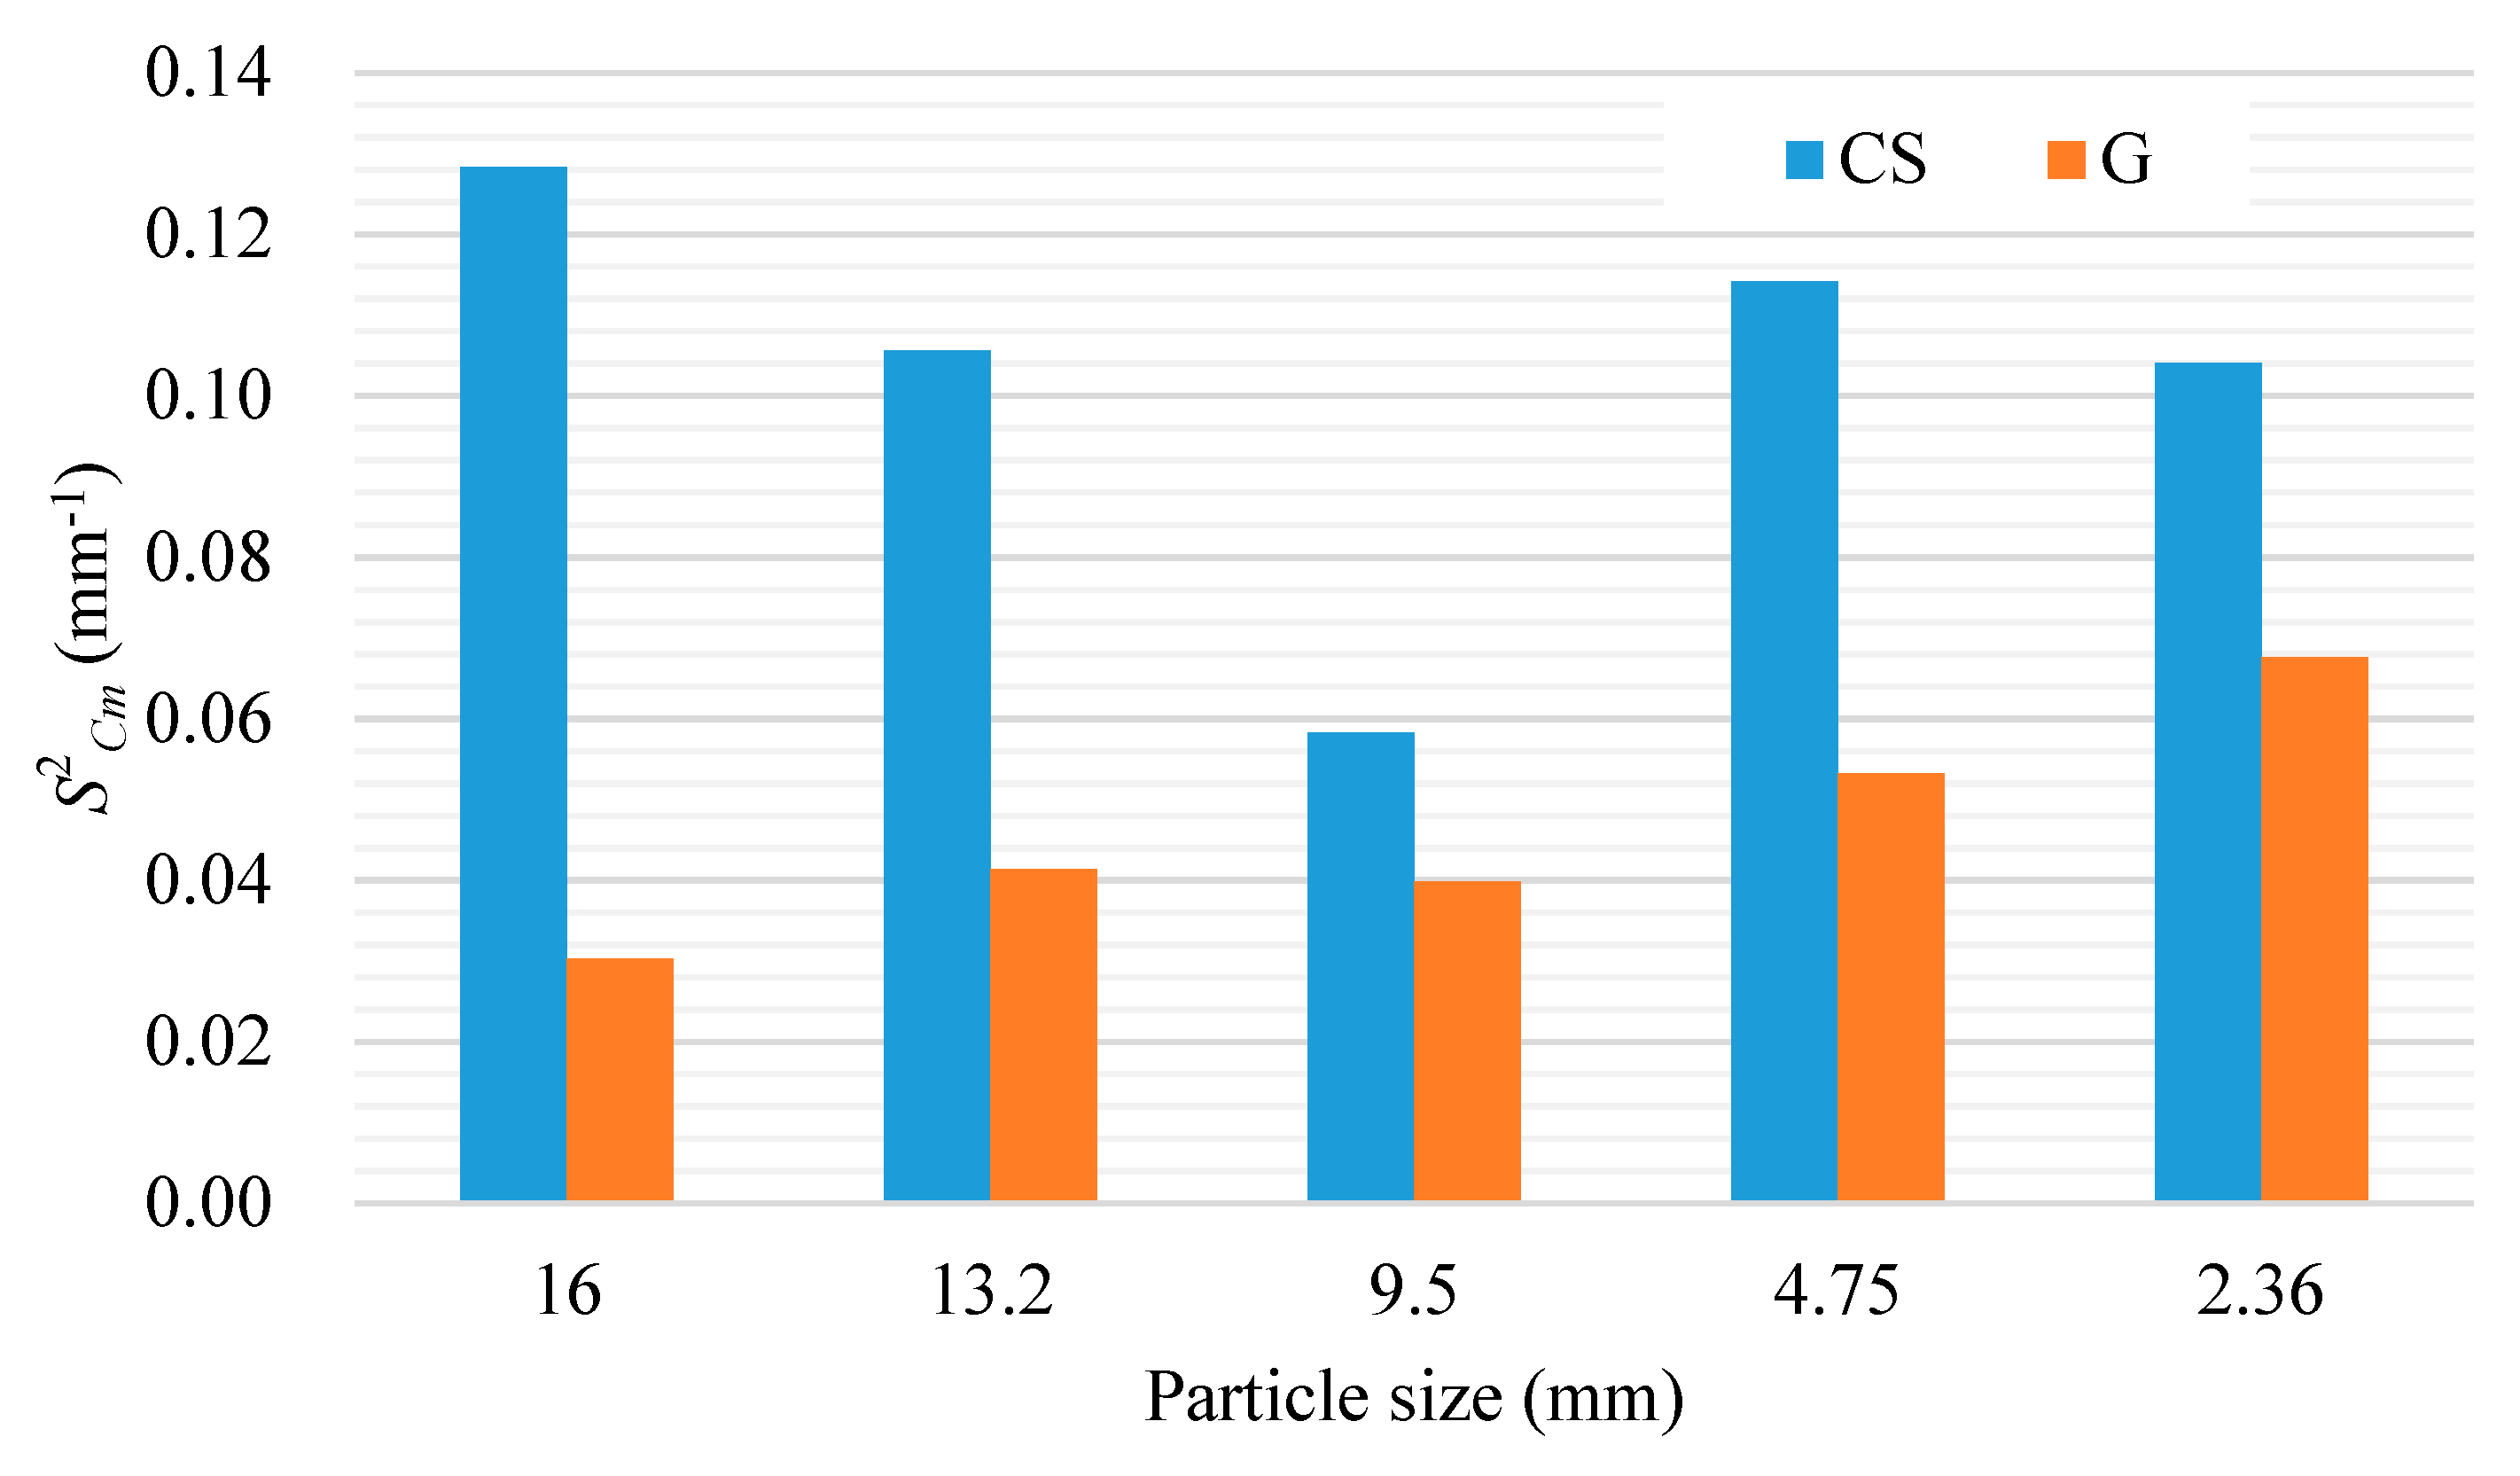
Two kinds of typical aggregates with different morphological characteristics were used to investigate the effects in this study. The crushed stone and manufactured sand were selected as aggregates with good angularity, denoted as crushed stone (CS), and the gravel and natural sand were selected as aggregates with poor angularity, denoted as gravel (G). The change of particle surface curvature can quantitatively reflect the angularity of particles. In order to quantitatively investigate the difference of angularity between crushed stone and gravel particles, 3-D scanning method [42] was used to scan particles with sizes of 2.36 mm and above. The one side 3-D images of particles with sampling interval of 0.5 mm in two horizontal directions were obtained. Figure 1 shows the typical particles and the corresponding 3-D scanning results. The curvature of a point on a 3-D surface is a direction-dependent parameter. In this paper, the average value of the maximum curvature and the minimum curvature at a point is taken as its mean curvature. The average curvature ( C m ) of given point on surface T: f (x,y) can be calculated by Equation (1) [43]. The surface function of can be obtained by local quadratic polynomial fitting. Equation (2) can be used to calculate the variance of mean curvature ( S C m 2 ) of the surface of each particle. In this paper, S C m 2 is used to characterize the angularity of aggregates. Figure 2 shows the comparisons of S C m 2 between crushed stone and gravel with different particle sizes.
C m = ( 1 q 2 ) r 2 p q s + ( 1 + p 2 ) t 2 ( 1 + p 2 + q 2 ) 3 2
where p = f x , q = f y , r = 2 f x 2 , s = 2 f x y , and t = 2 f y 2 .
S C m 2 = 1 n 1 i = 1 n ( C m i C m ¯ ) 2
where
C m ¯ = 1 n i = 1 n C m i
The mechanical properties of the aggregate were determined according to “Test Methods of Aggregate for Highway Engineering (JTG E42-2005)” of China [44]. Table 1 lists the bulk density values of the aggregates with different size.

2.2. Test Design

There are many factors affecting the packing behavior of aggregate blends. In this study, the analysis of the packing behavior of blends with single-size and two-size particles was conducted to understand the influence of particle composition, particle size, particle shape, and other factors, which is helpful for future studies on packing behavior of aggregate blends with multi-size particles. The test was designed with consideration of the following aims:
(1)
The characteristics of single-size packing and the size effect;
(2)
The characteristics of two-size packing and the effects of size and size ratio;
(3)
The effect of particle morphology on the packing characteristics of single-size and two-size packing.
Aggregates with different particle sizes and morphology were selected to perform single-size packing (SSP) tests using the loose and dry-rodded packing tests. The packing state of SSP is unitary for the particles that have the same packing function (for skeleton building). The air void content, Va, is employed to quantify the SSP characteristics. The relative difference of Va between loose and dry-rodded tests is defined in Equation (4) for quantifying the effects of packing method. The relative difference of Va between crushed stone and gravel is also defined (Equation (5)) to understand the effects of particle morphology.
R D V a L R = V a L V a R V a L
where V a L is the Va derived from the loose packing test, and V a R is the Va derived from the dry-rodded packing test.
R D V a C S G = V a C S V a G V a C S
where V a C S is the Va of packed crushed stone particles, and V a G is the Va of packed gravel particles.
Two-size packing (TSP) tests were performed with consideration of different size ratios, maximum particle sizes, and particle morphologies using the loose and dry-rodded packing tests. In each TSP test, the mass ratio of the smaller to the bigger was gradually changed from 0 to 1 for investigating the packing function of each size particle. Table 2 lists all the combinations of the TSP test.
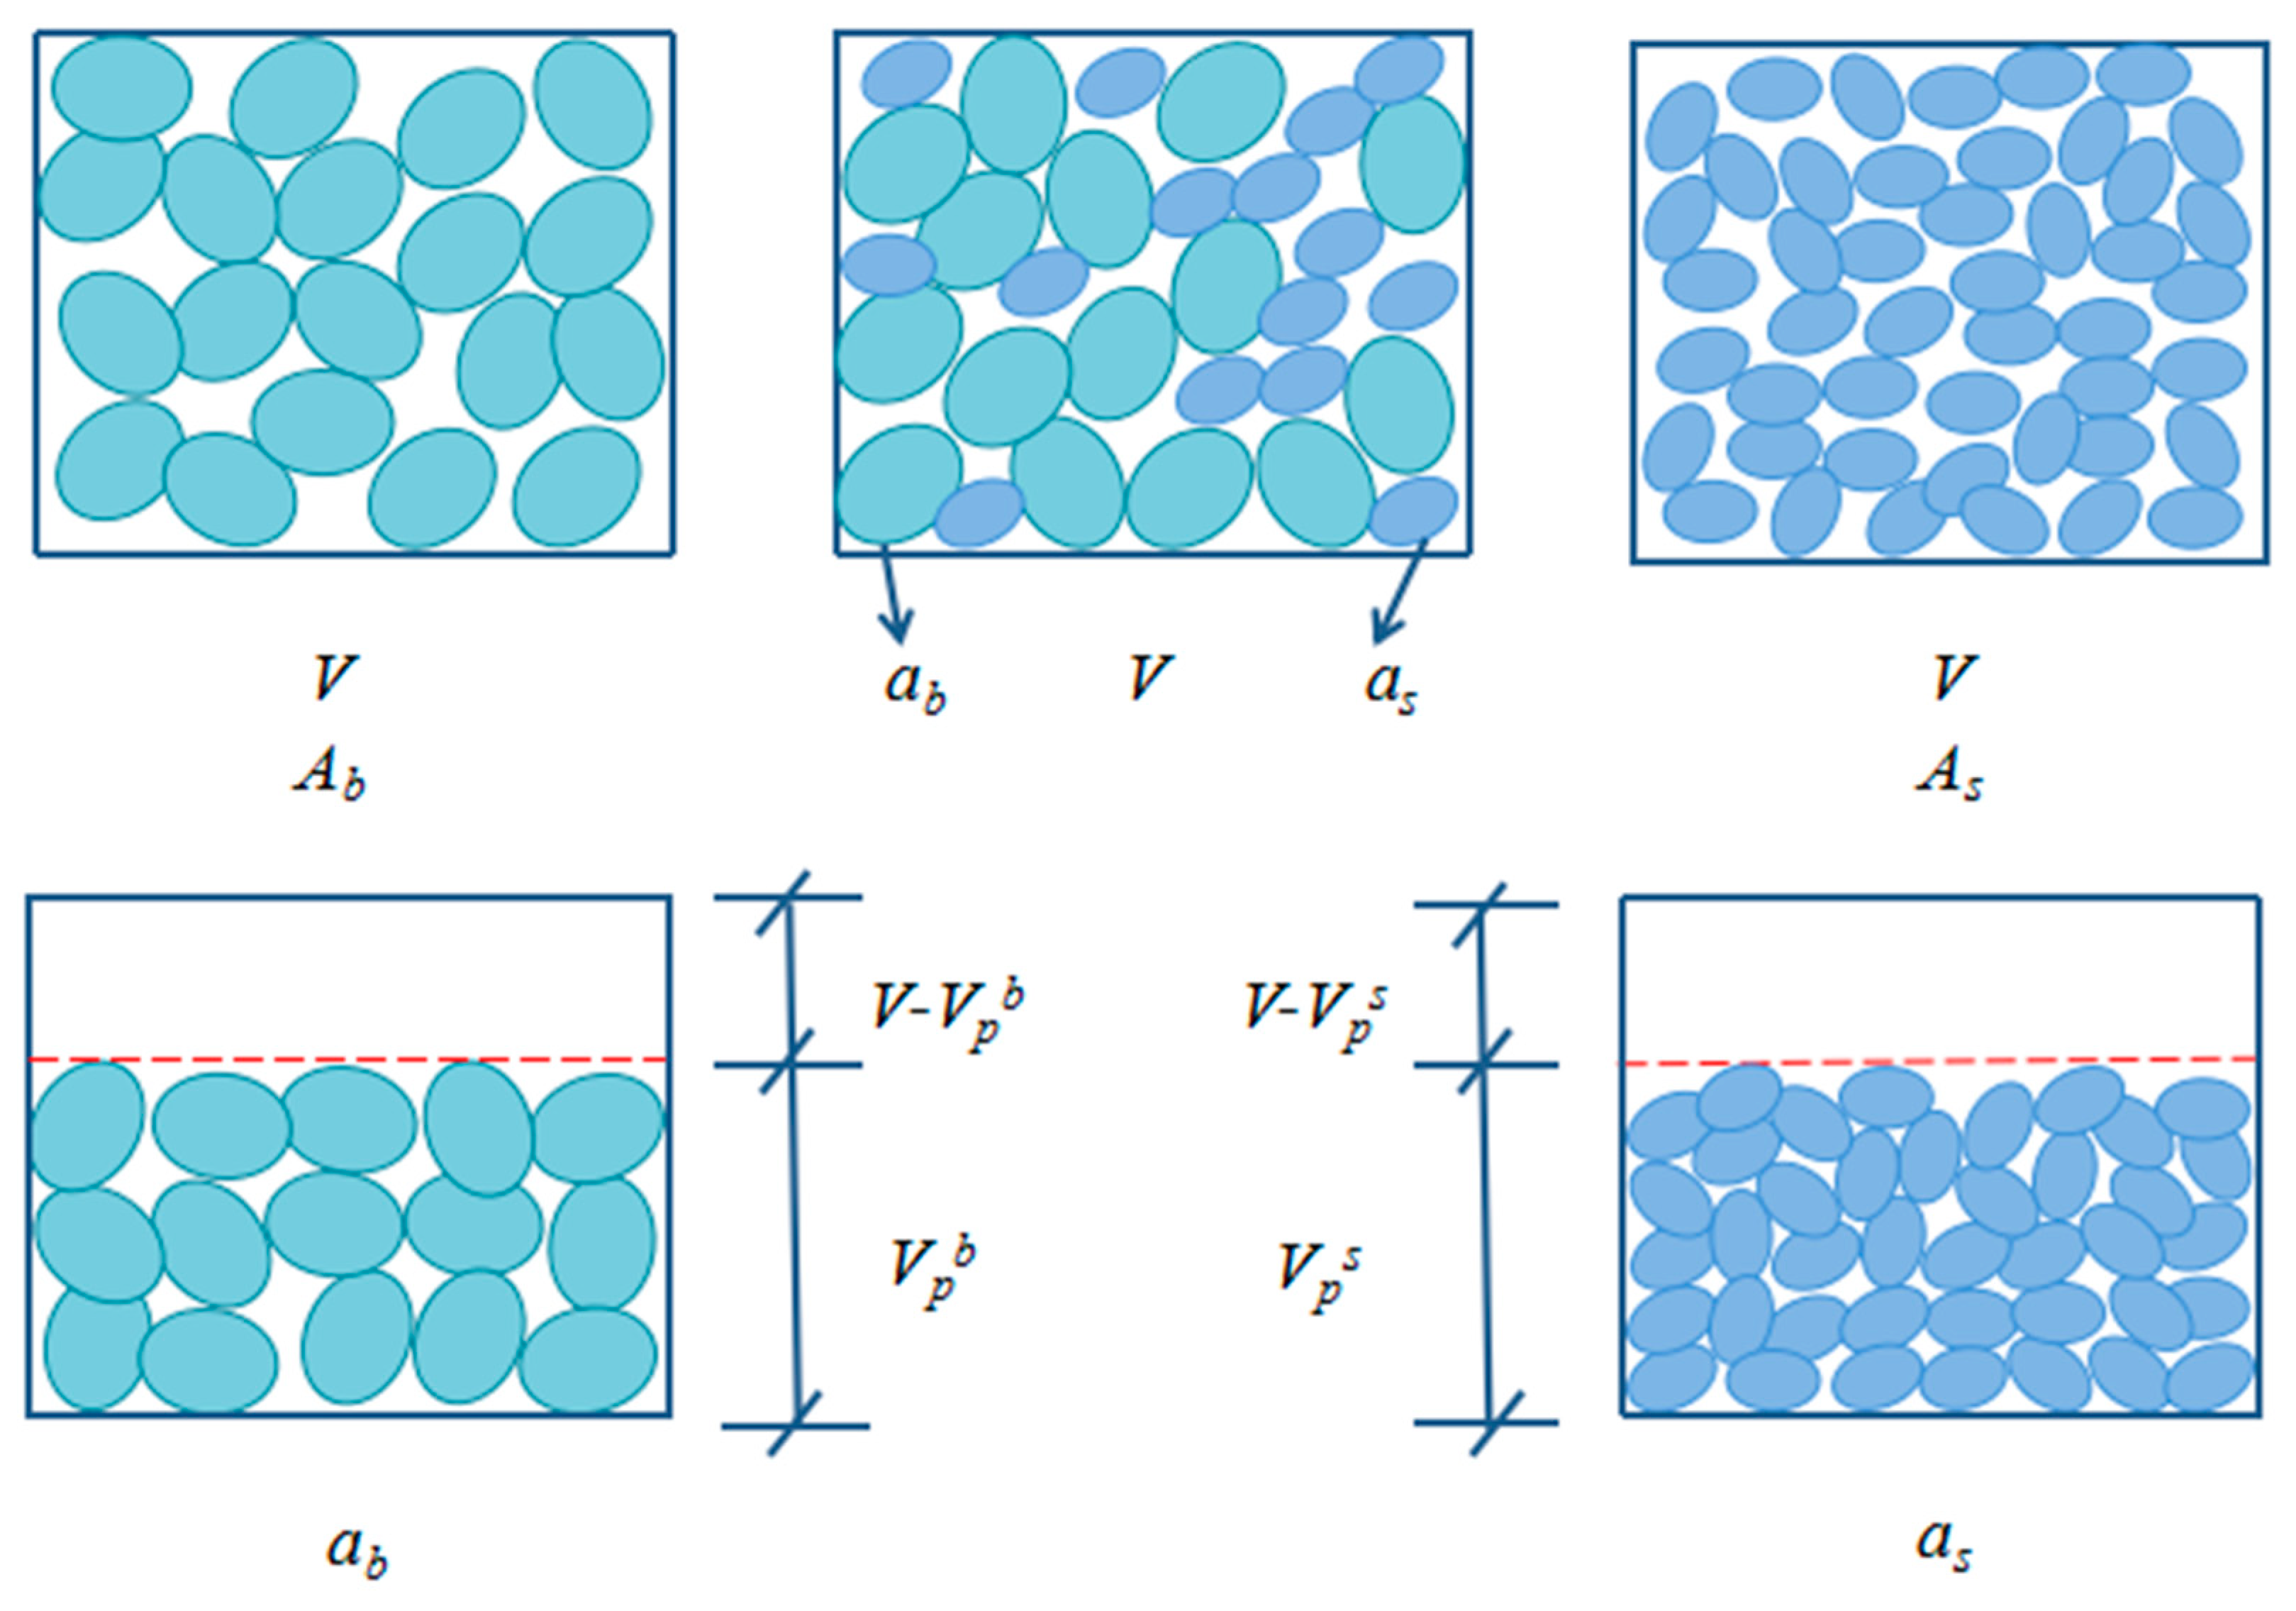
The packing state of each size particle in the TSP test is complex. Some indicators are defined for further understanding the packing characteristics. Denote Ab to represent the bigger size particles packing the volume V alone. Denote As as the smaller size particles packing V alone under the same packing method. Take a two-size combination with a given mass ratio to pack V under the same packing method, and record the bigger particles and the smaller particles in V as ab and as, respectively. Denote the packing volume of ab and as under the same packing method as Vpb and Vps, respectively. Figure 3 could be helpful to understand the meanings of the above mentioned symbols. The percentage of the packing volume of ab in V for the packed two-size combination can be defined as
P p v b = V p b V
Denote the bulk volume of ab and as as Vbb and Vbs respectively. The bulk volume percentage of the bigger particles in the two-size combination can then be defined as
P b v b = V b b V b b + V b s
And that of the smaller size particles can be defined as
P b v s = V b s V b b + V b s
The packing volume increases from Vpb, ab packed alone, to V by adding as to the blend in the TSP tests. The value of V-Vpb can be used to quantify the packing volume contribution of as to the combination. It can be concluded that the major function of as is to build the skeleton in the packed combination when the value of V-Vpb is larger than that of Vps. If the value of V-Vpb is smaller than that of Vps, the air voids filling function will be more than the skeleton building function for as. The relationship between V-Vpb and Vps can be defined as the packing function index (Ipf) of the smaller particles (Equation (9)), which is convenient for investigating the packing function of smaller particles in the packed aggregate combination. When Ipf equals 1, the smaller particles have the same skeleton building function as the bigger particles. When Ipf tends to 0, the smaller particles have an air voids filling function.
I p f = V V p b V p s
All SSP and TSP tests were performed in accordance with the methods of T0309 and T0311 in the “Test Methods of Aggregate for Highway Engineering (JTG E42-2005)” of China [44], where two-parallel experiments were required and the average values were taken.

3. Packing Characteristics of Packed Single-Size Particles

Table 3 lists the values of Va corresponding to the SSP tests of the gravel and crushed stone particles by the loose and dry-rodded packing tests. The corresponding values of R D V a L R and R D V a C S G are also listed in Table 3.
The sphere packing models are usually employed to characterize the packed aggregate particles. The Va of the cubic lattice packing of equal spheres is 47.64% [45], which is commonly considered as a very loose regular packing type. The Va of the close random packing is about 36% [45], which is supported by test and theoretical analysis. A very loose random packing with about 44% voids and a loose random packing with about 40% voids are usually obtained in tests [45]. As can be seen from Table 3, the loose gravel is similar to the loose random packing of equal spheres in Va for all the tested sizes except 1.18 mm, for which the loose gravel is similar to the very loose random packing. The loose crushed stone is similar to the cubic lattice packing (for 9.5 mm or smaller) or the very loose random packing (for 13.2 mm or bigger). For the gravel with a size of 1.18 mm, the dry-rodded is similar to the loose random packing. For the gravel with other test sizes, the dry-rodded is similar to the close random packing. For the crushed stone, the dry-rodded is similar to the loose or very loose random packing. It is shown that the packing characteristics of aggregate particles with single size are more complex than those of the packed equal spheres, which may be attributed to 1) the effects of particle morphology and 2) particles that are not really in equal size.
R D V a L R is helpful to quantitatively understand the effects of packing test methods on the packing characteristics of aggregates particles. As expected, the loosing packing test can result in smaller Va than the dry-rodded packing test. As shown in Table 3, the maximum R D V a L R is 13.75%, which belongs to the gravel with a size of 13.2 mm. The minimum R D V a L R is 7.95%, which corresponds to the crushed stone with a size of 1.18 mm. All the other values of R D V a L R are around 10%.
R D V a C S G provides a quantitative way to investigate the effects of particle morphology on the packing characteristics of aggregates particles. As shown in Table 3, the maximum R D V a C S G for loose packing reaches 16.64%. The minimum R D V a C S G for loose packing also arrives at 5.27%. For the dry-rodded packing, the R D V a C S G values are above 10% for all tested sizes except 1.18 mm, which also reaches 7.25%. The gravel has significantly smaller Va than the crushed stone under the same packing test method, which can be attributed to the poor angularity of the gravel particles.

4. Packing Characteristics of Packed Blends with Two-Size Particles

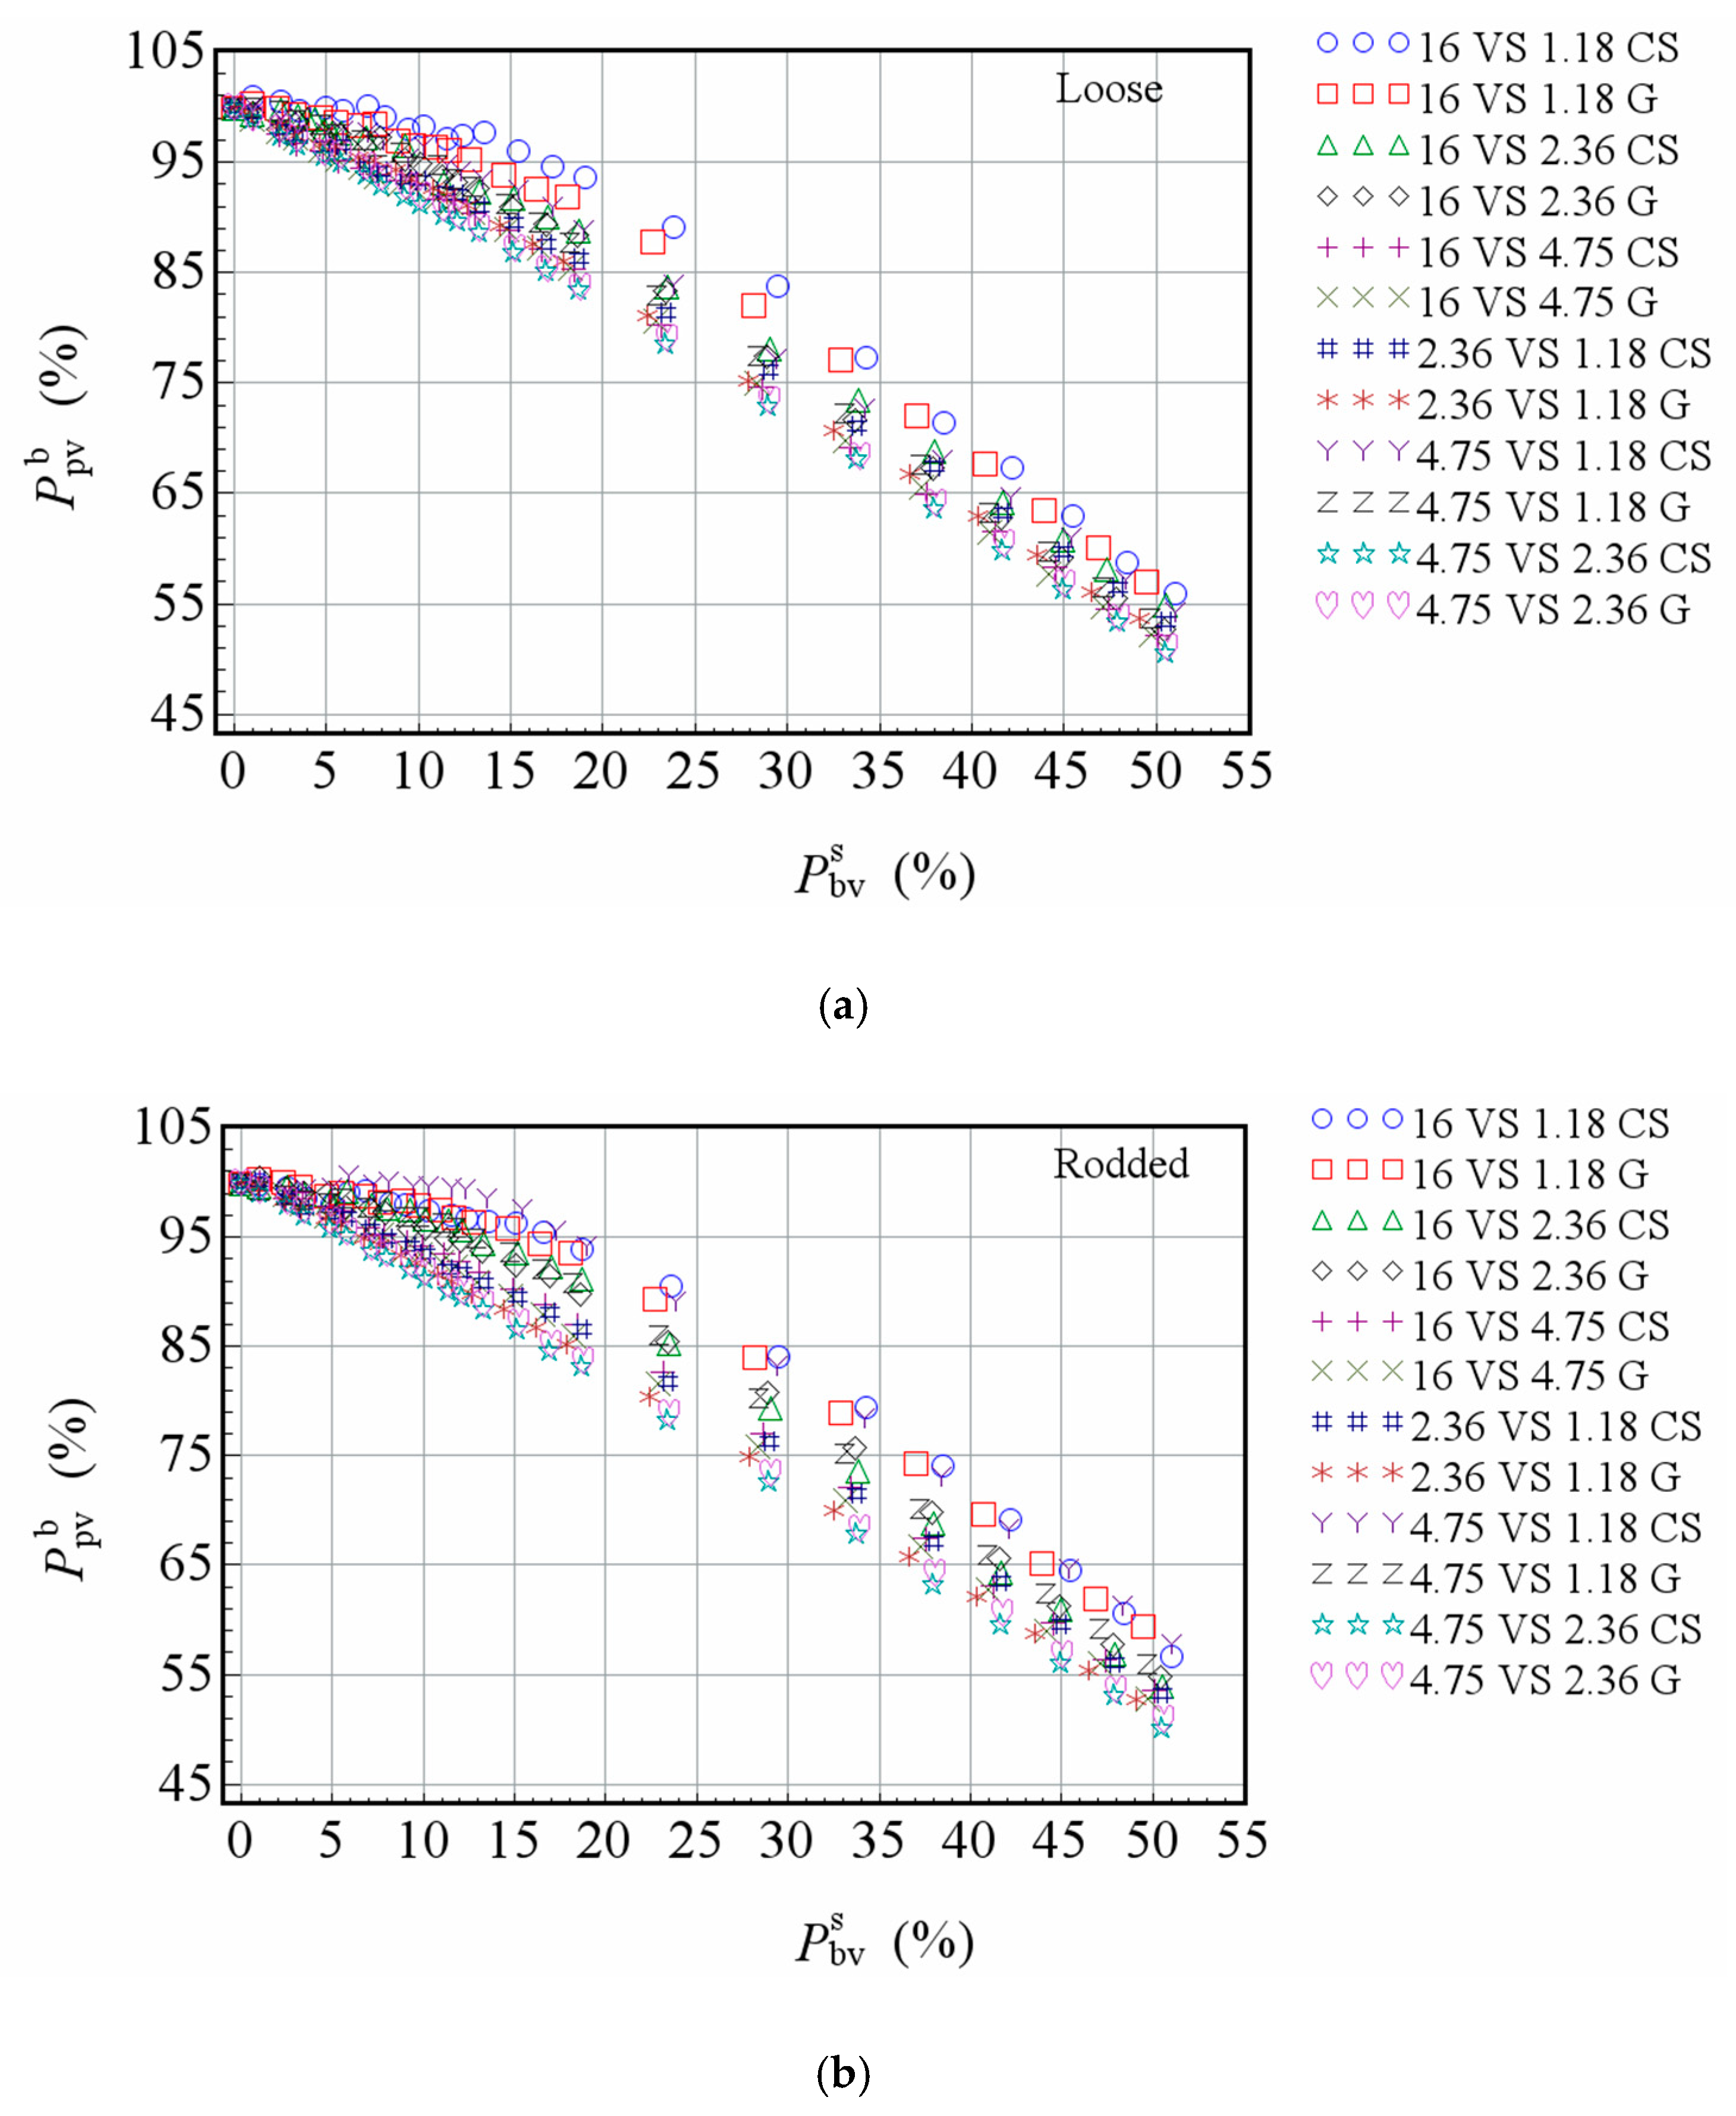
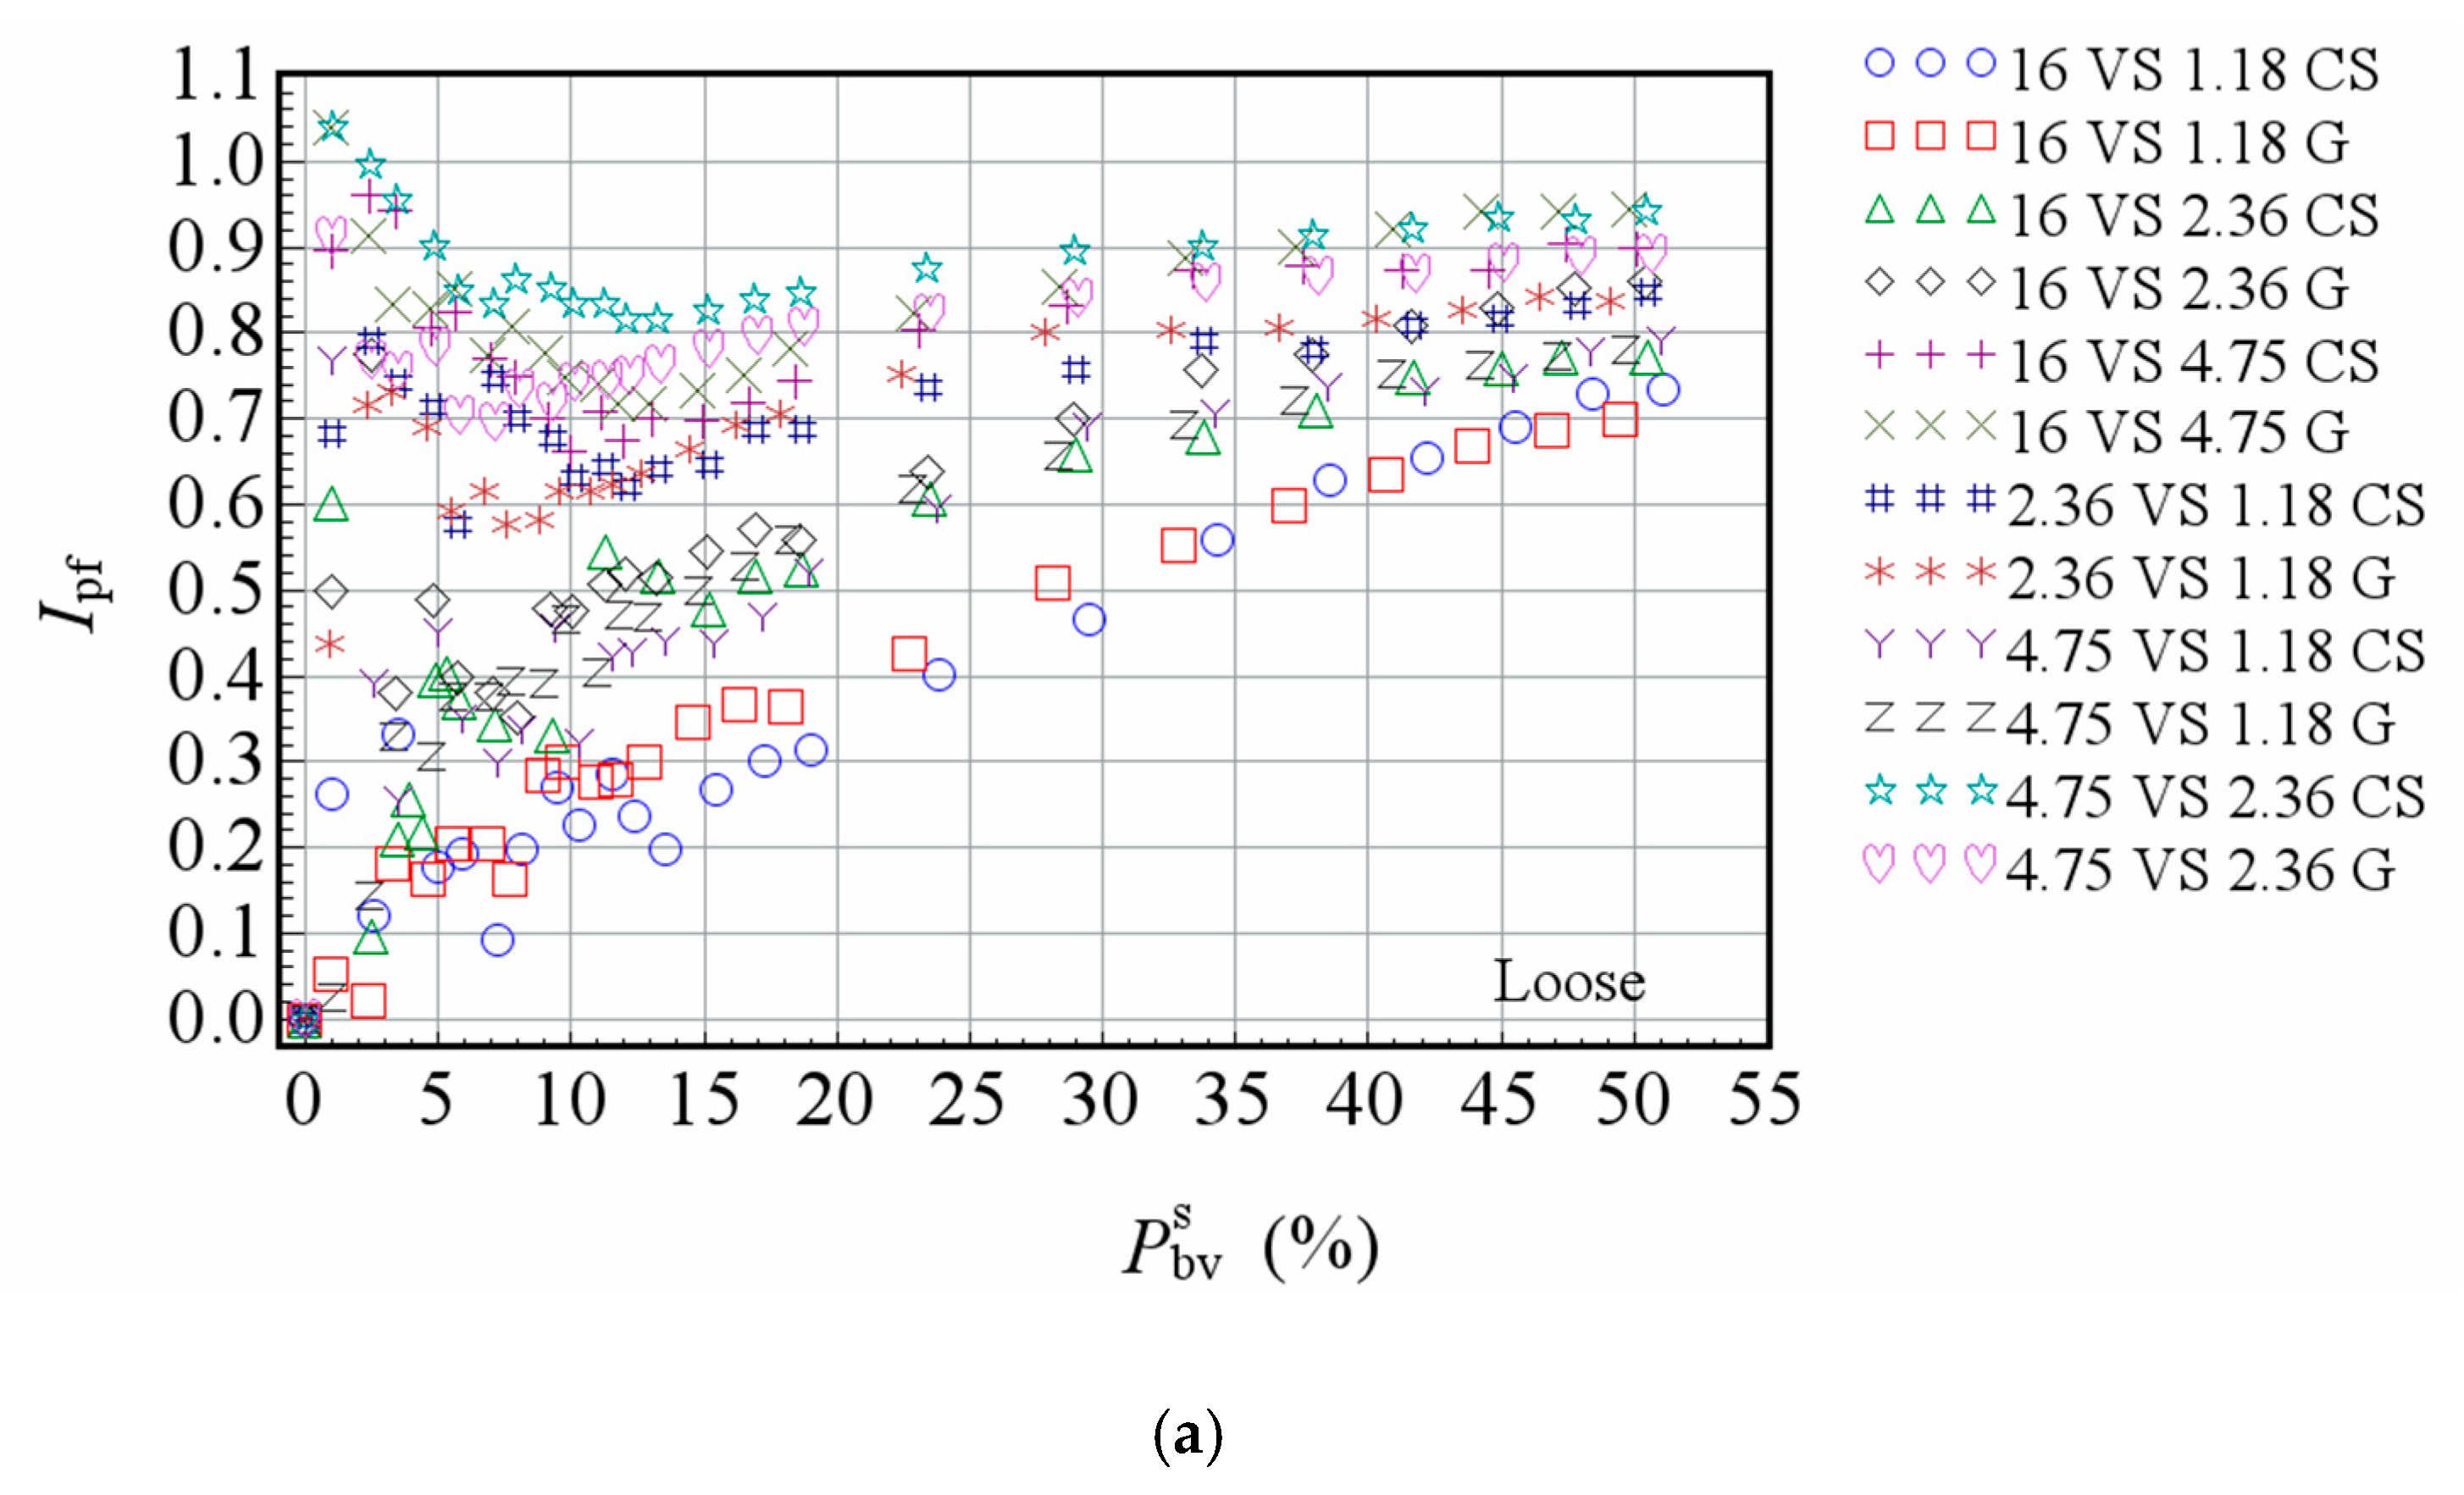
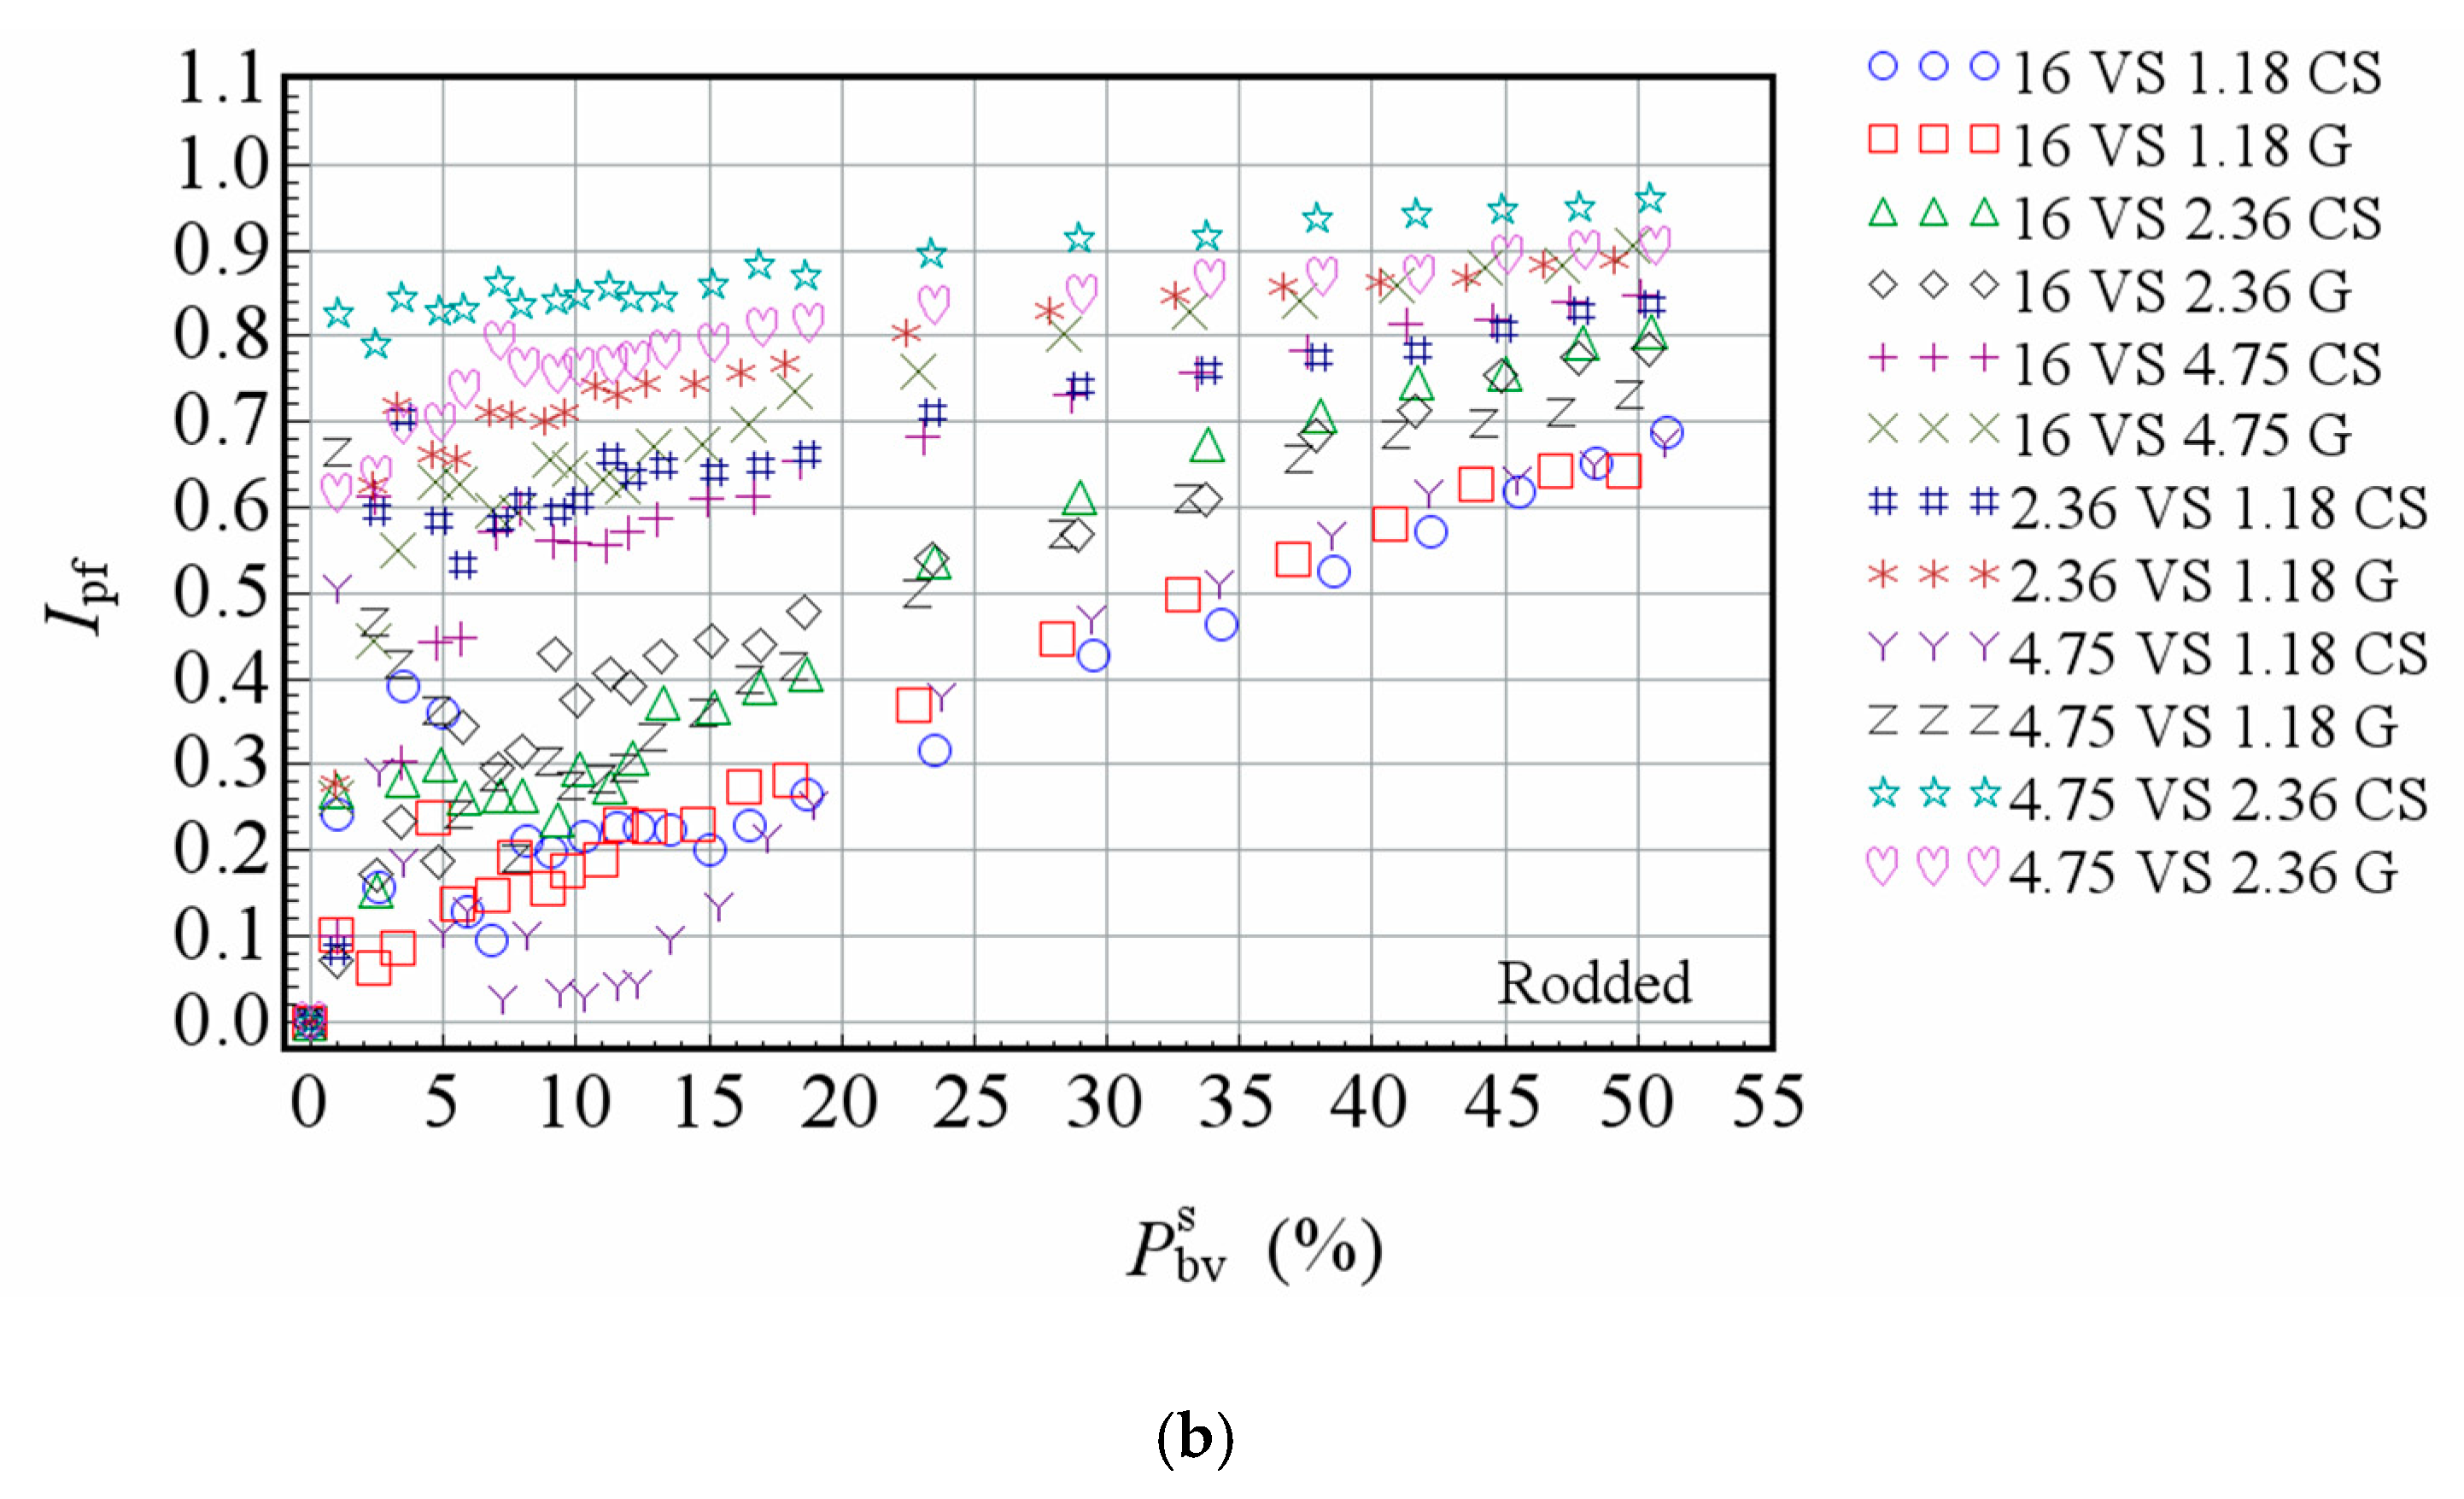
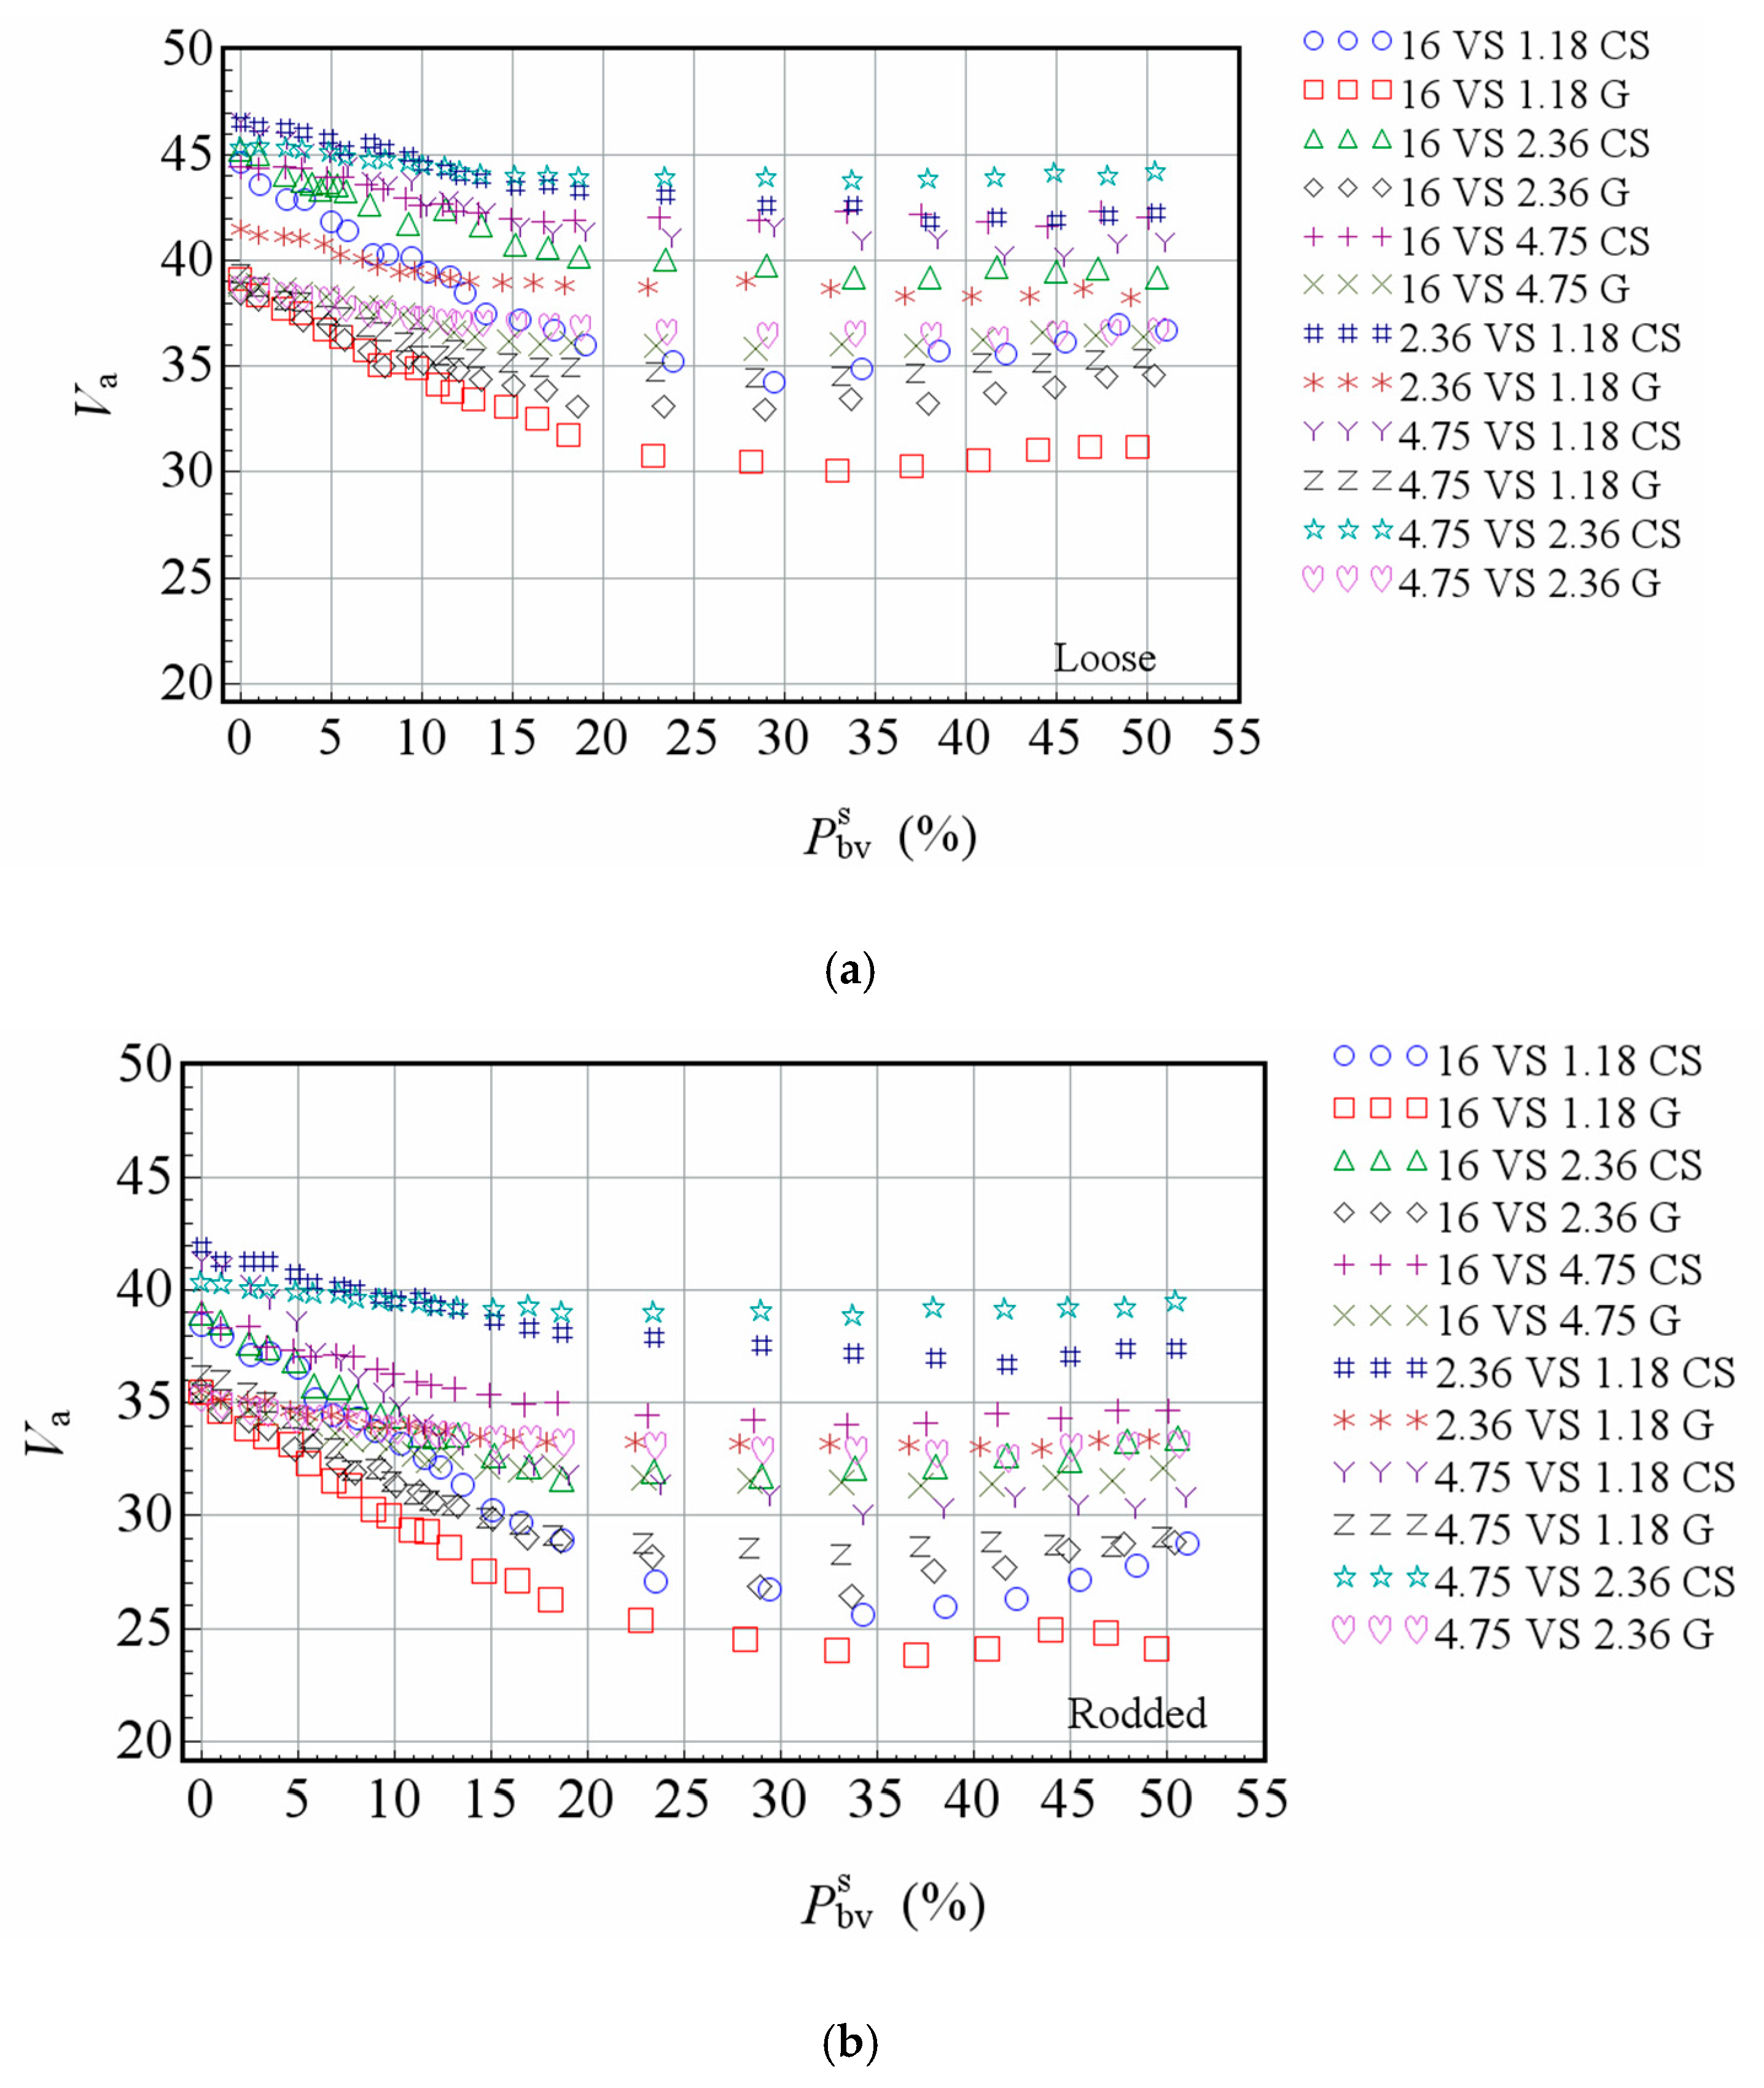
The packing function of each size particle in the TSP test depends on the ratio of particles with the two sizes. The changes of Ppvb, Ipf, and Va with the increase of Pbvs for the loose and dry-rodded TSP tests are depicted in Figure 4, Figure 5 and Figure 6 respectively, which are helpful to understand the packing characteristics of the two-size particles.
Figure 4 shows that Ppvb decreases with the increase of smaller size particles, but the decrease amount of Ppvb is always lower than the increase amount of Pbvs in the tested proportion range. For different combinations, the decrease of Ppvb with the increase of Pbvs are significantly different. Figure 5 shows that the function of particles in the mixture varies with different proportions of smaller size particles to bigger size particles. It should be pointed out that when the proportion of smaller size particles is small, the Ipf of some combinations fluctuates violently. This is mainly because Ipf is relatively sensitive to the test error in this case. Smaller Pbvs steps are used at low proportion of smaller size particles to reduce the influence of test error.
For the same combination, the larger the proportion of smaller size particles, the larger the Ipf. And the larger size ratio the combination has, the more significant the trend is. As shown in Figure 6, the Va of the mixture decreases gradually with the addition of smaller size particles. For each combination, the Va of packed gravel is significantly smaller than that of packed crushed stone. Compared with Figure 5, for the same aggregate, the smaller Ipf under the same Pbvs the combination corresponds, the larger the variation of Va is, and the smaller the final Va. This is consistent with the definition of Ipf. The smaller the Ipf of smaller size particles in the mixture is, the more significant its filling function is.

5. Effects of Particle Morphology

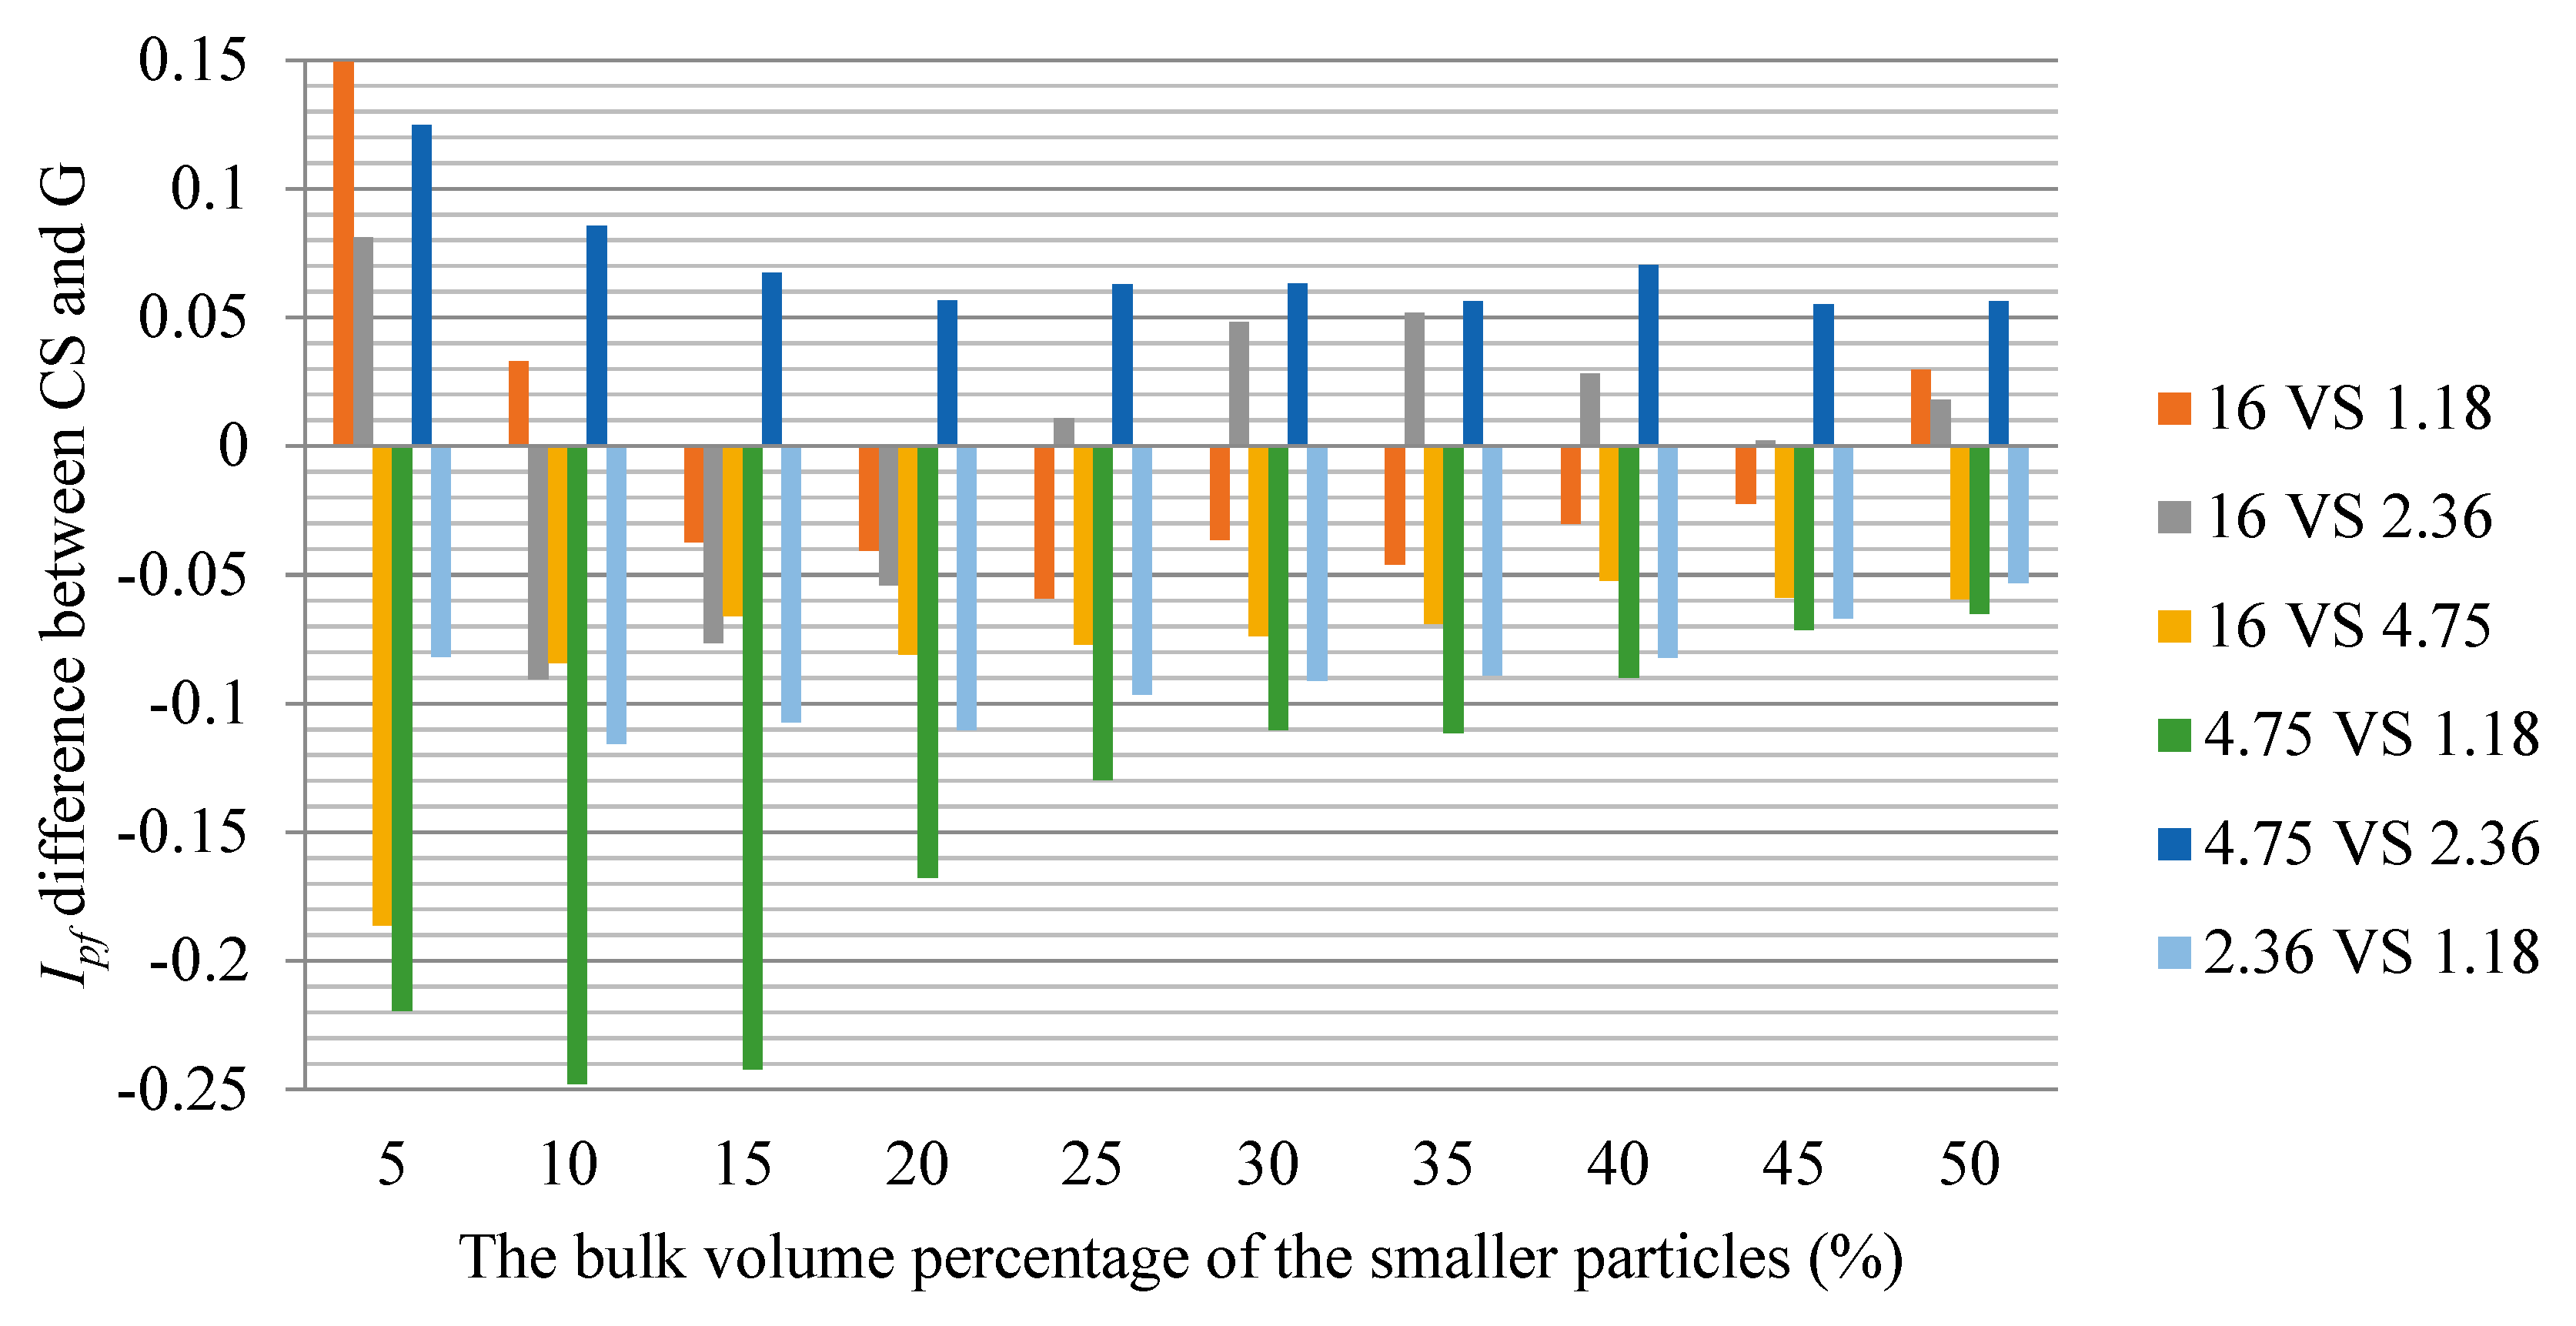
The differences in Ipf and Va between crushed stone and gravel are defined in Equations (10) and (11), respectively, for understanding the effects of particle morphology.
Δ I p f C S G = I p f C S I p f G
where I p f C S is the Ipf of packed crushed stone particles, I p f G is the Ipf of packed gravel particles.
Δ V a C S G = V a C S V a G
where V a C S is the Va of packed crushed stone particles, and V a G is the Va of packed gravel particles.
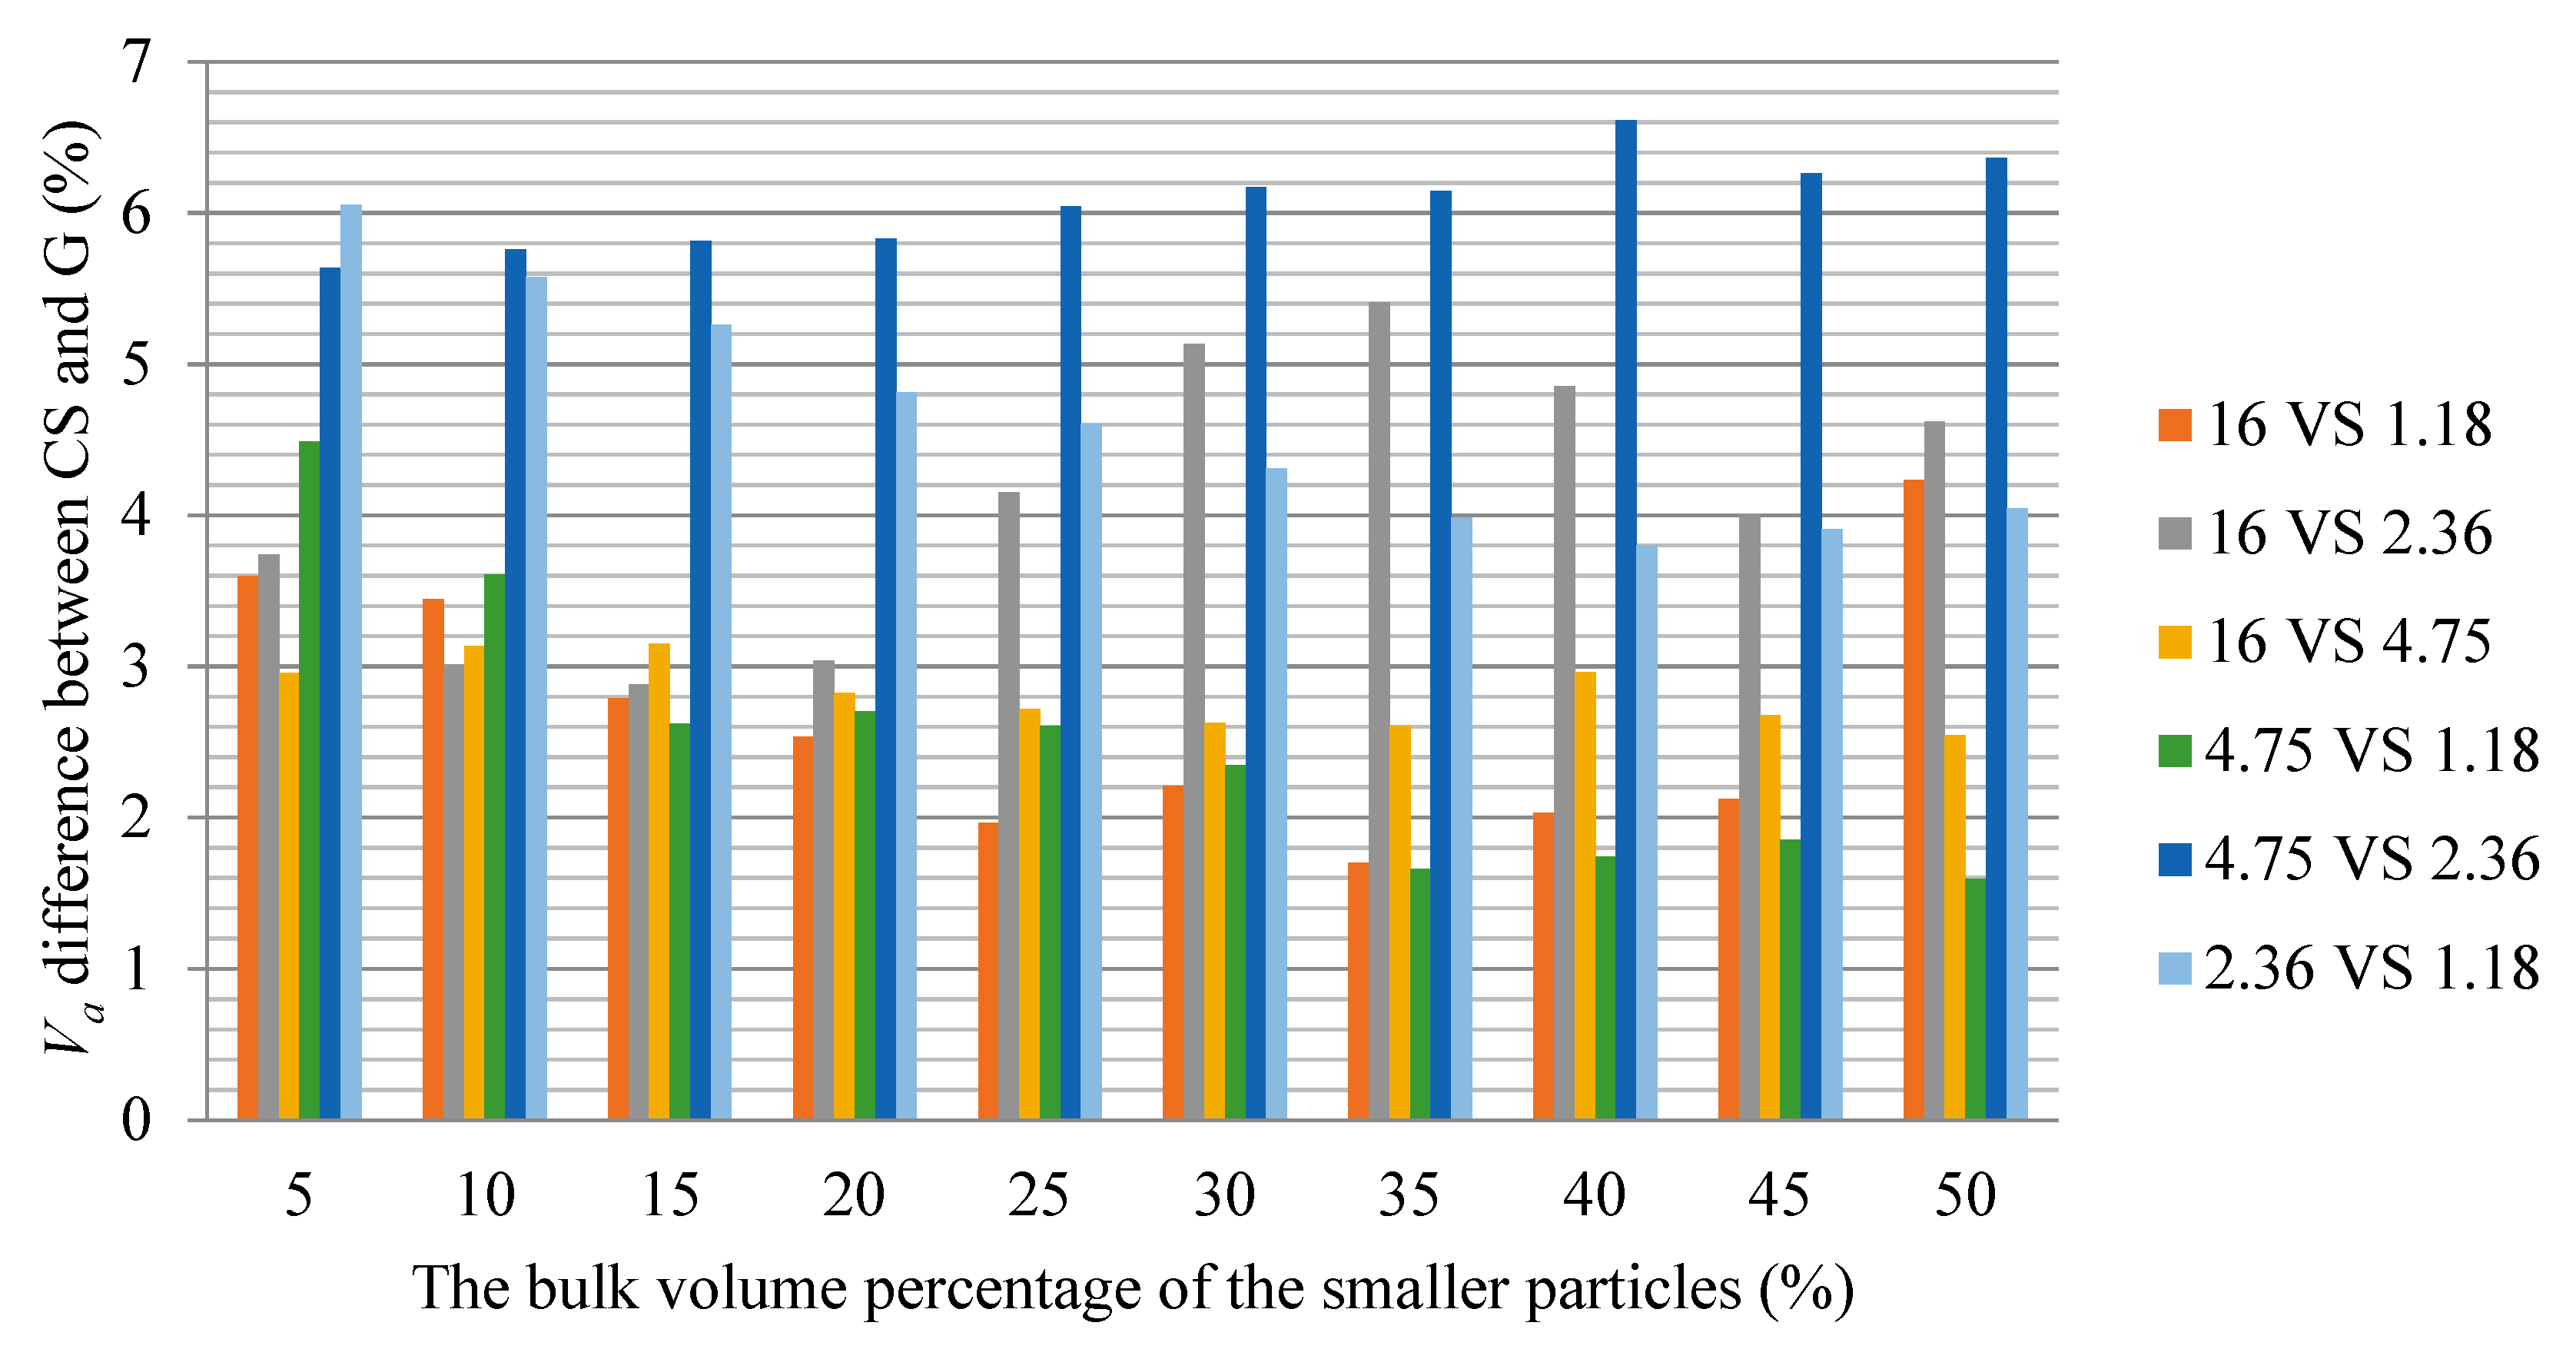
The Δ I p f C S G and Δ V a C S G of each combination for the dry-rodded test are depicted in Figure 7 and Figure 8, respectively. As shown in Figure 7, the morphology of particles has a significant effect on the Ipf of smaller particles in the combination. However, the effects on different combinations are different. In the six combinations shown in the figure, the Δ I p f C S G of 16 VS 4.75, 4.75 VS 1.18, and 2.36 VS 1.18 all have negative values, indicating that the Ipf of gravel particles in the mixture is larger than that of crushed stone. For the same combination, the contribution to the packing volume of smaller gravel particles is bigger than that of smaller crushed stone particle. For 4.75 VS 2.36 combination, the values of Δ I p f C S G are all positive, indicating that in this combination, the Ipf of smaller gravel particles is smaller than that of smaller crushed stone particles, and the packing volume contribution of gravel particles with smaller size is smaller than that of crushed stone particles. For the combinations of 16 VS 2.36 and 16 VS 1.18, the value of Δ I p f C S G is positive when the proportion of smaller size particles are small. With the increase of the proportion of smaller size particles, the value of Δ I p f C S G becomes negative first and then become positive. The influence of morphology is more complex. It should also be noted that with the increase of the proportion of smaller size particles, the influence of morphology on the Ipf of particles tends to decrease gradually. As can be seen from Figure 8, the effect of particle morphology on Va is very significant. For all combinations, the Va of the crushed stone mixture is significantly higher than that of the gravel mixture. The minimum Δ V a C S G is 1.59, which corresponds to 50% of Pbvs in 4.75 VS 1.18 combination. The maximum is 6.61, which corresponds to 40% of Pbvs in 4.75 VS 2.36 combination.

6. Effect of Particle Size Ratio

In engineering practice, aggregates are usually divided into coarse aggregate and fine aggregate according to particle size. It is generally believed that the coarse aggregate plays the role of skeleton building in mixtures, while the fine aggregate mainly plays the role of filling air voids. Technical requirements for coarse aggregate and fine aggregate are accordingly put forward respectively. However, there are many different criteria for the classification of coarse and fine aggregates. 4.75 mm or 2.36 mm are often used as the boundary for the classification of coarse and fine aggregates, but this method does not consider the influence of the maximum particle size. In the Bailey method, 0.22 times of nominal maximum particle size is taken as the boundary for coarse and fine aggregates. Some researchers also suggest that the 0.25 times should be selected. Up to now, there is no consensus on the classification criteria of coarse aggregates and fine aggregates.
Compare the Ipf and Va of 16 VS 4.75, 16 VS 2.36 and 16 VS 1.18 in Figure 5 and Figure 6, it is discovered that distributions of Ipf and Va corresponding to different size combinations are significantly separated, indicating that the size ratio has a significant effect on the packing characteristics of the mixture.
It can be observed from Figure 5 that, for the combination of 16 VS 4.75, when Pbvs is larger than 5%, Ipf of 4.75 mm particles in crushed stone mixtures are all above 0.5, while that of gravel is higher and above 0.6. For the combination of 16 VS 2.36 where Ipf of 2.36 mm is 0.148 times of 16 mm, when Pbvs is larger than 5%, the Ipf of 2.36 mm in crushed stone and gravel mixture are above 0.3 and increases fast with the increase of Pbvs. Even for the combination of 16 VS 1.18 where the ratio of small particle size to large particle size is reduced to 0.074, the Ipf of 1.18 mm particles falls below 0.1 only when Pbvs is very small. Ipf also increases fast with the increase of Pbvs. When Pbvs is larger than 20%, Ipf increases above 0.3.
Compared with 4.75 mm, 2.36 mm or 0.22 times of the nominal maximum particle size used in the traditional classification of coarse and fine aggregates, it seems that the functions of particles in a packed blend cannot be simply distinguished by these standards. The function of particles cannot be clearly distinguished into skeleton building and air voids filling. In most cases, particles have both of these functions in different degrees in the mixture. The ideal air voids filling or the skeleton building function in the aggregate blend is rare. The change of Ipf with the proportion of smaller size particles indicates that the function of particles is closely related to the specific composition of different size particles, and cannot be simply divided according to the relationship between particle sizes. In the analysis of the packing function of particles, the proportion of particles should be considered. In addition, Figure 6 shows that the Va of the same aggregate mixture decreases significantly with the increase of size ratio.

7. Size Effect

For ideal sphere packing with two particle sizes, packing characteristics are related to particle size ratio, but not to particle size [8]. However, the packing characteristics of aggregates are different from those of ideal spheres due to the influences of particle morphology and frictional resistance between particles. From Figure 5 and Figure 6, for combinations of 4.75 VS 2.36 and 2.36 VS 1.18, the variations of Ipf and Va are obvious with the change of Pbvs, indicating that packing characteristics are not only related to particle size ratio, but also related to the particle size.
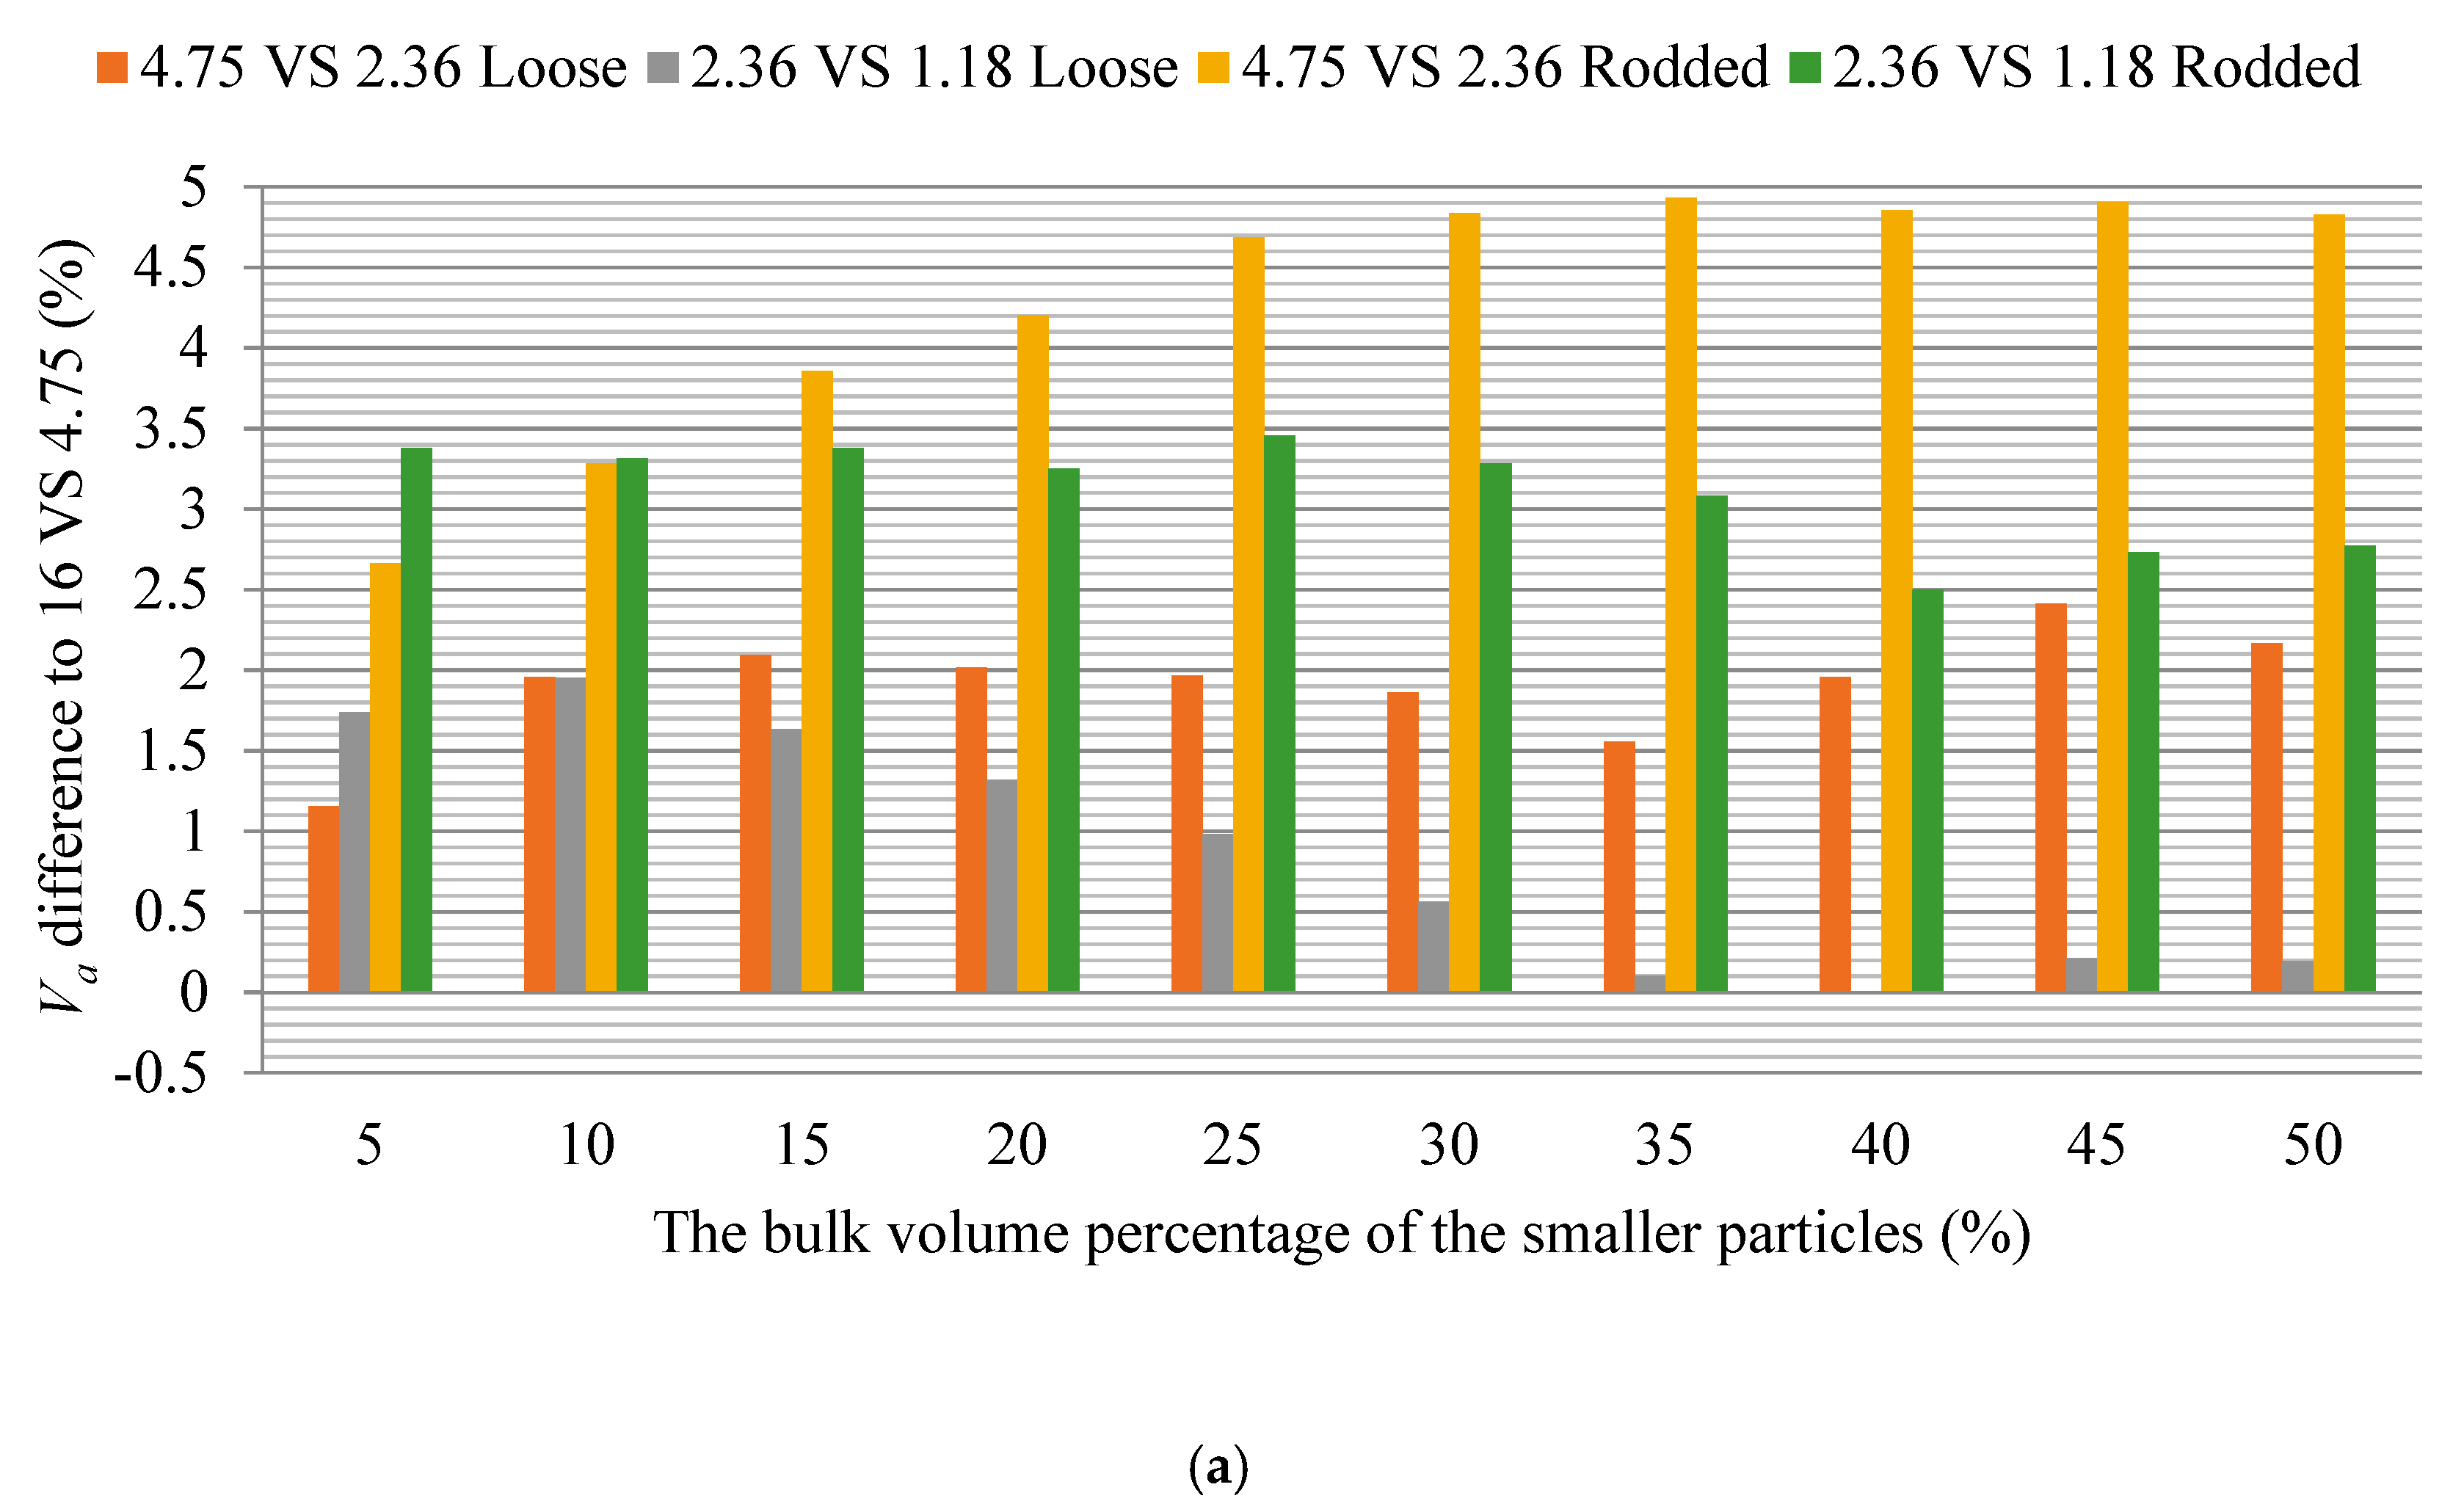
In order to analyze the effect of particle size on the packing behavior of blends with two-size particles, the combinations of 16 VS 4.75, 4.75 VS 2.36 and 2.36 VS 1.18 with equal particle size ratio are selected for comparisons. Figure 9 presents the differences in Ipf between 4.75 VS 2.36, 2.36 VS 1.18, and 16 VS 4.75 for different Pbvs. Figure 10 depicts the difference of Va between 4.75 VS 2.36, 2.36 VS 1.18, and 16 VS 4.75 for different Pbvs.
From Figure 9, it can be found that the Ipf of smaller particles is significantly different in the combinations with different maximum particle sizes. In the crushed stone dry-rodded test, compared with the 16 VS 4.75 combination, all Ipf values of smaller size particles in 4.75 VS 2.36 combination are 0.1 larger, and it is even 0.39 lager when Pbvs is 5%. Even for the combinations of 4.75 VS 2.36 and 2.36 VS 1.18, for which the size ratio is exactly same, there is a significant difference between the values of Ipf of smaller size particles. Comparing Figure 8a with Figure 8b, the packing behavior difference between crushed stone and gravel mixture can be understood. For the 4.75 VS 2.36 combination, whether the loose or dry-rodded packing test, the Ipf difference of smaller size particles to 16 VS 4.75 combination for the crushed stone blend is more significant than that of gravel, while that of 2.36 VS 1.18 combination is just the opposite. In addition, with the increase of the proportion of smaller size particles in the blend, the effect of size on packing function decreases gradually.
Figure 10 shows that the Va values of 4.75 VS 2.36 and 2.36 VS 1.18 combinations are higher than those of 16 VS 4.75 combination in almost all test cases, and there are significant differences between the combinations of 4.75 VS 2.36 and 2.36 VS 1.18. Among crushed stone dry-rodded test, the difference between 4.75 VS 2.36 and 16 VS 4.75 is the most prominent. Except for the difference of 2.66% when the Pbvs is 5%, the differences at other Pbvs are more than 3%, and most of them are more than 4%, where the maximum is 4.93%. Compared Figure 10a with Figure 10b, it can be found that the differences of Va for gravel mixtures are smaller than those for crushed stone mixtures except for the combination of 2.36 VS 1.18.
By comparing the packing test data mentioned above, the effect of size on the packing characteristics of the aggregate blend can be clearly observed. However, the experimental data do not show a significant trend, and the changes are relatively complex, which still needs further study.

8. Conclusions

In this paper, the packing characteristics of aggregate blend with single-size and two-size particles and the effects of particle shape, particle size, and size ratio on the packing characteristics were studied by the indoor packing test. The following conclusions can be drawn.
  • The comparison between the SSP test and sphere packing models shows that the results of packing analysis using ideal spheres cannot be simply used to describe the packing characteristics of real aggregate mixtures. The morphology of aggregate particles is different from each other. Even the particles in the aggregate with single size do not have exactly equal size. The packing behavior of aggregate particles is more complex than that of ideal spheres.
  • Particle morphology has a significant effect on the Va of packed aggregate. Whether in the SSP or TSP test, the Va of crushed stone blend is significantly higher than that of gravel blend. In the SSP test, the biggest difference is for 4.75 mm particles in the loose packing test, where the Va of crushed stone blend is 16.64% higher than that of gravel blend. The smallest is for 1.18 mm particles in the loose packing test, where the Va of crushed stone blend is 5.27% higher than that of gravel.
  • The Ipf can be used to quantitatively distinguish the skeleton building and air void filling functions of smaller size particles in the TSP test. The Ipf is between 0 and 1, where 1 indicates that smaller size particles plays the same skeleton role as larger size particles in the blend, and 0 indicates that smaller size particles only fills air voids in the blend.
  • The function of particles cannot be simply divided into skeleton building and air void filling. Particles in a mixture have the above two functions in varying degrees. Even in the combination of 16 VS 1.18 (size ratio is only 0.074), the Ipf of smaller particle size is not zero.
  • The function of particles changes with respect to different particle size compositions. In the same combination, Ipf of smaller particles increases with the increasing of its proportion. The larger the particle size ratio in the mixture, the larger the increase of Ipf with the addition of smaller particles. The change of Ipf with the proportion of smaller size particles indicates that the function of particles is closely related to the specific composition of different size particles, and cannot be simply distinguished according to the relationship between particle sizes.
  • Particle size has a significant impact on the packing characteristics of aggregates. For the SSP test, there is a significant difference in Va between packed aggregates with different sizes. For the TSP test, under the same particle size ratio and the same volume ratio, there are significant differences in Va and Ipf of smaller size particles among the combinations with different maximum particle size, where the change trend is complex and still needs further study.

Author Contributions

Conceptualization, Y.M., J.L., J.W. and X.L.; methodology, Y.H., Y.M., J.L., and J.W.; software, N/A; validation, X.L., Y.H., and Y.M.; formal Analysis, N/A; Investigation, Y.M., J.L., J.W., Y.H., and L.W.; resources, N/A; data curation, Y.H. and Y.M.; writing—original draft preparation, X.L., J.L., and J.W.; writing—review and editing, Y.H., L.W., and Y.M.; visualization, X.L., J.L., and J.W.; supervision, Y.M.; project administration, Y.M.; funding acquisition, Y.M.

Funding

The research reported in this paper is funded by the National Natural Science Foundation of China (No. 51178013).

Acknowledgments

The authors would like to express thanks for the financial support from the National Natural Science Foundation of China.

Conflicts of Interest

The authors declare no conflict of interest.

References

  1. Christensen, D.W.; Bonaquist, R.F. Volumetric Requirements for Superpave Mix Design; NCHRP Report 573; Transportation Research Board of the National Academies: Washington, DC, USA, 2006. [Google Scholar]
  2. Cooper, S.B.; William, M.K.; Sharear, K. Testing and Analysis of LWT and SCB Properties of Asphalt Concrete Mixtures; No. Final Report 536; Louisiana Transportation Research Center: Baton Rouge, LA, USA, 2016. [Google Scholar]
  3. Das, P.K.; Björn Birgisson Jelagin, D.; Kringos, N. Investigation of the asphalt mixture morphology influence on its ageing susceptibility. Mater. Struct. 2013, 48, 1–14. [Google Scholar] [CrossRef]
  4. Zaumanis, M.; Poulikakos, L.D.; Partl, M.N. Performance-based design of asphalt mixtures and review of key parameters. Mater. Des. 2018, 141, 185–201. [Google Scholar] [CrossRef]
  5. Jenks, C.W.; Jencks, F.E.; Harrigan, T.; Adcock, M.; Delaney, E.P.; Freer, H. A Manual for Design of Hot Mix Asphalt with Commentary; NCHRP Report 673; Transportation Research Board, National Academy of Sciences: Washington, DC, USA, 2011. [Google Scholar]
  6. Vavrik, W.R.; Pine, W.J.; Huber, G.; Carpenter, S.H.; Bailey, R. The Bailey Method of Gradation Evaluation: The Influence of Aggregate Gradation and Packing Characteristics on Voids in the Mineral Aggregate. J. Assoc. Asph. Paving Technol. 2001, 70, 132–175. [Google Scholar]
  7. Yideti, T.F. Packing Theory-Based Framework for Performance Evaluation of Unbound Granular Materials; Royal Institute of Technology: Stockholm, Sweden, 2014. [Google Scholar]
  8. Li, S.; Zhao, J.; Lu, P.; Meng, L.; Li, T.; Jin, W. Research Progress on the Densest Packing of Basic 3D Objects. In Proceedings of the National Conference on Computational Mechanics of Granular Materials (CMGM-2012), Hunan, China, 16–18 September 2012. [Google Scholar]
  9. Meng, L.; Jiao, Y.; Li, S. Maximally dense random packings of spherocylinders. Powder Technol. 2016, 292, 176–185. [Google Scholar] [CrossRef]
  10. Meng, L.; Li, S. Disordered packing density of binary and polydisperse mixtures of curved spherocylinders. Particuology 2017, 32, 73–81. [Google Scholar] [CrossRef]
  11. Zhang, X.; Wang, S.; Wu, K.; Wang, D. The CAVF method of asphalt mixture composition design. Highway 2001, 12, 17–21. [Google Scholar]
  12. Zhang, Y.M.; Chen, S.F.; Hu, G.W. Coarse aggregate gradation design of asphalt mixture by gradually filling test. J. Wuhan Univ. Technol. 2011, 33, 44–48. [Google Scholar]
  13. Chen, Z.; Yuan, W.; Gao, C. Research on Design Method of Multilevel Dense Built-in Gradation. China J. Highw. Transp. 2006, 19, 32–37. [Google Scholar]
  14. Miao, Y.; Wang, S.; Guo, L.; Li, J. A method for quantifying the packing function of particles in packed aggregate blend. Constr. Build. Mater. 2018, 188, 607–614. [Google Scholar] [CrossRef]
  15. Wang, L. An Evaluation of the Microstructure and the Macro-Behavior of Unbounded and Bounded Granular Materials; Georgia Institute of Technology: Atlanta, Georgia, 1998. [Google Scholar]
  16. Wang, L.B.; Frost, J.D.; Shashidhar, N. Microstructure study of WesTrack mixes from X-ray tomography images. Transp. Res. Rec. 2001, 1767, 85–94. [Google Scholar] [CrossRef]
  17. Moon, K.H.; Falchetto, A.C.; Jeong, J.H. Microstructural analysis of asphalt mixtures using digital image processing techniques. Can. J. Civ. Eng. 2014, 41, 74–86. [Google Scholar] [CrossRef]
  18. Wang, L.B.; Frost, J.D.; Lai, J.S. Three-dimensional digital representation of granular material microstructure from X-ray tomography imaging. J. Comput. Civ. Eng. 2004, 18, 28–35. [Google Scholar] [CrossRef]
  19. Al-Raoush, R. Microstructure characterization of granular materials. Phys. A Stat. Mech. Appl. 2007, 377, 545–558. [Google Scholar] [CrossRef]
  20. Lu, Y.; Garboczi, E.J. Bridging the Gap between Random Microstructure and 3D Meshing. J. Comput. Civ. Eng. 2014, 28, 4014007. [Google Scholar] [CrossRef]
  21. Stroeven, P.; Stroeven, M. Assessment of packing characteristics by computer simulation. Cem. Concr. Res. 1999, 29, 1201–1206. [Google Scholar] [CrossRef]
  22. Sobolev, K.; Amirjanov, A. Application of genetic algorithm for modeling of dense packing of concrete aggregates. Constr. Build. Mater. 2010, 24, 1449–1455. [Google Scholar] [CrossRef]
  23. Shen, S.; Yu, H. Characterize packing of aggregate particles for paving materials: Particle size impact. Constr. Build. Mater. 2011, 25, 1362–1368. [Google Scholar] [CrossRef]
  24. Xu, W.X.; Chen, H.S. Numerical investigation of effect of particle shape and particle size distribution on fresh cement paste microstructure via random sequential packing of dodecahedral cement particles. Comput. Struct. 2013, 114, 35–45. [Google Scholar] [CrossRef]
  25. Xu, W.X.; Lv, Z.; Chen, H.S. Effects of particle size distribution, shape and volume fraction of aggregates on the wall effect of concrete via random sequential packing of polydispersed ellipsoidal particles. Phys. A Stat. Mech. Appl. 2013, 392, 416–426. [Google Scholar] [CrossRef]
  26. Liu, L.; Shen, D.J.; Chen, H.S.; Xu, W.X. Aggregate shape effect on the diffusivity of mortar: A 3D numerical investigation by random packing models of ellipsoidal particles and of convex polyhedral particles. Comput. Struct. 2014, 144, 40–51. [Google Scholar] [CrossRef]
  27. Boler, H.; Qian, Y.; Tutumluer, E. Influence of Size and Shape Properties of Railroad Ballast on Aggregate Packing Statistical Analysis. Transp. Res. Rec. 2014, 94–104. [Google Scholar] [CrossRef]
  28. Han, D.; Zhu, J.H.; Li, L.; Pang, H.P. Verification and application of two-dimensional slice identification method in three-dimensional mesostructure under different aggregate gradations and packing algorithms. Constr. Build. Mater. 2016, 102, 843–851. [Google Scholar] [CrossRef]
  29. Ma, H.; Xu, W.; Li, Y. Random aggregate model for mesoscopic structures and mechanical analysis of fully-graded concrete. Comput. Struct. 2016, 177, 103–113. [Google Scholar] [CrossRef]
  30. Xiao, Y.; Tutumluer, E. Gradation and Packing Characteristics Affecting Stability of Granular Materials: Aggregate Imaging-Based Discrete Element Modeling Approach. Int. J. Geomech. 2017, 17. [Google Scholar] [CrossRef]
  31. Xu, H.; Xing, C.; Zhang, H.; Li, H.; Tan, Y. Moisture seepage in asphalt mixture using X-ray imaging technology. Int. J. Heat Mass Transf. 2019, 131, 375–384. [Google Scholar] [CrossRef]
  32. Xu, H.; Zhou, J.; Dong, Q.; Tan, Y. Characterization of moisture vapor diffusion in fine aggregate mixtures using Fickian and non-Fickian models. Mater. Des. 2017, 124, 108–120. [Google Scholar] [CrossRef]
  33. Yu, B.; Gu, X.; Ni, F.; Gao, L. Microstructure characterization of cold in-place recycled asphalt mixtures by X-ray computed tomography. Constr. Build. Mater. 2018, 171, 969–976. [Google Scholar] [CrossRef]
  34. Gu, F.; Ma, W.; West, R.C.; Taylor, A.J.; Zhang, Y. Structural performance and sustainability assessment of cold central-plant and in-place recycled asphalt pavements: A case study. J. Clean. Prod. 2019, 208, 1513–1523. [Google Scholar] [CrossRef]
  35. Li, J.; Zhang, J.; Qian, G.; Zheng, J.; Zhang, Y. Three-Dimensional Simulation of Aggregate and Asphalt Mixture Using Parameterized Shape and Size Gradation. J. Mater. Civ. Eng. 2019, 31. [Google Scholar] [CrossRef]
  36. Gao, Y.; Zhang, Y.; Gu, F.; Xu, T.; Wang, H. Impact of minerals and water on bitumen-mineral adhesion and debonding behaviours using molecular dynamics simulations. Constr. Build. Mater. 2018, 171, 214–222. [Google Scholar] [CrossRef]
  37. Dong, Q.; Yuan, J.; Chen, X.; Ma, X. Reduction of moisture susceptibility of cold asphalt mixture with Portland cement and bentonite nanoclay additives. J. Clean. Prod. 2018, 176, 320–328. [Google Scholar] [CrossRef]
  38. Dong, Q.; Huang, B.; Shu, X. Rubber modified concrete improved by chemically active coating and silane coupling agent. Constr. Build. Mater. 2013, 48, 116–123. [Google Scholar] [CrossRef]
  39. Chen, Z.; Zhang, H.; Shi, C.; Wei, C. Rheological performance investigation and sustainability evaluation of asphalt binder with thermochromic powders under solar radiation. Sol. Energy Mater. Sol. Cells 2019, 191, 175–182. [Google Scholar] [CrossRef]
  40. Zhang, H.; Chen, Z.; Xu, G.; Shi, C. Evaluation of aging behaviors of asphalt binders through different rheological indices. Fuel 2018, 221, 78–88. [Google Scholar] [CrossRef]
  41. Zhang, D.; Zhang, H.; Shi, C. Investigation of aging performance of SBS modified asphalt with various aging methods. Constr. Build. Mater. 2017, 145, 445–451. [Google Scholar] [CrossRef]
  42. Miao, Y.; Song, P.; Gong, X. Fractal and Multifractal Characteristics of 3D Asphalt Pavement Macrotexture. J. Mater. Civ. Eng. 2014, 26. [Google Scholar] [CrossRef]
  43. Zhou, Q.; Liu, X. Digital Terrain Analysis; Science Press: Beijing, China, 2006. [Google Scholar]
  44. Ministry of Transport China. Test Methods of Aggregate for Highway Engineering (JTG E42-2005); China Communications Press: Beijing, China, 2005.
  45. Dullien, F. Porous Media: Fluid Transport and Pore Structure; Academic Press: Cambridge, MA, USA, 2012. [Google Scholar]
Figure 1. Typical particles and the corresponding 3-D scanning test results: (a) 13.2 mm crushed stone (CS); (b) test result of 13.2 mm CS; (c) 13.2 mm gravel (G); (d) test result of 13.2 mm G; (e) 2.36 mm CS; (f) test result of 2.36 mm CS; (g) 2.36 mm G; (h) test result of 2.36 mm G.
Applsci 09 00869 g001aApplsci 09 00869 g001b
Figure 2. S C m 2 for aggregates with size above 2.36 mm.
Applsci 09 00869 g002
Figure 3. Schematic of defined indicators for describing the two-size packing.
Applsci 09 00869 g003
Figure 4. Relationships between Ppvb and Pbvs in two-size packing (TSP) tests: (a) Loose filling test; (b) Dry-rodded test.
Applsci 09 00869 g004
Figure 5. Relationships between Ipf and Pbvs in TSP tests: (a) Loose filling test; (b) Dry-rodded test.
Applsci 09 00869 g005aApplsci 09 00869 g005b
Figure 6. Relationships between Va and Pbvs in TSP tests: (a) Loose filling test; (b) Dry-rodded test.
Applsci 09 00869 g006
Figure 7. Δ I p f C S G for the dry-rodded test.
Applsci 09 00869 g007
Figure 8. Δ V a C S G for the dry-rodded test.
Applsci 09 00869 g008
Figure 9. The differences of Ipf between 4.75 vs 2.36, 2.36 VS 1.18 and 16 VS 4.75: (a) Crushed stone; (b) gravel.
Applsci 09 00869 g009aApplsci 09 00869 g009b
Figure 10. The differences of Va between 4.75 VS 2.36, 2.36 VS 1.18 and 16 VS 4.75: (a) Crushed stone; (b) gravel.
Applsci 09 00869 g010aApplsci 09 00869 g010b
Table 1. Aggregate bulk density (g/cm3).
Size (mm)1613.29.54.752.361.18
Crushed stone2.7992.8022.7962.792.7372.68
Gravel2.5462.5382.5812.5652.5012.594
Table 2. Combinations of the two-size packing.
Bigger ParticleSmaller ParticleCombination NameSize Ratio
Size (mm)Size Range (mm)Size (mm)Size Range (mm)
1616–194.754.75–9.516 VS 4.750.297–0.5
1616–192.362.36–4.7516 VS 2.360.147–0.25
1616–191.181.18–2.3616 VS 1.180.074–0.124
4.754.75–9.52.362.36–4.754.75 VS 2.360.5
4.754.75–9.51.181.18–2.364.75 VS 1.180.25
2.362.36–4.751.181.18–2.362.36 VS 1.180.5
Table 3. Results of single-size packing (SSP) tests.
Size (mm)TypeVa (%) R D V a L R   ( % ) R D V a C S G   ( % )
LooseDry-RoddedLooseDry-Rodded
16CS45.4740.4111.1311.5511.00
G40.2235.9710.58
13.2CS44.1840.189.058.3013.04
G40.5134.9413.75
9.5CS47.2142.939.0614.8915.17
G40.1836.429.36
4.75CS46.5241.919.9016.6415.37
G38.7835.478.53
2.36CS47.4742.5210.4412.2210.83
G41.6737.919.03
1.18CS47.9244.117.955.277.25
G45.4040.919.89