Abstract
A laser ultrasonics approach to remotely characterize the elastic and thermal properties of a coating-substrate structure, used to protect fuel claddings in lead-bismuth eutectic cooled nuclear reactors, is presented and validated with experimental results. A transient grating geometry is used for multiple wavelength excitation of thermoelastic displacements, and laser beam deflection for detection. The value of Young’s modulus of the coating layer as calculated from the coating’s Rayleigh velocity of 190 ± 50 GPa is in accordance with a nano-indentation measurement. Using a priori knowledge concerning the density and elastic parameters of the coating and substrate, scanning the sample allows the obtaining of a coating thickness map in a fully remote, all-optical way, with an accuracy of about 4 microns for a coating of around 20-micron average thickness. Analyzing the transient thermal grating decay yields a thermal diffusivity value of × 10 m/s, in the range of low-carbon steels. The consistency of the results infers that the all-optical laser ultrasonics approach should be feasible for remote inspection of the quality of optically rough coated claddings in the harsh environment of a nuclear reactor.
1. Introduction
One of the possibilities for protecting and preserving structure materials in components in nuclear reactor cores, such as fuel claddings, is to apply a dedicated surface treatment. A promising technique is the alloying of strong oxide formers on the surface [1]. The so-called GESA (Gepulste Elektronen Strahl Anlage) surface alloying technique [2] uses intense pulsed electron beams to modify the surface properties of an alloyed steel material to change its microstructure (phase composition). This treatment is preceded by the deposition of a layer of another material on the surface of the base material by a certain method (thin film, galvanic or vapor deposition, etc.). The thickness of this layer is kept small enough to allow incident electrons to penetrate the whole layer. Next, the surface area is remelted by a pulsed electron beam that induces interdiffusion between the deposited layer and substrate material. To obtain good quality surface layers, it is required to heat and melt the treated areas within a single pulse duration [2]. The coating-substrate structures produced by this technique have very fine grain sizes (∼ nm). They are of high homogeneity and have a smooth surface (root mean square roughness RRMS < 3 m). Moreover, since the surface alloy is remelted by the electron beam, an improved bonding between the coating and substrate material can be achieved. Given the critical importance of protecting components in a nuclear reactor, and the harsh circumstances in terms of temperature and radiation to which protective coatings are subjected, regular and reliable quality control of their functional and structural properties is crucial for the viability of nuclear power stations. Once fuel claddings have been in operation, their radioactivity impedes the use of contact methods to characterize their condition. Remote inspection is therefore needed.
The aim of this work was to show the feasibility of laser ultrasonic inspection [3] to remotely extract both microscopic and macroscopic structural and functional information on quite rough fuel cladding GESA coatings, by determining the elastic and thermal properties of the coating layer and of the substrate, which are known to be strongly dependent on the microstructure. In many implementations of laser ultrasonics, the photoacoustic effect is exploited to convert an optical energy pulse into impulsive thermal expansion, which in turn launches acoustic waves. Typically, the propagation of guided acoustic waves is optically mapped. From the wave velocity (dispersion), damping and/or mode conversion, information on the elastic properties can be extracted. Quite some work has already been done on the use of laser ultrasonics to characterize the properties of optically smooth layers and coatings, with several applications in non-destructive testing [4,5,6,7]. In typical optical configurations, the pump laser light is focused onto a point or line [8], resulting in the photoacoustic generation of wideband surface acoustic waves, from which different parameters can be extracted, such as the thickness [9,10] and elastic and structural information of thin coatings [11,12,13,14,15]. In an alternative optical configuration, impulsive stimulated scattering of probe laser light by a laser generated transient thermal grating [16], detected by heterodyne diffraction [17,18], has shown to be a very efficient way to detect narrowband surface acoustic waves and extract the thickness [19] and elastic and structural parameters of coatings [20,21,22,23,24] and their bonding to a substrate [25], with important applications in electronics [26]. Analysis of the dispersion of optically detected laser generated surface acoustic wave also allows characterization of sub-surface layers [27]. Since also the thermal expansion that goes along with transient thermal gratings can be detected by heterodyne diffraction of impulsive stimulated scattering, the technique also allows determination of the thermal diffusivity of coatings and or substrates [28,29,30,31].
In the following, we report on the investigation of a steel substrate coated (T91 steel) with GESA modified FeCrAlY using laser ultrasonic excitation of surface acoustic waves (SAWs) and thermal waves in a narrowband grating geometry. Since the roughness of the sample surface and the resulting optical scattering of the reflected probe light made it difficult to apply heterodyne diffraction detection, a more robust beam deflection approach (LBD) [8] was used to detect the associated surface ripple. GESA treated steel is a candidate material for future use in structural reactor components. The remote, non-destructive character of the all-optical approach makes it potentially usable in the harsh and therefore difficult to access environment inside a hot cell used to store and inspect nuclear reactor components.
2. Materials and Methods
2.1. Sample
In Figure 1 two scanning electronic microscope (SEM) cross sections of the FeCrAlYr alloy/T91 steel coating-substrate interface are shown. Along the cross-cut in Figure 1a, a clear transition from the coating alloy to the bulk substrate can be distinguished at a depth of around m. The complementary SEM image of the focused ion beam (FIB) cut sample provides improved contrast between the phase domain orientations. This image infers a coating thickness of 30 m. The discrepancy between the two estimated thicknesses results from the poor coating-substrate interface contrast in the FIB/SEM image. As there exists a gradient in the element distribution, and therefore also in the microstructure along the depth direction, one can expect that the acoustic velocities of the coating layer differ from those of the bulk material, the differences being expectedly governed by the difference in density between the layers as a result of the larger aluminum content in the coating layer. The aluminum enrichment in the coating layer was confirmed by an energy-dispersive X-ray spectroscopy [32] measurement, as shown in Figure 1c, where brighter regions correspond to increased aluminum content. An optical photograph of the sample is depicted in Figure 1d. The chemical compositions of the two layers, listed in Table 1, were taken from [1].
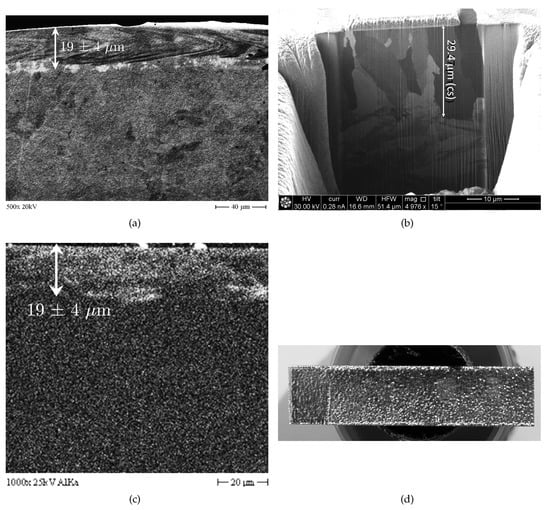
Figure 1.
(a) SEM image of a polished cross-cut of an AlFeCr alloy/T91 steel sample showing the coating-substrate interface with a coating thickness of ∼19 m. (b) SEM picture of FIB cut cross section of the sample reveals a gradient in the phase domain sizes along the depth direction, extending to 30 m in depth. (c) Aluminum enrichment in the coating layer as measured by the XEDS technique. Bright regions correspond to a larger aluminum content. (d) Photograph of the sample, depicting the macroscopic surface roughness.

Table 1.
Composition of the most abundant elements in the T91 steel substrate and FeCrAlY coating as measured in [1].
2.2. Characterization Approach
By virtue of its all-optical nature, laser ultrasonics was chosen to probe the structural condition of the GESA-steel sample. This method uses pulsed illumination to impulsively heat the sample surface and launch SAWs. Both the spatiotemporal evolution of the thermal expansion that witnesses the heat diffusion and the SAW velocity can be measured by monitoring the deflection of a reflected probe laser beam. The gradient in composition is expected to induce acoustic dispersion, with the Rayleigh velocity for the coating layer at high frequencies, which is different from the one of the T91 substrate at low frequencies. Due to the penetration depth of Rayleigh waves being of the order of the acoustic wavelength, and thus decreasing with increasing frequency, the value of the transition frequency from the substrate Rayleigh velocity to the coating Rayleigh velocity is directly linked to the thickness of the coating layer (Figure 2). For theoretical models predicting SAW dispersion in coating-substrate systems, we refer to references [33,34,35,36]. The steepness of the transition is determined by the ratio of the densities of the coating and the substrate, and by the smoothness of the chemical composition gradient [37]. Using those models, the relations between the elastic and thermal properties and respectively the SAW and thermal wave dispersion were numerically implemented as Matlab functions, which were then used for least square fitting the material parameters from the experimental data.
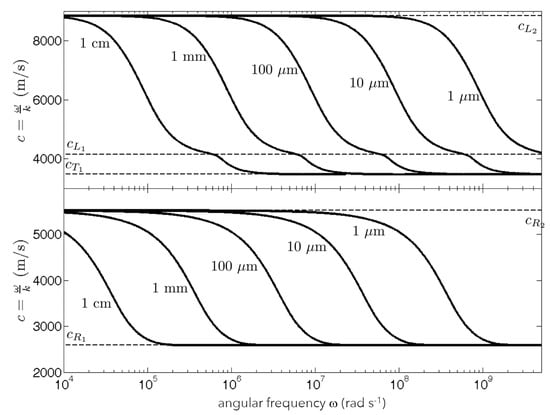
Figure 2.
Illustration of Rayleigh (bottom Figure) and Sezawa (top Figure) wave phase velocity dispersion [27,38,39] for a coating-substrate configuration, for different thicknesses of the coating (1, 10, 100, 1000, 10000 micron). The used material parameters are ( m/s, m/s, kg/m, m/s, m/s and kg/m). The Rayleigh wave velocity saturates at the value of pure coating and substrate material in the high and low frequency limit, respectively. The Sezawa wave velocity decreases from the longitudinal velocity of the substrate in the low frequency range till the longitudinal velocity of the coating , and then further decreases and saturates at the shear velocity of the coating .
Similar to acoustic waves, thermal diffusion is also characterized by a time dependent penetration depth, the so-called thermal diffusion length. In the case of a grating geometry of the generating light pattern, the time needed for the photothermally induced thermal expansion grating to fade away due to thermal diffusion is determined by the thermal diffusivity of the material and by the distance between the hot and cold regions of the grating, i.e., the grating spacing. In the case of an isotropic material, the thermal diffusion tangential to the surface happens at the same rate as the one normal to the surface. Therefore, the decay time of the photothermal part of the displacement signal is determined by the thermal diffusivity of top layer of the sample till a depth of the order of the grating spacing. As a result, the effective signal decay time in case of a coating-substrate sample is determined by the thermal diffusivity of the coating if the grating spacing is shorter than the coating thickness, and evolves to the thermal diffusivity of the substrate as the grating spacing is increased to beyond the coating thickness. For the theoretical modeling and numerical simulations of the photothermally induced surface grating displacement (versus grating wavelength) in a coating-substrate system, we refer to reference [40] for the photothermally induced temperature depth profile (which is causing the subsequent thermal expansion and diffusion in multilayers in general), and to references [18,41] for a full model for the temperature, strain depth profile, and surface displacement in a coating-substrate configuration.
The first objective of this article is to extract the acoustic dispersion curve at one location on the surface of the material, and to solve and verify the feasibility of the inverse problem, i.e., the estimation of the elastic properties and thickness of the coating layer. Figure 1a shows that the coating thickness varies slightly along the horizontal sample dimensions and is thus not uniform. These variations in coating thickness represent themselves in macroscopic roughness of the sample surface (provided that the substrate’s surface is sufficiently flat). Moreover, local fluctuations in the microstructural distribution alter the elastic properties of the coating, as expressed by a change in the velocity of SAWs at small gratings. Hence, a second objective of this article is to map the topographical variations in a XY-grid along a small surface area of the sample. Finally, a thermal dispersion curve is derived from the thermoelastic signals, and the thermal contrast between the coating layer and the substrate is extracted.
3. Thermoelastic Topography of GESA Coating: Experimental Setup
Heterodyne diffraction detection of impulsive stimulated scattering (ISS-HD) is the most commonly used technique for detecting transient grating signals [17,18]. However, the sample under consideration had a substantial optical roughness ( m) and surface polishing was not an option. ISS-HD requires mirror polished sample surface quality and thus could not be used to extract the SAW’s phase velocities as a function of decreasing SAW wavelengths. In view of that, we have made use of a grating induced laser beam deflection (GILBD) setup, which combines grating excitation to excite and detect SAWs at wavelengths of choice on the sample surface, and a laser beam deflection setup to detect the tangential component of the gradient of the normal surface displacements induced by the waves. The setup, shown in Figure 3, combines the excitation and detection setups depicted in Figure 4 and Figure 5. As our objective was not only to characterize the sample elastically but also thermally, the excitation and detection points were aimed at the same spot on the sample. In this way the probe signal was also including the displacement component that was photothermally induced by thermal expansion, and its decay due to thermal diffusion. Merging of the excitation and probe laser beams was achieved by means of a polarizing beam splitter that escorted the pulse beam on the path of the probe beam. A quarter wave plate was used to change the polarization of the reflected beams so that they were guided by the polarizing beam splitter to the photodetector.
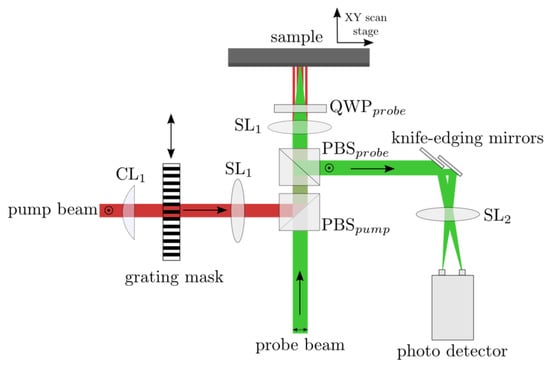
Figure 3.
Schematics of the GILBD setup. In this setup, grating excitation, explained in Figure 4 and laser beam deflection (Figure 5) are combined to excite and detect narrow band SAWs. A first polarizing beam splitter (PBS) guides the pump beam in the path of the probe beam. A QWP in front of the sample alters the polarization of the probe beam to guide the reflected probe beam towards the photodetectors by a second PBS. The phase mask and sample were mounted on stepping motors to allow for the experimental extraction of thermal dispersion curves, and for topographical mapping.
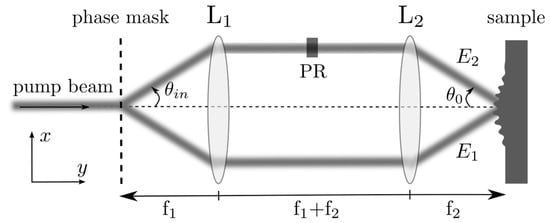
Figure 4.
Schematics of a wavenumber excitation setup using a diffraction phase mask to split a pump laser beam into a set of excitation beams, phase shifted with a Phase Retarder (PR). Here, only the first diffraction orders are shown. Using an imaging lens system with magnification factor the two waves are mixed under an angle on the surface resulting in a periodic interference pattern.
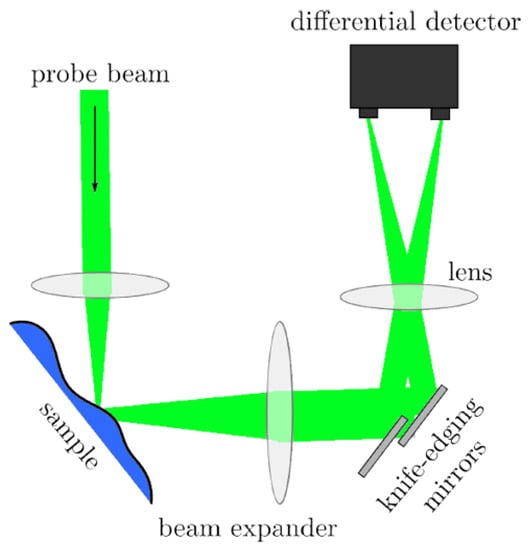
Figure 5.
Schematics of the LBD detection setup. A surface deformation, resulting from laser excitation of thermoelastic phenomena, deflects an incident probe beam. The deflection is monitored by a differential photodetector using knife-edging mirrors.
Topographic mapping of the coating’s elastic properties was facilitated by mounting the sample on an XY-scanning stage (Physik Instrumente M-168 linear actuators with a C-530 stepping motor control, 0.25 m incremental resolution).
Also the phase mask diffraction grating, which was used to split the excitation beam in multiple diffraction beams, which were mixed further on by a 4F imaging system, was mounted on a linear scanning stage in order to change the relative position (in steps of 0.5 m) of the imaged excitation grating’s dark and light regions with respect to the detection spot. In this way the time evolution of the transient thermal grating could be reconstructed, allowing the extraction of the wavelength dependent effective thermal diffusivity of the sample to construct the thermal dispersion curve [30]. Since the fringe pattern in practice contained more than one wavenumber component (as a consequence of the not perfectly sinusoidal profile of the phase mask, thus generating higher order diffracted beams besides the ±1 orders), more than one wavenumber dependent thermal decay profile could be extracted from a single signal, by Fourier transforming the signal to wavenumber-time domain. The dynamic variations of the light intensities of the knife-edged probe beams were collected by two differential photodiodes: one fast, AC-coupled differential photodiode (Hamamatsu S5973 photodiodes with Femto HSA (10 kHz–2 GHz) amplifier), whose signal was recorded by an Agilent 54832B Infiniium oscilloscope (4 GHz sampling rate), and one slow differential photodiode (Hamamatsu S5973 photodiodes with Femto HCA (200M-DC) amplifier) connected to an Agilent 54832A Infiniium oscilloscope (2 GHz sampling rate). The repetition rate of the pump laser was 1000 pulses per second. However, due to memory depth and transfer time limitations of the oscilloscopes, the effective averaging time was about 50Hz, implying that only one laser pulse induced signal in 20 was effectively used to average over 4096 triggers. As the acoustic period was much shorter (0.1–10 ns) than the thermal decay time (0.1–10 s), in order to adequately and simultaneously capture both the acoustic and thermal signal contribution, the SAW were recorded by the fast detection system, while the thermal decay signals were collected by the slow one. The two recordings were done simultaneously.
Roughly speaking, the spatial resolution of the method is determined by the size of the grating patterns. In the implemented setup the excitation region had a length of about 2 mm (along the grating axis) and a width of about 2 mm (perpendicular to the grating axis). The probe beam spot diameter was about 5 microns.
Two distinct GILBD scanning approaches were taken: (i) “local detailed grating spectroscopy” for a set of 10 grating spacings varying between 7 and 200 m (range in which the signal quality was ok for the used laser spot sizes) and (ii) “topographic mapping” of a sample surface area (2 mm × 2 mm), by performing an XY scan for a set of four different grating spacings (15, 25, 45 and 200 m with a scanning step of 50 m (and 1 m for signal optimization) in the x-direction and 100 m in the y-direction. To limit the total measurement time to a reasonable amount, the combined experiment, i.e., scanning the grating mask for a set of gratings while the surface area is scanned was not implemented.
The first experimental approach aimed at the extraction of a detailed acoustic and thermal dispersion curves on one representative location on the sample surface. Analysis of photoacoustic and photothermal components of the GILBD signals for 10 grating spacings yielded the SAW phase velocity and effective thermal diffusivity corresponding to respective penetration depths of the acoustic and thermal fields. Scanning the position of the diffraction grating with respect to the probe beam and taking a spatial Fourier transform of the signal allowed the accurate determination of the absolute excited fringe distance, of which the value was needed for calculating the Rayleigh velocity and thermal diffusivity.
In the second experimental approach, the SAW phase velocities were measured along the surface of the sample by scanning the probe and pump beams. Four grating spacings were used: SAWs generated at grating spacings (15, 25 m) mainly allowed sampling of the coating, a grating spacing of 45 m yielded points on the SAW dispersion curve in the transition region from the coating to the substrate regime, and a SAW wavelength of 200 m was employed to probe deep into the substrate. For each of the four wavelengths, the GILBD signal was acquired by scanning the probe beam along a linear array of points within the targeted surface area, over multiple maxima and minima of the excitation laser grating, and the magnitude of the signal grating () was determined by a spatiotemporal Fourier transform of the signal. As the laser beam deflection detection setup is quite sensitive to scattering caused by the roughness of the sample surface, an iterative position optimization algorithm was used that optimized the S/N (Figure 6). Essentially, around every position of interest, small steps in the sample position were set, until the grating signal magnitude was larger than a threshold value , i.e., until the S/N ratio was considered sufficient.
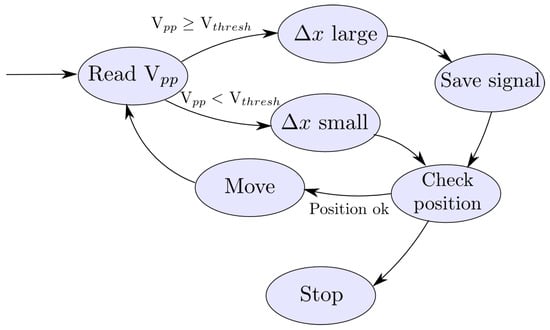
Figure 6.
Schematic representation of the scanning algorithm for the topographical mapping of the GESA coating’s elastic properties.
4. Local Acoustic Dispersion Curve of GESA Modified Sample
In order to determine a local acoustic dispersion curve of the GESA coated sample, the transient grating evolution of the tangential component of the gradient of the normal displacement at the surface of the GESA modified coating-substrate sample was detected by the GILBD setup for a set of 10 different diffraction grating spacings ranging between 200 and 18 m and which were scanned laterally with a scanning step of d m. As mentioned above, for each grating spacing, multiple wavenumber components were excited, because of the non-sinusoidal glass etch relief of the diffraction mask. As a beneficial consequence, for each fundamental grating spacing, multiple points on the acoustic dispersion curve could be extracted. In Figure 7a the acoustic spatiotemporal evolution of the laser beam deflection signal profile at the coating surface of the GESA modified sample is shown for a grating spacing of 120 m. The slowly varying thermal decay was removed by a 1st order high-pass filter with a cut-off frequency of 2 MHz to enhance the visibility of the acoustic signal contribution. Each horizontal line corresponds to a particular spatial position of the diffraction grating. Since the location of the detection point was not altered during the spatial scan of the diffraction grating, each line appears to be phase shifted with respect to the previous line. As a result, a spatiotemporal rhombus pattern is created due to the crossing of right- and left-traveling surface waves with a wavelength of 120 m. SAWs with a smaller wavelength component appear as nearly vertical lines as they propagate with a higher frequency. As a consequence of the asymmetric location of the detection point with respect to the center of the Gaussian spatial profile of the laser beam, a relatively large portion of left-traveling waves were detected. In order to select the acoustic traces corresponding to the discrete wavenumber components, a one-dimensional spatial Fourier transform was calculated. The result of this operation is depicted in Figure 7b. Each bright line accords to a particular wavenumber component of the acoustic field. Especially the discrete wavenumber mm, corresponding to the fundamental wavelength of m is clearly visible. In Figure 8a, the temporal evolution of the normalized signal is plotted for several these bright lines. Each of the lines carries information about the dispersive relation between the phase velocity and frequency/wavelength, which can be extracted after transforming the time signal into Fourier domain, as is shown in Figure 8b. Using a Lorentzian frequency peak fitting procedure, the fundamental frequency of each signal was extracted. This procedure was repeated for all the 10 grating spacings resulting in a complete acoustic dispersion curve. The width of the SAW frequency peak was used as the uncertainty of the extracted frequency. Together with the wavelength of the SAW, which could be exactly calculated using the wavenumber component of the bright line of local maximal displacement in Figure 7b, a particular phase velocity was associated with each frequency-wavelength couple. The resulting experimental dispersion curve is shown in Figure 9. As error bars, we have taken the widths at half maximum f of the respective peaks in the signal spectrum, and the propagated uncertainties on the phase velocity c, via . The relative uncertainty on the grating spacing was much smaller than the one on the frequency, so that it could be considered as negligible.
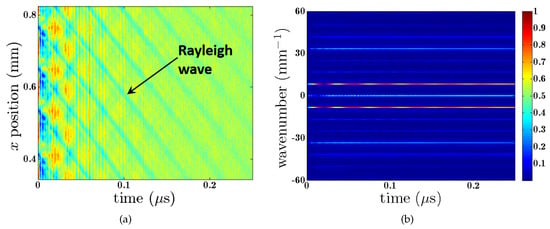
Figure 7.
(a) Normalized -dependence of the high-pass filtered laser beam deflection signal at the coating surface of the GESA modified sample, excited by a transient grating with a fringe of 120 m. The diffraction grating was scanned (dx = 0.5 m) in the direction of wave propagation. To guide the eye, Rayleigh waves with a wavelength of 120 m are indicated. (b) Normalized -signal of the logarithmically scaled signal obtained after performing a one-dimensional Fourier transform along the x-direction of the signal in (a). By virtue of the non-sinusoidal glass etch relief of the diffraction grating, multiple wavenumber components were excited, emerging as relative bright horizontal lines in the Figure.
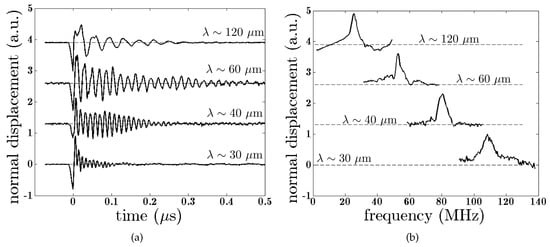
Figure 8.
(a) Set of acoustic signals selected from Figure 7b with a relatively large wavenumber component. The extracted signals contain wavelength components corresponding to = 120/k with They were obtained after high-pass filtering the thermoelastic signal. (b) Corresponding spectra of (a), revealing spectral peaks corresponding with SAW components at different wavelengths.
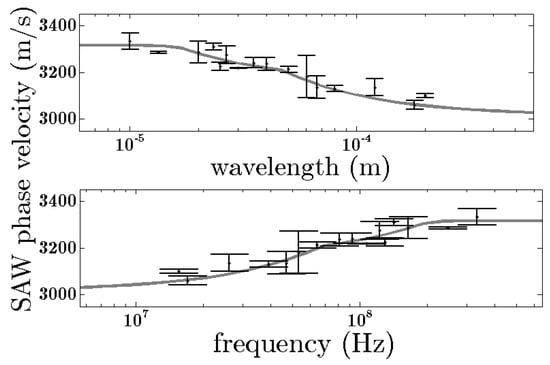
Figure 9.
Experimental data obtained from the signal traces in Figure 8 and best parameter fitted coating-substrate dispersion curve (solid gray line), as a function of wavelength (top) and frequency (bottom). The fit was obtained by assuming a substrate’s Rayleigh velocity of 3024 m/s, taken from [42].
The experimental dispersion curve was fitted with the thickness d, the density and the Rayleigh velocity of the coating material as fitting parameters, while keeping the substrate’s density and Rayleigh velocity fixed at known literature values of kg/m and m/s [42]. The resulting fitted dispersion curve is shown, together with the experimental data, in Figure 9. In Table 2, the best fitting parameters, together with their least-squares uncertainties, are listed. Via the relations and [43,44], the Young’s modulus and of the coating and substrate materials, respectively, were derived. For Poisson’s ratio, have used ad hoc a value of 0.3, which is roughly equal to the value of T91 steel [1,42] and of FeCrAlY [45]). The relatively large uncertainty on the calculated Young’s modulus of the coating layer can primarily be attributed to fitting covariance with the coating density, which unfortunately is inherent to this inverse problem.
Taking into account the (relatively large) margin of uncertainty, the extracted value of m for the coating thickness is consistent with the thickness of 19 ± 4 m as estimated from the SEM images in Figure 1.
The value of density of the coating material ( 10 kg/m) is smaller than the one of the substrate (7.65 × 10 kg/m). This can be explained by the inherent lower density of the alloy components, as depicted in Table 1.
To investigate the validity of these results, the Young’s modulus of the specimen was independently measured by a (destructive) nano-indentation measurement using a Berkovich tip and small loads (∼100 mN) [46,47]. At 12 points, selected arbitrarily along the surface of the sample, an indent was made, resulting in a displacement-load curve from which a local Young’s modulus could be calculated [47]. The penetration depth never exceeded 2 m, assuring that only the elasticity of the coating layer was probed. To obtain a representative value of the coating’s elasticity, the Young’s moduli of the 12 points were averaged, resulting in an average value of GPa. Hence, within a (relatively large) margin of uncertainty of 50 GPa, this value is consistent with the one obtained by the GILBD laser ultrasonic experiment. In reality, the hypothesis of a very sharp transition between the substrate and the coating layer, as assumed in the used idealized two-layer model, is not fulfilled for the GESA modified coating-substrate interface. It is also possible that Young’s modulus of the material in the thin, micron range depth probed by nano-indentation, is effectively different from the average value of Young’s modulus as probed by the SAW method. To cope with this, the theoretical model could be improved by assuming a gradual transition (e.g., a skewed hyperbolic tangent function) in the elastic properties of the substrate to those of the coating layer. The transition zone could then be discretized in N layers locally uniform, for which a system of equations reflecting the continuous boundary conditions at the interfaces is determined [35]. For a detailed discussion on the influence on the SAW dispersion curve of a gradual transition zone between a coating and substrate, we refer to [37].
5. Thermoelastic Topography of GESA Coating: Topographic Mapping
In this section, the results of the topographic mapping using the XY-scanning algorithm explained in Section 3 are discussed. As this measurement is very time consuming (∼24 h per wavelength for a grid of points), a limited set of four, well-chosen, grating spacings (15, 25, 45 and 200 m) was used to sample the dispersion curve in the 2 mm × 2 mm surface area.
Figure 9 illustrates that the wavelengths that would be needed for SAWs to propagate with a velocity equal to the Rayleigh velocity of the steel substrate are of the order of 1 mm, which is too large for the GILBD experimental setup. Hence, for each position , a priori information of the Rayleigh velocity of the substrate was used by adding a point m/s in the long wavelength limit ( = 1 mm) of the experimental dispersion curve. Figure 10 depicts the wavelength dependent phase velocities resulting from the interpolation of the phase velocities on optimized locations resulting from the optimization algorithm, to a regular rectangular grid consisting of points. The color scale in all images in Figure 10 is the same. Comparing them allows observation of a general trend of increasing phase velocity with decreasing wavelength. At the wavelength of 200 m, the spatially averaged phase velocity reaches about 3087 m/s. The velocity increases to 3229 m/s for the 45 m grating spacing. As discussed earlier, the latter wavelength corresponds to a SAW penetration depth where the SAW velocity lies in between the values of the coating and the substrate. When the SAW wavelength is decreased towards 25 and 15 m, corresponding with wavelengths at the coating asymptote, the average phase velocity increases further to respectively 3230 m/s and 3335 m/s. Due to an insufficient number of data points in the neighborhood of mm and mm, as a poor signal quality due to high roughness induced scattering of the reflected probe beam light in that region, the values at these points were obtained by effectively extrapolating the known phase velocities, and only serve for display reasons.
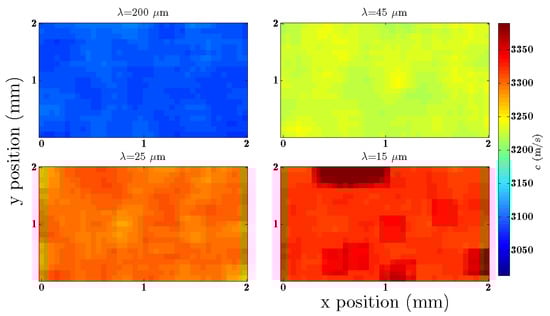
Figure 10.
Topographic image of the position dependent phase velocities for a set of four different gratings. These images are the result of an interpolation executed on the rough, wavelength dependent, phase velocities along a grid of 21 × 40 points in the -plane. The same color scale is used for all the four images to compare the phase velocities mutually.
A dispersion curve consisting of phase velocities evaluated at five wavelengths, including the hypothesized wavelength of 1 mm, can be attributed to each coordinate located on the rectangular grid. As in the previous section, three parameters were fitted for each dispersion curve , i.e., the coating thickness, density, and Rayleigh velocity, while the substrate’s density and bulk velocities were kept fixed. A least-squares curve fitting algorithm (lsqcurvefit in Matlab) was used to fit each local dispersion curve, using a SAW propagation dispersion curve function based on references [33,35]. In Figure 11a–c the resulting topographic maps of the best fitting parameters are shown. To ease interpretation, a contour plot with lines of isovalues was added to each surface plot.
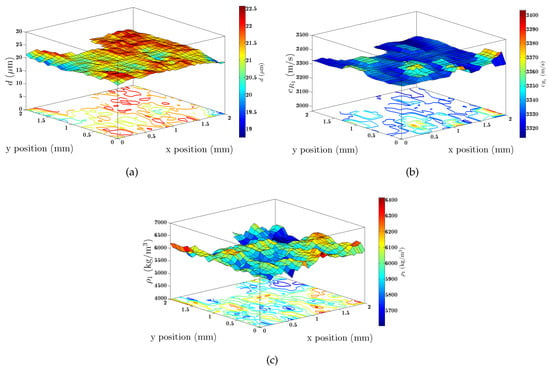
Figure 11.
Surface plots of the best fitting parameters ((a) coating thickness, (b) coating Rayleigh velocity and (c) coating density) obtained by fitting each position dependent acoustic dispersion curve to the coating-substrate model. For the sake of clarity, contours of constant parameter values were added to each surface plot. Around mm and mm no results are shown due to poor data quality at these positions.
For further interpretation, the average values and average deviations from average of the 3 fitted parameters, i.e., the Rayleigh velocity, density and thickness of the coating are listed in Table 3. Comparing the values with the ones in Table 2 learns that the deviations are smaller than the respective fitting uncertainties, inferring that the values represent an upper limit for the effective topographic variations. Using the earlier motivated assumption of a value of 0.3 for Poisson’s ratio, the Rayleigh velocity and density can be combined to obtain the Young’s modulus. The results allow a conclusion that the average Young’s modulus is about 203 GPa with a standard deviation of maximum 46 GPa, which is again smaller as the respective fitting uncertainty. The same holds for the variations on the determined coating thickness.
Table 3.
Average value and topographic variation of each best fitting parameter along the scanned surface area of the GESA modified coating—T91 steel substrate sample.
To discriminate more clearly between true sample variations and variations due to experimental factors, an additional experiment was carried out. Two scans were performed on the same rectangular area (though different from the one in the previous experiment), but with a different scanning order. In a so-called XY scan, x-rows were scanned one by one along the y-direction, while in a YX scan, the y-columns were scanned one by one in the x-direction. As before, the three coating parameters (Rayleigh velocity, density and thickness) were fitted for all scanned positions. Figure 11 shows that very little to no correlation is present between the resulting topographic distributions of the three parameters of the two scans.
To reduce the number of degrees of freedom, additional fits were performed, in which, for the sake of easy comparison, the coating thickness was set as the only fitting parameter while ad hoc fixing the Rayleigh velocity and density of the coating and substrate layer to the values depicted in Table 2 and Table 3. Interestingly, the resulting XY and YX maps, shown in Figure 12, show a large spatial correlation, validating the reproducibility of the technique. Moreover, the topographic variations are quite large compared to ones in the map in Figure 11a, with outliers up to 7 m.
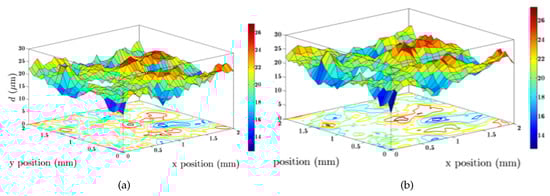
Figure 12.
Surface plots of the best fitting coating thickness as measured by a XY (a) and YX (b) scan. Around mm and mm no results are shown due to lack of data at these positions. A large correlation between the two scans is apparent.
This observation allows a conclusion that on one hand, due to fitting degeneracy, by which variations in one parameter are wrongly transferred to variations in the fitting values of the two other parameters, the fitting uncertainty on 3-parameter fits is too large to perform reliable topographic mapping. However, for the sample under investigation, it is reasonable to assume that the material composition, and thus the Rayleigh velocity and density are uniform, or at least much more uniform than the thickness. When implementing this by fixing the Rayleigh velocity and density values, reasonable variations of the fitted coating thickness are found, which are moreover consistent between XY and YX scans.
From the topographic variations on the coating thickness in Figure 12a,b, and assuming a flat coating-substrate interface, the coating thickness variations were interpreted as an estimate for the surface roughness. The value of m was consistent with the roughness value of 2.18 m found by white-light interferometry [48,49], inferring the validity of the assumption about the flat interface.
It should be noted that in the previous analysis the effect of surface roughness on the SAW frequency content was neglected in the theoretical model describing the SAW propagation. From the image in Figure 13, an estimate for the roughness correlation length, represented by the average distance between two local peaks in the topographic image, of m was obtained. In [50,51,52] it was shown that surface roughness leads to a shift of the SAW frequency, mainly because of scattering, which introduces deviations from a straight travel path, and thus apparent slowing down of the wave. Provided that the SAW wavelength is much larger than the absolute roughness and roughness correlation length, a sufficient number of scatterers take part in the attenuation of the wave such that the frequency shift is inversely proportional to the square of the roughness scale. Inadvertently, this frequency shift alters the real SAW dispersion. However, in [53], Equation (13) shows that the attenuation tends to a constant value when the SAW wavelength moves towards the small wavelength limit (), as a result of an insufficient number of scatterers. The attenuation constant then becomes with C a function of the surface material elasticity. For the GESA modified coating this constant can be calculated as . Together with the roughness parameters extracted from Figure 13, an attenuation constant of m is obtained, which corresponds to an acoustic mean free path of almost 9 m. In view of this, neglecting the scattering induced shift in the dispersion curve was a valid assumption for the wavelengths used in the current GILBD setup.
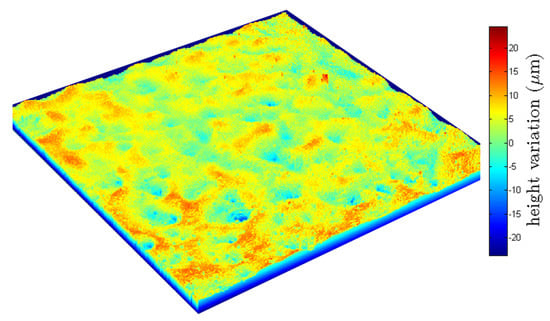
Figure 13.
Topography of the GESA modified sample surface obtained by white-light interferometry [48,49], revealing the coating roughness ( value around 2.18 m) on a mm scale.
6. Thermoelastic Topography of GESA Coating: Thermal Dispersion Curve
In [30], the concept of thermal wave dispersion in a coating-substrate sample undergoing transient thermal grating excitation was introduced. It was shown how a thermal dispersion curve could be constructed by assigning an effective thermal diffusivity to the transient ISS signal that describes the decay of the thermal expansion grating for a given fringe spacing. When this wavelength is of the order of the coating thickness, the effective diffusivity takes a value in between the coating’s and substrate’s thermal diffusivity. The current section aims at the extraction of a thermal dispersion curve for the GESA modified coating-substrate material. Here, the large timescale -signals resulting from the grating scan experiment were analyzed. These signals were recorded by the slow DC photodetector to capture the slow decaying thermal transient, while discarding the fast acoustic oscillations. Figure 14a shows a color scale map of the obtained -signals for one of the applied gratings. As already mentioned above, as a result of interference between multiple phase mask diffraction orders, the fringe pattern is not sinusoidal. It contains wavenumbers of, besides the fundamental wavelength of 35 m, also higher harmonics, as is depicted in Figure 14b. In this Figure, these can be distinguished as horizontal bright lines at the discrete wavenumbers k = 28.6 N.mm with . Thermal decay transients corresponding to discrete wavelengths thus can be extracted by isolating each of the horizontal bright lines. For each excited fundamental wavelength, a set of one to two time signals could be extracted.
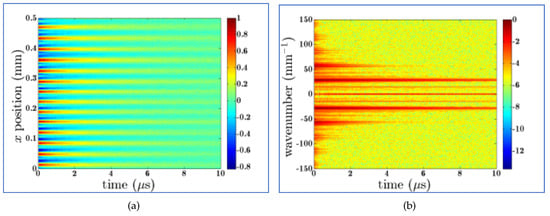
Figure 14.
(a) Normalized -signal of the thermal decay at the coating surface of the GESA modified sample excited with a fringe of 35 m. The diffraction grating was scanned (dx = 0.5 m) in the wave propagation direction. (b) Normalized -signal of the logarithmically scaled thermal decay profile obtained after performing a one-dimensional Fourier transform along the x-direction of the signal in (a).
In Figure 15 the obtained thermal decay signals are shown together. The acoustic oscillations are somehow masking the thermal diffusion evolution. However, we have chosen not to low-pass filter them out, to avoid deformation of the thermal decay. Also, since the oscillation amplitude of the acoustics is fairly symmetric around the slow-varying thermal envelope, the effect of these oscillations is averaged out when considering the underlying transient grating decay.
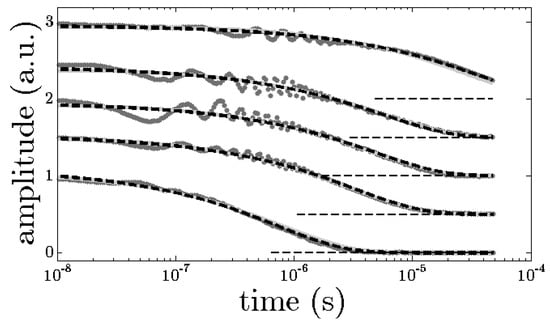
Figure 15.
Set of time signals as extracted from the most dominant wavenumber components resulting from the thermoelastic excitation using grating spacings between and 120 m. As a result, of the long the thermal decay rate of the m line the signal was cut by the recording oscilloscope before it effectively became zero. Also, the best fitting curves according the two-layered thermal limit of the thermoelastic model (solid gray line) and a fit with a complementary error function (dashed black line) with a distinct effective diffusivity for each wavelength line are shown.
Using the thermoelastic limit of the governing equations [17,30], the thermal diffusivity of the GESA modified coating layer can be extracted by a procedure that fits the transient traces in Figure 15 to the thermal two-layered model. Rather than associating an effective thermal diffusivity to each trace, all traces were introduced to the fitting process at once, aiming at the estimation of the individual coating and substrate diffusivities. In this way small deviations in the thermal diffusivity between the traces were effectively averaged out. Most of the coating’s thermal information is carried by the first decaying part of each thermal trace. However, as a result of the equidistant sampling, this part only comprises maximally 10% of the available data. To account for this, the first part was relatively promoted by interpolating all the data points using logarithmically spaced time points and cutting the signals after the amplitude becomes effectively zero. The inverse problem was then tackled by minimizing the least-squares cost function summed over all the traces using the two-layered thermal model with the wavenumber component as an input. Only the thermal diffusivity of the coating layer and the amplitude of each signal were set as a fitting parameter, all the other parameters needed (substrate diffusivity, coating thickness, densities, acoustic bulk velocities, heat capacities and thermal expansion coefficients) were fixed in the fitting procedure. For the T91 substrate, literature values of the thermoelastic parameters of [42] were assumed, while the obtained best fitting parameters (coating thickness, coating density and acoustic velocities) of the elastic experiment in Section 4 were used as fixed coating parameters. The heat capacity and thermal expansion coefficient of the coating layer were set equal to those of the substrate. These ad hoc assumptions are feasible in view of the variability of values of the specific heat capacity and thermal expansion coefficient of similar solids being quite limited, compared to the thermal diffusivity, which, via the thermal conductivity, is strongly structure dependent. The values of the fixed parameters are listed in Table 4.
Table 4.
Assumed values for the fixed thermoelastic parameters in the fitting process aiming at the extraction of the thermal diffusivity of the coating in the GESA modified material. The best fitting thermal diffusivity of the coating layer is printed in bold.
Figure 15 shows the experimental data together with the resulting best fitting curves according the two-layered model. For the sake of easy comparison and validation, a curve following a complementary error function with an effective diffusivity was added for each individual trace. The two-layered model fits the experimental data reasonably well, with only a little discrepancy between the two-layered model and the curves corresponding to an effective diffusivity. This demonstrates that for this case the effective diffusivity is a good approximation of the full model. The best fitting thermal diffusivity of the coating layer was ) × 10 m/s, as is also depicted in Table 4. This value lies in the range of thermal diffusivities of low-carbon steels, i.e. between 2 × 10 and 13× 10 m/s [54,55].
In Figure 16 the least-squares cost function was plotted as a function of the coating’s thermal diffusivity, showing a unique minimum around the best fitting value. From the fitted parabolic function, a relative fitting uncertainty of about 32% could be extracted. The value of the extracted thermal diffusivity of the coating layer reveals a measurable contrast between the thermal properties of the coating and substrate material (that was fixed in the inverse problem), which should result in thermal dispersion. In Figure 17 it is shown that the effective thermal diffusivity starts from the coating’s diffusivity at small wavelengths and then shifts to values intermediate between the coating and substrate diffusivity for increasing wavelengths before asymptotically reaching the substrate’s diffusivity. At the maximum experimental wavelength over coating thickness ratio of about 5, the effective diffusivity should already be largely affected by the substrate.
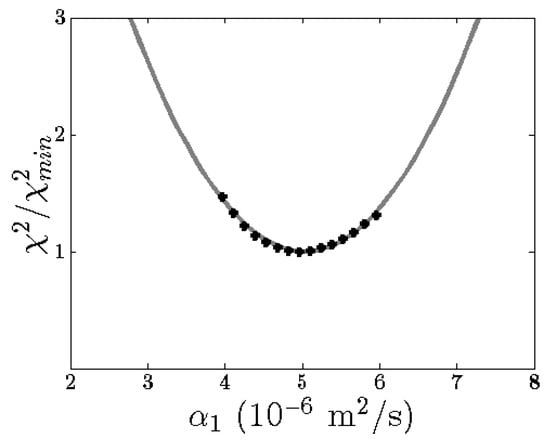
Figure 16.
Dependence of the least-squares fitting cost function on the thermal diffusivity of the coating layer, together with its best parabolic fit. For this cost function, only the coating diffusivity was kept as a variable, all other thermoelastic properties of the coating-substrate material were kept fixed. The least-squares cost function shows a unique minimum around the best fitting parameter of m/s.
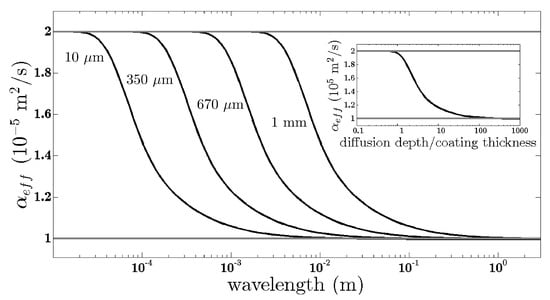
Figure 17.
Example of a thermal dispersion curve, i.e., of the effective diffusivity as a function of the wavelength, for an aluminum-aluminum coating-substrate structure with a coating thickness ranging from 10 m to 1 mm. The lines of constant thermal diffusivity of the coating ( m/s) and the substrate ( = 1 × 10 m/s) were added to guide the eye. The inset shows the effective diffusivity as a function of the dimensionless diffusion depth over wavelength ratio were all the curves are coincident.
For the sample under investigation, a thermal dispersion curve was calculated using the assumed and fitted parameters in Table 4. The result is shown in Figure 18, together with the individual experimental effective thermal diffusivities. Within the experimental wavelength range, the effective thermal diffusivity along the simulated curve is at most 6% larger than the extracted coating’s thermal diffusivity. This indicates that the applied wavelengths are essentially insensitive to the substrate layer, but they are adequate to efficiently probe and characterize the coating layer. Consequently, if the thermal diffusivity of the substrate layer was left unknown, no information about the thermal dispersion could be extracted. Moreover, the discrete effective thermal diffusivities also show no significant dispersion, at least as can be measured within a margin of error defined by the scatter on the data points. Therefore, it should be expected that the average of the discrete effective diffusivities lies close to the extracted diffusivity of the coating layer. With an average value of about 5.1 × 10 m/s, a difference of only 3% with the pure coating’s diffusivity could be obtained.
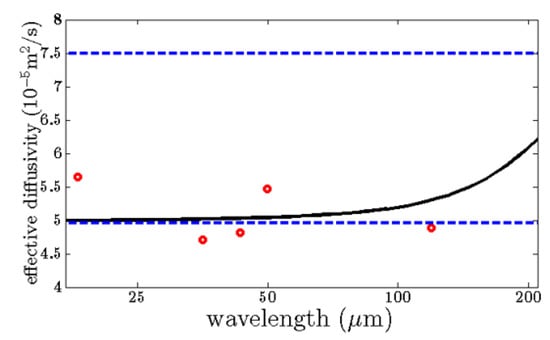
Figure 18.
Simulated thermal dispersion curve (solid gray line) for the GESA modified material using the obtained fitting results. The dispersion curve is bounded by the thermal diffusivities of the coating and substrate. Also, effective thermal diffusivities extracted from each decay trace in Figure 15 were added (open red circles). The scatter on these points reveals the experimental uncertainty.
7. Conclusions
A study of a GESA modified coating-substrate material was performed using transient grating excitation and laser beam deflection detection. Two types of experiments were carried out. By scanning the position of the excitation grating with respect to the detection position, the spatiotemporal thermoelastic response of the tangential component of the gradient of the normal displacement at the sample surface was obtained. Transformation to wavenumber-time domain allowed extraction of the elastic and thermal properties of the coating layer. The effective coating thickness found for the GESA modified coating was found to be consistent with the thickness range found by SEM analysis. The value of Young’s modulus of the coating layer as calculated from the coating’s Rayleigh velocity was in accordance with a nano-indentation result. However, as a result of fitting covariance, the relatively large uncertainty on the extracted coating density was transferred into a large most squares uncertainty on the value of Young’s modulus. Narrowing this uncertainty would thus require a priori knowledge of the coating’s density. From the same experiment, it was possible to extract a thermal dispersion curve, provided fixing the thermal diffusivity of the substrate material at a known literature value. The fitted value of the thermal diffusivity of the GESA coating was found to be about 2 times smaller than the one of the T91 steel substrate.
The second experiment aimed at the visualization of topographic thickness and elastic strength variations. This was achieved by scanning the coincident pump and probe beams along a two-dimensional grid spanning a surface area of 2 mm × 2 mm for a set of four well-chosen grating spacings. To cope with signal quality deterioration due to optical scattering, an adaptive algorithm was used to iteratively modify the relative positioning between the scanning grid position and the probing location till a satisfactory signal to noise ratio was obtained. The resulting mappings showed that on one hand, for the current measurement technique and sample under investigation, quantitative information about the topographic variations of the three coating parameters could not be extracted simultaneously. Using a larger number of excited wavelengths would reduce the margin of uncertainty, and topographic variations should become visible. A complementary approach, i.e., limiting the unknowns to the coating thickness only, led to satisfactory results, with coating thickness maps that were found to be consistent when comparing scanning results obtained according to different patterns.
Author Contributions
B.V.: Software, Formal Analysis, Investigation, Writing—Original draft preparation; J.S.: writing—Review and Editing; T.V.d.D.: investigation, Resources, Validation; P.S.: supervision, project administration, funding acquisition; C.G.: conceptualization, writing—Review and Editing, Supervision, Project administration.
Acknowledgments
The authors would like to thank KU Leuven (C1-project OPTIPROBE—C14/16/063), FWO-V/SCK-CEN (aspirant scholarship BV) for financial support. Marco Gandolfi is acknowledged for his kind help with typesetting.
Conflicts of Interest
The authors declare no conflict of interest.
References
- Weisenburger, A.; Heinzel, A.; Müller, G.; Muscher, H.; Rousano, A. T91 cladding tubes with and without modified fecraly coatings exposed in lbe at different flow, stress and temperature conditions. J. Nucl. Mater. 2008, 376, 274–281. [Google Scholar] [CrossRef]
- Mueller, G.; Engelko, V.; Weisenburger, A.; Heinzel, A. Surface alloying by pulsed intense electron beams. Vacuum 2005, 77, 469–474. [Google Scholar] [CrossRef]
- Hutchins, D.A. Ultrasonic generation by pulsed lasers. Phys. Acoust. 1988, 18, 21–123. [Google Scholar]
- Zamiri, S.; Roither, J.; Reitinger, B.; Bauer, S.; Gruen, H.; Burgholzer, P. Laser Ultrasonic Velocity Measurement for Phase Transformation Investigation in Titanium Alloy. In Proceedings of the 2013 IEEE International Ultrasonics Symposium (IUS), IEEE International Ultrasonics Symposium, Prague, Czech Republic, 21–25 July 2013. [Google Scholar]
- Viens, M.; Drolet, D.; Blouin, A.; Monchalin, J.P.; Moreau, C. Nondestructive characterization of plasma sprayed coatings by laser ultrasonics. In Thermal Spray: Practical Solutions for Engineering Problems; Berndt, C.C., Ed.; ASM International: Geauga County, OH, USA, 1996; pp. 947–951. [Google Scholar]
- Murray, T.W.; Balogun, O.; Steen, T.L.; Basu, S.N.; Sarin, V.K. Inspection of compositionally graded mullite coatings using laser based ultrasonics. Int. J. Refractory Met. Hard Mater. 2005, 23, 322–329. [Google Scholar] [CrossRef]
- Yan, G.; Raetz, S.; Chigarev, N.; Gusev, V.E.; Tourna, V. Characterization of Progressive Fatigue Damage in Solid Plates by Laser Ultrasonic Monitoring of Zero-Group-Velocity Lamb Modes. Phys. Rev. Appl. 2018, 9, 19. [Google Scholar] [CrossRef]
- Neubrand, A.; Hess, P. Laser generation and detection of surface acoustic-waves—Elastic properties of surface-layers. J. Appl. Phys. 1992, 71, 227–238. [Google Scholar] [CrossRef]
- Lefevre, F.; Jenot, F.; Ouaftouh, M.; Duquennoy, M.; Ourak, M. Laser generated guided waves and finite element modeling for the thickness gauging of thin layers. Rev. Sci. Instrum. 2010, 81. [Google Scholar] [CrossRef] [PubMed]
- Gao, W.M.; Glorieux, C.; Thoen, J. Laser ultrasonic study of Lamb waves: Determination of the thickness and velocities of a thin plate. Int. J. Eng. Sci. 2003, 41, 219–228. [Google Scholar] [CrossRef]
- Balogun, O.O.; Murray, T.W. Graded coating inspection using laser generated surface acoustic waves. In Review of Progress in Quantitative Nondestructive Evaluation, Vols 23a and 23b; Thompson, D.O., Chimenti, D.E., Eds.; Springer: New York, NY, USA, 2004; pp. 294–301. ISBN 0-7354-0173-X. [Google Scholar]
- Murray, T.W.; Krishnaswamy, S.; Achenbach, J.D. Laser generation of ultrasound in films and coatings. Appl. Phys. Lett. 1999, 74, 3561–3563. [Google Scholar] [CrossRef]
- Lehmann, G.; Hess, P.; Wu, J.J.; Wu, C.T.; Wong, T.S.; Chen, K.H.; Chen, L.C.; Lee, H.Y.; Amkreutz, M.; Frauenheim, T. Structure and elastic properties of amorphous silicon carbon nitride films. Phys. Rev. B 2001, 64. [Google Scholar] [CrossRef]
- Coufal, H.; Meyer, K.; Grygier, R.K.; Devries, M.; Jenrich, D.; Hess, P. Measurement of the elastic properties of evaporated c-60 films by surface acoustic-waves. Appl. Phys. A Mater. Sci. Process. 1994, 59, 83–86. [Google Scholar] [CrossRef]
- Amziane, A.; Amari, M.; Mounier, D.; Breteau, J.M.; Joly, N.; Edely, M.; Larcher, M.; Noire, P.; Banchet, J.; Tisseur, D.; et al. Laser ultrasonics evaluation and testing of coated HTR nuclear fuel. In Optical Measurement Systems For Industrial Inspection VII; Lehmann, P.H., Osten, W., Gastinger, K., Eds.; SPIE: Bellingham, DC, USA, 2011; ISBN 978-0-8194-8678-3. [Google Scholar]
- Stratoudaki, T.; Hernandez, J.A.; Clark, M.; Somekh, M.G. Cheap optical transducers (CHOTs) for narrowband ultrasonic applications. Meas. Sci. Technol. 2007, 18, 843–851. [Google Scholar] [CrossRef]
- Maznev, A.A.; Nelson, K.A.; Rogers, T.A. Optical heterodyne detection of laser-induced gratings. Opt. Lett. 1998, 23, 1319–1321. [Google Scholar] [CrossRef] [PubMed]
- Verstraeten, B.; Sermeus, J.; Salenbien, R.; Fivez, J.; Shkerdin, G.; Glorieux, A. Determination of thermoelastic material properties by differential heterodyne detection of impulsive stimulated thermal scattering. Photoacoustics 2015, 3, 64–77. [Google Scholar] [CrossRef] [PubMed]
- Banet, M.J.; Fuchs, M.; Rogers, J.A.; Reinold, J.H.; Knecht, J.M.; Rothschild, M.; Logan, R.; Maznev, A.A.; Nelson, K.A. High-precision film thickness determination using a laser-based ultrasonic technique. Appl. Phys. Lett. 1998, 73, 169–171. [Google Scholar] [CrossRef]
- Crimmins, T.F.; Maznev, A.A.; Nelson, K.A. Transient grating measurements of picosecond acoustic pulses in metal films. Appl. Phys. Lett. 1999, 74, 1344–1346. [Google Scholar] [CrossRef]
- Slayton, R.M.; Nelson, K.A. Picosecond acoustic transmission measurements. I. Transient grating generation and detection of acoustic responses in thin metal films. J. Chem. Phys. 2004, 120, 3908–3918. [Google Scholar] [CrossRef] [PubMed]
- Gao, W.M.; Glorieux, C.; Lauriks, W.; Thoen, J. Investigation of titanium nitride coating by broadband laser ultrasonic spectroscopy. Chin. Phys. 2002, 11, 132–138. [Google Scholar]
- Sermeus, J.; Sinha, R.; Vanstreels, K.; Vereecken, P.M.; Glorieux, C. Determination of elastic properties of a MnO2 coating by surface acoustic wave velocity dispersion analysis. J. Appl. Phys. 2014, 116. [Google Scholar] [CrossRef]
- Heczko, O.; Seiner, H.; Stoklasova, P.; Sedlak, P.; Sermeus, J.; Glorieux, C.; Backen, A.; Faehler, S.; Landa, M. Temperature dependence of elastic properties in austenite and martensite of Ni-Mn-Ga epitaxial films. Acta Mater. 2018, 145, 298–305. [Google Scholar] [CrossRef]
- Rogers, J.A.; Nelson, K.A. Dis-bond detection and the possibility of interfacial stiffness measurement with real-time impulsive stimulated thermal scattering. J. Adhes. 1995, 50, 1–24. [Google Scholar] [CrossRef]
- Rogers, J.A.; Fuchs, M.; Banet, M.J.; Hanselman, J.B.; Logan, R.; Nelson, K.A. Optical system for rapid materials characterization with the transient grating technique: Application to nondestructive evaluation of thin films used in microelectronics. Appl. Phys. Lett. 1997, 71, 225–227. [Google Scholar] [CrossRef]
- Salenbien, R.; Cote, R.; Goossens, J.; Limaye, P.; Labie, R.; Glorieux, C. Laser-based surface acoustic wave dispersion spectroscopy for extraction of thicknesses, depth, and elastic parameters of a subsurface layer: Feasibility study on intermetallic layer structure in integrated circuit solder joint. J. Appl. Phys. 2011, 109. [Google Scholar] [CrossRef]
- Cocson, J.K.; Hau, C.A.; Lee, P.M.; Poon, C.C.; Zhong, A.H.; Rogers, J.A.; Nelson, K.A. Transverse isotropic elastic-moduli and inplane thermal-diffusivity in silicon-supported thin-films of a photosensitive polyimide measured using impulsive stimulated thermal scattering. Polymer 1995, 36, 4069–4075. [Google Scholar] [CrossRef]
- Rogers, J.A.; Yang, Y.; Nelson, K.A. Elastic-Modulus And Inplane Thermal-Diffusivity Measurements In Thin Polyimide Films Using Symmetry-Selective Real-Time Impulsive Stimulated Thermal Scattering. Appl. Phys. A Mater. Sci. Process. 1994, 58, 523–534. [Google Scholar] [CrossRef]
- Sermeus, J.; Verstraeten, B.; Salenbien, R.; Pobedinskas, P.; Haenen, K.; Glorieux, A. Determination of elastic and thermal properties of a thin nanocrystalline diamond coating using all-optical methods. Thin Solid Films 2015, 590, 284–292. [Google Scholar] [CrossRef]
- Wu, M.; Ramirez, S.A.; Shafahian, E.; Guo, L.; Glorieux, C.; Binnemans, K.; Fransaer, J. Electrodeposition of bismuth telluride thin films containing silica nanoparticles for thermoelectric applications. Electrochim. Acta 2017, 253, 554–562. [Google Scholar] [CrossRef]
- Goldstein, J.; Newbury, D.E.; Michael, J.R.; Ritchie, N.W.M.; Scott, J.H.J.; Joy, D.C. Scanning Electron Microscopy and X-ray Microanalysis; Springer: New York, NY, USA, 2018; ISBN 978-1-4939-6674-5. [Google Scholar]
- Gusev, V.; Hess, P. Theory of photothermal depth profiling via rayleigh-type surface-acoustic-wave detection. Appl. Phys. A Mater. Sci. Process. 1995, 61, 299–310. [Google Scholar] [CrossRef]
- Maznev, A.A.; Akthakul, A.; Nelson, K.A. Surface acoustic modes in thin films on anisotropic substrates. J. Appl. Phys. 1999, 86, 2818–2824. [Google Scholar] [CrossRef]
- Glorieux, C.; Gao, W.M.; Kruger, S.E.; van de Rostyne, K.; Lauriks, W.; Thoen, J. Surface acoustic wave depth profiling of elastically inhomogeneous materials. J. Appl. Phys. 2000, 88, 4394–4400. [Google Scholar] [CrossRef]
- Rogers, J.A.; Maznev, A.A.; Banet, M.J.; Nelson, K.A. Optical generation and characterization of acoustic waves in thin films: Fundamentals and applications. Ann. Rev. Mater. Sci. 2000, 30, 117–157. [Google Scholar] [CrossRef]
- Goossens, J.; Leclaire, P.; Xu, X.; Glorieux, C.; Martinez, L.; Sola, A.; Siligardi, C.; Cannillo, V.; van der Donck, T.; Celis, J.P. Surface acoustic wave depth profiling of a functionally graded material. J. Appl. Phys. 2007, 102, 053508. [Google Scholar] [CrossRef]
- Auld, B.A. Acoustic Fields and Waves in Solids; John Wiley and Sons Inc.: New York, NY, USA, 1973; ISBN 978-0898747829. [Google Scholar]
- Sezawa, K.; Kanai, K. Discontinuity in the dispersion curves of rayleigh waves. Bull. Earthquake Res. Inst. Tokyo Univ. 1935, 13, 237–244. [Google Scholar] [CrossRef]
- Glorieux, C.; Fivez, J.; Thoen, J. Photoacoustic Investigation Of The Thermal-Properties Of Layered Materials—Calculation Of The Forward Signal And Numerical Inversion Procedure. J. Appl. Phys. 1993, 73, 684–690. [Google Scholar] [CrossRef]
- Kading, O.W.; Skurk, H.; Maznev, A.A.; Matthias, E. Transient thermal gratings at surfaces for thermal characterization of bulk materials and thin-films. Appl. Phys. A Mater. Sci. Process. 1995, 61, 253–261. [Google Scholar] [CrossRef]
- Prétet, Q.; Milenkovic, R.; Smith, B. Stress Analysis of the Eurisol Ds Target; PSI Technical Note N TM-34-02; Paul Scherrer Institute: Villigen, Switzerland, October 2006. [Google Scholar]
- Freund, L.B. Dynamic Fracture Mechanics; Cambridge University Press: Cambridge, UK, 1998; ISBN 978-0521629225. [Google Scholar]
- Malischewsky, P.G.; Tuan, T.T. A special relation between young’s modulus, rayleigh-wave velocity, and poisson’s ratio. J. Acoust. Soc. Am. 2009, 126, 2851–2853. [Google Scholar] [CrossRef] [PubMed]
- Peksen, M. Multiphysics Modeling: Materials, Components, and Systems; Academic Press: London, UK, 2018; ISBN 978-0128118245. [Google Scholar]
- Oliver, W.C.; Pharr, G.M. An improved technique for determining hardness and elastic modulus using load and displacement sensing indentation experiments. J. Mater. Res. 1992, 7, 1564–1583. [Google Scholar] [CrossRef]
- Poon, B.; Rittel, D.; Ravichandran, G. An analysis of nanoindentation in linearly elastic solids. Int. J. Solids Struct. 2008, 45, 6018–6033. [Google Scholar] [CrossRef]
- Windecker, R.; Tiziani, H.J. Optical roughness measurements using extended white-light interferometry. Optical Eng. 1999, 38, 1081–1088. [Google Scholar] [CrossRef]
- Wyant, J.C. White light interferometry. AeroSense 2002, 98. [Google Scholar] [CrossRef]
- Maradudin, A.A.; Mills, D.L. The attenuation of rayleigh surface waves by surface roughness. Ann. Phys. 1976, 100, 262–309. [Google Scholar] [CrossRef]
- Mayer, A.P.; Lehner, M. Effect of random surface and interface roughness on the propagation of surface acoustic waves. Waves Random Media 1994, 4, 321–336. [Google Scholar] [CrossRef]
- Kosachev, V.V.; Shchegrov, A.V. Dispersion and attenuation of surface acoustic waves of various polarizations on a stress-free randomly rough surface of solid. Ann. Phys. 1995, 240, 225–265. [Google Scholar] [CrossRef]
- Kosachev, V.V.; Lokhov, Y.N.; Chukov, V.N. An addition to the theory of the rayleigh surface waves attenuation by surface roughness. Solid State Commun. 1988, 68, 903–907. [Google Scholar] [CrossRef]
- Inc. eFunda. General Properties of Steels; Inc. eFunda: Sunnyvale, CA, USA, 2018. [Google Scholar]
- Nicolaides, L.; Mandelis, A.; Beingessner, C.J. Physical mechanisms of thermal-diffusivity depth-profile generation in a hardened low-alloy mn, si, cr, mo steel reconstructed by photothermal radiometry. J. Appl. Phys. 2001, 89, 7879–7884. [Google Scholar] [CrossRef]


© 2019 by the authors. Licensee MDPI, Basel, Switzerland. This article is an open access article distributed under the terms and conditions of the Creative Commons Attribution (CC BY) license (http://creativecommons.org/licenses/by/4.0/).