Article

Prediction Model of Compressive Strength Development in Concrete Containing Four Kinds of Gelled Materials with the Artificial Intelligence Method

Institute of Hydraulic Structure and Water Environment, College of Civil Engineering and Architecture, Zhejiang University, Hangzhou 310058, China
*
Author to whom correspondence should be addressed.
Appl. Sci. 2019, 9(6), 1039; https://doi.org/10.3390/app9061039
Submission received: 17 January 2019 / Revised: 5 March 2019 / Accepted: 7 March 2019 / Published: 13 March 2019
(This article belongs to the Section Civil Engineering)

Abstract

:

Featured Application

Predict the concrete compressive strength development over time.

Abstract

Green concrete has been widely used in recent years because its production compliments environmental conservation. The prediction of the compressive strength of concrete using non-destructive techniques is of interest to engineers worldwide. Such methods are easy to carry out because they require little or no sample preparation. Conventional models and artificial intelligence models are two main types of models to predict the compressive strength of concrete. Artificial intelligence models main include the artificial neural network (ANN) model, back propagation (BP) neural network model, fuzzy model etc. Since both conventional models and artificial intelligence models are flawed. This study proposes to build a concrete compressive strength development over time (CCSDOT) model by using conventional method combined with the artificial intelligence method. The CCSDOT model performed well in predicting and fitting the compressive strength development in green concrete containing cement, slag, fly ash, and limestone flour. It is concluded that the CCSDOT model is stable through the use of sensitivity analysis. To evaluate the precision of this model, the prediction results of the proposed model were compared to that of the model based on the BP neural network. The results verify that the recommended model enjoys better flexibility, capability, and accuracy in predicting the compressive strength development in concrete than the other models.

1. Introduction

Concrete is defined as a composite mixture of cement, aggregate, water, and when necessary chemical and mineral admixtures, and it is one of the most important materials in the construction industry. Concrete can be placed into moulds of various shapes and sizes, and then hardened under certain conditions [1,2,3]. Green concrete is one kind of the various concretes which has been used widely recently. People pay much attention to the performance of concrete. The compressive strength of concrete is assumed to be one of the most important and essential properties of concrete since it usually shows the overall quality of concrete [4].
In the last few decades, chemical and mineral admixtures, such as fly ash, slag, and limestone flour, were gradually added into concrete, and such forms of concrete were used in large civil engineering and hydraulic projects. In recent years, the utilization of mineral admixtures in concrete has shown a dramatic increase due to its economic, environmental, and technical benefits. Using mineral admixtures to replace partial cement is an effective way to reduce environmental pollution [5,6,7,8,9,10]. Besides, this strategy shows the potential to lower concrete production cost, conserve energy and resources, and also reduce waste [5,6,7,8,9,10]. Moreover, mineral admixtures offer several technical benefits to concrete, such as improving durability [5,8,9,10,11], workability [9,11,12] and permeability [7,9], reducing hydration evolution heat [9,12], and frequently improving compressive strength [7,9,13,14,15,16].
There are two main types of models to predict the compressive strength of concrete mixed with mineral admixtures. First, there are conventional models. Next, there are artificial intelligence models. Conventional models are based on statistical analysis, and many have built-in linear and nonlinear regression equations. Thus, they have the advantages of generating easy-to-use regression constants and in estimating the significance of the various input variables. Nikoo, M. et al. [17] used multiple linear regression to predict compressive strength of nine laboratory concrete specimens. Ahmed, M.S. [18] built a statistical model to predict the compressive strength of concrete containing different matrix mixtures at fixed age.
However, conventional models were developed with a fixed equation with a limited amount of data and parameters. If new data is different from the original data, then it is necessary to update not only the coefficients in the model but also the form of its equation. Artificial intelligence models were more adaptable when compared to conventional models. Khosravani, M.R. et al. [19] implemented an artificial intelligence (AI) system to predict dynamic mechanical properties, such as compressive strength, elastic modulus and tensile strength, of ultra-high performance concrete. The system was developed with the framework of case-based reasoning methodology, which was a learning methodology that utilized similar previous cases to solve particular new problems, as a problem-solving AI method. Bui, D.K. et al. [20] developed an expert system based on the artificial neural network (ANN) model in association with a modified firefly algorithm (MFA). And the proposed approach could provide an efficient and accurate tool to predict and design high-performance concrete. Sadowski, L. et al. [21] adopted the artificial neural networks (ANNs) to predict the compressive strength of low-strength concrete screeds modified using high volume of mineral dusts sourced from industrial wastes based on the composition of the concrete and ultrasonic pulse velocity. Trtnik, G. et al. [22] predicted the compressive strength of concrete by using an artificial neural network and ultrasonic pulse velocity. The results were satisfactory. Yeh, I.C. [23] adopted artificial neural networks (ANN) to predict the compressive strength of high-performance concrete, concluding that the ANN model was more accurate than a model based on regression analysis and it was easy to use ANN models for numerical experiments to review the effects of the proportions of each variable on the concrete mix. Kasperkiewics, J. [24], Lai, S. [25] and Lee, S.C. [26] also applied the neural network for predicting the properties of conventional concrete and high-performance concretes. Ni, H.G. [27] proposed a method to predict the 28-day compressive strength of concrete by using multilayer feed-forward neural networks. Demir, F. [28] developed a fuzzy model to predict normal and high-strength concrete. And the main advantage of the fuzzy model was its ability to describe knowledge in a descriptive human-like manner in the form of simple rules using linguistic variables only [29]. Hwang, K. [30] derived an equation from experimental results to estimate the compressive strength development in concrete which contained fly ash. Bilim, C. [31] applied an artificial neural network to predict the compressive strength of ground granulated blast furnace slag concrete by using concrete ingredients as input parameters. Khademi, F. et al. [4] used two different data-driven models, multiple linear regression and artificial neural network, in a MATLAB software environment to estimate the compressive strength of concrete. However, artificial intelligence models require a large training data set due to its “black-box” techniques [32].
Although there is a lot of literature about predicting the compressive strength of concrete, only a few of researchers could express the long-term compressive strength development in a certain kind of concrete. Meanwhile, the measurement and prediction of the compressive strength of concrete using non-destructive techniques is of interest to engineers worldwide. Such methods are easy to carry out because they require little or no sample preparation. Unlike artificial intelligence models that use “black-box” techniques and need a lot of data, the concrete compressive strength development over time (CCSDOT) model proposed in this study generates explicit formulas, which provide important advantages in practical applications. Meanwhile, adding optimization algorithms makes this model more adaptable to new data than conventional models. Moreover, the model can predict the compressive strength development over time in concrete which incorporated with up to three kinds of mineral admixtures by using concrete mix proportions.
Since the existing research can either only predict the compressive strength of a certain concrete or predict the compressive strength of concrete at a certain age, it is necessary to carry out the research about a model to predict the compressive strength of all kinds of concrete development over time. The main objective of this research is to construct a CCSDOT model to predict the compressive strength development over time of all kinds of concretes. These concretes are incorporated with different mineral admixtures. The model requires a few trial tests, the concrete’s ingredients, and the concrete’s age. For this purpose, a computer program of sequence quadratic programming was developed in FORTRAN. Furthermore, the results obtained from the CCSDOT model were compared with the results of the experiments and backpropagation (BP) neural network. By adopting this predicting model, considerable costs and time could be saved.
The outline of the rest of the study is as follows: Section 2 describes the model derivation and discusses the sequential quadratic programming method. Applications in green concrete are presented in Section 3, including the cross-validation and fitting analysis. In Section 4, the sensitivity analysis is presented, and the optimal performance of the model is compared with the optimal performance of the BP neural network. Section 5 is the conclusions of this study.

2. Model and Methodology

2.1. Concrete Compressive Strength Development over Time Model

A lot of researchers have introduced a relationship between the concrete compressive strength and curing time with different logarithmic equations [23,33,34,35]. Yeh, I.C. [23] adopted the following equation to predict the compressive strength of high-performance concrete, and then the results were compared to the results by ANN:
f c ( t ) = A Y B · [ C ln ( t ) + D ] .
where f c ( t ) is the compressive strength of high-performance concrete at t days, t is age at test, Y is water-to-binder ratio and A, B, C, and D are regression coefficients.
However, in practical concrete engineering, the strength evaluation of concrete is generally based on the strength of curing after 28 days. Many concrete properties have a great relationship with the strength after 28 days [36]. Besides, there are many factors affecting the 28-day compressive strength of concrete. Therefore, the model in this study is built based upon the 28-day compressive strength of concrete and the modified logarithmic relationship established in the literatures. Moreover, in order to reflect the characteristics of different kinds of concrete, the parameter λ is introduced to the model.
The concrete compressive strength development over time model is written as:
S t = S 28 ( 1 + λ ln t 28 ) .
where S 28 is the concrete compressive strength after t days. Also, λ expresses the factor of the concrete compressive strength in a later period.
As the development of concrete progressed, more and more kinds of gelled materials were used in concrete. In summary, there are four main kinds of gelled materials: cement, slag, fly ash and limestone flour. Also, the gelled materials greatly influence the compressive strength of concrete [36]. In general, the use of slag and fly ash is unfavorable to the early age compressive strength development of concrete compared to cement while it is beneficial to the long-term compressive strength development of concrete compared to cement. Thus it is reasonable that the 28-day compressive strength ( S 28 ) is dictated by the contribution of cement, slag, fly ash and limestone flour.
S 28 = S 28 C + S 28 S L + S 28 F A + S 28 L F .
where S 28 C is the 28-day concrete compressive strength contribution of cement, S 28 S L is the 28-day concrete compressive strength contribution of slag, S 28 F A is 28-day concrete compressive strength contribution of fly ash and S 28 L F is 28-day concrete compressive strength contribution of limestone flour.
A positive linear correlation between the content and the 28-day compressive strength contribution of each gelled material means that the impact index of gelled material x ( i x ) is equal to 1, x can be cement, slag, fly ash or limestone flour.
S 28 x = S x q x .
where S 28 x is the 28-day concrete compressive strength contribution of gelled material x , S x is the 28-day compressive strength of gelled material x , q x is the percentage content by weight of gelled material x . Substitute Equation (4) into Equation (3) and we get Equation (5). The 28-day compressive strength of concrete ( S 28 ) is derived as follows:
S 28 = S C q C + S S L q S L + S F A q F A + S L F q L F .
where S C is the 28-day compressive strength of cement, S S L is the 28-day compressive strength of slag, S F A is the 28-day compressive strength of fly ash and S L F is 28-day compressive strength of limestone flour. q C , q S L , q F A , and q L F are the percentage of each gelled material content which can be expressed as follows:
q x = m x m C + m S L + m F A + m L F × 100 % .
where m x is the quantity of gelled material. In addition, m C is the quantity of cement used in concrete, m S L is the quantity of slag used in concrete, m F A is the quantity of fly ash used in concrete, and m L F is the quantity of limestone flour used in concrete.
However, the correlation between the content and the 28-day compressive strength contribution of each gelled material is always nonlinear in practical engineering applications, so parameter i x is introduced into the model. For instance, the 28-day compressive strength of concrete increases rapidly with increases in the cement content at first. However, when the content of cement reaches a certain level, the 28-day compressive strength of concrete increases slowly with an increase in the amount of cement. In such cases, the impact index of cement is greater than 0 and less than 1. The 28-day compressive strength of concrete increased slowly with increases in the fly ash content at first. However, when the content of fly ash reaches a certain level, the 28-day compressive strength of concrete increases quickly. In this case, the impact index of fly ash is always greater than 1. In order to measure the contribution of different gelled materials to the 28-day compressive strength of concrete, the 28-day compressive strength contribution coefficient of gelled material x is introduced into the model.
S 28 x = S x q x i x .
where i x is the impact index of gelled material x . In order to compare the influence of each kind of gelled material on concrete, S x is normalized as follows:
s s x = S x / S C
where s s x is the 28-day compressive strength contribution coefficient of gelled material x . Substitute Equation (7) into (3) and we get Equation (9).
S 28 = S C q C i C + S S L q S L i S L + S F A q F A i F A + S L F q L F i L F .
where i C is the impact index of cement, i S L is the impact index of slag, i F A is the impact index of fly ash and i L F is the impact index of limestone flour.
Just like the 28-day compressive strength of concrete, the factor of compressive strength in later periods is expressed as the sum of the contribution of each kind of gelled material.
λ = λ C q C i C + λ S L q S L i S L + λ F A q F A i F A + λ L F q L F i L F .
where λ C is the factor of compressive strength in the later period of cement, λ S L is the factor of the compressive strength in later periods of slag, λ F A is the factor of the compressive strength in later periods of fly ash and λ L F is the factor of the compressive strength in later periods of limestone flour.
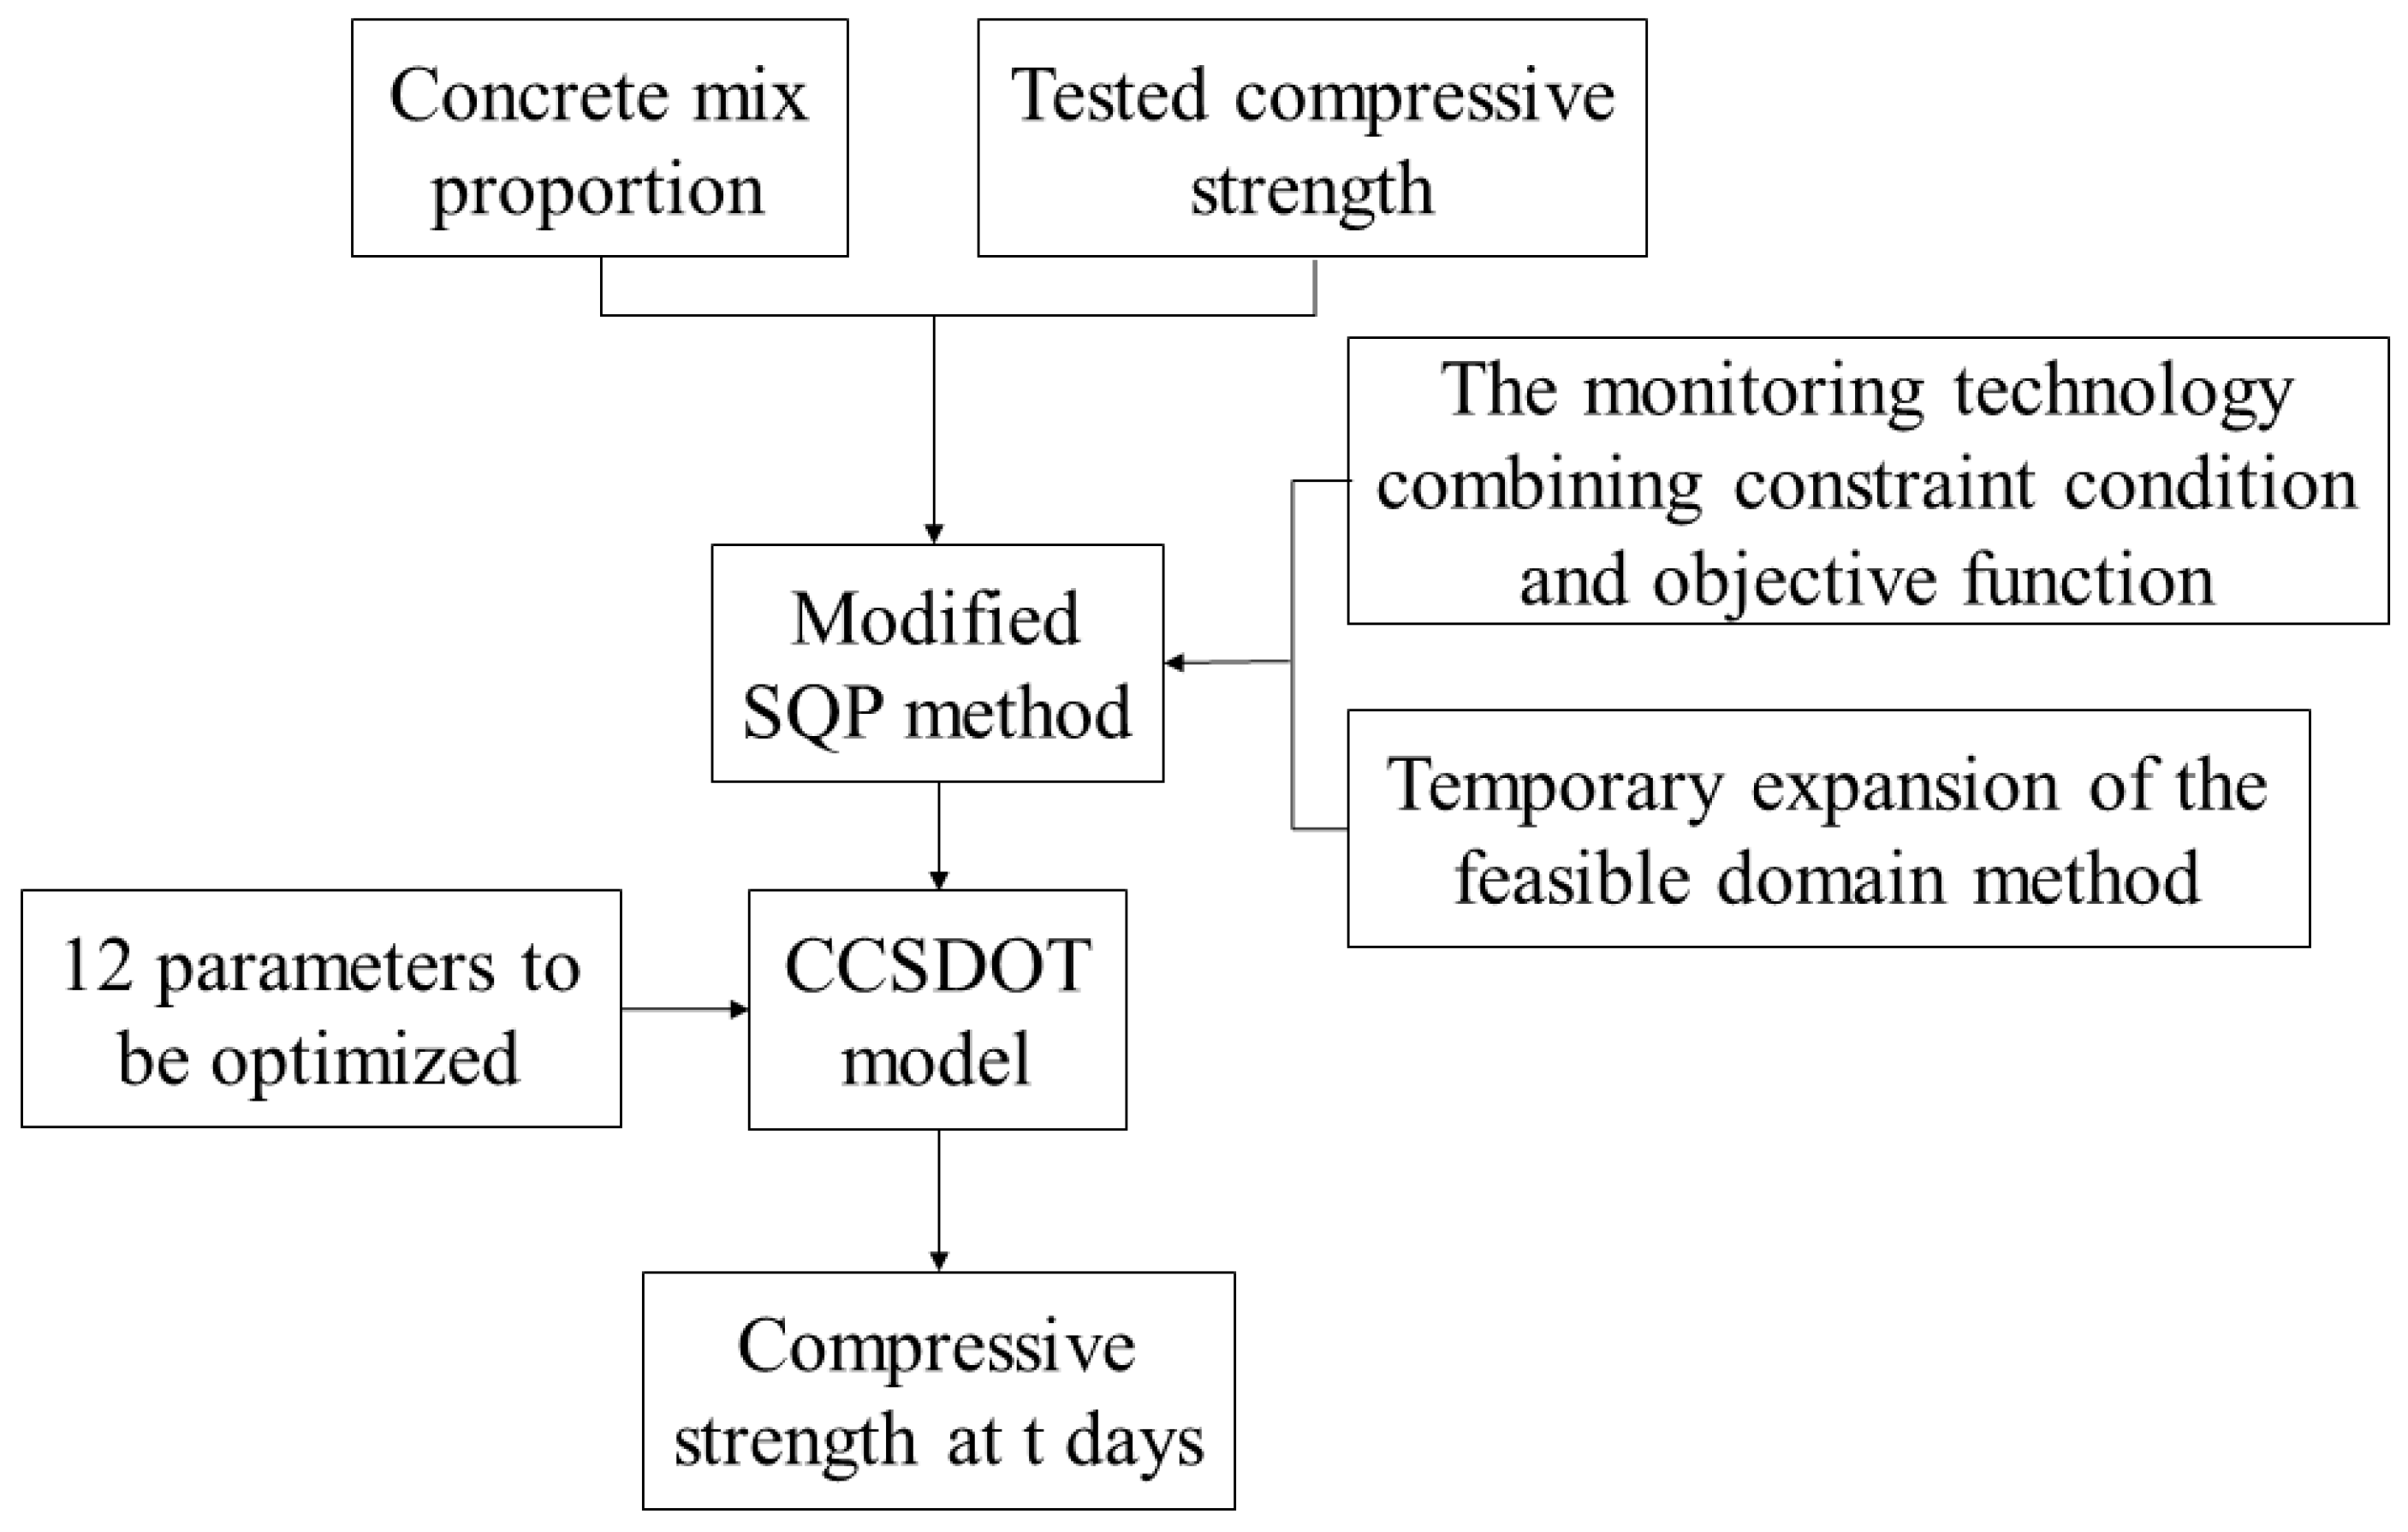
By using the compressive strength test results of concrete with various proportions of the same aggregates and gelled materials, the 12 parameters ( S C , S S L , S F A , S L F , i C , i S L , i F A , i L F , λ C , λ S L , λ F A , λ L F ) of the model are inverted based on the optimization algorithm.

2.2. Methodology

To find the 12 parameters in the model is a nonlinear constrained optimization problem. There are several common optimization methods including the penalty function method, augmented multiplier method, and the sequence quadratic programming (SQP) method. SQP has a wide range of applications and good development. When compared with other optimization algorithms, its most prominent advantages are good convergence, high computational efficiency, and strong edge search ability. Therefore, this research chooses the SQP method to find the 12 parameters.
A typical constrained nonlinear programming problem can be expressed as:
min f ( X ) h i ( X ) = 0 i = 1 , 2 , , m s . t . g j ( X ) 0 j = 1 , 2 , , n .
where the objective function f ( X ) , equality constraint h i ( X ) and inequality constraint g i ( X ) are all second order, continuous and differentiable. The Lagrange function of this problem is given in Equation (12).
L ( X , γ ) = f ( X ) + i = 1 m γ i h i ( X ) + j = m + 1 n γ j g j ( X ) .
where γ i and γ j are Lagrange operators.
According to the idea of SQP, this problem can be transformed into a series of quadratic programming (QP) problems. The QP problem of X k + 1 can be further changed into the QP problem of search direction d in order to ensure that X k is close to the feasible solution in each iteration and the objective function also has a downward trend. Then, the following form of the QP subproblem can be obtained:
min d R n 1 2 d T H k d + ( f ( X k ) ) T d ( h i ( X ) ) T d + h i ( X ) = 0 s . t . ( g j ( X ) ) T d + g j ( X ) = 0 .
X k + 1 = X k + α k d k .
where α k is the step size. The iterative process of the SQP method can be expressed as follows:
Step 1:
Determine the initial value of X 0 and H 0 .
Step 2:
Solve the QP subproblem and determine the search direction d k and γ i , j k + 1 .
Step 3:
X k + 1 = X k + α k d k , if the convergence condition is satisfied, ( X k + 1 , γ k + 1 ) is taken as the optimal solution of the original problem; if not, return to Step 2 and continue to iterate.
The problem in this study has variable constraint conditions and objective function. Also, the problem is not suitable for iteration with traditional Lagrange operators. This study adopts intelligent method, the monitoring technology combining constraint condition and objective function, to select new iteration points. In addition, the possibility of failure in optimization iteration is dealt with by temporary expansion of the feasible domain method. These changes improve the effectiveness and computational efficiency of the optimization algorithm. In consequence, the overview of the model and methodology is shown in Figure 1.

3. Application in Green Concrete

In this study, the 1st to 11th groups of the 66 concrete compressive strength mix proportions and tests results from XU, G.Q. [37] were adopted. Table 1 is the mix proportions of the green concrete and Table 2 is the tested results.

3.1. Model Cross-Validation

One group of 11 tests results was chosen randomly as a testing set and the rest of the ten groups were selected as training sets automatically. In Figure 2, the dense bars represent the tested compressive strength and the sparse bars represent the predicted compressive strength. Comparisons of the tested data and predicted data in each group are given in Figure 2, graphically. This revealed that the model can predict concrete compressive strength over time precisely.
With regard to the prediction accuracy, the error analysis, including the relative error analysis and the absolute value of the relative error analysis, of both the 7-day and 28-day compressive strength were done. The average of the absolute value of the relative error of the 7-day compressive strength is 4.18% while it is 3.96% for the 28-day compressive strength. And correlation coefficient (R2) for 7-day compressive strength reaches 0.9017 while R2 for 28-day compressive strength is 0.8036. These values are acceptable in practical engineering.

3.2. Fitting Analysis

The performance of the fitted compressive strength and tested compressive strength of the 11 samples using the model mentioned earlier can be seen in Figure 3 and Figure 4. In Figure 3, the hollow circles represent the 7-day compressive strength of the tested value and fitted value. Pentagrams denote the 28-day compressive strength of the tested value and fitted value. The black solid line represents the fitted value and tested value are exactly same. Black-dashed lines show the upper and lower fitted bounds at a 5% deviation level and the result in Figure 2 indicates the model performs reasonably well.
Figure 4 shows a comparison of the fitted and tested compressive strength of concrete at an age of 7 days and 28 days, respectively. Hollow triangles represent the 7-day tested compressive strength while the hollow circles express the 28-day tested compressive strength. Meanwhile, black solid triangles express the 7-day fitted compressive strength while black solid circles represent the 28-day fitted compressive strength. Graphically, the figure illustrates that the model can fit both the 7-day compressive strength and 28-day compressive strength very well, with R2 for 7-day compressive strength range from 0.9285 to 0.9506 while R2 for 28-day compressive strength range from 0.8138 to 0.8606 as shown in Table 3.
Figure 5 is a box-plot of the absolute value of the relative error between the tested and fitted compressive strength from 10 of the 11 groups randomly. The figure indicates that the average of the absolute value of the relative error of each group is lower than 4% and that the average of all of the 11 groups’ absolute value of relative error is 3.31%. This average indicates that the model mentioned earlier performs well in fitted compressive strength. Moreover, it reveals that the error distribution is stable, thus proving the model has great applicability.

4. Discussion

4.1. Sensitivity Analysis

People may pay more attention to the compressive strength of concrete and design the optimal mix proportions with a few trial test before they determine the final mix proportions. Meanwhile, it is important to decide the proper number of groups for each similar mix proportion trial test. For a laboratory test, a proper number of groups can economize the time and cost.
Sensitivity analysis is a method to quickly find the proper number of groups of each similar mix proportion trial test. In Figure 6, at the very beginning, the absolute value of relative error decreases sharply as we increase the number of training sets. Then, as the number of training sets rises, the absolute value of relative error gradually becomes steady, and eventually the error goes below 5%. Meanwhile, the degree of dispersion of the absolute value of the relative error decreases as the number of training sets rises.
Figure 7 and Figure 8 show the relative error sensitivity analysis and the absolute value of the relative error sensitivity analysis between the predicted data and tested data. They show similar characteristics to each other in Figure 6. It is not difficult to understand that the accuracy of prediction increases as training sets increase. When training sets reach 4 groups, either the relative error or the absolute value of the relative error between predicted and tested 7-day and 28-day compressive strength of group 6 is smaller than 5%. Even the average absolute value of the relative error is also smaller than 5%. It is acceptable in practical engineering. Therefore, in order to meet the economic and technical demands, it is suitable to choose at least 4 training sets in this model.

4.2. Comparison to BP Neural Network

Table 4 shows the tested compressive strength results from XU, G.Q. [37], predicted compressive strength by BP neural network model and predicted compressive strength by the CCSDOT model. The BP neural network model used 61 groups of data and the CCSDOT model only used 10 groups of data.
We put the proportions of the 10 groups of concrete and the measured compressive strength at each age of group 6 into the model, then the 12 parameters can be calculated as shown in Table 5.
Substitute the results in Table 5 into Equation (8) and we get s s x as listed in Table 6
In practical engineering, the use of fly ash and limestone flour is unfavorable to the early age compressive strength development of concrete compared to cement. Thus, s s F A and S 28 L F are less than 0. And limestone flour is more unfavorable to the early age compressive strength development of concrete compared to fly ash, which is conformed to reality. And the use of fly ash and limestone flour is beneficial to the long-term compressive strength development of concrete compared to cement. Therefore, λ F A and λ L F are greater than λ C . Furthermore, S 3 and S 7 can be calculated based on Table 5 and Equation (2).
Table 7 shows the relative error of the predicted results by the BP neural network and CCSDOT model. The performance of CCSDOT is better than BP at any age of concrete. The CCSDOT model is more accurate when compared to the BP neural network model.

5. Conclusions

(1)
This research developed a CCSDOT model to predict the compressive strength development in concrete that incorporated with several kinds of gelled materials. The CCSDOT model combined the advantages of conventional models and artificial intelligence models. Modified SQP method was adopted to solve the nonlinear constrained optimization problem.
(2)
The CCSDOT model performed well in predicting and fitting the compressive strength development in green concrete containing cement, slag, fly ash, and limestone flour. The error analysis proved the model has great applicability.
(3)
It is concluded that the CCSDOT model is stable and is very applicable through the use of sensitivity analysis. In practical applications, it is suitable to choose at least 4 training sets in this model to meet the economic and technical demands.
(4)
Compared to the BP neural network, the CCSDOT model is more accurate.

Author Contributions

Conceptualization, G.L.; Data curation, J.Z.; Formal analysis, J.Z.; Funding acquisition, G.L.; Investigation, J.Z.; Methodology, G.L.; Project administration, G.L.; Resources, J.Z.; Software, G.L.; Supervision, G.L.; Validation, J.Z.; Visualization, G.L.; Writing—original draft, J.Z.; Writing—review and editing, J.Z.

Funding

This research was funded by National Natural Science Foundation of China, grant number 51379185. This research was funded by National Natural Science Foundation of China, grant number 2013CB035901.

Conflicts of Interest

The authors declare no conflict of interest.

References

  1. Neville, A.M. Properties of Concrete, 3rd ed.; London English Language Book Society and Pitman: London, England, 1981. [Google Scholar]
  2. Akman, M.S. Materials of Construction; Istanbul Technical University Press: Istanbul, Turkey, 1987. [Google Scholar]
  3. Erdoğan, T.Y. Aggregates; The Turkish Ready Mixed Concrete Association: Istanbul, Turkey, 1985. [Google Scholar]
  4. Khademi, F.; Behfarnia, K. Evaluation of concrete compressive strength using artificial neural network and multiple linear regression models. Int. J. Optim. Civ. Eng. 2016, 6, 423–432. [Google Scholar]
  5. Oner, A.; Akyuz, S. An experimental study on optimum usage of GGBS for the compressive strength of concrete. Cem. Concr. Comp. 2007, 29, 505–514. [Google Scholar] [CrossRef]
  6. Song, H.W.; Saraswathy, V. Studies on the corrosion resistance of reinforced steel in concrete with ground granulated blast-furnace slag—An overview. J. Hazard. Mater. 2006, 138, 226–233. [Google Scholar] [CrossRef]
  7. Çakır, Ö.; Aköz, F. Effect of curing conditions on the mortars with and without GGBFS. Constr. Build. Mater. 2008, 22, 308–314. [Google Scholar] [CrossRef]
  8. Aldea, C.M.; Young, F.; Wang, K.; Shah, S.P. Effects of curing conditions on properties of concrete using slag replacement. Cem. Concr. Res. 2000, 30, 465–472. [Google Scholar] [CrossRef]
  9. Escalante-García, J.I.; Sharp, J.H. The microstructure and mechanical properties of blended cements hydrated at various temperatures. Cem. Concr. Res. 2001, 31, 695–702. [Google Scholar] [CrossRef]
  10. Ferraris, C.F.; Obla, K.H.; Hill, R. The influence of mineral admixtures on the rheology of cement paste and concrete. Cem. Concr. Res. 2001, 31, 245–255. [Google Scholar] [CrossRef]
  11. Roy, D.M.; Arjunan, P.; Silsbee, M.R. Effect of silica fume, metakaolin, and low-calcium fly ash on chemical resistance of concrete. Cem. Concr. Res. 2001, 31, 1809–1813. [Google Scholar] [CrossRef]
  12. McCarthy, M.J.; Dhir, R.K. Development of high volume fly ash cements for use in concrete construction. Fuel 2005, 84, 1423–1432. [Google Scholar] [CrossRef]
  13. Chidiac, S.E.; Panesar, D.K. Evolution of mechanical properties of concrete containing ground granulated blast furnace slag and effects on the scaling resistance test at 28 days. Cem. Concr. Comp. 2008, 30, 63–71. [Google Scholar] [CrossRef]
  14. Lawrence, P.; Cyr, M.; Ringot, E. Mineral admixtures in mortars effect of type, amount and fineness of fine constituents on compressive strength. Cem. Concr. Res. 2005, 35, 1092–1105. [Google Scholar] [CrossRef]
  15. Cyr, M.; Lawrence, P.; Ringot, E. Efficiency of mineral admixtures in mortars: Quantification of the physical and chemical effects of fine admixtures in relation with compressive strength. Cem. Concr. Res. 2006, 36, 264–277. [Google Scholar] [CrossRef]
  16. Demirboğa, R.; İTürkmen, İ.; Karakoç, M.B. Relationship between ultrasonic velocity and compressive strength for high-volume mineral-admixtured concrete. Cem. Concr. Res. 2004, 34, 2329–2336. [Google Scholar] [CrossRef]
  17. Nikoo, M.; Zarfam, P.; Sayahpour, H. Determination of compressive strength of concrete using Self Organization Feature Map (SOFM). Eng. Comput. 2015, 31, 113–121. [Google Scholar] [CrossRef]
  18. Ahmed, M.S. Statistical Modelling and Prediction of Compressive Strength of Concrete. Concr. Res. Lett. 2012, 3, 452–458. [Google Scholar]
  19. Khosravani, M.R.; Nasirib, S.; Andersa, D.; Weinbergc, K. Prediction of dynamic properties of ultra-high performance concrete by an artificial intelligence approach. Adv. Eng. Softw. 2019, 127, 51–58. [Google Scholar] [CrossRef]
  20. Bui, D.K.; Nguyen, T.; Chou, J.S.; Nguyen-Xuan, H.; Ngo, T.D. A modified firfly algorithm-artificial neural network expert system for predicting compressive and tensile strength of high-performance concrete. Constr. Build. Mater. 2018, 180, 320–333. [Google Scholar] [CrossRef]
  21. Sadowski, L.; Piechowka-Mielnik, M.; Widziszowski, T.; Gardynik, A.; Mackiewicz, S. Hybrid ultrasonic-neural prediction of the compressive strength of environmentally friendly concrete screeds with high volume of waste quartz mineral dust. Clean. Prod. 2019, 212, 727–740. [Google Scholar] [CrossRef]
  22. Trtnik, G.; Kavčič, F.; Turk, G. Prediction of concrete strength using ultrasonic pulse velocity and artificial neural networks. Ultrasonics 2009, 49, 53–60. [Google Scholar] [CrossRef] [PubMed] [Green Version]
  23. Yeh, I.C. Modeling of strength of high-performance concrete using artificial neural networks. Cem. Concr. Res. 1998, 28, 1797–1808. [Google Scholar] [CrossRef]
  24. Kasperkiewics, J.; Racz, J.; Dubrawski, A. HPC strength prediction using artificial neural network. J. Comput. Civ. Eng. 1995, 9, 279–284. [Google Scholar] [CrossRef]
  25. Lai, S.; Serra, M. Concrete strength prediction by means of neural network. Constr. Build. Mater. 1997, 11, 93–98. [Google Scholar] [CrossRef]
  26. Lee, S.C. Prediction of concrete strength using artificial neural networks. Eng. Struct. 2003, 25, 849–857. [Google Scholar] [CrossRef]
  27. Ni, H.G.; Wang, J.Z. Prediction of compressive strength of concrete by neural networks. Cem. Concr. Res. 2000, 30, 1245–1250. [Google Scholar] [CrossRef]
  28. Demir, F. A new way of prediction elastic modulus of normal and high strength concrete—Fuzzy logic. Cem. Concr. Res. 2005, 35, 1531–1538. [Google Scholar] [CrossRef]
  29. Sen, Z. Fuzzy algorithm for estimation of solar irradiation from sunshine duration. Sol. Energy 1998, 63, 39–49. [Google Scholar] [CrossRef]
  30. Hwang, K.; Noguchi, T.; Tomosawa, F. Prediction model of compressive strength development of fly-ash concrete. Cem. Concr. Res. 2004, 34, 2269–2276. [Google Scholar] [CrossRef]
  31. Bilim, C.; Atiş, C.D.; Tanyildizi, H.; Karahan, O. Predicting the compressive strength of ground granulated blast furnace slag concrete using artificial neural network. Adv. Eng. Softw. 2009, 40, 334–340. [Google Scholar] [CrossRef]
  32. Atici, U. Prediction of the strength of mineral admixture concrete using multivariable regression analysis and an artificial neural network. Expert. Syst. Appl. 2011, 38, 9609–9618. [Google Scholar] [CrossRef]
  33. Lu, L.H.; Pan, G.S.; Chen, S.L.; Zhang, Y. Strength of concrete with different contents of fly ash. J. Shenyang Univ. Technol. 2009, 31, 107–111. [Google Scholar]
  34. Yue, J.X.; Xing, F.M. Concrete compressive strength prediction. Shanxi Archit. 2003, 29, 106–107. [Google Scholar]
  35. Shafieyzadeh, M. Prediction of Compressive Strength of Concrete Containing Silica Fume and Styrene-Butadiene Rubber (SBR) with a Mathematical Model. Int. J. Concr. Struct. Mater. 2013, 7, 295–301. [Google Scholar] [CrossRef]
  36. Neville, A.M. Properties of Concrete, 1st ed.; China Building Industry Press: Beijing, China, 2011; pp. 217–490. (In Chinese) [Google Scholar]
  37. Xu, G.Q.; Su, Y.P.; Han, D.L.; Zhang, J. Prediction model of green concrete compressive strength based on BP neural network. Concrete 2013, 33–35. [Google Scholar]
Figure 1. Overview of the model and methodology. SQP: quadratic programming; CCSDOT: concrete compressive strength development over time.
Applsci 09 01039 g001
Figure 2. Comparison of tested and predicted compressive strength of concrete at the age of (a) 7 days and (b) 28 days.
Applsci 09 01039 g002
Figure 3. Relationship between tested compressive strength and fitted compressive strength of concrete.
Applsci 09 01039 g003
Figure 4. Comparison of tested and fitted compressive strength of concrete at age of 7 days and 28 days.
Applsci 09 01039 g004
Figure 5. The Box-plot shows the absolute value of the relative error between the tested and fitted compressive strength from 10 of 11 groups randomly.
Applsci 09 01039 g005
Figure 6. Sensitivity analysis between the number of training sets, and the average absolute value of the relative error between predicted and tested the compressive strength of group 6.
Applsci 09 01039 g006
Figure 7. Sensitivity analysis between the number of training sets, and relative error between predicted and tested (a) 7-day and (b) 28-day compressive strength of group 6.
Applsci 09 01039 g007
Figure 8. Sensitivity analysis between the number of training sets, and the absolute value of the relative error between predicted and tested (a) 7-day and (b) 28-day compressive strength of group 6.
Applsci 09 01039 g008
Table 1. Mix properties of green concrete.
GroupCement/(kg/m3)Limestone Flag/(kg/m3)Fly Ash/(kg/m3)Sand/(kg/m3)Gravel/(kg/m3)Water/(kg/m3)Water Reducer/(kg/m3)
125254.054.08281053158.49.00
225264.843.28281053158.49.00
325275.632.48281053158.49.00
425286.421.68281053158.49.00
525297.210.88281053158.49.00
6252108.008281053158.49.00
721672.072.08281053158.49.00
821686.457.68281053158.49.00
9216100.843.28281053158.49.00
10216115.228.88281053158.49.00
11216129.614.48281053158.49.00
Table 2. Tested compressive strength of green concrete.
GroupCompressive Strength/MPa
3 d7 d28 d
117.623.434.0
217.022.633.3
317.025.034.6
418.823.733.6
518.323.833.4
616.922.030.3
713.718.928.0
814.119.430.2
915.220.330.6
1013.917.428.0
1114.619.228.6
Table 3. The R2 between tested and fitted compressive strength of concrete at age of 7 days and 28 days.
GroupR2
7 d28 d
10.93110.8470
20.93110.8236
30.93820.8406
40.92930.8374
50.93130.8606
60.94310.8494
70.92850.8247
80.93120.8138
90.94560.8252
100.95060.8161
110.93950.8600
Table 4. Compressive strength of green concrete containing fly ash and limestone flour. BP: back propagation.
GroupCompressive Strength (MPa)
TestedBP Neural Network CCSDOT Model
3 d7 d28 d3 d7 d28 d3 d7 d28 d
616.922.030.316.9921.3631.0716.9422.2630.96
Table 5. Optimal parameters of CCSDOT model.
ParameterValue (MPa)ParameterValueParameterValue
S C 43.03 i C 0.4742 λ C 0.1585
S S L 0 i S L 0 λ S L 0
S F A −0.68 i F A 1.3229 λ F A 0.9454
S L F −37.00 i L F 1.6029 λ L F 0.4746
Table 6. 28-day compressive strength contribution coefficient of each gelled material.
ParameterValue
s s C 1
s s S L 0
s s F A −0.0158
s s L F −0.8599
Table 7. Comparison between the predicted results of BP neural network and CCSDOT model.
ModelRelative Error (%)
3 d7 d28 d
BP0.532−2.9092.541
CCSDOT0.2371.1822.178

