Abstract
This paper proposes a coordinated active–reactive power optimization model for an active distribution network with energy storage systems, where the active and reactive resources are handled simultaneously. The model aims to minimize the power losses, the operation cost, and the voltage deviation of the distribution network. In particular, the reactive power capabilities of distributed generators and energy storage systems are fully utilized to minimize power losses and improve voltage profiles. The uncertainties pertaining to the forecasted values of renewable energy sources are modelled by scenario-based stochastic programming. The second-order cone programming relaxation method is used to deal with the nonlinear power flow constraints and transform the original mixed integer nonlinear programming problem into a tractable mixed integer second-order cone programming model, thus the difficulty of problem solving is significantly reduced. The 33-bus and 69-bus distribution networks are used to demonstrate the effectiveness of the proposed approach. Simulation results show that the proposed coordinated optimization approach helps improve the economic operation for active distribution network while improving the system security significantly.
1. Introduction
With the shortage of fossil energy and the deterioration of the natural environment, renewable energy sources (RESs) represented by wind power and photovoltaic (PV) have been rapidly developed. With higher distributed energy resources integration, the traditional distribution network is gradually becoming an active distribution network (ADN) and the optimal operation of the distribution network is facing new challenges [1,2,3]. Active power optimization and reactive power optimization (RPO) are two important aspects of system optimization. Active power optimization is also called economic dispatch, which often aims to minimize the total day-ahead or real-time operation cost by deciding the output of distributed generations (DGs) and charge–discharge power in the distribution system. RPO is an important measure to ensure safe and economic operation of distribution network, which can regulate the system voltage profile and power flow, as well as reduce the active power losses [4,5].
The RPO for ADN is often formed as a mixed integer nonlinear programming (MINLP) problem, which should deal with both continuous control variables such as DG output and discrete control variables, such as capacitor banks (CBs) and on-load tap changer (OLTC) [6,7]. Meanwhile, the RPO problem is essentially nonconvex due to the nonconvex and nonlinear power flow equations, which are difficult to solve. Various methods have been proposed to cope with this problem, which can be divided into two categories: Heuristic algorithms and analytical methods [8]. The heuristic algorithms have attracted much attention because they are relatively easy to implement. A chaotic particle swarm optimization (PSO) was employed in [9] to minimize the system losses using voltages of wind power generator, tap changers, and shunt compensators. Shaw et al. [10] proposed a gravitational search algorithm for the reactive power scheduling, with the aim of minimizing the active power losses. A multi-objective reactive power scheduling model was proposed in [11], where the hybrid fuzzy multi-objective evolutionary algorithm was utilized to obtain the Pareto front. A novel cuckoo search algorithm was used in [12] to overcome optimal power flow problems and enhance the operation capacity of hydrothermal power systems. However, the obvious drawbacks of the heuristic algorithm are that they often require long calculation time and it is easy for them to fall into local optimum. Therefore, more researchers focus on the exploration of the analytical methods. Traditional analytical methods include gradient descent, interior point methods, quadratic programming, etc. However, due to the nonconvexity of power flow equations, these traditional methods can only guarantee a local optimal solution [13]. Thus, convex programming methods are more desirable. The second-order cone programming (SOCP) relaxation, which is based on the branch flow model, is a promising convexification method because of its lower computational complexity [14,15]. The accuracy of SOCP relaxation has been verified in references [16,17,18].
Although a great number of methods have been proposed in the literature, they did not take the joint active and reactive power scheduling into consideration. Actually, the R/X ratio of the distribution system is large, the P–Q is not decoupled, and active power scheduling affects the voltage as well. In addition, apart from active power output, the inverter-based DG is allowed to provide reactive power as an ancillary service to further reduce power losses and improve the network voltage level [19,20,21]. Therefore, a joint dispatch of active and reactive resources for ADN is highly desired to take full advantage of renewable energies to reduce the operation cost and active power losses, as well as improve the voltage stability.
It is worth noting that, with the large-scale wind power and PV access to distribution network, the random and intermittent nature of such resources may have an adverse effect on distribution network [22]. As a flexible power supply, the energy storage system (ESS) provides a new idea to mitigate the power fluctuations of intermittent RES. The application of ESS in ADN may provide auxiliary services and enhance system reliability, as well as improve system economy [23,24]. As one typical DG, the distributed ESS was applied to improve voltage profile in [25,26]. A coordinated dispatch problem of a wind farm with ESS was proposed in [27]. The results indicate that ESS can greatly improve the dispatchability of wind farm. The integration of ESSs with different capacities into the power grid has been studied in [28] to analyze the improvements in the power quality. Reference [29] has formulated a stochastic programming framework to choose optimal energy and reserve bids for ESS owners based on the electricity market. Chen et al. [30] considered the unit commitment problem for microgrids; the optimal capacity and operation strategy of ESS for both the grid-connected and islanded modes of microgrids were analyzed. Reference [31] investigated the coordinated optimal dispatch of ESS with renewable energies in microgrids to minimize the electricity costs. Fan et al. [32] analyzed the stochastic optimal operation of microgrid with ESS; the influences of ESS on the optimization results were fully investigated.
Based on the above discussions, a coordinated optimization model for ADN with ESSs is proposed in this paper, where the active and reactive power are handled simultaneously. In particular, the reactive power capabilities of DGs and ESS are fully utilized to minimize power losses and improve voltage profiles.
The remainder of this paper is organized as follows: Section 2 describes the mathematical formulation of the coordinated optimization problem for ADN with ESS. The SOCP relaxation method is used to transform the original MINLP problem into a tractable mixed integer SOCP (MISOCP) problem in Section 3. Section 4 presents the case studies. Finally, Section 5 concludes the paper.
2. Problem Formulation
2.1. Uncertainty Modeling of Wind Turbine/Photovoltaic
The output power of wind turbine (WT) and PV is intermittent and volatile due to the changeable weather conditions. In order to make the coordinated optimization results more accurate, the power prediction error of WT and PV should be taken into consideration.
The Monte Carlo simulation (MCS) is used to generate multiple scenarios to represent the predictive error of RES in this paper. One scenario is a sequence of hourly power prediction errors of WT and PV.
It is assumed that the uncertain proportion to the predicted WT and PV output obey normal distribution and the probability density function is
where and are the mean value and standard deviation of normal distribution, respectively.
The final forecast value of renewable energy is
where is the original forecast value.
It is worth noting that, although the accuracy can be improved by increasing the number of scenarios, the computational burden will also increase greatly. Therefore, the backward scenario reduction technique [32] is utilized to obtain a representative set.
2.2. Objective Function
A multi-objective optimization problem is considered here. Apart from network power losses, the total operation cost and the network voltage deviation are also considered. The multi-objective problem is converted to a single objective problem by the method of weighting aggregation.
where is the probability of scenario s and Ns is the total number of scenarios. Equation (4) is the active power losses of ADN; Equation (5) computes the ADN’s operation cost, including buying the electricity payment from the main grid (including the network losses) and the operation cost of DG and ESS, respectively; Equation (6) calculates the voltage deviation of all the buses during a day; is the electricity price at time t; is the cost coefficient of DG; represents the operation cost of battery charge and discharge considering the battery life; is the penalty coefficient of voltage deviation and is set to be 10 in this paper; , , and are weight coefficients and .
2.3. Constraints
2.3.1. Power Flow Constraints
Since the topology of distribution networks is radial, the commonly used branch flow formulation [33] can be utilized to describe the power flow. Note that the subscript s is omitted for convenience of expression.
and
where and are the active/reactive power flow from bus i to j; and mean the set of all parents and children of bus j, respectively; and are the elements of admittance matrix; is the node voltage magnitude of bus i; and are the injected active/reactive power of bus j; and are the active/reactive load for bus j; , , and are the charging power of ESS, the discharging power of ESS, and the output of DG, respectively; , , and are the reactive compensations of DG, CBs, and static Var generator (SVG), respectively.
2.3.2. On Load Tap Changers
By choosing different transformer ratios, the voltage at the secondary side can be adjusted in a certain range. Suppose the primary voltage is fixed, the secondary side voltage can be expressed as
where is voltage of transformer in primary side; is the square of ratio at time period t, which is a non-integer discrete variable and can be expressed as Equation (11) by introducing binary variables .
where and ; is the square of ratio in i-tap position. N is the number of tap ratios. The OLTC is assumed to have 11 taps within the range of ±5% in this paper.
According to the practical operation experience of the substation, the allowable adjustment times of OLTC is set to be 6 times per day in this paper. Suppose the initial position is 0, i.e., , , then
2.3.3. Capacitor Banks
Capacitor banks (CBs) are the most common reactive power compensation device in distribution network due to its economic efficiency. This paper assumes that the output of CBs is independent of the voltage and only decided by the value of reactive power [34].
where and are the step number and step size of the k-th CBs at time t, respectively; is the maximal step number of the k-th CBs.
Similar to OLTC, the daily switching times of a CB is also limited and the maximum action time of CBs is
where sign represents the symbolic function.
2.3.4. Static Var Generator
Unlike CBs, SVG can be adjusted continuously to cope with the voltage fluctuation caused by intermittent renewable energy resources more flexibly.
2.3.5. Operating Constraints of Distributed Generations
Both non-adjustable DGs, such as wind turbine (WT) and PV, and dispatchable DGs, such as micro turbine (MT), are considered in this paper. It is assumed that all the DGs are connected to the distribution network through inverters and they can generate active and reactive power simultaneously [34,35]. The constraints of WT, PV, and MT are represented by Equations (16)–(18), respectively.
where , , and are the inverter capacities of WT, PV, and MT, respectively; and are the ramp-up and ramp-down rates of MT, respectively.
2.3.6. Energy Storage System
In addition, ESS has a certain reactive power regulation capacity in the process of charging and discharging as well.
where is the inverter capacity of ESS.
2.3.7. Security Constraints
The nodal voltage magnitude and line flow should be constrained in the reasonable region.
3. Solution Method
As the second-order cone programming (SOCP) problem is a convex optimization problem and can be calculated in a polynomial time, it is widely used to deal with practical engineering problems within power system.
3.1. Brief Introduction of Second-Order Cone Programming and Second-Order Cone Programming Relaxation
The standard form of the SOCP is
where is the optimization variable; , , , , , , and ; is the Euclidean norm.
Here, a brief description of the SOCP relaxation process is shown in Figure 1. is assumed to be the nonconvex feasible region of the original model. SOCP relaxation is used to enlarge the original feasible region to a convex set . It is obvious that contains . If the optimal solution S exactly lies in , the SOCR is strict and S is also the optimal solution of the original model [36,37].
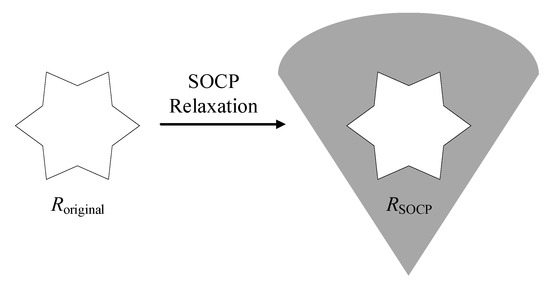
Figure 1.
Schematic diagram of second-order cone programming (SOCP) relaxation.
3.2. Transformation of the Proposed Model
Since the power flow Equation (8) results in the non-convexity of the proposed coordinated optimization model, the SOCP relaxation is used to transform it into a convex SOCP problem.
Firstly, two new variables, and , are introduced. Let and . In this way, constraints (4), (6), (8), and (26) can be restated as follows:
After the above deformation, the original nonconvex power flow Equation (8) has been transformed to a linear Equation (30). However, a new equality constraint is produced as Equation (32), with which the proposed model is still nonconvex.
Then the SOCP relaxation is applied to Equation (32) as
Note that, Equation (33) is equal to Equation (34)
Therefore, the standard second-order cone format of Equation (33) is
After the conic relaxation (Equation (35)) and the transformation (Equations (28)–(31)), the original dynamic coordinated active–reactive power optimization model (Equations (3)–(26)) is transformed into a MISOCP problem as follows:
s.t. Equations (7),(9)–(25),(30),(31),(35)
It is no doubt that the solutions obtained in the relaxed convex domain after the SOCP relaxation are the lower bound solutions of original problem since the original feasible region is enlarged. If the solutions obtained after the SOCP relaxation are within the feasible domain of the original problem, they are the optimum solutions of the original problem as well.
4. Case Studies
In order to verify the feasibility of the proposed dynamic coordinated optimization model of ADN, 33-bus and 69-bus distribution networks were used as the test network. All experiments were carried out on a personal computer with an Intel Core i5-8600K CPU and 16 GB of RAM using MATLAB 2018a, where the MISOCP problem were solved by YALMIP and GUROBI [38] toolbox.
4.1. Basic Data
The 33-bus distribution network is shown in Figure 2. The initial load is used as the base load. Parameters of DGs are given in Table 1 and ESSs are given in Table 2. The inverter capacity of WT, PV, and MT is 1.05 times of the rated power. The ramp rate of MT is 150 kW/h. Two CBs are connected to bus 8 and bus 13, whose capacity are both [0, 0.5] MVar with a step size of 0.05 MVar. An SVG with a capacity of [−0.1, 0.4] MVar is located at bus 30. The adjustment step of OLTC is 0.01 and the switchable range is [0.94, 1.06] pu. The initial storage capacity of ESS I and ESS II are 200 kW and 100 kW, respectively. Moreover, the state of charge (SOC) is always between 20% and 90% to extend the battery life. The time-of-use electricity price is shown in Table 3. The price of power loss is 0.68 ¥/kWh, while the operation and maintenance cost of MT and ESS are 0.38 ¥/kWh and 0.05 ¥/kWh, respectively. Figure 3 depicts the forecast data of the load [39] and the WT and PV power output (percentages of corresponding rated power). The forecast errors of WT and PV are assumed to be 10% of the mean value. By using the MCS and the backward scenario reduction technique, 20 representative scenarios are finally produced in this paper.
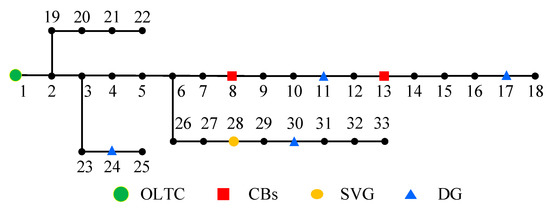
Figure 2.
Topology of 33-bus distribution network.

Table 1.
Parameters of DG.
Table 2.
Parameters of energy storage systems (ESSs).
Table 3.
Time-of-use electricity price.
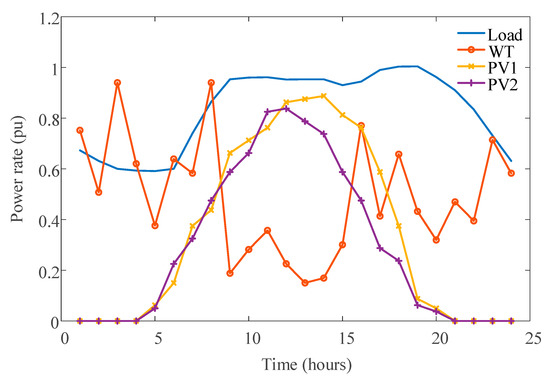
Figure 3.
Day-ahead power prediction of the load, wind turbine (WT) and photovoltaics (PVs).
For the 69-bus system, as shown in Figure 4, MT, WT, PV1, and PV2 are connected to buses 23, 47, 50, and 66, respectively. An SVG is located at bus 44. Two CBs are connected to buses 15 and 25. The parameters of DG, CBs, SVG, and ESS are the same as those in the 33-bus distribution network.
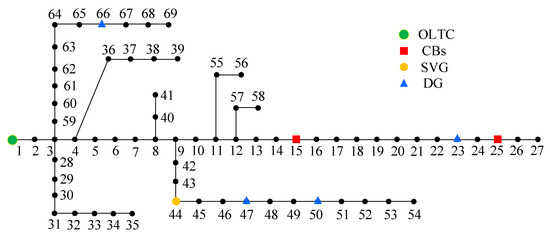
Figure 4.
Topology of 69-bus distribution network.
4.2. Optimization Results of the Proposed Model
The optimized dispatch results of ESSs for the 33- and 69-bus distribution networks are shown in Figure 5 and Figure 6, respectively. The ESSs charge energy from the network during the valley and flat periods when the electricity prices are low (e.g., t = 1–6 and t = 13–17), and release the stored power to support the network during peak periods (e.g., t = 10–12 and t = 18–22), which indicates that ESSs are able to reduce the operation cost by shifting some load to valley periods. In addition, the SOC of the ESSs is always between 20% and 90% so as to extend the battery life and the final state of ESSs are equal to the initial state in a day.
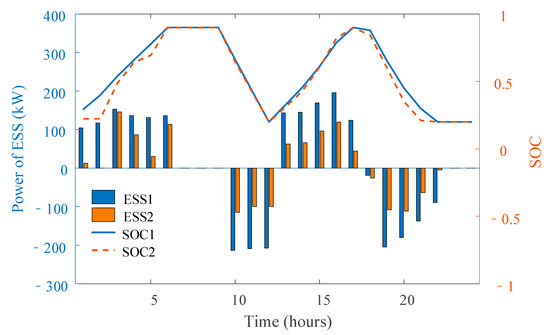
Figure 5.
The optimized dispatch results of ESSs for 33-bus distribution network.
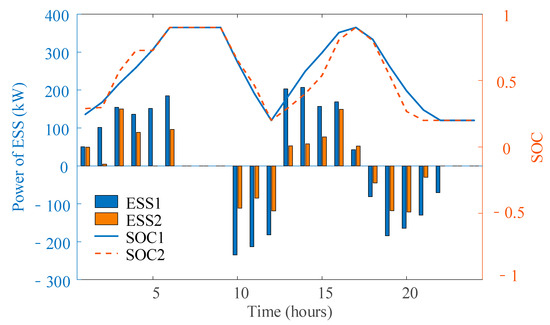
Figure 6.
The optimized dispatch results of ESSs for 69-bus distribution network.
Comparison of MT output with and without ESS for 33-bus distribution network is shown in Figure 7. As can be seen from the figure, during the peak period and flat period, the electricity price of the main grid is higher than the generation cost of MT. So, it is reasonable that MT generates maximum output to decrease the purchase cost from the main grid. It is worth noting that in valley periods when the cost of MT power generation is a little higher than the electricity price of the main grid, the MT still has a certain output. The reason is analyzed as follows. Due to the large R/X ratio of distribution systems, the active power scheduling affects the power losses as well. MT can help the network run more economically through reducing the network power losses, though the cost of MT power generation is slightly higher. In addition, the comparison between with ESS and without ESS indicates that the MT can cooperate with ESS to further reduce the operation cost of ADN, resulting in more MT output in valley times.
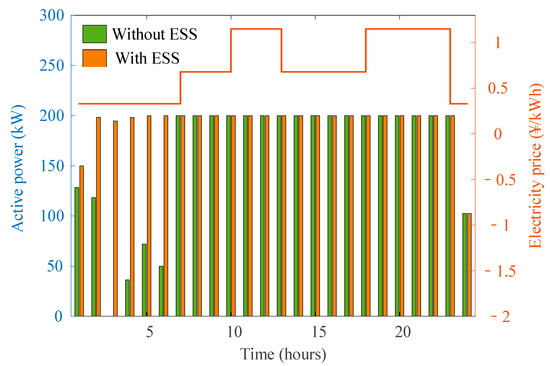
Figure 7.
Output of micro turbine (MT).
Figure 8 shows the optimized hourly dispatch results of OLTC for the two distribution networks. It can be clearly seen that the constraints of OLTC action times are satisfied.
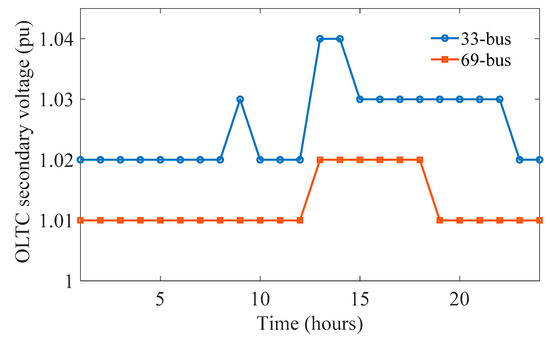
Figure 8.
The optimized dispatch results of on-load tap changer (OLTC).
The results of different reactive power-regulating devices for 33-bus distribution network are shown in Figure 9. It is easy to see that the reactive power outputs of all the devices are within respective output limits, and the constraints of action time of CBs are satisfied. Note that the reactive power outputs of PV2 and WT are opposite to their active power due to the limit of the inverter capacity, while the reactive power output of PV1 still has a certain regulation range, which will enhance its ability to deal with system uncertainties.
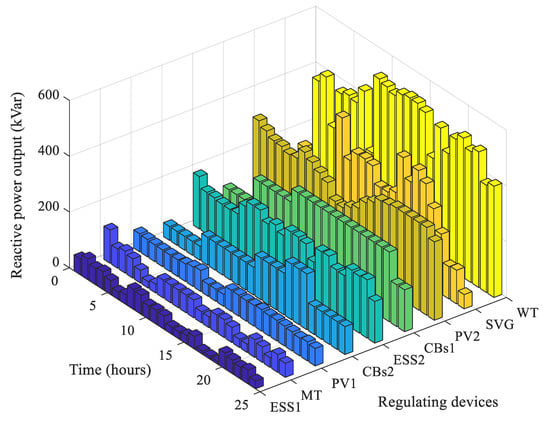
Figure 9.
The optimization results of different reactive power-regulating devices.
The detailed results before and after the coordinated optimization are indicated in Table 4. It can be calculated that for the 33-bus distribution network, the power losses, the total operation cost and the voltage deviation are decreased by 57.10%, 7.27%, and 75.34%, respectively. For the 69-bus distribution network, the power losses, the total operation cost, and the voltage deviation are decreased by 46.98%, 6.87%, and 47.32%, respectively. The curves of bus voltage amplitude of 33- and 69-bus distribution networks after optimization are shown in Figure 10 and Figure 11, respectively. It is clear that the voltage constraints of all the buses are satisfied and the voltage level is significantly improved.
Table 4.
Comparison of optimization results of the two distribution networks.
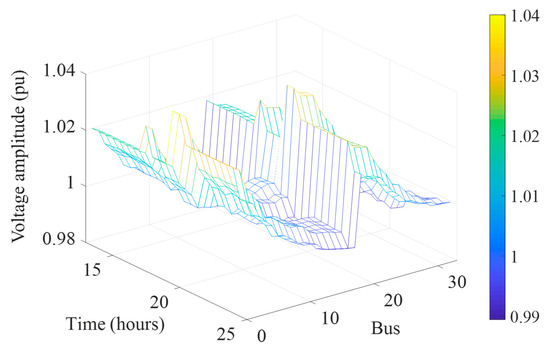
Figure 10.
Bus voltage amplitude of 33-bus distribution network.
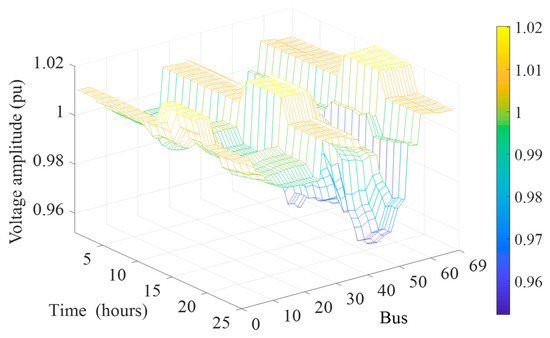
Figure 11.
Bus voltage amplitude of 69-bus distribution network.
It can be concluded that both the economy and security of the distribution networks are enhanced through coordinated optimization.
4.3. Discussion
4.3.1. Comparison of Different Cases
In order to better analysis the effect of the active power dispatch of ESSs and the reactive power regulation of DGs and ESSs, four cases are used for comparative analysis as follows.
Case 1: Both the active power dispatch of ESSs and the reactive power regulation of DGs and ESSs are not considered;
Case 2: Only active power dispatch of ESSs is considered;
Case 3: Only the reactive power regulation of DGs and ESSs is considered;
Case 4: Both the active power dispatch of ESSs and the reactive power regulation of DGs and ESSs are considered.
The comparison of optimization results under different cases are shown in Table 5.
Table 5.
Optimization results of the two distribution networks under different cases.
Comparing Case 1 with Case 2 and Case 3 with Case 4 of the two distribution networks, we can find that active power dispatch of ESSs helps reduce the operation cost while there is little difference in the network losses. It implies that ESSs mainly reduce the operation cost by shifting load from high electricity price hours to low electricity price periods. Comparing Case 1 with Case 3 and Case 2 with Case 4, it can be seen that the network losses are further decreased by taking the reactive power regulation of DGs and ESSs into consideration. Therefore, the total operation cost is reduced as well. In addition, the voltage deviation is better improved. According to Case 4, the active power losses, the operation cost, and voltage deviation are all lowest when coordinated optimization of active/reactive power is conducted. Therefore, as information and communication technologies advance, coordinated optimization is a better choice for distribution system operators.
4.3.2. Comparison of Different Methods
In order to reflect the advantages of the proposed MISOCP model in this paper, the intelligent method (PSO algorithm) is used to solve the original MINLP problem and the results of the two methods are shown in Table 6 (using the prediction power of the load, WT and PV in Figure 3 as the test scenario).
Table 6.
Optimal results of the two methods.
It can be seen that the proposed method in this paper is superior to the PSO algorithm in terms of solving quality and the computational time is much less than that of the PSO algorithm. This is mainly because the original MINLP problem contains a number of integer variables and the PSO algorithm easily gets stuck at a locally optimal value. Thus, it may take multiple iterations for the PSO to jump out of partial optimization, giving it a low computational efficiency. However, the difficulty of the original MINLP problem is significantly reduced by conic relaxation, thus the proposed method performs better than the PSO algorithm.
4.3.3. Relaxation Accuracy Analysis
In order to verify the accuracy of SOCP relaxation, the gap of conic relaxation is defined as
The gaps of all branches of the 69-bus distribution network during 24 h are shown in Figure 12. It is obvious that the order of magnitude of all the gaps is 10−6, which implies that the conic relaxation is actually exact to the original nonconvex model. Thus, the accuracy of SOCP relaxation is verified.
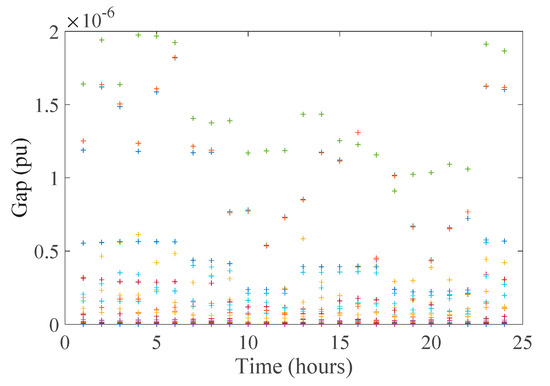
Figure 12.
Scatter diagram of relaxation error of 69-bus distribution network.
5. Conclusions
This paper proposed a dynamic coordinated optimization model for joint dispatch of active and reactive resources in ADN with ESSs. Taking the power losses, the operation cost, and the voltage deviation of the distribution network into consideration, an MINLP optimization model was formulated, which was further transformed into an MISOCP model by SOCP relaxation to reduce the difficulty of problem solving. The comparison with the original MINLP model (solved by PSO) on 33- and 69-bus distribution network shows the effectiveness and efficiency of the proposed method.
The main contributions and the conclusions are summarized as follows:
(1) The power losses, the operation cost, and the voltage deviation can be improved significantly after the coordinated active-reactive optimization.
(2) The SOCP relaxation is used to transform the original MINLP model into a MISOCP model, thus reducing the difficulty of problem solving and verifying the exactness of SOCP relaxation.
(3) ESSs help to reduce the total operation cost of an ADN effectively.
(4) The reactive power regulation of DGs and ESSs play an important role in improving the system security and economy.
Author Contributions
Writing—original draft, L.W.; writing—review and editing, X.W.; conceptualization, C.J.; resources, S.Y.; data curation, M.Y.
Funding
This research was funded by National Key R&D Program of China, grant number 2018YFB0905200 and Project Supported by State Grid Henan Economic Research Institute, grant number 52170018000S.
Conflicts of Interest
The authors declare no conflict of interest.
References
- Ding, T.; Bo, R.; Sun, H.B.; Li, F.X.; Guo, Q.L. A Robust Two–level coordinated static voltage security region for centrally integrated wind farms. IEEE Trans. Smart Grid 2017, 7, 460–470. [Google Scholar] [CrossRef]
- Elsaiah, S.; Benidris, M.; Mitra, J. An analytical approach for placement and sizing of distributed generators on power distribution system. IET Gener. Transm. Distrib. 2014, 8, 1039–1049. [Google Scholar] [CrossRef]
- Vita, V.; Alimardan, T.; Ekonomou, L. The impact of distributed generation in the distribution networks’ voltage profile and energy losses. In Proceedings of the 9th IEEE European Modelling Symposium on Mathematical Modelling and Computer Simulation, Madrid, Spain, 6–8 October 2015; IEEE: Piscataway, NJ, USA, 2015; pp. 260–265. [Google Scholar]
- Kaloudas, C.G.; Ochoa, L.F.; Marshall, B. Assessing the future trends of reactive power demand of distribution networks. IEEE Trans. Power Syst. 2017, 32, 4278–4288. [Google Scholar] [CrossRef]
- Chen, L.W.; Li, H.Y. Optimized reactive power supports using transformer tap stagger in distribution networks. IEEE Trans. Smart Grid 2017, 8, 1987–1996. [Google Scholar] [CrossRef]
- Hu, J.J.; Marinelli, M.; Coppo, M.; Zecchino, A.; Bindner, H.W. Coordinated voltage control of a decoupled three–phase on–load tap changer transformer and photovoltaic inverters for managing unbalanced networks. Electr. Power Syst. Res. 2016, 131, 264–274. [Google Scholar] [CrossRef]
- Fallahzadeh-Abarghouei, H.; Nayeripour, M.; Hasanvand, S. Online hierarchical and distributed method for voltage control in distribution smart grids. IET Gener. Transm. Distrib. 2016, 11, 1223–1232. [Google Scholar] [CrossRef]
- Keane, A.; Ochoa, L.F.; Borges, C.L.T.; Ault, G.W.; Alarcon-Rodriguez, A.D.; Currie, R.A.F.; Pilo, F.; Dent, C.; Harrison, G.P. State–of–the–art techniques and challenges ahead for distributed generation planning and optimization. IEEE Trans. Power Syst. 2013, 28, 1493–1502. [Google Scholar] [CrossRef]
- Coath, G.; Al-Dabbagh, M.; Halgamuge, S.K. Chaotic PSO–based VAR control considering renewables using fast probabilistic power flow. IEEE Trans. Power Deliv. 2014, 29, 1666–1674. [Google Scholar]
- Shaw, B.; Mukherjee, V.; Ghoshal, S.P. Solution of reactive power dispatch of power systems by an opposition–based gravitational search algorithm. Int. J. Electr. Power 2014, 55, 29–40. [Google Scholar] [CrossRef]
- Saraswat, A.; Saini, A.; Saxena, A.K. A novel multi–zone reactive power market settlement model: A pareto–optimization approach. Energy 2013, 51, 85–100. [Google Scholar] [CrossRef]
- Nguyen, T.T.; Dinh, B.H.; Quynh, N.V.; Duong, M.Q.; Dai, L.V. A novel algorithm for optimal operation of hydrothermal power systems under considering the constraints in transmission networks. Energies 2018, 11, 188. [Google Scholar] [CrossRef]
- Wei, H.; Sasaki, H.; Kubokawa, J.; Yokoyama, R. An interior point nonlinear programming for optimal power flow problems with a novel data structure. IEEE Trans. Power Syst. 1998, 13, 870–877. [Google Scholar] [CrossRef]
- Zheng, W.Y.; Wu, W.C.; Zhang, B.M.; Sun, H.B.; Liu, Y.B. A fully distributed reactive power optimization and control method for active distribution networks. IEEE Trans. Smart Grid 2014, 7, 1021–1033. [Google Scholar] [CrossRef]
- Mohamadreza, B.; Reza, H.M.; Mehrdad, G. Second–order cone programming for optimal power flow in VSC–type–AC–DC grids. IEEE Trans. Power Syst. 2013, 28, 4282–4291. [Google Scholar]
- Ding, T.; Cheng, L.; Li, F.X.; Chen, T.E.; Liu, R.F. A bi–objective DC–optimal power flow model using linear relaxation–based second order cone programming and its Pareto Frontier. Int. J. Electr. Power 2017, 88, 13–20. [Google Scholar] [CrossRef]
- Baradar, M.; Hesamzadeh, M.R. AC power flow representation in conic format. IEEE Trans. Power Syst. 2015, 30, 546–547. [Google Scholar] [CrossRef]
- Yang, Z.F.; Zhong, H.W.; Xia, Q.; Kang, C.Q. Solving OPF using linear approximations: Fundamental analysis and numerical demonstration. IET Gener. Transm. Distrib. 2017, 11, 4115–4125. [Google Scholar] [CrossRef]
- Cagnano, A.; De Tuglie, E.; Bronzini, M. Multiarea voltage controller for active distribution networks. Energies 2018, 11, 583. [Google Scholar] [CrossRef]
- Cagnano, A.; De Tuglie, E. A decentralized voltage controller involving PV generators based on Lyapunov theory. Renew. Energy 2016, 86, 664–674. [Google Scholar] [CrossRef]
- Duong, M.Q.; Sava, G.N. Coordinated reactive power control of DFIG to improve LVRT characteristics of FSIG in wind turbine generation. In Proceedings of the 2017 International Conference on Electromechanical and Power Systems (SIELMEN), Iasi, Romania, 11–13 October 2017; IEEE: Piscataway, NJ, USA, 2017; pp. 256–260. [Google Scholar]
- Shi, N.; Luo, Y. Bi–level programming approach for the optimal allocation of energy storage systems in distribution networks. Appl. Sci. 2017, 7, 398. [Google Scholar] [CrossRef]
- Zhang, Y.X.; Zhao, Y.D.; Luo, F.J.; Zheng, Y.; Meng, K.; Kit, P.W. Optimal allocation of battery energy storage systems in distribution networks with high wind power penetration. IET Renew. Power Gener. 2016, 10, 1105–1113. [Google Scholar] [CrossRef]
- Jiang, X.; Nan, G.L.; Liu, H.; Guo, Z.M.; Zeng, Q.S.; Jin, Y. Optimization of battery energy storage system capacity for wind farm with considering auxiliary services compensation. Appl. Sci. 2018, 8, 1957. [Google Scholar] [CrossRef]
- Bahramipanah, M.; Cherkaoui, R.; Paolone, M. Decentralized voltage control of clustered active distribution network by means of energy storage systems. Electr. Power Syst. Res. 2016, 136, 370–382. [Google Scholar] [CrossRef]
- Kabir, M.N.; Mishra, Y.; Ledwich, G. Coordinated control of grid connected photovoltaic reactive power and battery energy storage systems to improve the voltage profile of a residential distribution feeder. IEEE Trans. Ind. Inform. 2014, 10, 967–977. [Google Scholar] [CrossRef]
- Luo, F.; Meng, K.; Dong, Z.Y. Coordinated operational planning for wind farm with battery energy storage system. IEEE Trans. Sustain. Energy 2015, 6, 253–262. [Google Scholar] [CrossRef]
- Nieto, A.; Vita, V.; Maris, T.I. Power quality improvement in power grids with the integration of energy storage systems. Int. J. Eng. Res. Technol. 2016, 5, 438–443. [Google Scholar]
- Akhavan-Hejazi, H.; Mohsenian-Rad, H. Optimal operation of independent storage systems in energy and reserve markets with high wind penetration. IEEE Trans. Smart Grid 2014, 5, 1088–1097. [Google Scholar] [CrossRef]
- Chen, S.X.; Gooi, H.B.; Wang, M.Q. Sizing of energy storage for microgrids. IEEE Trans. Smart Grid 2012, 3, 142–151. [Google Scholar] [CrossRef]
- Rafiee Sandgani, M.; Sirouspour, S. Coordinated optimal dispatch of energy storage in a network of grid–connected microgrids. IEEE Trans. Sustain. Energy 2017, 8, 1166–1176. [Google Scholar] [CrossRef]
- Fan, H.; Yuan, Q.Q.; Cheng, H.Z. Multi–objective stochastic optimal operation of a grid–connected microgrid considering an energy storage system. Appl. Sci. 2018, 8, 2560. [Google Scholar] [CrossRef]
- Ding, T.; Liu, S.Y.; Wu, Z.Y.; Bie, Z.H. Sensitivity–based relaxation and decomposition method to dynamic reactive power optimization considering DGs in active distribution networks. IET Gener. Transm. Distrib. 2016, 11, 37–48. [Google Scholar] [CrossRef]
- Liu, Y.; Wu, W.C.; Zhang, B.M.; Li, Z.S.; Li, Z.G. A mixed integer second–order cone programming based active and reactive power coordinated multi–period optimization for active distribution network. Proc. Chin. Soc. Electr. Eng. 2014, 34, 2575–2583. [Google Scholar]
- Daratha, N.; Das, B.; Sharma, J. Coordination between OLTC and SVC for voltage regulation in unbalanced distribution system distributed generation. IEEE Trans. Power Syst. 2014, 29, 289–299. [Google Scholar] [CrossRef]
- Farivar, M.; Low, S.H. Branch flow model: Relaxations and convexification—Part I. IEEE Trans. Power Syst. 2013, 28, 2554–2564. [Google Scholar] [CrossRef]
- Farivar, M.; Low, S.H. Branch flow model: Relaxations and convexification—Part II. IEEE Trans. Power Syst. 2013, 28, 2565–2572. [Google Scholar] [CrossRef]
- Lee, C.; Liu, C.; Mehrotra, S.; Bie, Z.H. Robust distribution network reconfiguration. IEEE Trans. Smart Grid 2015, 6, 836–842. [Google Scholar] [CrossRef]
- Zhang, C.; Xu, Y.; Dong, Z.Y. Robust Coordination of distributed generation and price–based demand response in microgrids. IEEE Trans. Smart Grid 2018, 9, 4236–4247. [Google Scholar] [CrossRef]


© 2019 by the authors. Licensee MDPI, Basel, Switzerland. This article is an open access article distributed under the terms and conditions of the Creative Commons Attribution (CC BY) license (http://creativecommons.org/licenses/by/4.0/).