Article

Determination of Volatile Components from Live Water Lily Flowers by an Orthogonal-Array-Design-Assisted Trapping Cell

1
Department of Cosmetic Science, Providence University, 200, Sec. 7, Taiwan Boulevard, Shalu Dist., Taichung 43301, Taiwan
2
Department of Data Science and Big Data Analytics, Providence University, 200, Sec. 7, Taiwan Boulevard, Shalu Dist., Taichung 43301, Taiwan
*
Author to whom correspondence should be addressed.
Appl. Sci. 2019, 9(7), 1269; https://doi.org/10.3390/app9071269
Submission received: 12 December 2018 / Revised: 31 January 2019 / Accepted: 21 March 2019 / Published: 27 March 2019
(This article belongs to the Section Applied Biosciences and Bioengineering)

Abstract

:

Featured Application

The developed trapping cell device can be used as a collector for analysis of biogenic volatiles from live plants.

Abstract

A convenient and easy-moving, modified, headspace solid-phase microextraction (HS-SPME) device was developed for monitoring a living plant’s volatile organic compounds (VOCs). It consisted of a polyethylene terephthalate (PET) bottle as a sampling chamber, and certain variables were considered when using the HS-SPME device, including the material used and the fiber position, the direction of the airstream, and the distance between the sample and the fan. The results from varying those factors, generated by the orthogonal array design (OAD) method, were used to optimize the modified HS-SPME conditions. Based on the current literature regarding extracting fragrances by SPME, we selected polydimethylsiloxane/divinylbenzene (PDMS/DVB) and polydimethylsiloxane (PDMS) as the fiber materials. Using the OAD method, PDMS/DVB was found to be the better fiber material when it was parallel to the fan, and also when the airstream provided positive pressure to the sample with the fan near the sample. The device was used to sample biogenic volatile compounds emitted from fresh Nymphaea caerulea (water lily) flowers, followed by gas chromatography-mass spectrometry (GC-MS) analysis. For the method validation, under the optimum conditions, the calculated detection limit value of the model compound (butyl decanoate) was 0.14 ng on column, which was equal to 1.41 ppm for the injection. The relative standard deviations of the intra-day and inter-day precisions were 1.21% and 3.05%. Thirty-three compounds were separated and identified. The main components in the vapor phase of N. caerulea were benzyl acetate (10.4%), pentadecane (15.5%), 6,9-heptadecadiene (40.1%), and 8-heptadecene (15.3%).

1. Introduction

Aromatic plants have been studied in recent years due to their biological characteristics and have been used in the food, cosmetics, and pharmaceutical industries [1,2,3,4]. Most aromatic plants produce volatile organic compounds (VOCs) which people find to be pleasing, so they are cultivated worldwide and used in seasonings, perfumes, ethereal oils, and so on. Most of these plants have their own peculiar characteristics, and in order to acquire their essence, researchers must isolate them in a suitable amount of time [5]. Water lily, Nymphaeaceae Salisbury, is a common family of aquatic plants which is widely cultivated in Asia and used in medical, food, cosmetics, and tea processing. Among members of this family, Nymphaea caerulea Savigny is one of most cultivated water lily species in many countries [6]. The chemical composition of water lily is quite complex and the aroma is a light and elegant fragrance that appeals to the human sensory system. However, when a plant’s VOCs spread into the atmosphere, the concentration ranges from parts per trillion to parts per billion, and such a light aroma is barely noticeable to humans [7].
Several analytical methods have been developed to determine the volatile constituents present in flowers. These methods include using Soxhlet extraction [8], steam or water distillation [9,10], and solvent extraction [11] to produce essential oils, which are subjected to gas chromatography–mass spectrometry (GC-MS) for compound separation and identification [12]. However, the drawback of these extraction methods is that they create a substantial amount of waste solvents, are time-consuming, and require many samples. In order to overcome these problems, novel and fast processes must be applied. Solid-phase microextraction (SPME) was first introduced by Pawliszyn et al. [13]. This technology is a solvent-free, simple, and reliable method that combines extraction and concentration techniques into a single step. As such, combining SPME and GC-MS is useful for precisely studying a plant’s VOCs [14,15,16,17,18].
Water lily often blooms at daybreak, closes at nightfall, and has a short blossom period. Using SPME to detect water lily VOCs still requires time to extract; therefore, in order to obtain the VOCs in a limited amount of time, the combination of accelerating mass transfer and concentration is necessary. Furthermore, the size of the water lily flower is large; thus, it does not easily fit in a bottle. To discover the constituents of water lily VOCs in a short period of time, a modified headspace (HS)-SPME device has been established. However, Mookherjee et al. [19] stated that picked and living plants emit different scents and elements. Thus, to analyze a water lily’s actual VOCs, this study investigated only living plants.
Although some papers have reported methods for trapping volatile compounds, none of them have discussed experimental designs for optimizing the extraction cell. In this work, several variables for a homemade HS-SPME trapping cell device, including the position of the extraction fiber, the direction of air movement, and the distance between the sample and fan, were considered to optimally modify the HS-SPME design. In this case, optimization of the modified HS-SPME design was carried out using the orthogonal array design (OAD) method, which can estimate the results of experimental factor effects at the same time [20,21]. This provided some firm information concerning the best analytical conditions and revealed any interactions that might exist between the variables involved. The traditional method for optimization considers only one variable in an experiment, which neither takes into account the interaction effects among the variables nor fully explores the solution space for optimization [22,23].
The aim of this study was to develop an analytical methodology based on modified HS-SPME/GC-MS to determine the value of the recycled materials and improve extraction efficiency in order to monitor the water lily’s VOCs at different periods of blossom. For this, OAD and statistical methods were employed to optimize the modified HS-SPME device.

2. Materials and Methods

2.1. Reagents and Materials

In this study, fresh puerperal flowers of N. caerulea were purchased from a local flower market (Taichung, Taiwan). The N. caerulea flower was then recognized by a botanist according to a book of botanical illustrations.
A mixing alkanes standard solution, C8–C20 (Sigma-Aldrich, St. Louis, MO, USA), was used to establish the retention index for analyzing volatile compounds. Butyl decanoate (Tokyo Kasei Kogyo Co., Ltd.) was used as a model compound to optimize the sampling design device.
The extraction fibers of sorbents polydimethylsiloxane/divinylbenzene (PDMS/DVB, 100-μm thickness), polydimethylsiloxane (PDMS, 65-μm thickness), and a holder were all purchased from Supelco, Inc. (Bellefonte, PA, USA). The fibers were conditioned according to the manufacturer’s specifications before their first use. After injection, the fibers remained at the GC injection port for 10 min to eliminate any carry-over effect.

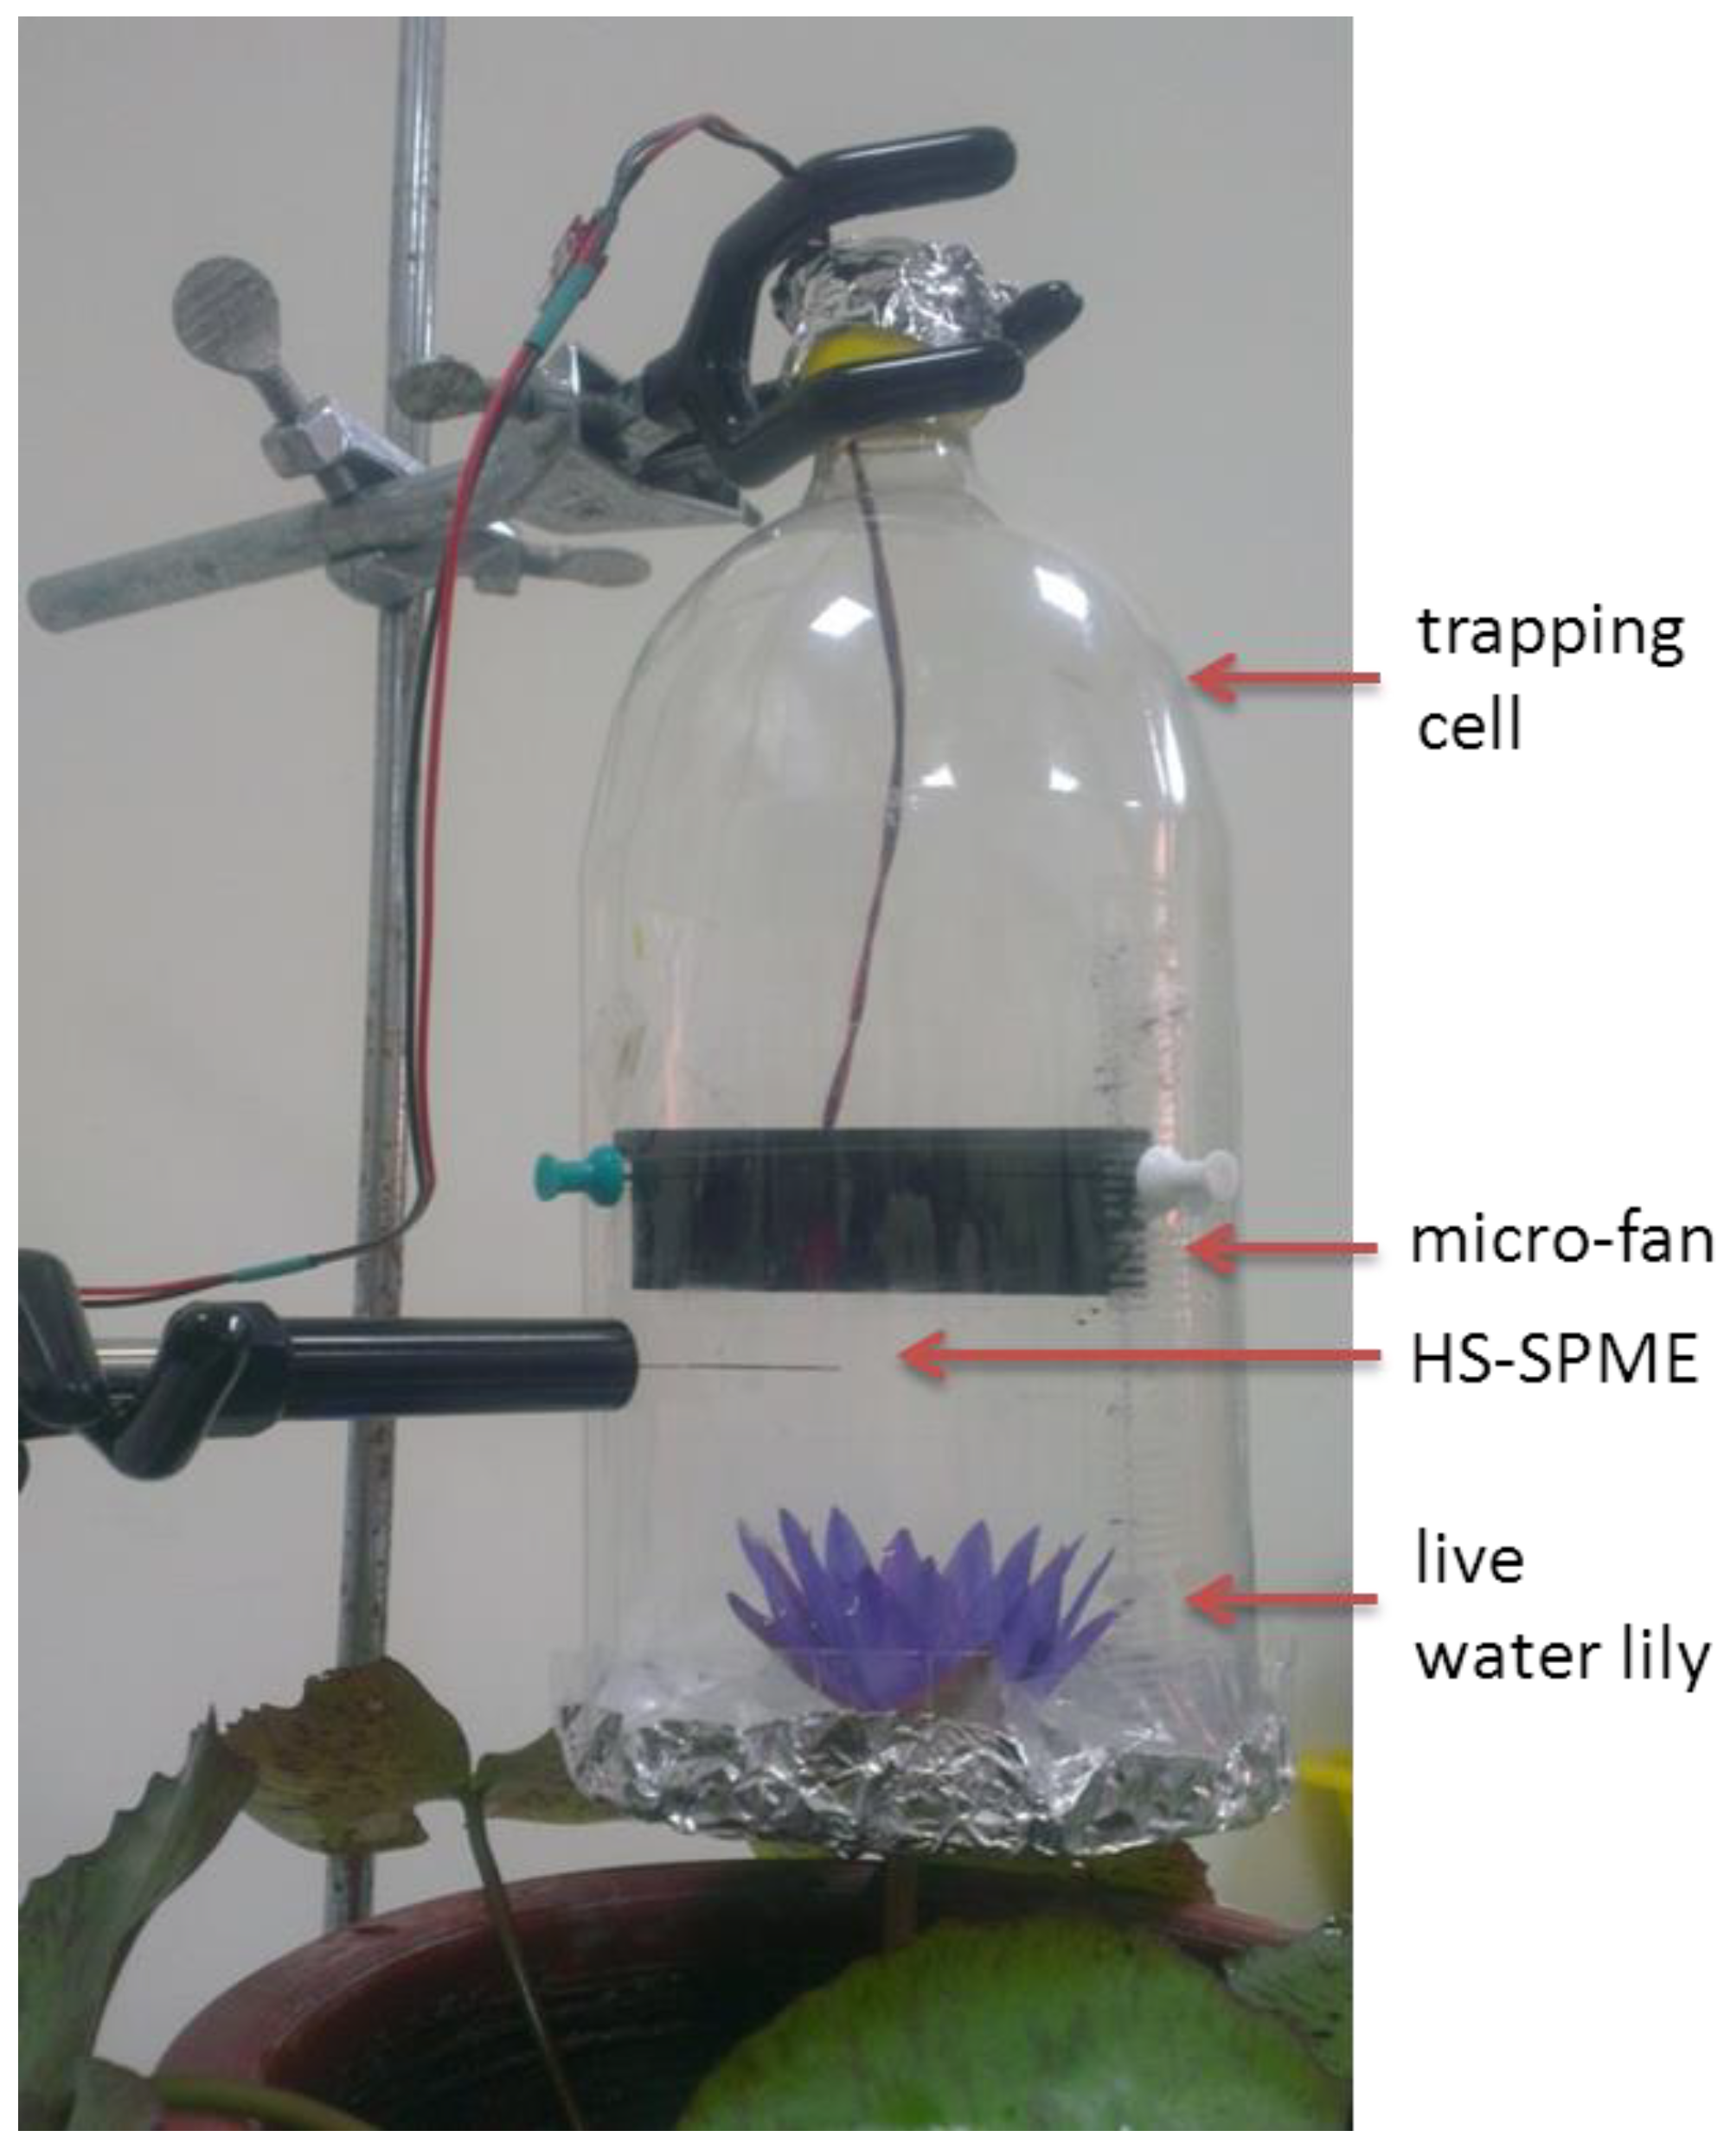
2.2. Optimizing the Sampling Device by Orthogonal Array Design

The homemade extraction device is shown in Figure 1. To facilitate the extraction of the volatile components emitted by live water lily, a ~2-L recycled polyethylene terephthalate (PET) plastic bottle was used as a chamber. The apparatus consisted of a PET chamber and thumbtacks, which were used to support a CF-12825MS microfan (Colorful, Shengzhen, China) powered by a BP 1.2-12 12 V DC power supply (Shykuang, Chiayi, Taiwan). To optimize the sampling device, the trapping cell was set up as an orthogonal array, and 2 μL of a 100 μg/mL model compound was used as the standard to drop on a glass slide, which was then loaded onto the device (around 1.5 L).
The parameters of this device were the angle and position of the fiber to the fan (A), the direction of air movement (B), the distance from the fan to the sample (C), and the two-variable interaction that affected the extraction efficiency. A two-level OAD L8 (27) matrix was applied, as shown in Table 1. The angle of the fiber to the fan (A) was either vertical or parallel. The airstream (B) was either under a positive or negative pressure relative to the flower. The distance of the fiber from the flower (C) was either at a fixed high or two low levels.

2.3. Sampling

The live water lily flower was inserted through the end of the chamber and then enveloped by aluminum foil to reduce the interference from the airstream. The purchased fiber was used according to the manufacturer’s protocol with the standard procedures. The absorption fiber was inserted, and the fan power was then turned on. The fiber was retracted, and then the extraction time was set at 10 min for optimizing the arrangement design and 15 min for sampling from the flower. Before sampling, the fan was turned on to clean the chamber and to ensure there was no carry over from previous experiments.

2.4. Instrumentation

The analysis was carried out using a Thermo Electron DSQ II GC–MS series (Austin, TX, USA) with a Trace GC Ultra gas chromatograph. Separation was carried out on a J&W DB-5 MS capillary column (30 m × 0.25 mm I.D., 0.25-µm film thickness) from Agilent Technologies (Palo-Alto, CA, USA). The GC-MS transfer line temperature was maintained at 275 °C. The following temperature program was employed: initial temperature 60 °C held for 2 min, ramped up at 3 °C/min to 250 °C, then ramped up at 10 °C min−1 to 280 °C (held for 5 min). Splitless mode (held for 5 min) was used for injection. The split flow was set at 20 mL min−1 and the injector temperature was kept at 250 °C. Helium (purity 99.9%) was employed as a carrier gas at a constant column flow of 1.0 mL min−1. The electron impact (EI) mode with an ionization voltage of 70 eV was used to ionize the analytes. The scan range of 50–300 m/z was set to determine the appropriate mass.

2.5. Identification of Components

The GC-MS data were processed using the Thermo Electron DSQ II software. Identification of the constituents was based on a comparison of the obtained mass spectra with those of a reference compound in the data system of the NIST Mass Spectral Search program (NIST 2.0 version mass spectral database, National Institute of Standards and Technology, Washington, DC, USA). The constituents were further confirmed by using the retention index (RI), a concept introduced by Van den Dool and Kratz for compound verification [24,25]:
RI = 100 × n +   t R ( X ) t R ( n ) t R ( n   +   1 ) t R ( n ) × 100
where RI is the retention index of a specific compound X, tR is the retention time, and X refers to the target compound that elutes from the GC column between two adjacent n-alkane reference compounds with carbon numbers n and n + 1. n refers to the n-alkane with n carbon atoms and n + 1 represents the n-alkane with n + 1 carbon atoms. Quantitative analysis in percent was performed by peak area normalization measurements.

2.6. Statistical Analysis

The experiments for all variables in each run were performed in triplicate under the same experimental conditions, and the data are shown as mean values. Statistical analysis was executed by using SPSS statistical software (Version 17.0, SPSS Inc., Chicago, IL, USA). The results from the OAD were analyzed by ANOVA. According to the methods given, the results of the sums of squares (SS) for all variables were calculated.

2.7. Standard Preparation and Method Validation

For model compound preparation, the butyl decanoate (used as standard) was diluted with methanol to a final concentration of 10 μg/mL. To validate the method, the model compound, instead of the real sample, was used to check the results and precision of the experiment. To avoid carryover from previous experiments, before the next test, the desorbed fiber was injected into the instruments again to make sure the molecule was completely desorbed. Under the optimum condition, the peak area of model compound was utilized to calculate the method detection limit (MDL) and intra-day and inter-day precisions (n = 4). In addition, the absolute mass of the injected compound from the extraction fiber was calculated by the calibration curve (R2 > 0.999). The MDL was calculated when signal-to-noise (s/n) = 3.

3. Results and Discussion

3.1. Optimization of the Device by Using OAD

Figure 1 shows a diagram of the homemade extraction device developed in this study. It was a 2-L recycled PET plastic bottle used as a chamber to facilitate the extraction of volatile components from a live water lily, which was still cultured in a water basin. The apparatus consisted of a chamber and thumbtacks to secure a microfan, and the HS-SPME part was inserted between the microfan and the live water lily (Figure 1).
The proper configuration was determined by using OAD to optimize the design to improve extraction efficiency. The configuration parameters included the angle and position of the fiber to the fan (A), the direction of air movement (B), and the distance from the fan to the sample (C). All the tested parameters and levels (high or low) are shown in Table 1 and Table 2. In Table 1, for the position of the fiber to the fan (A), the angle of the fiber to the fan was vertical or parallel, which referred to the setting level. For the direction of air movement (B), the airstream making positive or negative pressure was the level. For the distance from the fan to the sample (C), the distance of the fan from the flower was set as low/high, which referred to near/far, respectively. Further, the position of the fiber to the fan (A) displayed in Table 2, which is the same variable listed in Table 1, was modified as the location of the fiber to the fan and was set as up/down, referring to close to/far from the fan, respectively.
The fiber could not be placed at a vertical angle between the fan and the sample; thus, the angle effect is first discussed (Table 1). Because of the composition variation between flowers and flowering time, the peak area of the model compound, instead of the real sample, was used for evaluation. Due to the different constituents of volatile components of flowers caused by different plants and blossom seasons, a statistical method was required to objectively evaluate these differences. Eight experiments (runs) were performed according to the OAD method, and all of the average responses were in triplicate. From the direct analysis of the data from part 1, we can observe that the parameter effect order was B > C > A > B*C > A*B > A*C, and the results demonstrated that the A1B1C−1 group was the best assembly for this extract cell. This means that the effect of air movement direction on extraction efficacy was greater than others, and the interactions among the parameters were smaller than others. Moreover, when the angle of the fiber was parallel to the fan, the air movement direction produced positive pressure for the sample, and the distance from the fan was closer to the sample. To verify whether the effect of the variables on extraction efficiency was statistically significant, ANOVA was used to interpret the experimental data obtained from OAD optimization. Based on the ANOVA results, when p < 0.05, the variables were statistically significant. ANOVA showed that the effects of parameters of A, B, and C on the results were significant but independent of each other. The resulting equation is as follows: Y = 1858092 + 767975XA + 1120733XB − 429035XAB − 601766XC − 383569XAC + 495404XBC. In this equation, the coefficients of parameters A and B were positive, and C was negative. The result was the same as the direct analysis: the configuration of A1B1C−1 was the best.
To determine the effect of fiber position, the OAD L8 (27) matrix was used. In Table 2, the variable A was replaced as the position of the fiber to the fan, while the others remain the same. The results indicated that the two-variable interaction A × B had the highest range (kmaxk) value of 4,863,596 and exerted the largest effect on extraction efficiency (Table 2).
From the ANOVA table, the extent of the impact of the variables on extraction efficiency followed this order: the two-variable interaction A × B > variable A > variable C. The effects of the two-variable interaction B × C, variable B, and the two-variable interaction A × C on extraction efficiency were not significant.
Therefore, according to the results from the statistical analysis, we suggest that the better conditions were with (1) the fiber parallel and (2) down to the fan, and (3) the airstream providing positive pressure to the flower and (4) the fan being near the flower.
For the method validation, under the optimum condition, the calculated MDL value of the model compound was 0.14 ng on the column, which is equal to 1.41 ppm for the injection. Moreover, the relative standard deviations (RSD) of intra-day and inter-day precisions were 1.21% and 3.05%, respectively. Therefore, the results demonstrated that the performed method comply with the acceptance range.

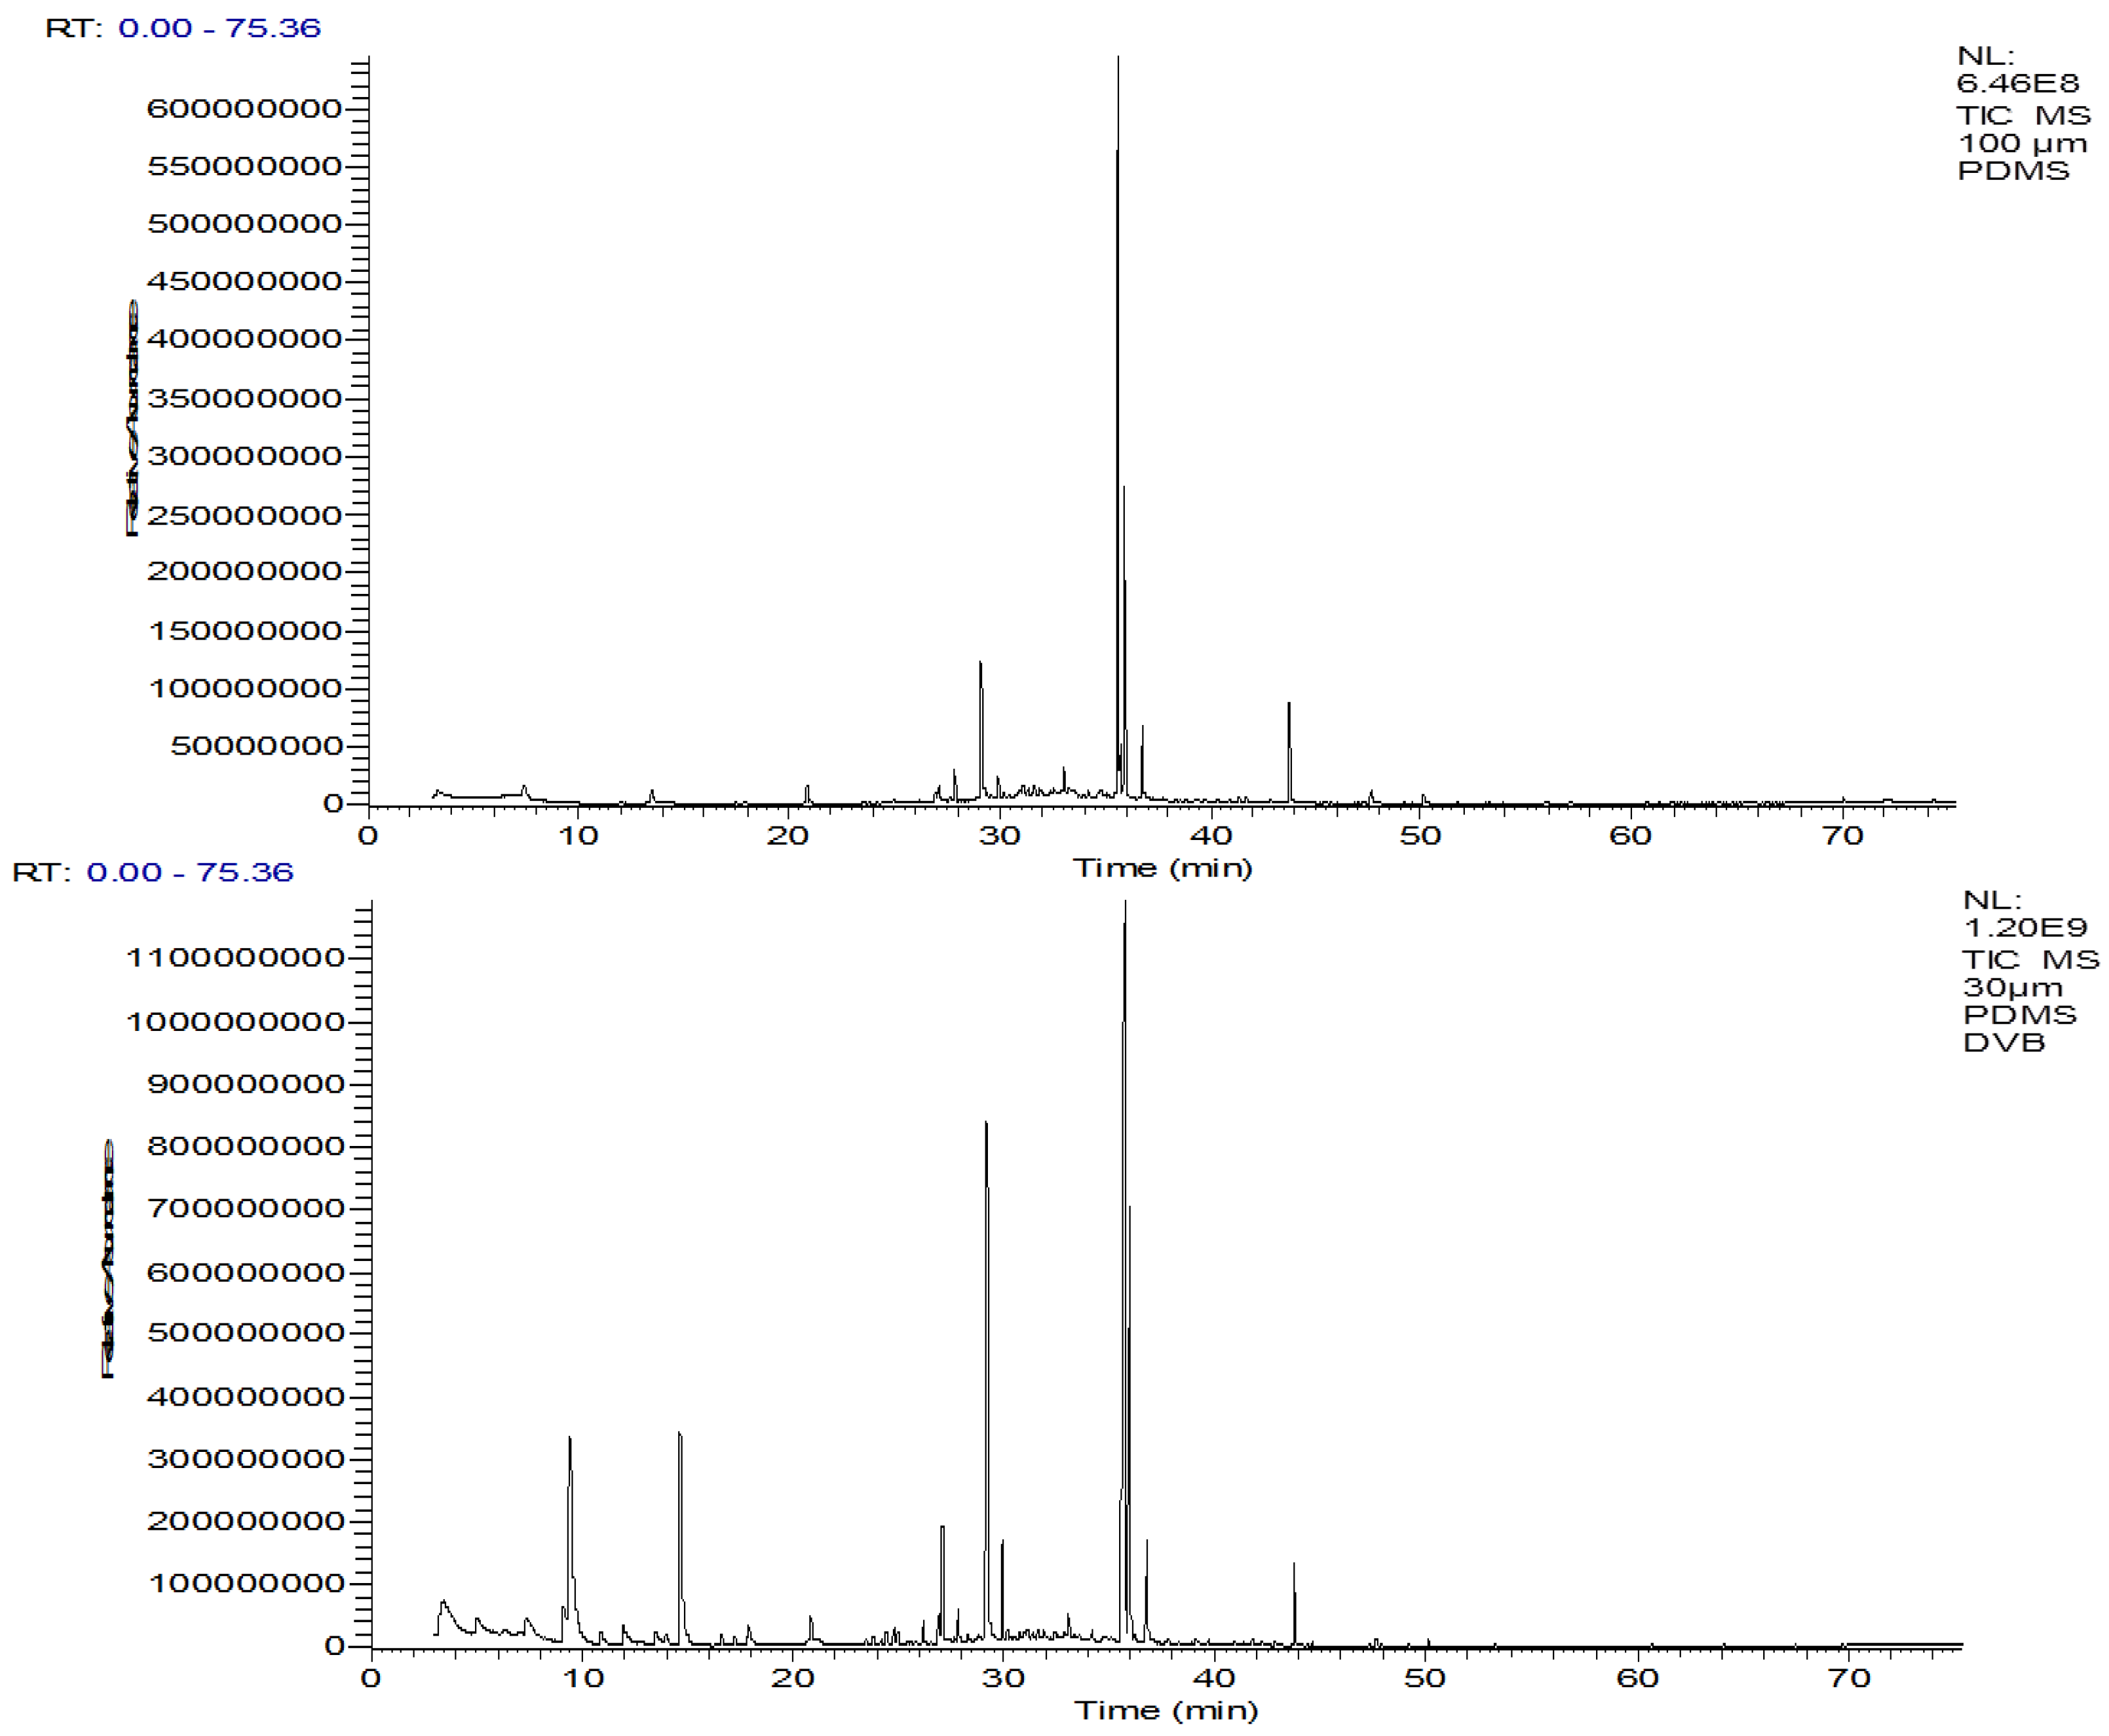
3.2. SPME Fiber Selection

Several fiber coatings are commercially available for the extraction of volatile compounds. The affinity of the fiber for an analyte depends on the principle of “like dissolves like”, and coating fibers with different properties or thicknesses can be selected. In this study, the fiber materials PDMS/DVB and polydimethylsiloxane (PDMS) were selected according to their fiber characteristics and the literature on extraction odors [26,27,28].
The selected chromatograms of volatile compounds (one of three replicates) from fresh water lily flowers extracted by using two fibers are displayed in Figure 2. As shown in Figure 2, when the extraction was performed using the PDMS/DVB fiber, the peak areas of most compounds were higher than those obtained from another fiber at equal extraction time. Hence, we selected the PDMS/DVB fiber for further study.

3.3. Device Extraction Efficiency

The same extraction fibers were used to absorb the volatile components emitted by the flower for 15 min. The parallel experiments—the optimum design with/without using a fan—were performed to evaluate the device’s extraction efficiency. The selected GC-MS analysis of volatile compounds (one of three replicates) is shown in Table 3.
According to the results in Table 3, 33 compounds were identified by GC-MS. Among them, benzyl acetate (10.4%), pentadecane (15.5%), 6,9-heptadecadiene (40.1%), and 8-heptadecene (15.3%) were the most abundant volatile compounds of live water lily. Further, the fan also affected the analysis. Because the mass transfer of VOCs was sped up by the airflow from the fan, the peak areas obtained from the two experiments were significantly different, as shown in Table 3. This demonstrated that the modified HS-SPME is a rapid and useful method to analyze VOCs emitted from live water lily flowers. There have only been a few studies on volatile components from water lily. In addition, our study is the first to analyze the volatile compounds from a live water lily flower. The main VOCs in this study, including benzyl acetate, pentadecane, 6,9-heptadecadiene, and 8-heptadecene, were also found in other studies. Yin et al. also identified pentadecane, 6,9-heptadecadiene, and 8-heptadecene from tea infusions of water lily flowers (Nymphaeaceae, 21 tropical water lily cultivars and 12 hardy water lily cultivars) [29]. Yu et al. found that benzyl acetate is one of the most abundant VOCs emitted by living flowers of Jasminum sambac (L.), at around 10.56–14.30 mg/kg FW (fresh weight) in opening to fully opened flowers [30]. Therefore, the four main VOCs we analyzed in a live water lily flower were also observed in other Nymphaeaceae and Jasminum plants, suggesting that these volatiles may be the key to flower scent and the maturation process.
The recycled PET plastic bottle may have absorbed some of the VOCs and also may have released its own components. However, a previous study established that ethanol, limonene, 2-methyl-1,3-dioxolane, acetone, octanal, and nonanal can be detected from a recycled PET bottle using GC-MS. Most of them originated from foods packed in bottles, and only 2-methyl-1,3-dioxolane was derived from polymer impurities [31]. Another paper also reported that PET materials mainly release some phthalic acid esters (PAEs) and plastic additives by hydrophilic solutions [32]. In addition, as the results show in Table 3, we also did not find PAEs or other plastic additives by GC-MS analysis. Therefore, we can assume that the PET plastic material can be used as a collector for analysis of biogenic volatiles.

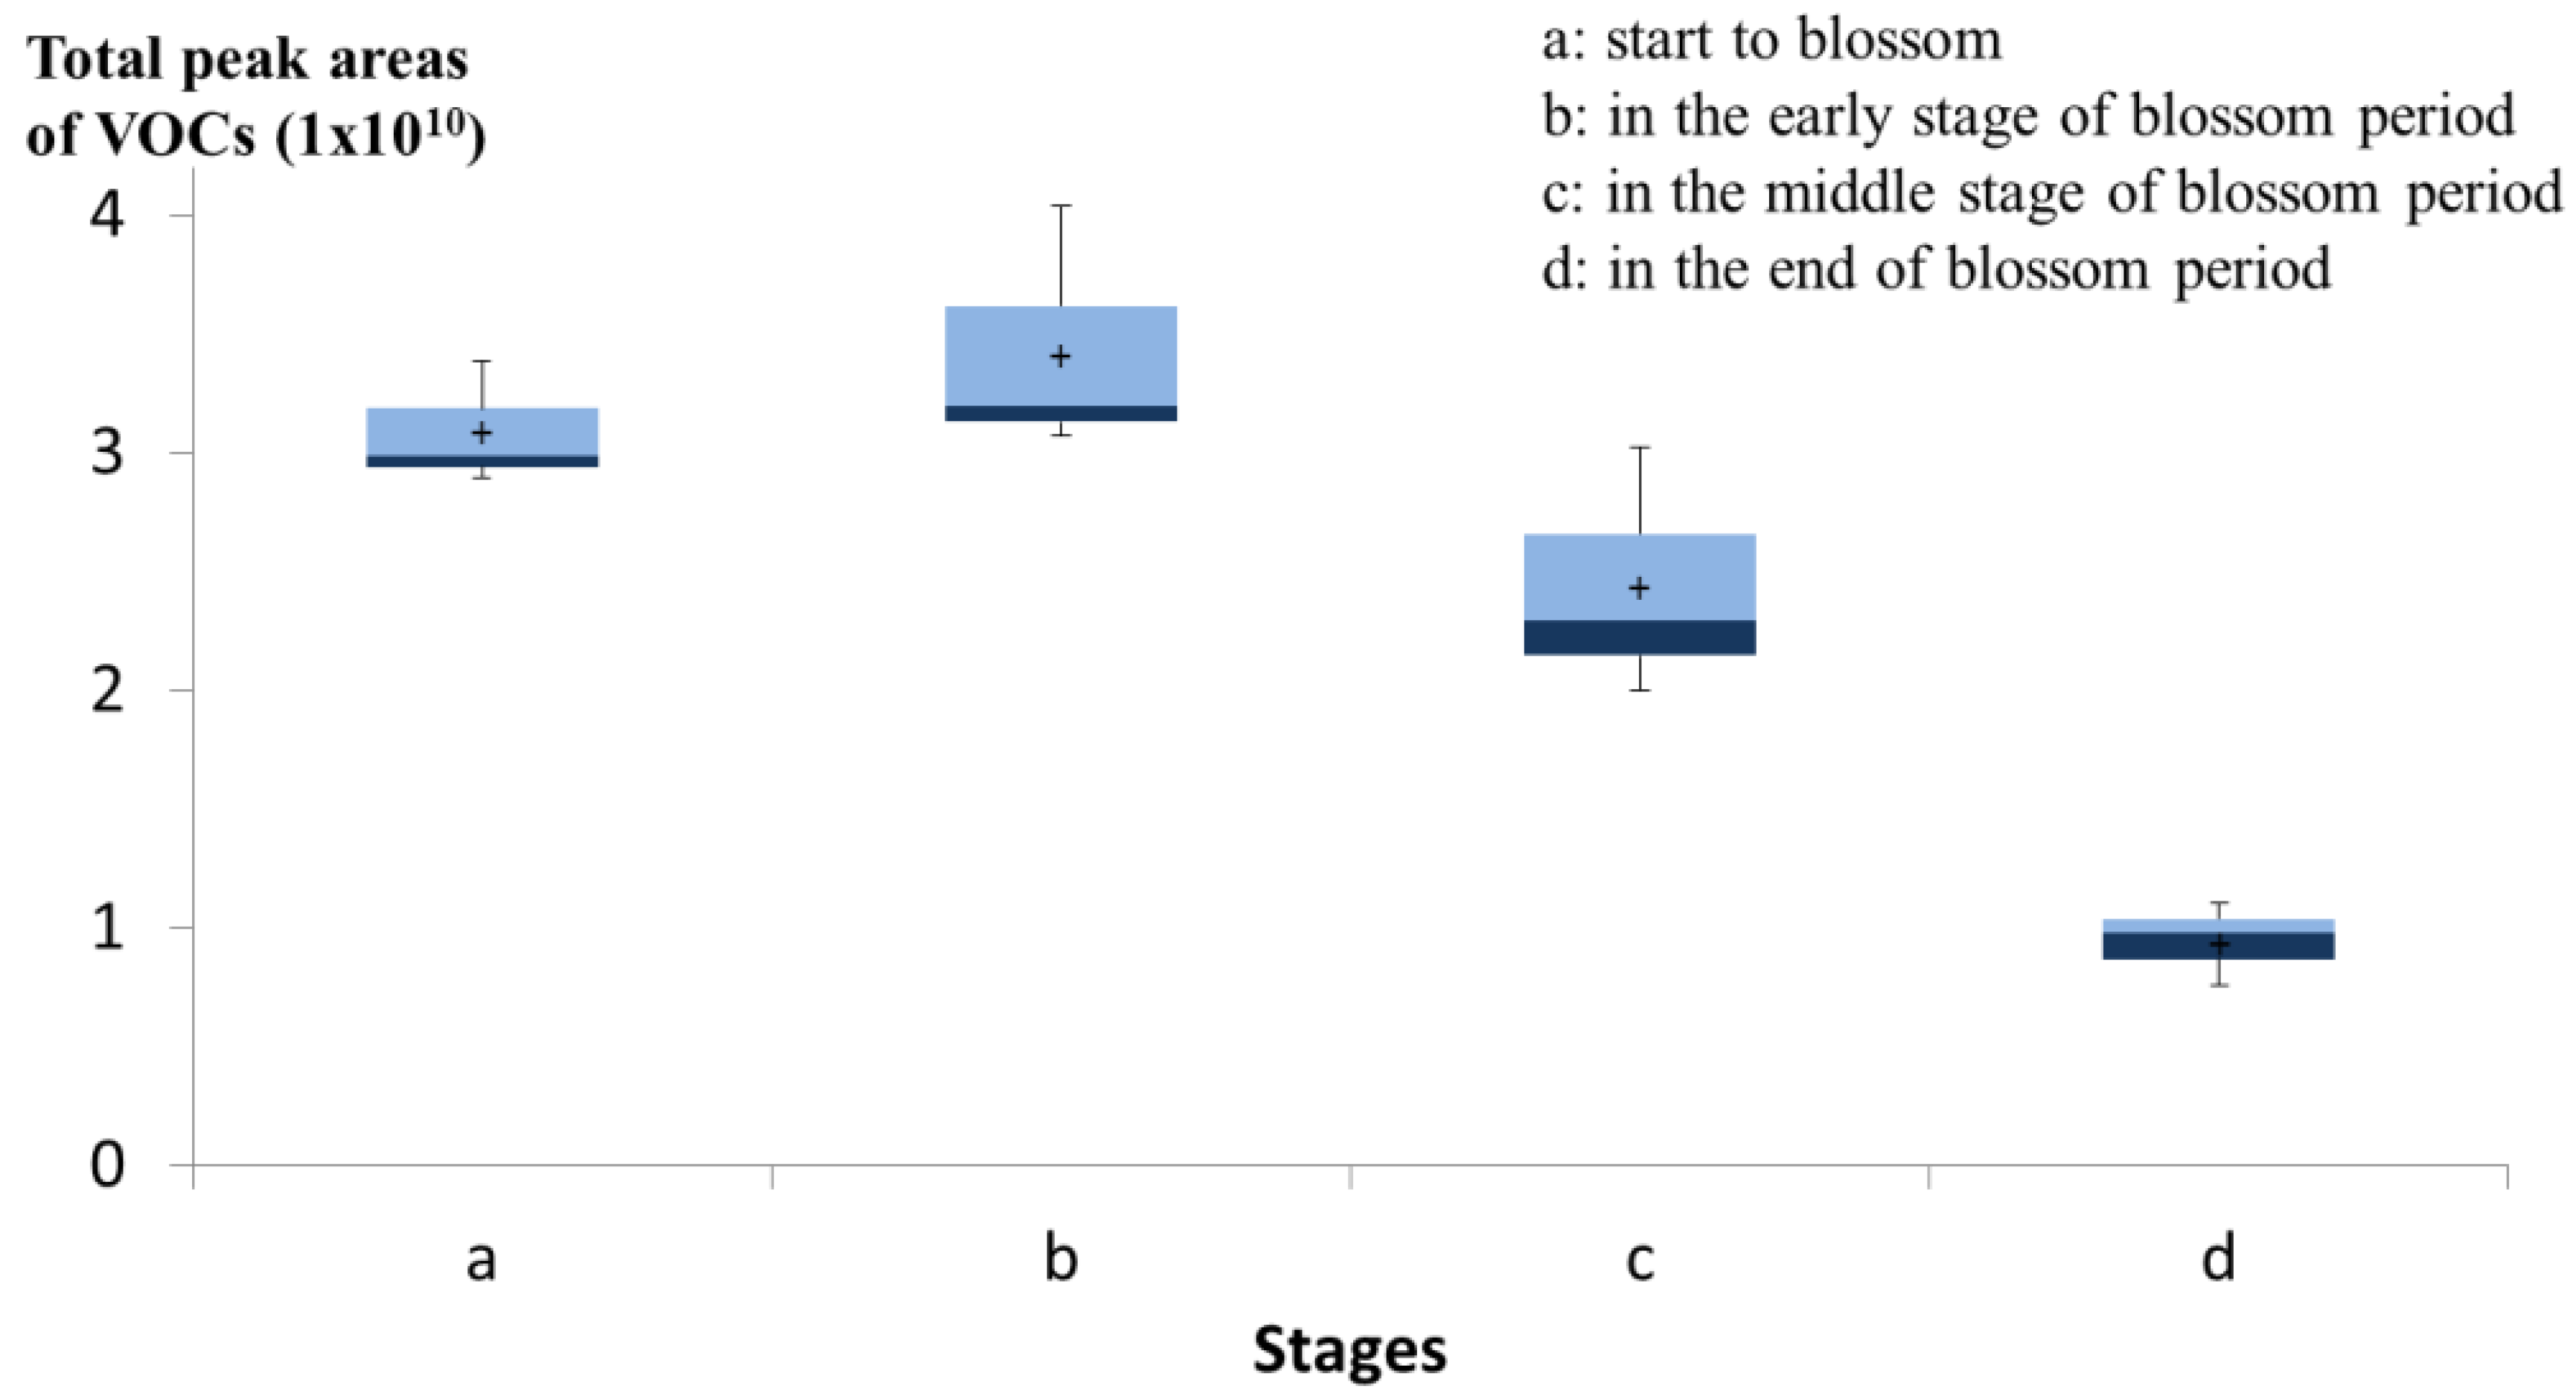
3.4. Main Volatiles from N. Caerulea Flower

According to the results obtained from the modified HS-SPME/GC-MS analysis, the flowering period was divided to four stages: a—in half bloom; b—at the early stage of full bloom; c—at the later stage of full bloom; d—at the approach of closing (the experiment was replicated three times). Figure 3 shows the total peak areas of the VOCs under different blossom periods. The number of VOCs varied at different stages, while the total area from the GC-MS analysis at stage a was lower than that at stage b, and the total area decreased after stage c. The concentrations of volatiles at the final stage were the lowest. In general, the final-stage volatile compounds were too diluted to be smelled by humans. This observation is consistent with the human sense of smell.
The volatile compounds from flowers are rather complex, and they are affected by different blossom periods. From the HS-SPME/GC-MS analysis, the desorption of volatiles allowed us to identify the compounds emitted by this plant. At stage b, the main components of the HS-SPME samples (concentration > 3.0%) were 6,9-heptadecadiene (40.1%), pentadecane (15.5%), 8-heptadecene (15.3%), benzyl acetate (10.4%), and benzyl alcohol (4.4%). From Figure 4, we can see that benzyl acetate, pentadecane, 6,9-heptadecadiene, and 8-heptadecene were four common major compounds under different flowering periods, while the concentration of 6,9-heptadecadiene, 8-heptadecene, and benzyl alcohol reached their highest levels at the early stage of full bloom (stage b).

4. Conclusions

Using our design combined with statistical analysis, the effect of all of the tested parameters could be established using this device. The results from the optimal conditions presented here demonstrate that the application of SPME for the qualitative analysis of VOCs emitted by living plants was successful. The variations in concentrations of several volatile compounds could be detected by using a simple PET chamber and a short sampling time. From sampling by extraction with SPME fibers coated with PDMS/DVB at the early stage of full bloom, 33 compounds could be identified. The main components were benzyl acetate (10.4%), pentadecane (15.5%), 6,9-heptadecadiene (40.1%), and 8-heptadecene (15.3%).

Author Contributions

F.-J.T. and M.-Y.L. conceived and designed the experiments; H.-J.L. and F.-J.T. performed the experiments; F.-J.T., M.-Y.L., and C.-C.L. analyzed the data; F.-J.T., H.-J.L., and C.-C.L. wrote the paper.

Funding

This research was funded by the Ministry of Science and Technology, Taiwan. (MOST 107-2635-E-126-001; MOST 105-2628-B-126-002-MY3).

Acknowledgments

The authors thank Maw-Rong Lee (National Chung Hsing University, Taiwan) for supporting the project.

Conflicts of Interest

The authors declare no conflict of interest.

References

  1. Elshafie, H.S.; Camele, I. An overview of the biological effects of some mediterranean essential oils on human health. Biomed. Res. Int. 2017, 2017, 9268468. [Google Scholar] [CrossRef] [PubMed]
  2. Figueredo, G.; Nver, A.; Chalchat, J.C.; Arslan, D.; Zcan, M.M. A research on the composition of essential oil isolated from some aromatic plants by microwave and hydrodistillation. J. Food Biochem. 2011, 36, 334–343. [Google Scholar] [CrossRef]
  3. Ghelardini, C.; Galeotti, N.; Salvatore, G.; Mazzanti, G. Local anaesthetic activity of the essential oil of lavandula angustifolia. Planta Med. 1999, 65, 700–703. [Google Scholar] [CrossRef] [PubMed]
  4. Sowndhararajan, K.; Deepa, P.; Kim, M.; Park, S.J.; Kim, S. A review of the composition of the essential oils and biological activities of angelica species. Sci. Pharm. 2017, 85, 33. [Google Scholar] [CrossRef]
  5. Chisvert, A.; Salvador, A. 6.1—Perfumes in cosmetics. Regulatory aspects and analytical methods for fragrance ingredients and other related chemicals in cosmetics. In Analysis of Cosmetic Products; Elsevier: Amsterdam, The Netherlands, 2007; pp. 243–256. [Google Scholar]
  6. Agnihotri, V.K.; Elsohly, H.N.; Khan, S.I.; Smillie, T.J.; Khan, I.A.; Walker, L.A. Antioxidant constituents of nymphaea caerulea flowers. Phytochemistry 2008, 69, 2061–2066. [Google Scholar] [CrossRef]
  7. Dehaut, A.; Himber, C.; Mulak, V.; Grard, T.; Krzewinski, F.; Le Fur, B.; Duflos, G. Evolution of volatile compounds and biogenic amines throughout the shelf life of marinated and salted anchovies (Engraulis encrasicolus). J. Agric. Food Chem. 2014, 62, 8014–8022. [Google Scholar] [CrossRef] [PubMed]
  8. Ozel, M.Z.; Kaymaz, H. Superheated water extraction, steam distillation and soxhlet extraction of essential oils of origanum onites. Anal. Bioanal. Chem. 2004, 379, 1127–1133. [Google Scholar] [CrossRef]
  9. Cai, J.; Liu, B.; Su, Q. Comparison of simultaneous distillation extraction and solid-phase microextraction for the determination of volatile flavor components. J. Chromatogr. A 2001, 930, 1–7. [Google Scholar] [CrossRef]
  10. Zhang, H.; Li, Y.; Mi, J.; Zhang, M.; Wang, Y.; Jiang, Z.; Hu, P. Gc-ms profiling of volatile components in different fermentation products of cordyceps sinensis mycelia. Molecules 2017, 22, 1800. [Google Scholar] [CrossRef]
  11. Durling, N.E.; Catchpole, O.J.; Grey, J.B.; Webby, R.F.; Mitchell, K.A.; Foo, L.Y.; Perry, N.B. Extraction of phenolics and essential oil from dried sage (Salvia officinalis) using ethanol–water mixtures. Food Chem. 2007, 101, 1417–1424. [Google Scholar] [CrossRef]
  12. Augusto, F.; Leite e Lopes, A.; Zini, C.A. Sampling and sample preparation for analysis of aromas and fragrances. Trac Trends Anal. Chem. 2003, 22, 160–169. [Google Scholar] [CrossRef]
  13. Semenov, S.N.; Koziel, J.A.; Pawliszyn, J. Kinetics of solid-phase extraction and solid-phase microextraction in thin adsorbent layer with saturation sorption isotherm. J. Chromatogr. A 2000, 873, 39–51. [Google Scholar] [CrossRef]
  14. Rubiolo, P.; Belliardo, F.; Cordero, C.; Liberto, E.; Sgorbini, B.; Bicchi, C. Headspace-solid-phase microextraction fast GC in combination with principal component analysis as a tool to classify different chemotypes of chamomile flower-heads (Matricaria recutita L.). Phytochem. Anal. PCA 2006, 17, 217–225. [Google Scholar] [CrossRef]
  15. Ciucanu, I. Per-o-methylation reaction for structural analysis of carbohydrates by mass spectrometry. Anal. Chim. Acta 2006, 576, 147–155. [Google Scholar] [CrossRef] [PubMed]
  16. Augusto, F.; Luiz Pires Valente, A. Applications of solid-phase microextraction to chemical analysis of live biological samples. TrAC Trends Anal. Chem. 2002, 21, 428–438. [Google Scholar] [CrossRef]
  17. Zhu, X.; Li, Q.; Li, J.; Luo, J.; Chen, W.; Li, X. Comparative study of volatile compounds in the fruit of two banana cultivars at different ripening stages. Molecules 2018, 23, 2456. [Google Scholar] [CrossRef] [PubMed]
  18. Vercammen, J.; Pham-Tuan, H.; Sandra, P. Automated dynamic sampling system for the on-line monitoring of biogenic emissions from living organisms. J. Chromatogr. A 2001, 930, 39–51. [Google Scholar] [CrossRef]
  19. Mookherjee, B.D.; Trenkle, R.W.; Wilson, R.A. The chemistry of flowers, fruits and spices: Live vs. Dead—A new dimension in fragrance research. Pure Appl. Chem. 1990, 62, 1357. [Google Scholar] [CrossRef]
  20. Tahmasebi, E.; Yamini, Y.; Saleh, A. Extraction of trace amounts of pioglitazone as an anti-diabetic drug with hollow fiber liquid phase microextraction and determination by high-performance liquid chromatography-ultraviolet detection in biological fluids. J. Chromatogr. B Anal. Technol. Biomed. Life Sci. 2009, 877, 1923–1929. [Google Scholar] [CrossRef] [PubMed]
  21. Sobhi, H.R.; Yamini, Y.; Esrafili, A.; Abadi, R.H. Suitable conditions for liquid-phase microextraction using solidification of a floating drop for extraction of fat-soluble vitamins established using an orthogonal array experimental design. J. Chromatogr. A 2008, 1196–1197, 28–32. [Google Scholar] [CrossRef] [PubMed]
  22. Pinheiro, A.d.S.; da Rocha, G.O.; de Andrade, J.B. A SDME/GC–MS methodology for determination of organophosphate and pyrethroid pesticides in water. Microchem. J. 2011, 99, 303–308. [Google Scholar] [CrossRef]
  23. Canosa, P.; Rodriguez, I.; Rubi, E.; Cela, R. Optimization of solid-phase microextraction conditions for the determination of triclosan and possible related compounds in water samples. J. Chromatogr. A 2005, 1072, 107–115. [Google Scholar] [CrossRef] [PubMed]
  24. Vandendool, H.; Kratz, P.D. A generalization of the retention index system including linear temperature programmed gas-liquid partition chromatography. J. Chromatogr. A 1963, 11, 463–471. [Google Scholar] [CrossRef]
  25. Strehmel, N.; Hummel, J.; Erban, A.; Strassburg, K.; Kopka, J. Retention index thresholds for compound matching in gc-ms metabolite profiling. J. Chromatogr. B Anal. Technol. Biomed. Life Sci. 2008, 871, 182–190. [Google Scholar] [CrossRef] [PubMed]
  26. Flamini, G.; Cioni, P.L.; Maccioni, S.; Baldini, R. Essential oil composition and in vivo volatiles emission by different parts of coleostephus myconis capitula. Nat. Prod. Commun. 2010, 5, 1321–1324. [Google Scholar] [CrossRef] [PubMed]
  27. Custodio, L.; Serra, H.; Nogueira, J.M.; Goncalves, S.; Romano, A. Analysis of the volatiles emitted by whole flowers and isolated flower organs of the carob tree using HS-SPME-GC/MS. J. Chem. Ecol. 2006, 32, 929–942. [Google Scholar] [CrossRef] [PubMed]
  28. Steffen, A.; Pawliszyn, J. Analysis of flavor volatiles using headspace solid-phase microextraction. J. Agric. Food Chem. 1996, 44, 2187–2193. [Google Scholar] [CrossRef]
  29. Yin, D.D.; Yuan, R.Y.; Wu, Q.; Li, S.S.; Shao, S.; Xu, Y.J.; Hao, X.H.; Wang, L.S. Assessment of flavonoids and volatile compounds in tea infusions of water lily flowers and their antioxidant activities. Food Chem. 2015, 187, 20–28. [Google Scholar] [CrossRef] [PubMed]
  30. Yu, Y.; Lyu, S.; Chen, D.; Lin, Y.; Chen, J.; Chen, G.; Ye, N. Volatiles emitted at different flowering stages of jasminum sambac and expression of genes related to alpha-farnesene biosynthesis. Molecules 2017, 22, 546. [Google Scholar] [CrossRef] [PubMed]
  31. Ohkado, Y.; Kawamura, Y.; Mutsuga, M.; Tamura, H.O.; Tanamoto, K. Analysis of residual volatiles in recycled polyethylene terephthalate. Shokuhin Eiseigaku Zasshi J. Food Hyg. Soc. Jpn. 2005, 46, 13–20. [Google Scholar] [CrossRef]
  32. Gorji, S.; Biparva, P.; Bahram, M.; Nematzadeh, G. Development of magnetic solid phase microextraction method for determination of the endocrine disrupting chemicals leached from reused plastic bottles. Talanta 2019, 194, 859–869. [Google Scholar] [CrossRef] [PubMed]
Figure 1. Extraction device for the determination of volatile components emitted by live water lily.
Applsci 09 01269 g001
Figure 2. Chromatograms of volatile compounds from live water lily extracted by using two fibers. Upper part is the PDMS result, and the lower part is the PDMS/DVB result.
Applsci 09 01269 g002
Figure 3. Total peak areas of the VOCs under different blossom periods. The box lines from upper to lower are the values of 25th, 50th, and 75th percentiles. The upward and downward bars represent the maximums and minimums. The cross symbol in the box indicates average value.
Applsci 09 01269 g003
Figure 4. Levels of four major compounds under different blossom periods.
Applsci 09 01269 g004
Table 1. The parameters of the first part and levels of the orthogonal array design (OAD) method.
VariablesLevel
Low (−1)High (1)
The angle of fiber to fan (A)VerticalParallel
The airstream (B)Positive pressureNegative pressure
The distance of fan from flower (C)LowHigh
RunABA*BCA*CB*C-- Y ¯ I   ( n   =   3 )
1−1−1−1−1−1−1−1814,672
2−1−1−11111472,099
3−111−1−1112,149,132
4−11111−1−11,016,438
51−11−11−11917,401
61−111−11−1663,680
711−1−111−12,386,180
811−11−1−111,931,771
K14,452,3412,867,8525,604,7226,267,3855,559,2554,680,2824,880,969
K25,899,0327,483,5214,746,6514,083,9884,792,1185,671,0915,470,403
Range1,446,6914,615,669858,0712,183,397767,137990,809589,433
K1: the sum of the experiments of the factor in low levels. K2: the sum of the experiments of the factor in high levels. Y ¯ I : the average of three repeated experiments.
Table 2. The parameters of the second part and levels of the OAD method.
VariablesLevel
Low (−1)High (1)
The location of fiber to fan (A)UpDown
The airstream (B)Positive pressureNegative pressure
The distance of fan from flower (C)LowHigh
RunABA*BCA*CB*C-- Y ¯ I   ( n   =   3 )
1−1−1−1−1−1−1−1899,329
2−1−1−11111723,738
3−111−1−1112,147,733
4−11111−1−11,816,269
51−11−11−113,103,363
61−111−11−12,416,830
711−1−111−11,411,773
811−11−1−111,585,760
K15,587,0707,143,2604,620,6007,562,1987,049,6527,404,7216,544,201
K28,517,7256,961,5359,484,1956,542,5977,055,1436,700,0747,560,593
Range2,930,655181,7254,863,5961,019,6005490704,6461,016,392
K1: the sum of the experiments of the factor in low levels. K2: the sum of the experiments of the factor in high levels. Y ¯ I : the average of three repeated experiments.
Table 3. Gas chromatography-mass spectrometry GC-MS analysis of the volatile organic compounds (VOCs) emitted by live water lily.
PeakRtCompoundFormulaRIArea (%)Area (%) (No Fan)
17.42BenzaldehydeC7H6O9700.051.14
29.132-ethyl-1-hexanolC8H18O10170.963.66
39.46benzyl alcoholC7H8O10254.426.70
413.991-UndeceneC11H2211360.240.48
514.65Benzyl acetateC9H10O2115210.4269.56
615.3m-Methylphenyl acetateC9H10O211680.030.34
716.64decanalC10H20O12000.170.68
820.74TridecaneC13H2813000.050.24
921.12UndecanalC11H22O13090.110.19
1024.82decanoic acid, ethyl esterC12H24O214000.120.20
1125.01TetradecaneC14H3014040.070.88
1225.75α-IononeC13H20O14220.160.12
1326.2trans-α-BergamoteneC15H2414330.260.22
1426.93trans-GeranylacetoneC13H22O14510.260.32
1527.11(E)-β-FarneseneC15H2414551.550.24
1628.08β-IononeC13H20O14790.24--
1728.271-PentadeceneC15H3014840.23--
1828.681,3,6,10-Dodecatetraene, 3,7,11-trimethyl-, (Z,E)-C15H2414940.09--
1928.791,3-Cyclohexadiene, 5-(1,5-dimethyl-4-hexenyl)-2-methyl-, [S-(R*,S*)]-C15H2414960.26--
2029.13PentadecaneC15H32150515.492.58
2129.22α-farneseneC15H2415070.47--
2229.92β-SesquiphellandreneC15H2415241.300.22
2332.4Propanoic acid, 2-methtyl-1-(1,1-dimethylethylethyl)-2-methyl-1,3-propanediyl esterC16H30O415840.110.20
2433.05hexadecaneC16H3416000.180.17
2535.596,9-heptadecadieneC14H28O166240.105.49
2635.719-Tetradecen-1-ol, (E)-C14H28O16650.83--
2735.898-heptadeceneC14H30O167015.271.80
2836.712-pentadecanoneC15H30O16900.51--
2936.78heptadecneC17H3616912.231.75
3037.64E,E-10,12-hexadecadienalC16H28O17120.77--
3137.77Z,Z-10,13-hexadecadienalC16H28O17150.63--
3243.722-heptadecanoneC17H34O18612.212.32
3350.09EicosaneC20H4220160.210.49

