Article

Theoretical and Experimental Investigation of Temperature and Phase Transformation during SAW Overlaying

1
Institute of Mechanical Technologies, Czestochowa University of Technology, al. Armii Krajowej 19 C, 42-201 Czestochowa, Poland
2
Institute of Computer and Information Sciences, Czestochowa University of Technology, ul. Dabrowskiego 73, 42-201 Czestochowa, Poland
*
Author to whom correspondence should be addressed.
Appl. Sci. 2019, 9(7), 1472; https://doi.org/10.3390/app9071472
Submission received: 14 March 2019 / Revised: 1 April 2019 / Accepted: 2 April 2019 / Published: 8 April 2019

Abstract

:
The article presents the modeling of temporary temperature and phase share calculations during SAW (submerged arc welding) overlaying of steel elements. The input heat of a melted electrode and the heat of direct electric arc impact have been taken into consideration in the temperature field solution. The characteristic areas (fusion, full and incomplete transformation), have been determined by solidus, A3 and A1 temperatures, respectively. The limit temperatures of the phase trandformations during cooling, based on the cooling rate in the temperature range 800–500 °C according to S355 steel time-temperature-transformation welding diagram, have been determined. The JMAK (Johnson–Mehl–Avrami–Kolmogorov) law and KM (Koistinen–Marburger) formula were used in the phase change kinetic description. Theoretical considerations were illustrated with examples of temperature and phase share computations for welding overlaid S355 steel plate. The analysis of the history of changes in temperature and structural components (phases) was carried out based on the results of numerical simulations as well as metallographic examination after SAW overlaying. The dimensions of the HAZ (heat-affected zone), obtained experimentally, and the structure types confirmed the results of the computation.

1. Introduction

The modeling of thermo-mechanical phenomena in welding processes is usually treated as an interdisciplinary problem. An analysis of these phenomena requires knowledge from thermodynamics, metallurgy, material science and continuum mechanics (solid and fluid) among others. The description of thermo-mechanical states requires the temperature field, which is variable in time and space, to be determined. Further analysis of strains and stresses requires consideration of material properties that change depending on the temperature as well as structural changes in the material caused by phase changes.
Analysis of thermo-mechanical phenomena requires deep knowledge and understanding of the welding processes, as well as easy use of the mathematical apparatus or numerical methods, especially for creating original programs. Thermo-mechanical states in welding processes are analyzed using analytical and numerical methods. The analytical solutions [1,2,3,4,5,6] allow us to estimate the searched values and to determine their dependence on various factors quicker, but for more complex problems these solutions are difficult or even impossible to apply. Some problems can be solved only with numerical methods, for instance, the finite element method, which is commonly used [7,8,9,10,11,12,13,14,15,16].
Thermal-mechanical phenomena occurring in joints during welding are not only the result of the temperature influence (heat source). The process and the quality of welding joints are significantly influenced by a number of factors, including properties and chemical composition of the welded material and electrodes [17], technological parameters [18,19] and welding conditions [20], as well as heat treatment after welding [21,22]. Among the various criteria for assessing the quality of welded joints, it is important to assess the tendency to crack [23] and the susceptibility to corrosion [24,25]. In the paper [17], the weldability, mechanical and plastic properties of S700MC steel, as well as the precipitation hardening characterized by a high yield, were obtained using the thermomechanical control process. The influence of high-speed cutting parameters on the surface roughness and cutting forces of machined AL/SiC composite has been investigated in [18]. Urbikain et al. [19] proposed a new method for the rapid and economical production of ‘nutless’ bolted joins, using a combination of two hole-making techniques, namely, form drilling and form tapping. Świerczyńska et al. [20] reported the effect of underwater wet welding parameters and conditions on the diffusible hydrogen content in deposited metal for welding with a self-shielded flux-cored wire. Wang et al. [21] conducted analysis of the tempering effect on the microstructure and properties of SAW (submerged arc welding) layers of H13 steel. Tempering causes the surfacing layer to undergo reversion and recrystallization, resulting in the formation of a finer microstructure and a reduction in the number of welding defects, with martensite and residual austenite transformed into fine-tempered martensite, and carbide precipitation occurring at higher temperatures. In the study [22], the effect of post-weld heat treatment and TiAlSiN coating on tensile, bending strength, hardness and corrosion of duplex stainless steel and super austenite stainless steel-joined materials in plasma arc welding has been shown. The evaluated fatigue cracks’ growth rates in welding metals with heat input higher than 10 kJ/mm made of the new submerged arc welding (SAW) technique, called the integrated cold electrode with the addition of non-energized (cold) wire, was analyzed in [23]. The main goal of [24] was the creation and evaluation a micro-arc oxidation coating in order to enhance the corrosion resistance of additively manufacture NiTi medical devices. Kim et al. [25] studied the effect of the Mo content on the mechanical and corrosion properties of hyper duplex stainless-steel welds that are subjected to flux-cored arc welding.
Rosenthal [26] and Rykalin [27] are pioneers in modeling the temperature field in welding processes. Rosenthal [26] was the first to propose the equation describing the temperature field induced by the point heat source for quasi-steady state. Next, Rykalin [27] presented a solution for a sectional heat source perpendicular to the welded elements. In description of a temperature field created by the movement source. Eagar and Tsai [28] used a surface two-dimensional Gaussian model of heat distribution. Goldak et al. [29] were the first to propose a double ellipsoidal three-dimensional model of heat source, later called the Goldak source. This model was used to calculate the temperature field in sheet weld using the FE (Finite Element) method. For an analytical solution of the temporary temperature distributions in fillet joint Jeong and Cho [30] used conformal techniques of mapping. In turn, Nguyen at al. [31], while continuing Goldak’s idea, applied in the solution for the massive body temperature field a half-elliptical double ellipsoidal volume model of heat source.
Despite many works describing the temperature field in welding processes, the continuous search for solutions for individual welding methods, hybrid techniques and related processes still continues. Gu et al. [32] proposed an isoparametric transformation and computer graphics technique to optimize the parameters of the double-ellipsoidal heat source model. For thermal analysis of the plasma arc welding process using the FE method, Wu and Gao [33] proposed a combined model of the heat source for mapping the temperature distribution in the keyhole. Jia et al. [34] developed a new method for the accurate determination of welding heat source parameters in connection with weld pool geometry. Multiple regression analysis was used, as well as the partial least-squares regression. Mikami et al. [35] attempted to simulate temperature distributions during weaving welding. Two kinds of models of heat sources were adopted for the FE analysis: “weaving” fully simulating the movement of the electrode and a simplified “quasi-weaving”. The obtained results of numerical calculations showed the correctness of the “weaving” model, whereas the temperature distributions calculated using the simplified model were not satisfactory. In [36] a double-ellipsoidal-conical model of power source was introduced to map the temperature distribution in electron beam welding. The experimental verification of the method showed satisfactory results. Nasiri and Enzinger [37] proposed an analytical description of the temperature distribution in fillet welds using the adaptive functions. The methodology was based on a solution partial differential equation using non-dimensional quantities with respect to the Rosental solution combination. Cai Lv et al. [38] proposed a model for estimating the intensity of a mobile heat source using the inverse method. For this purpose, the non-linear heat transfer system has been replaced by a number of linearized solutions. This interesting approach will not find application in the thermal analysis of welding processes.
The descriptions of instantaneous temperature fields, most commonly use models of heat sources with one power density distribution. However, in practice the individual areas of the weld joint have irregular shapes and the adoption of such a heat source model is insufficient. The necessity to consider the heat of the additive material in the modeling of thermal phenomena in a welding process was noticed by Jeong and Cho [39] and Kang and Cho [40].
In their description of the temperature field during fillet FCA (flux-cored arc) welding, Jeong and Cho [39] adopted a bivariate distributed model of heat source, in which the influence of molten metal heat was taken into account. In turn, Kang and Cho [40], included the heat of filler wire during GTA (gas tungsten arc welding).
The application of a two-distributed heat source model, besides the mathematical justification allowing one to determine the complex shape of the fusion line, should also have a physical justification. In this article, the adoption of such a model is justified by heat transfer. The heat of the electric arc is used not only for heating the padded object, but also for melting the additional material. According to this assumption, a bimodal source is used to describe the temperature field during overlaying welding by the SAW method.
Verification of correctness of the heat source model and the temperature field model is possible (beside direct temperature measurement during welding), among other methods, by metallographic investigation of a weld pad. The metallographic analysis allows for comparison of calculated and experimental fusion line, and also to compare the shapes and dimensions of the heat affected zone. Analysis of the material structure in the heat-affected zones gives information on the correctness of the calculated heating and cooling rates. In turn, the orientation of the dendritic structure in the fusion zone indicates the directions of heat propagation in the material. This method of verification of the proposed models and the results achieved were adopted in the paper.

2. Experimental Padding Weld

The welding tests were carried out using a Faltig 315 AC/DC welding machine (OZAS, Opole, Poland), electrode wire ESAB OK Autrod 12.10 (ESAB Sp. z o.o., Katowice, Poland) [41] with diameter d = 3 mm and flux ESAB OK Flux 10.40 (ESAB Sp. z o.o., Katowice, Poland). In the central part of the S355J2G3 steel plate with dimensions 300 × 300 mm, a weld length of 0.1 m was overlaid (Figure 1). The thickness of the plate was 0.3 m, which in theoretical thermal considerations allowed one to adopt a semi-infinite model of a body.
The following welding parameters were used in the overlaying welding test: voltage U = 30 V and current intensity I = 400 A, with welding velocity v = 0.4 m/min and wire feed speed ve = 10.6 m/min. Table 1 presents the chemical component shares of the steel plate surfaced by welding used in the test.
The metallographic analysis was performed using a metallographic microscope equipped with the Moticam 2000 camera with the Moticam Image Plus software (Motic, Xiamen, China).

3. Analytical Description of Temporary Temperature Distribution

In the solution allowing for the calculation of the temperature field, a heat source based on a two-distribution model was adopted. From the total amount of heat of the electric arc, a part of the heat needed to melt the electrode was separated and transferred by molten material to the weld pool. The remaining heat part emitted by the electric arc was considered to be directly affecting the welded object:
θ x , y , z , τ θ i = θ a x , y , z , τ + θ w x , y , z , τ ,
where: θa(x,y,z,τ)—the rise of temperature caused by heat input of the electric arc; θw(x,y,z,τ)—the rise of temperature as a result of the heat transferred from the liquid electrode metal to the weld pool; θi—initial temperature of the overlaid object; and τ—the time of the process.
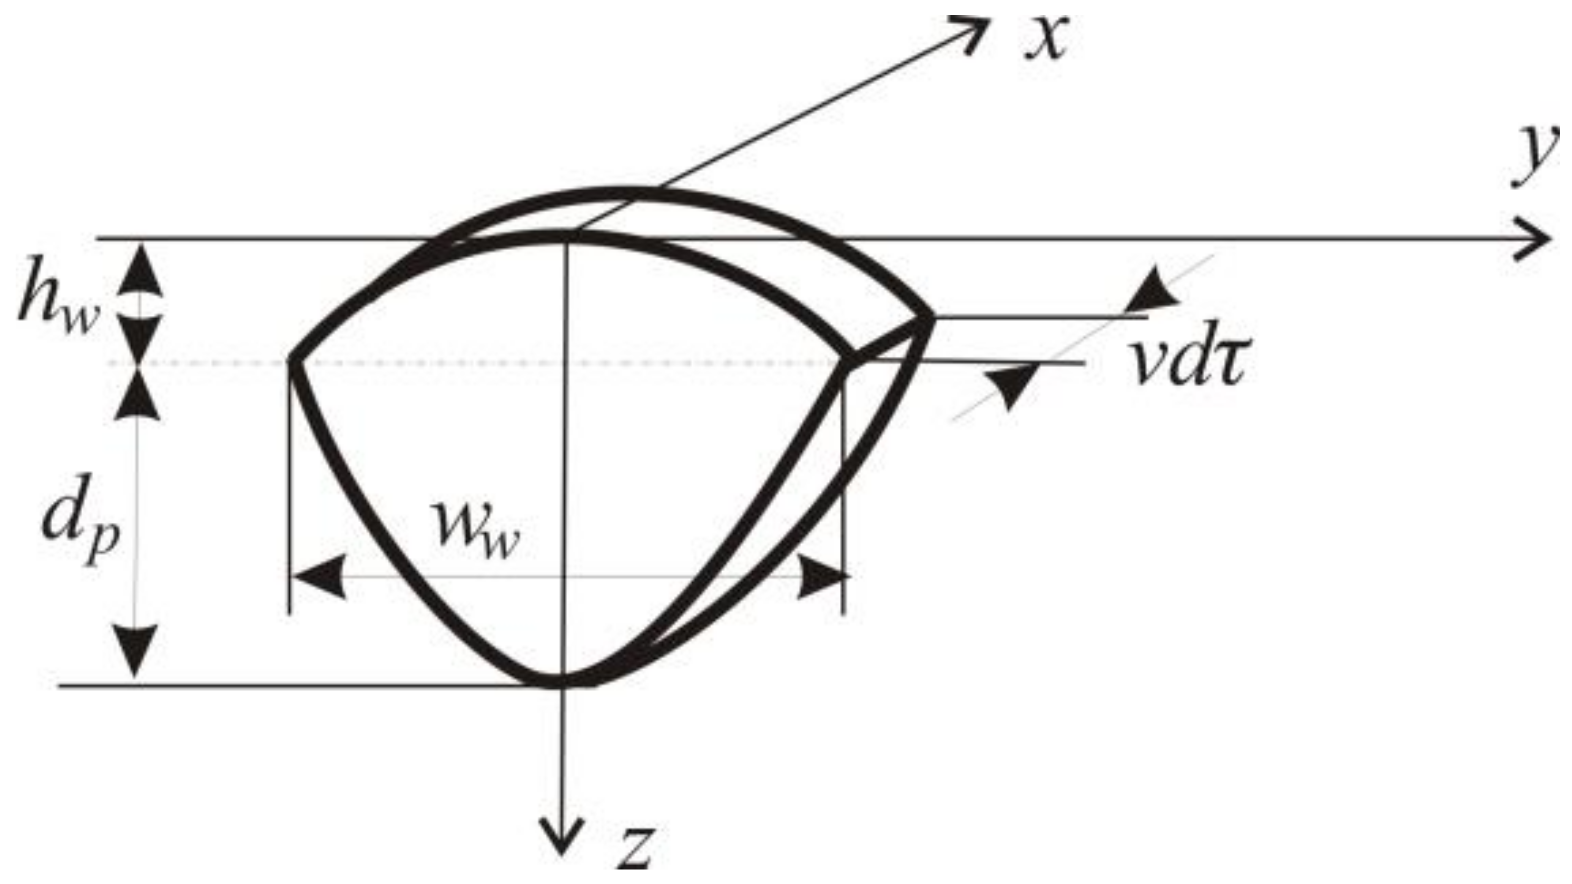
The scheme of the applied padding segment with its characteristic dimensions is shown in Figure 2. In the considered case of flat surface welding overlaying, dp is equal to 0. The volume of the deposited padding material is determined by the weld height (hw) and its width (ww), and vdτ results from the padding volume equal to the volume of molten electrode material determined by its diameter and wire feed speed. Equations describing the temporary temperature field, including the molten metal heat transferred from the electrode to the overlaid weld, are deduced in [42]. The heat source model with Gaussian power distribution is shown in Figure 3.
The solution of the differential heat conduction equation for the volume heat source determined by such a distribution is described in [43]. In this discussion, this model was adopted to represent the impact of the electric arc.
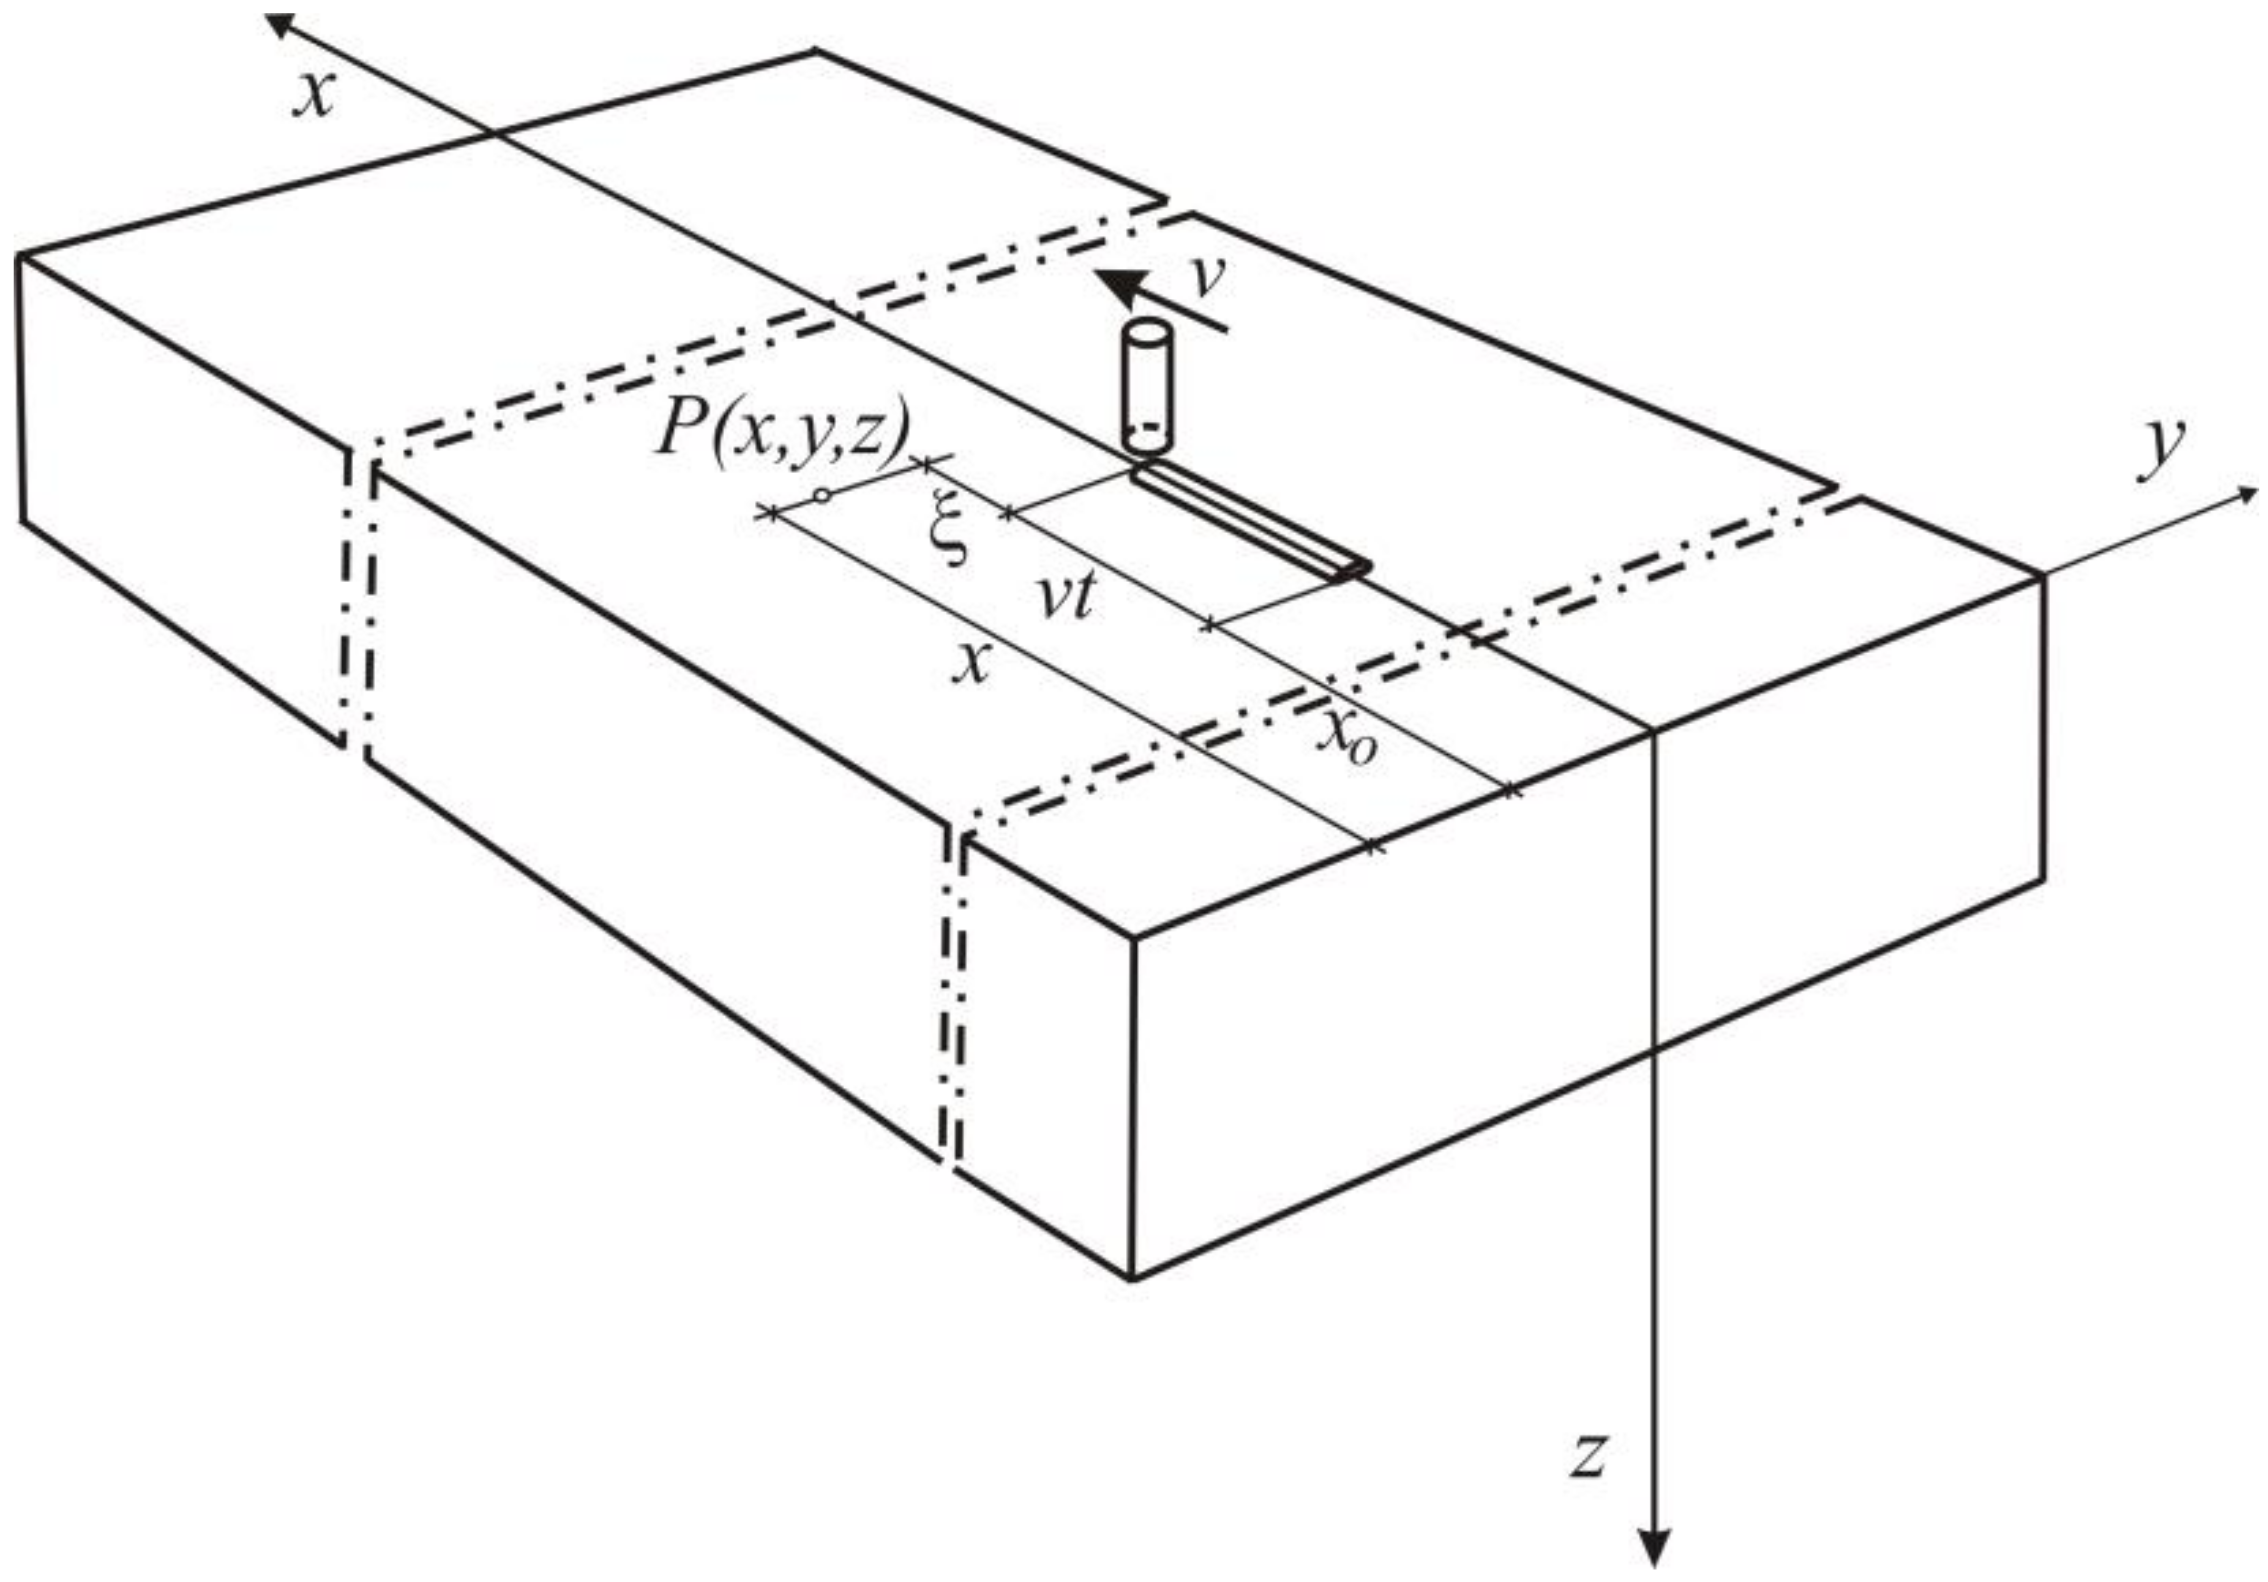
The temperature (1) during single-pass arc overlaying welding (Figure 4) in time τ ≤ τt, where τt is defined by:
τ t = l / v ,
is determined by the equation:
θ x , y , z , z 0 , τ θ 0 = = A w 0 τ H H τ Φ 1 y , z + Φ 2 y , z + Φ 3 y , z Φ 4 y , z d τ + A H 0 τ Φ H ( τ ) d τ
on the other hand, after the bead ends (for time τ > τt), the equation takes the form:
θ x , y , z , z 0 , τ θ 0 = = A w 0 τ t H C τ Γ 1 ( y , z ) + Γ 2 y , z + Γ 3 y , z Γ 4 ( y , z ) + A C 0 τ t Φ C ( τ ) d τ
where Aw, AC, Hh, Hc are defined by the following equations:
A w = q ˙ v / 8 C p ρ ( π a ) 1.5 ,
A H = 3 q ˙ 16 C p ρ π a 1.5 z 0 exp ξ v 2 a v 2 τ 0 4 a ,
A C = 3 q ˙ / 16 C p ρ π a z 0 ,
F H τ = 1 τ + τ 0 exp ξ 2 4 a τ + τ 0 v 2 τ 4 a 1 z 2 + 2 a τ z 0 2 e r f z + z 0 4 a τ Ω z e r f Ω z ( z ) z z 0 2 a τ 0 , 5 + 4 a τ z 0 2 z + z 0 4 π a τ 0 , 5 exp z z 0 2 4 a τ z z 0 4 π a τ 0 , 5 exp z + z 0 2 4 a τ
H H τ = 1 τ e r f v τ 2 ξ + v τ 4 a τ + e r f Δ l + 2 ξ + v τ 4 a τ ,
H C τ = 1 τ τ e r f v τ 2 x v τ x 0 4 a τ τ + e r f Δ l + 2 x v τ x 0 4 a τ τ ,
F C τ = 1 τ + τ 0 τ exp ( ( x v   τ x 0 ) 2 + ( y y 0 ) 2 4 a τ + τ 0 τ ) { ( 1 z 2 + 2 a ( τ τ ) z 0 2 ) ( e r f ( z + z 0 4 a ( τ τ ) ) Ω z e r f ( Ω ( z ) z z 0 ( τ τ ) ) ) + 4 a ( τ τ ) z 0 2 z + z 0 2 ( π a ( τ τ ) ) 0.5 exp z z 0 2 4 a ( τ τ ) z z 0 2 ( π a ( τ τ ) ) 0.5 exp z + z 0 2 4 a ( τ τ ) ) }
ξ = x v τ + τ 0 x ,
Ω ( z ) = 1 w h e n z ( z 0 , ) 1 w h e n z < 0 , z 0 > ,
x0 [m]—the coordinate of the bead beginning; l [m]—the bead length. The parameter τ0 [s] is related to the Gaussian heat distribution relation [44] (please compare Figure 3):
r B 2 = 4 a τ 0 ,
Functions Γ1Γ4 and Φ1Φ4 are integrals calculated by the Gauss–Legendre method [42].
Power of volumetric heat source accumulated in the molten electrode material is expressed by formula [45]:
q ˙ v = ρ e π d 2 4 v e   C p θ L θ e + L ,
where: d—the electrode diameter; ρe—the electrode material density; ve—wire feed speed; L—the heat of fusion/solidification [J/ kg]; θe—the initial temperature of electrode wire equals to the welding head electrode temperature; and θL—the temperature at which the molten metal drop separates from the electrode.

4. The Concept of the Phase Share Calculation

In quantification, volumetric share changes of individual phases in steel during thermal welding cycle are defined by the JMAK (Johnson–Mehl–Avrami–Kolmogorov) law [46,47] in description of diffusive transformations and KM (Koistinen–Marburger) principle is used in description of non-diffusive (martensitic) transformation kinetics [48]. If, during the temperature rise in the thermal cycle, its value exceeds the critical temperature A1, the transformation of the initial structure into austenite begins. The austenitic transformation ends at the temperature A3, if the temperature peak in the thermal cycle exceeds A3 (full transformation). Otherwise (θmax < A3) the transformation ends after reaching the maximum temperature (partial transformation). The volume fraction of austenite ϕγ created during heating depends on the current material temperature in relation to the temperature range determined by A3 and A1. The share of new austenitic structure is calculated according with the JMAK law [46] by equation:
ϕ γ θ = i ϕ j 0 1 exp b i θ τ n i θ ,
where ϕi0 denote initial volume shares of bainite (iB), ferrite (iF) and pearlite (iP). The values of bi and ni are specified depending on the values of critical temperatures A1 and A3:
n i = ln ln 0.99 / ln A 1 / A 3 ,
b i = 0.01 n i / A 1 ,
The volumetric share of an individual phase during cooling depends on the temperature and the cooling rate, and on the austenite share. In an incomplete transformation zone, initial austenite share ϕγ before cooling has a value 0 < ϕγ <1. The created volumetric share ϕi of a structural component can be estimated analogically to the JMAK formula [47] by the following equation:
ϕ i θ , τ = ϕ A ϕ i max 1 exp b i θ τ n i θ + ϕ i 0 ,
where ϕi0—volumetric share of i-th phase component, which remained after the heating stage of the thermal cycle (not undergone a transformation); and ϕimax—a maximum volume share of component i estimated for the calculated cooling rate. The sum of volumetric shares equals:
i = 1 k ϕ i = 1 ,
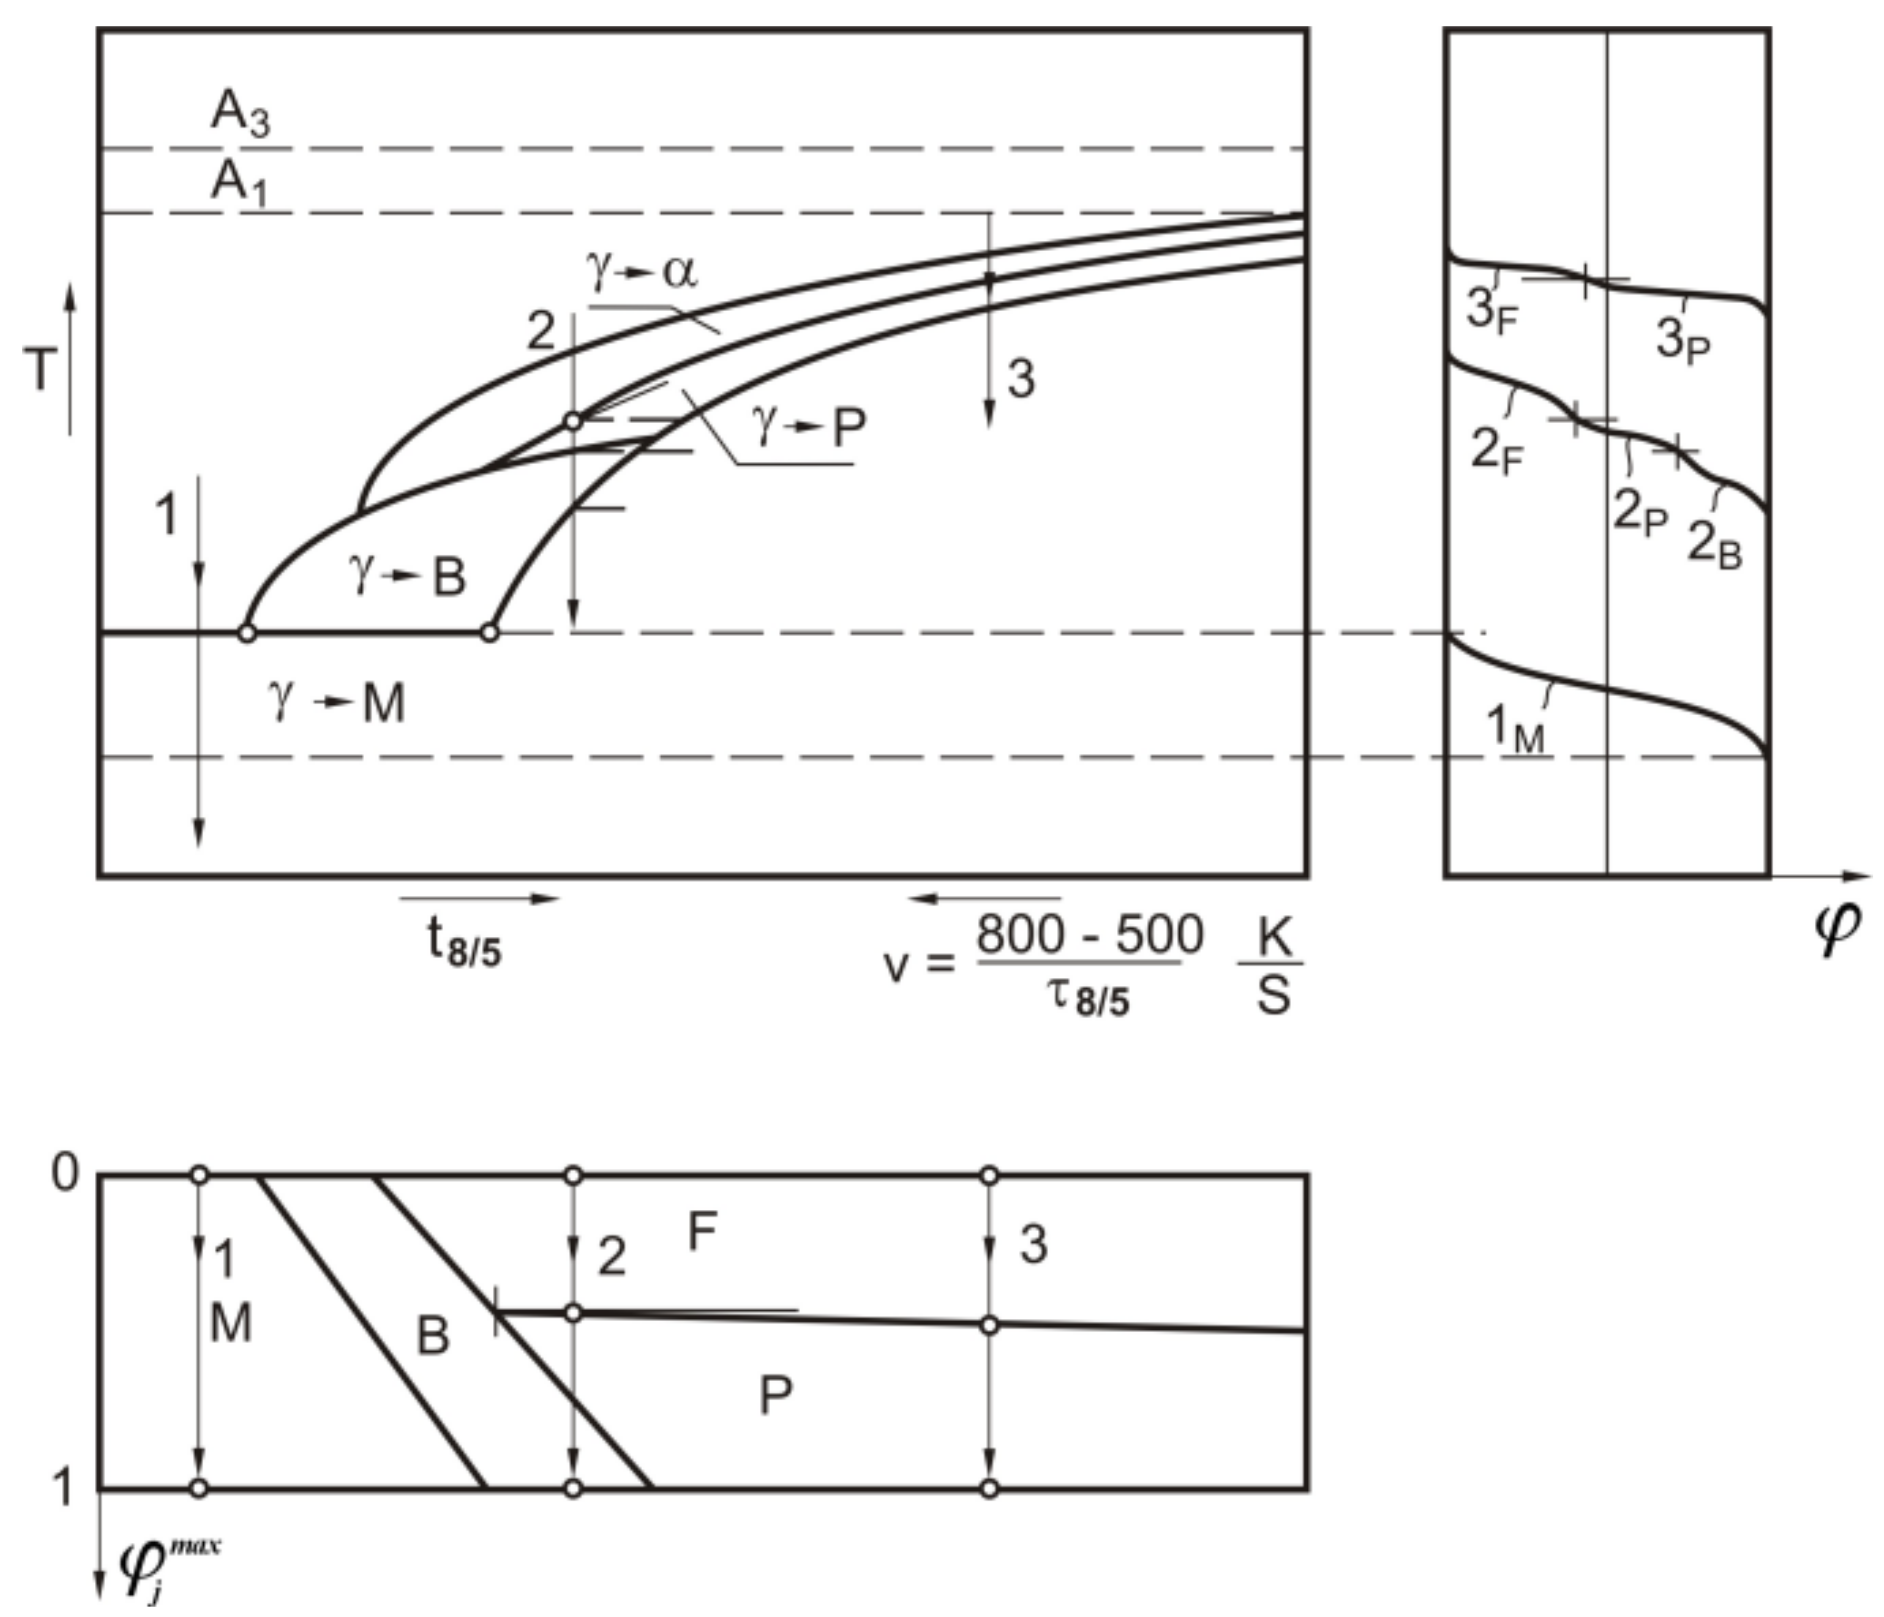
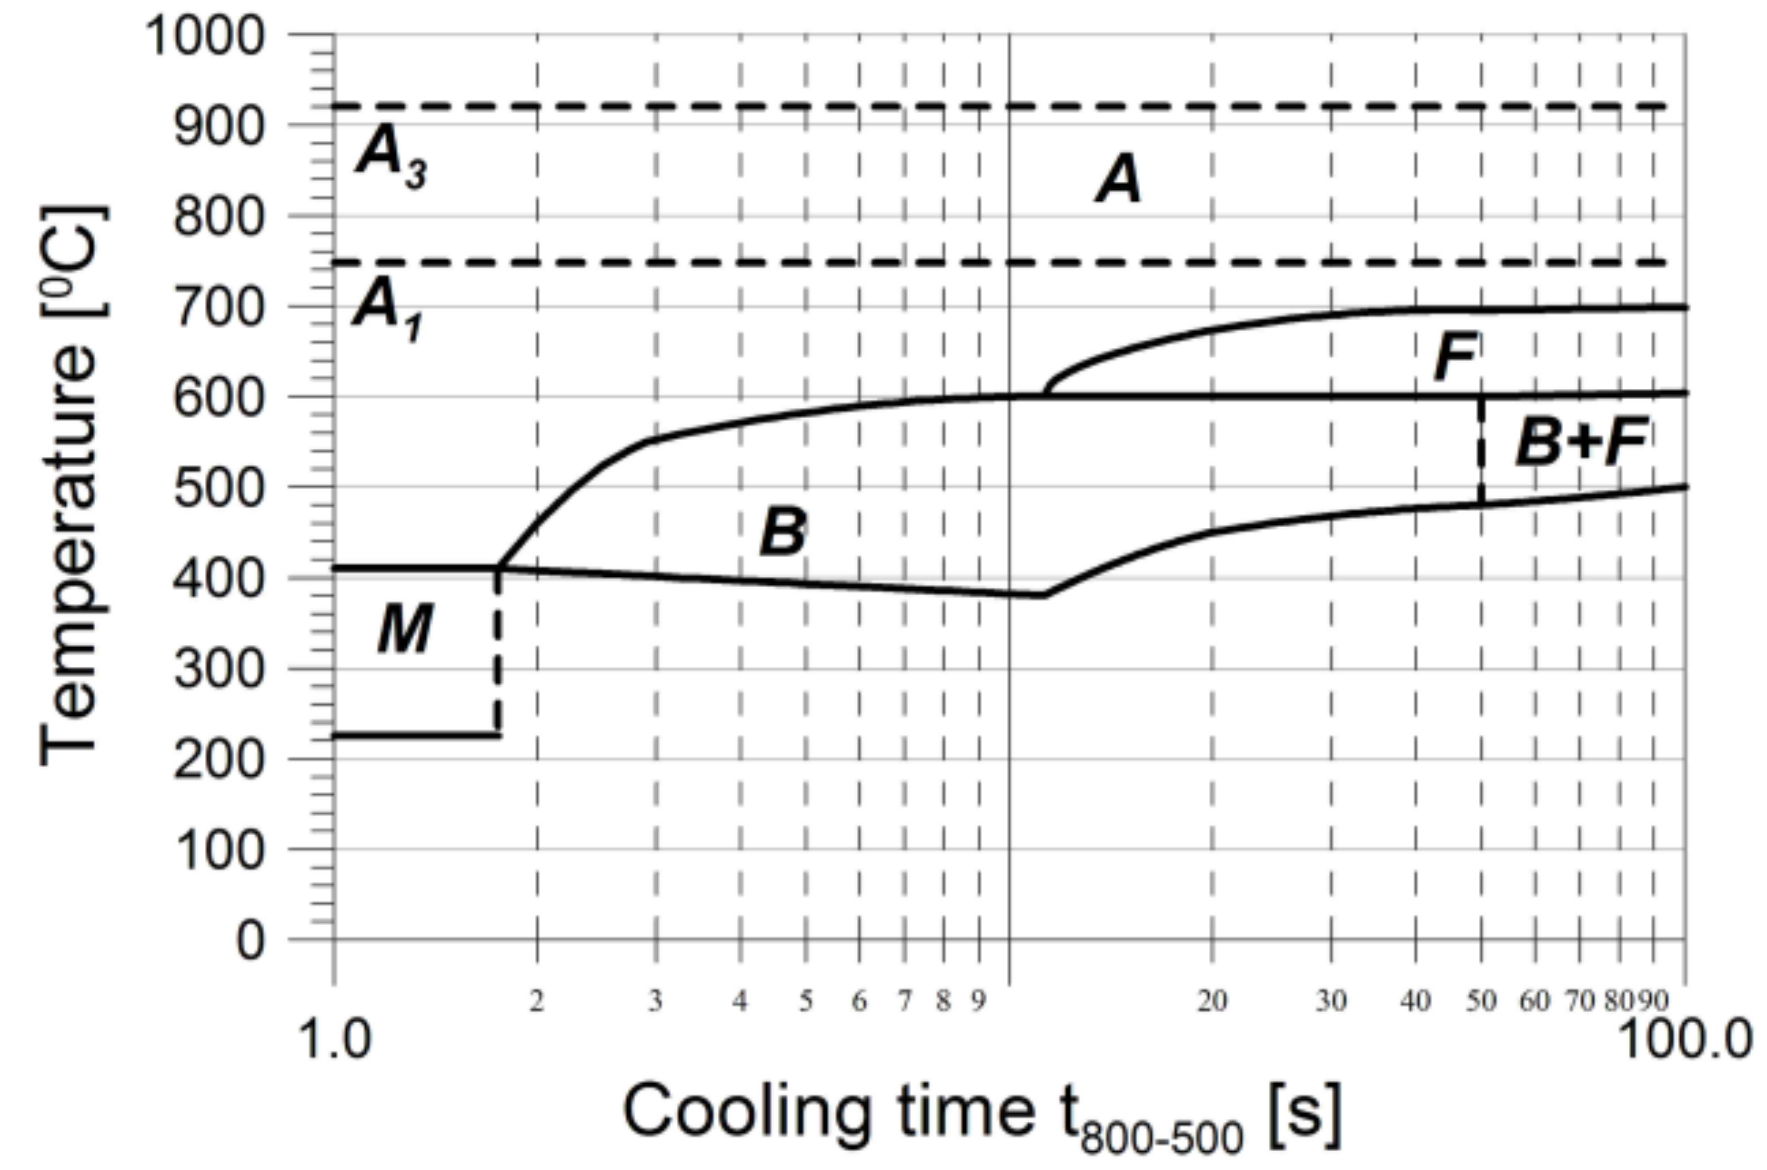
In order to estimate the volume shares of individual structural components arising from austenite during cooling, it is indispensable to know the value of the start temperature of the phase transformation Ts and its end Tf. The values of these temperatures depend on the type of steel and the cooling time t8/5, which denotes the residence time of the material between temperatures 800–500 °C. The use of cooling speed v8/5 is often more convenient to determine the temperature limits of transformation. The quantity v8/5 is defined as cooling rate of the material in the above temperature range, i.e., v8/5 = (800500)/(t8/5). Limiting temperatures of cooling changes are determined on the basis of TTT (time-temperature-transformation) welding diagrams (Figure 5) developed for particular steel grades. These graphs allow one to determine not only the beginning of the transformation, but also the progress of the process based on the temperature of the process, as well as the type of the structure being created. Limit values of cooling phase transitions (also t8/5 values) can be determined using analytical formulas dependent on the chemical composition of steel [48]. This is because from a practical point of view the use of dependence equation (19) can often be troublesome due to the necessity to determine the current transformation time, and in [49] the corrected equation was used, in which the time parameter was replaced by the current process temperature:
ϕ i θ , t = ϕ A ϕ i max 1 exp b i θ v 8 / 5 t θ n i θ v 8 / 5 ,
where:
n i = ln ln 1 ϕ i s / ln 1 ϕ i f / ln θ i s / θ i f ,
b i = n i 1 ϕ i f / θ i s ,
where: θis = θis(v8/5) and θif = θif(v8/5)—the beginning and the end temperatures of i-th component phase transformation, respectively.
In the case of high cooling rates, the transformation of austenite into a martensitic structure may occur between the θMs and θMf temperature limits. The kinetics of this transformation is described by the Koistinen–Marburger principle [50], according to which we can express volume martensitic share according to:
ϕ M θ = ϕ A ϕ M max 1 exp μ θ M s θ ,
μ = ln ϕ M min / θ M s θ M f ,
where: θMs—martensite start temperature; and θMf—martensite finish temperature ϕ M min = 0.1 .

5. Example of Computations

Numerical calculations of the temporary temperatures and phase share computations were conducted for single-pass SAW overlaying S355J2G3 steel plate. The dimensions of the board used in the padding test and the geometric parameters of the applied padding weld (bead dimensions hw = 2.6 mm and ww = 18 mm (dp = 0)) were used for the calculations. The same properties of the welded plate and electrode material were adopted in the calculations: a = 8·10-6 m2/s, Cp = 670 J/kg K, ρ = ρe = 7 800 kg/m3 and L = 268 kJ/kg.
The power of the heat source was determined by the welding parameters used in the experiment, i.e. U = 30 V and I = 400 A. When the efficiency η = 0.99 is taken into account, the assumed power equals 11 880 W. The Gaussian surface distribution was determined by τ0 = 0.13 s, and volumetric was determined by z0 = 0.008 m.
The initial electrode temperature was taken at Te = 100 °C [45]. Numerical simulations were performed for the cross-section of the plate in half the length of the pad.
The calculations were carried out using our own procedures written in the Borland Pascal structural language and made in the Delphi environment. In the area of the padding and the heat affected zone, the distance between the calculation points was 0.5 mm, while in the remaining area 1 mm. The time increment was 0.0002 s in integration functions during temperature calculations.
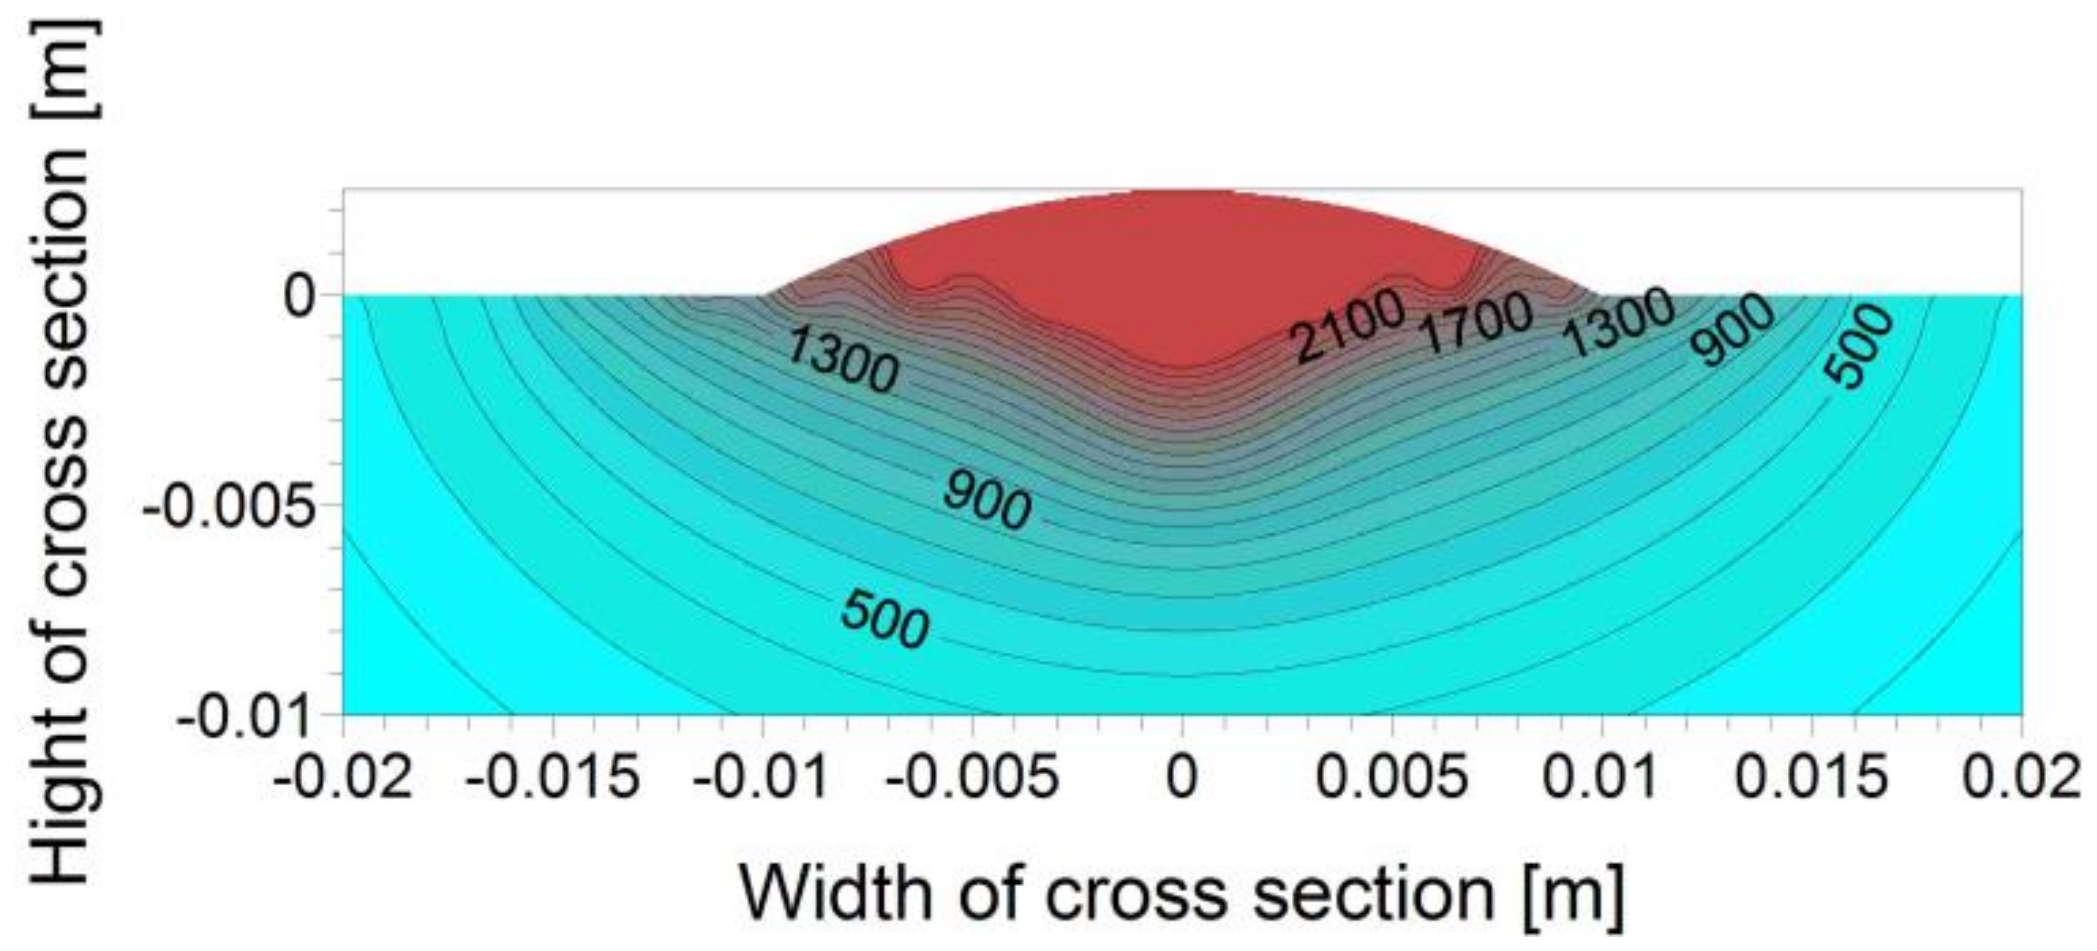
Maximum temperature peaks at individual cross-section points made it possible to determine the maximum temperature isotherms (Figure 6).
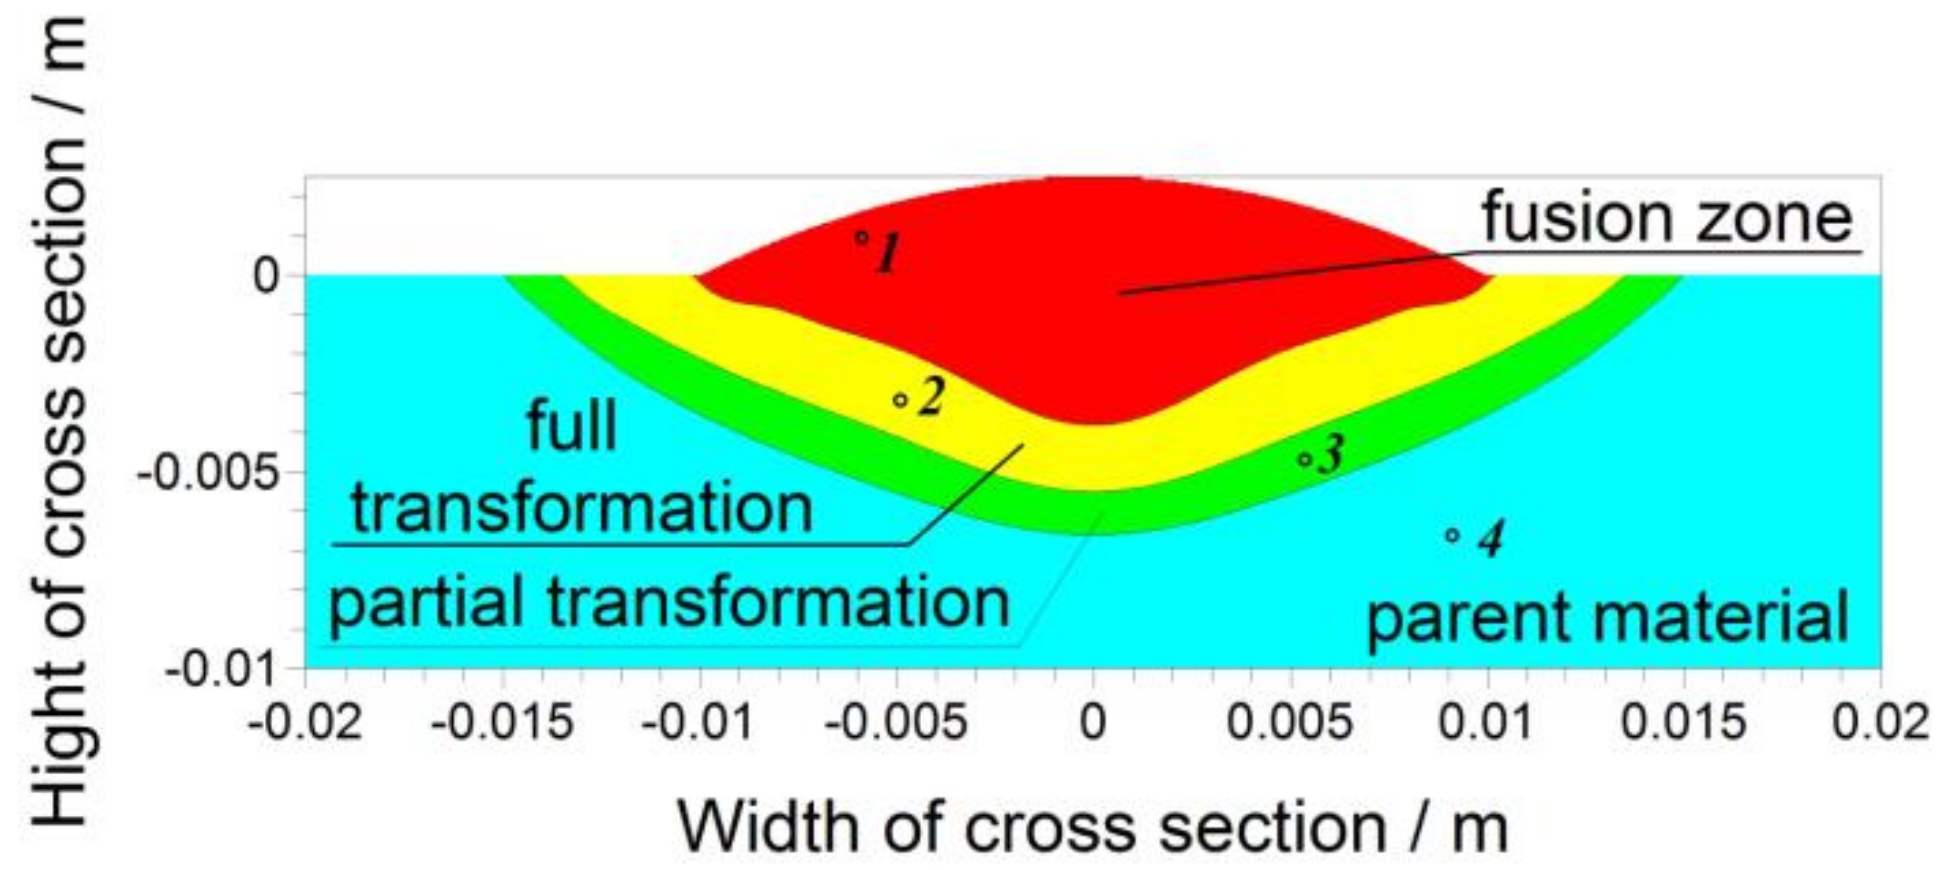
In turn, isotherms of critical temperatures of phase transformations allowed us to determine the boundaries of individual characteristic areas (Figure 7). The solidus value of 1493 °C was determined based on the iron-carbon system phase diagram. In the case of determining temperature limits of phase transformations in the solid state, the average heating speed was taken into account at points where the max peak temperature exceeded 720 °C (A1 temperature value in classical heat treatment processes). Considering the effect of this average heating speed at the start and at the end temperatures of the austenitic transformation [51,52] the temperature values A3 = 920 °C and A1 = 748 °C were determined.
The calculations of individual structural component shares during the phase transformation of heating were made in accordance with the Equations (16)–(18). The constants bi and ni were determined depending on the values A1 and A3. In the calculation algorithm of the phase transformation kinetics of cooling, the temperatures of the start and the end of phase transformations are determined using the TTT diagram of S355 steel (Figure 8) developed based on [53], while the volumetric shares of individual components are determined using Equations (19)–(23).
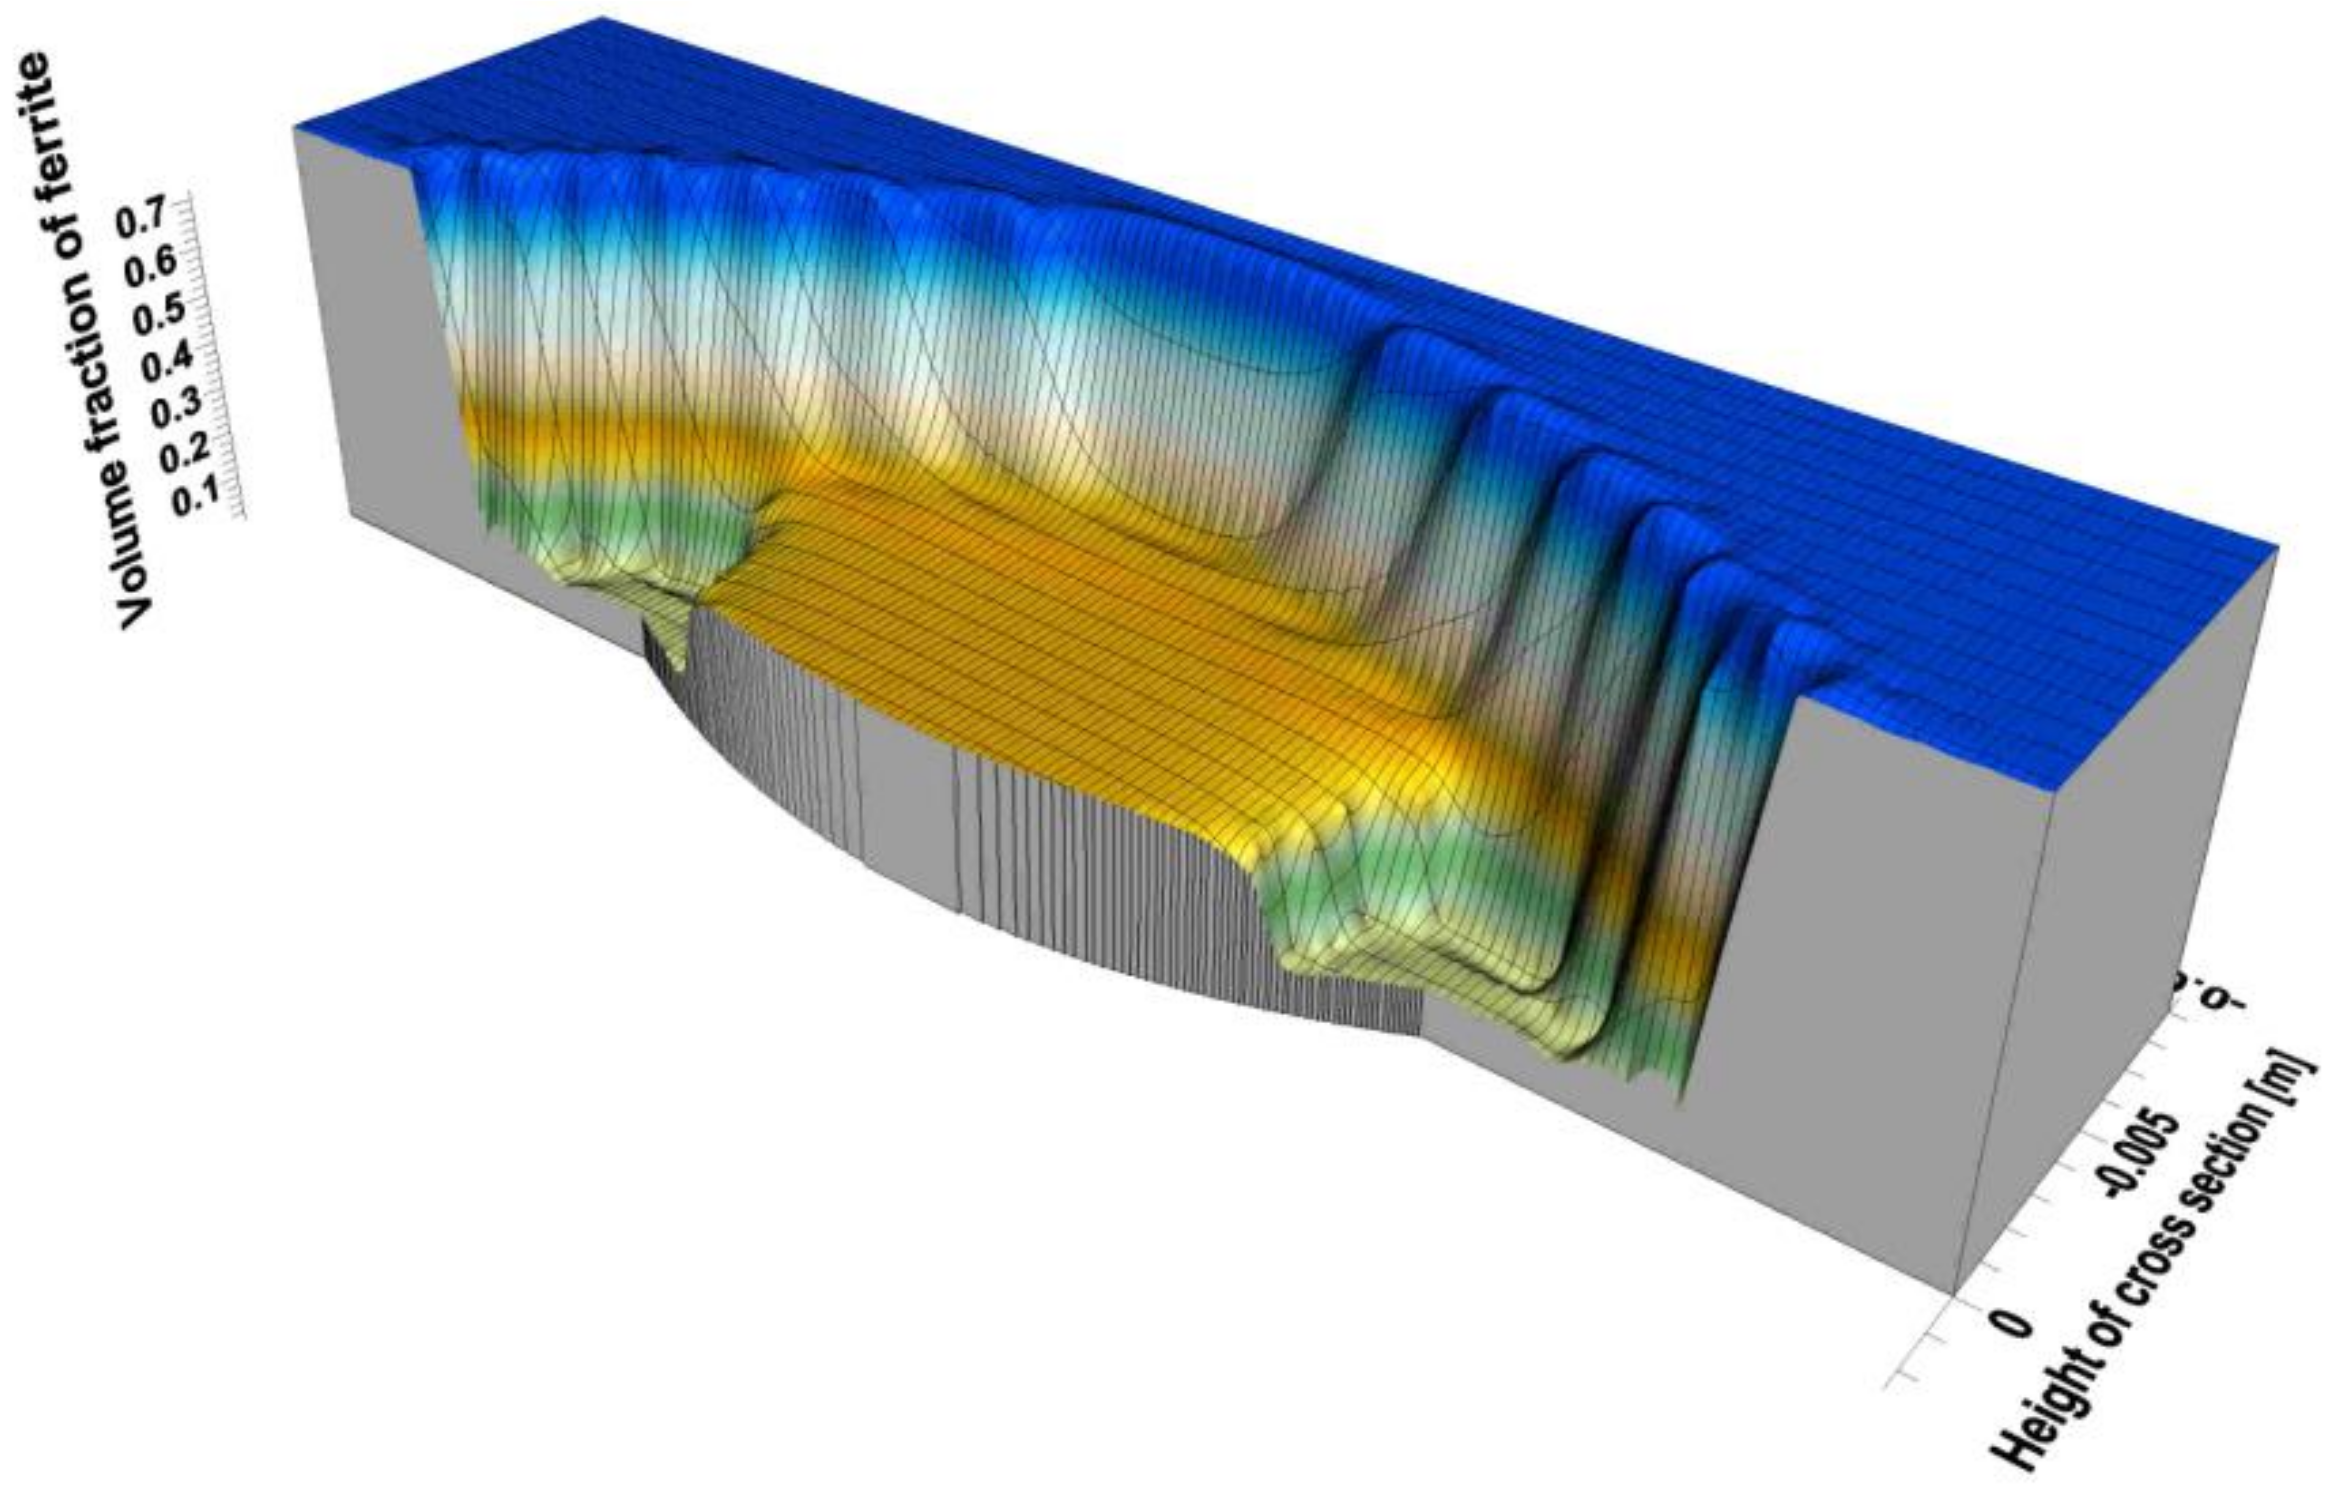
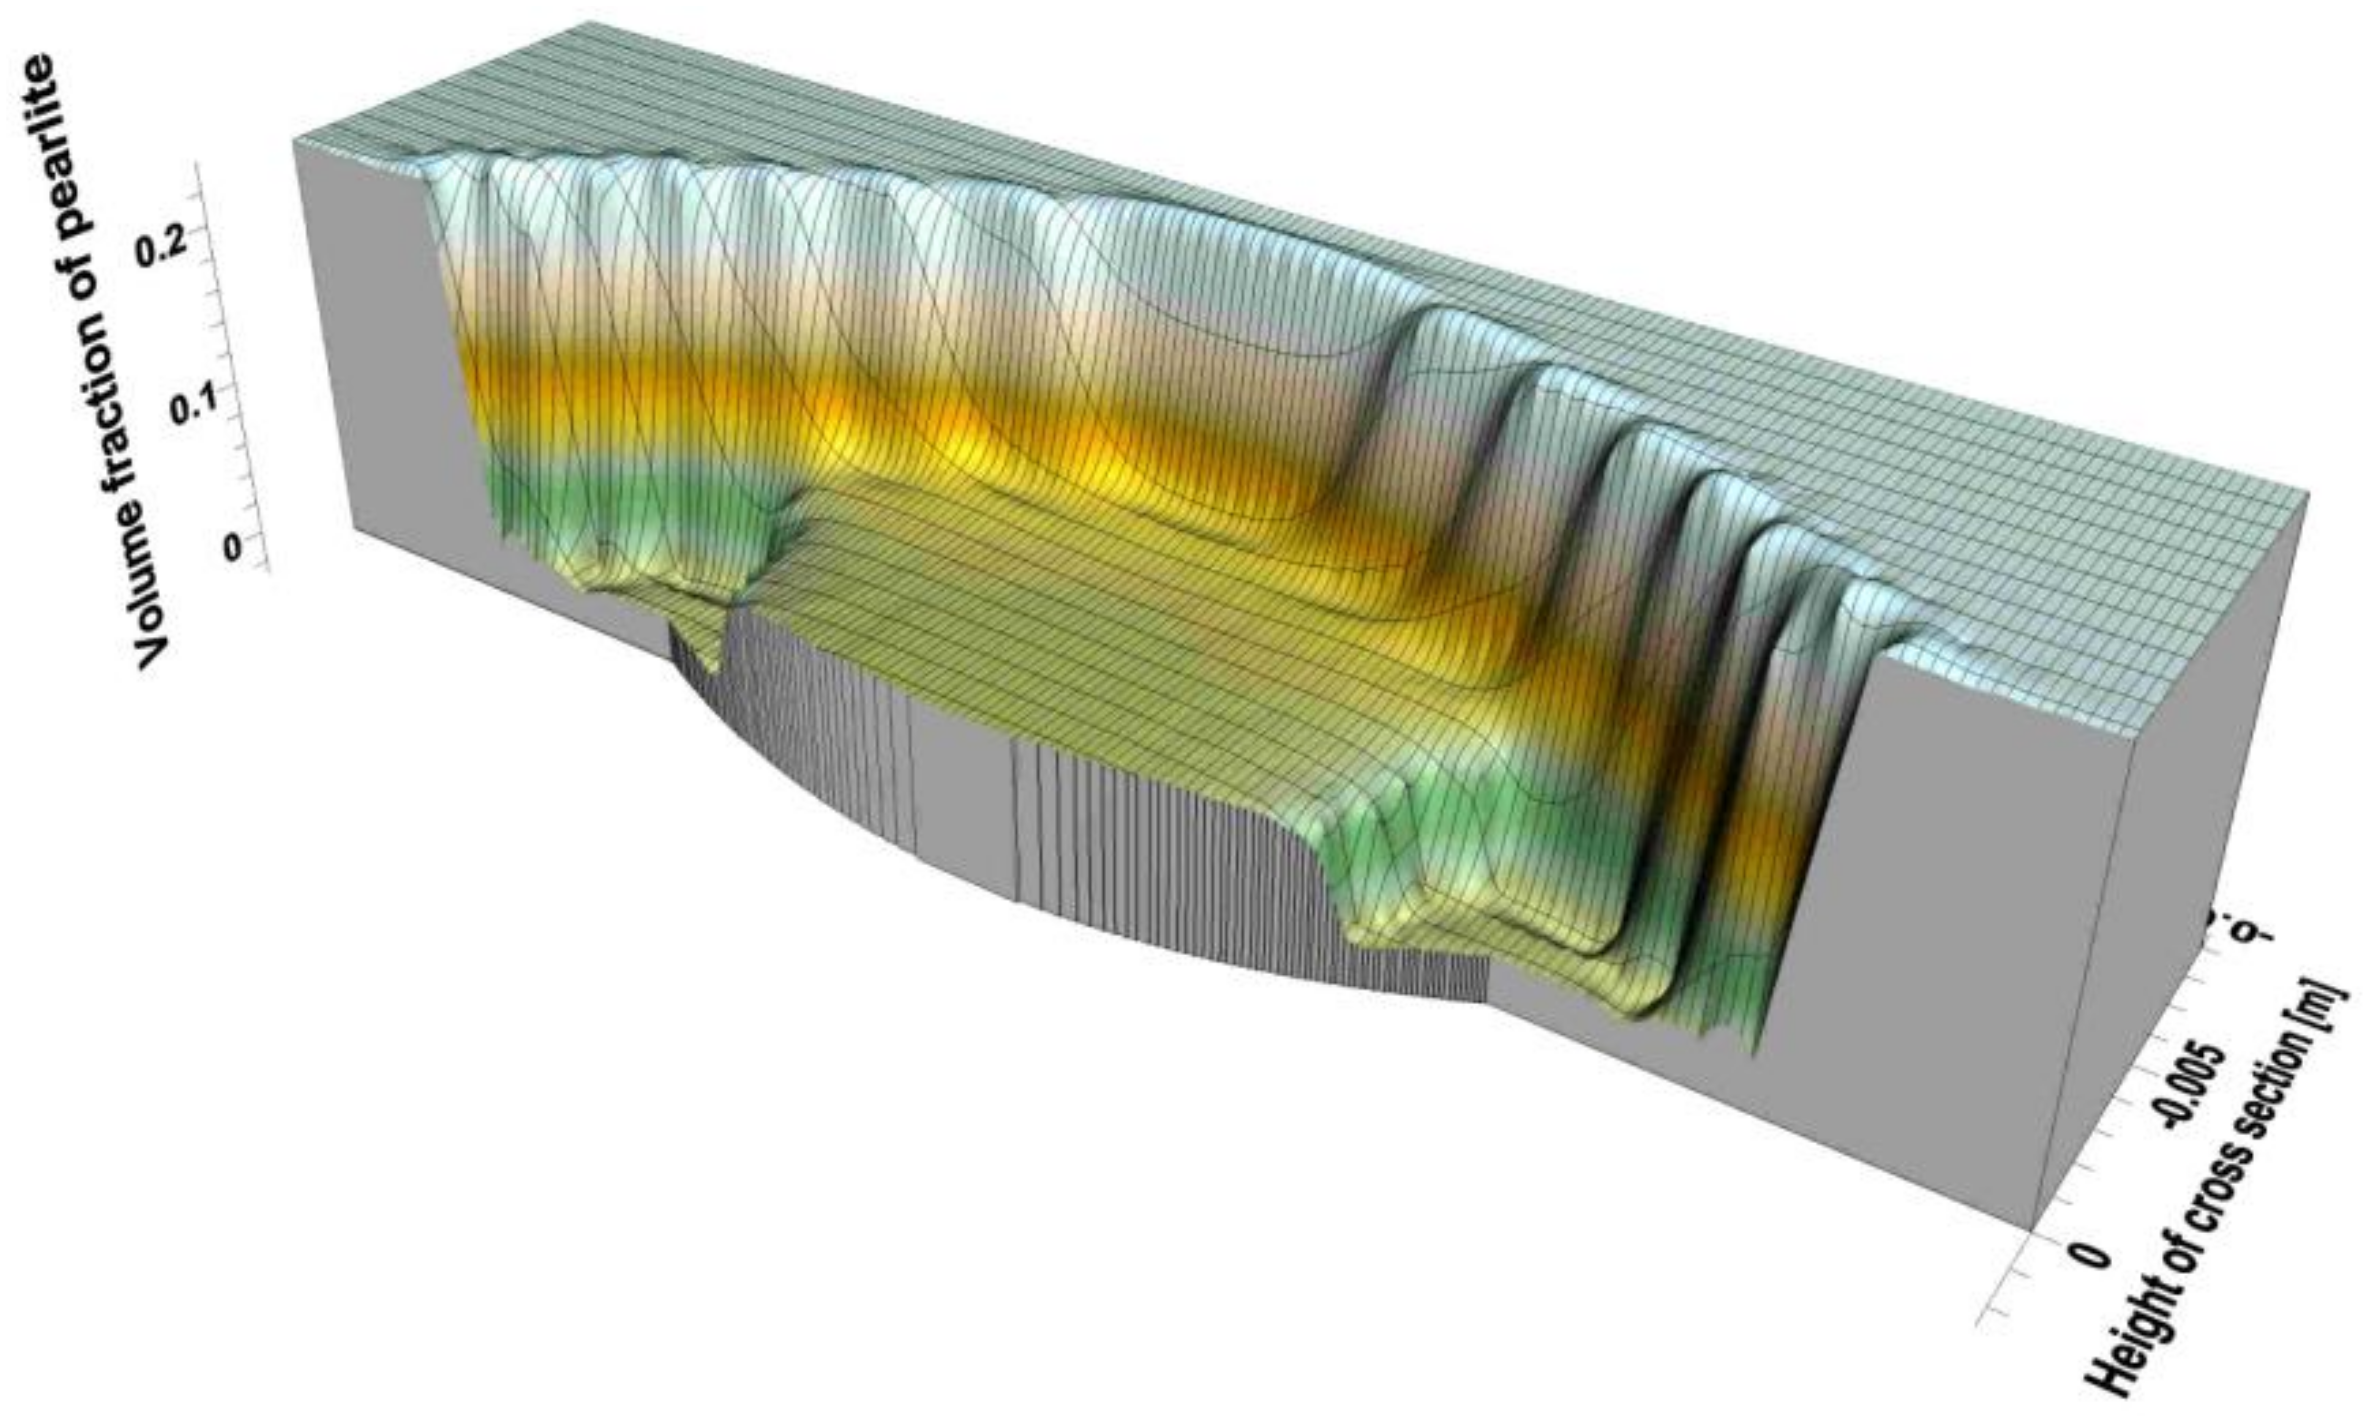
Distributions of individual phases in the cross-section after the process is shown in Figure 9, Figure 10 and Figure 11. The share of bainite in the padded weld varies from 100% (in weld corners) to 69% in its middle part (Figure 9). The volume shares of ferrite and pearlite vary from 28% and 3% in the weld to 70% and 30% in native material, respectively (Figure 10 and Figure 11).
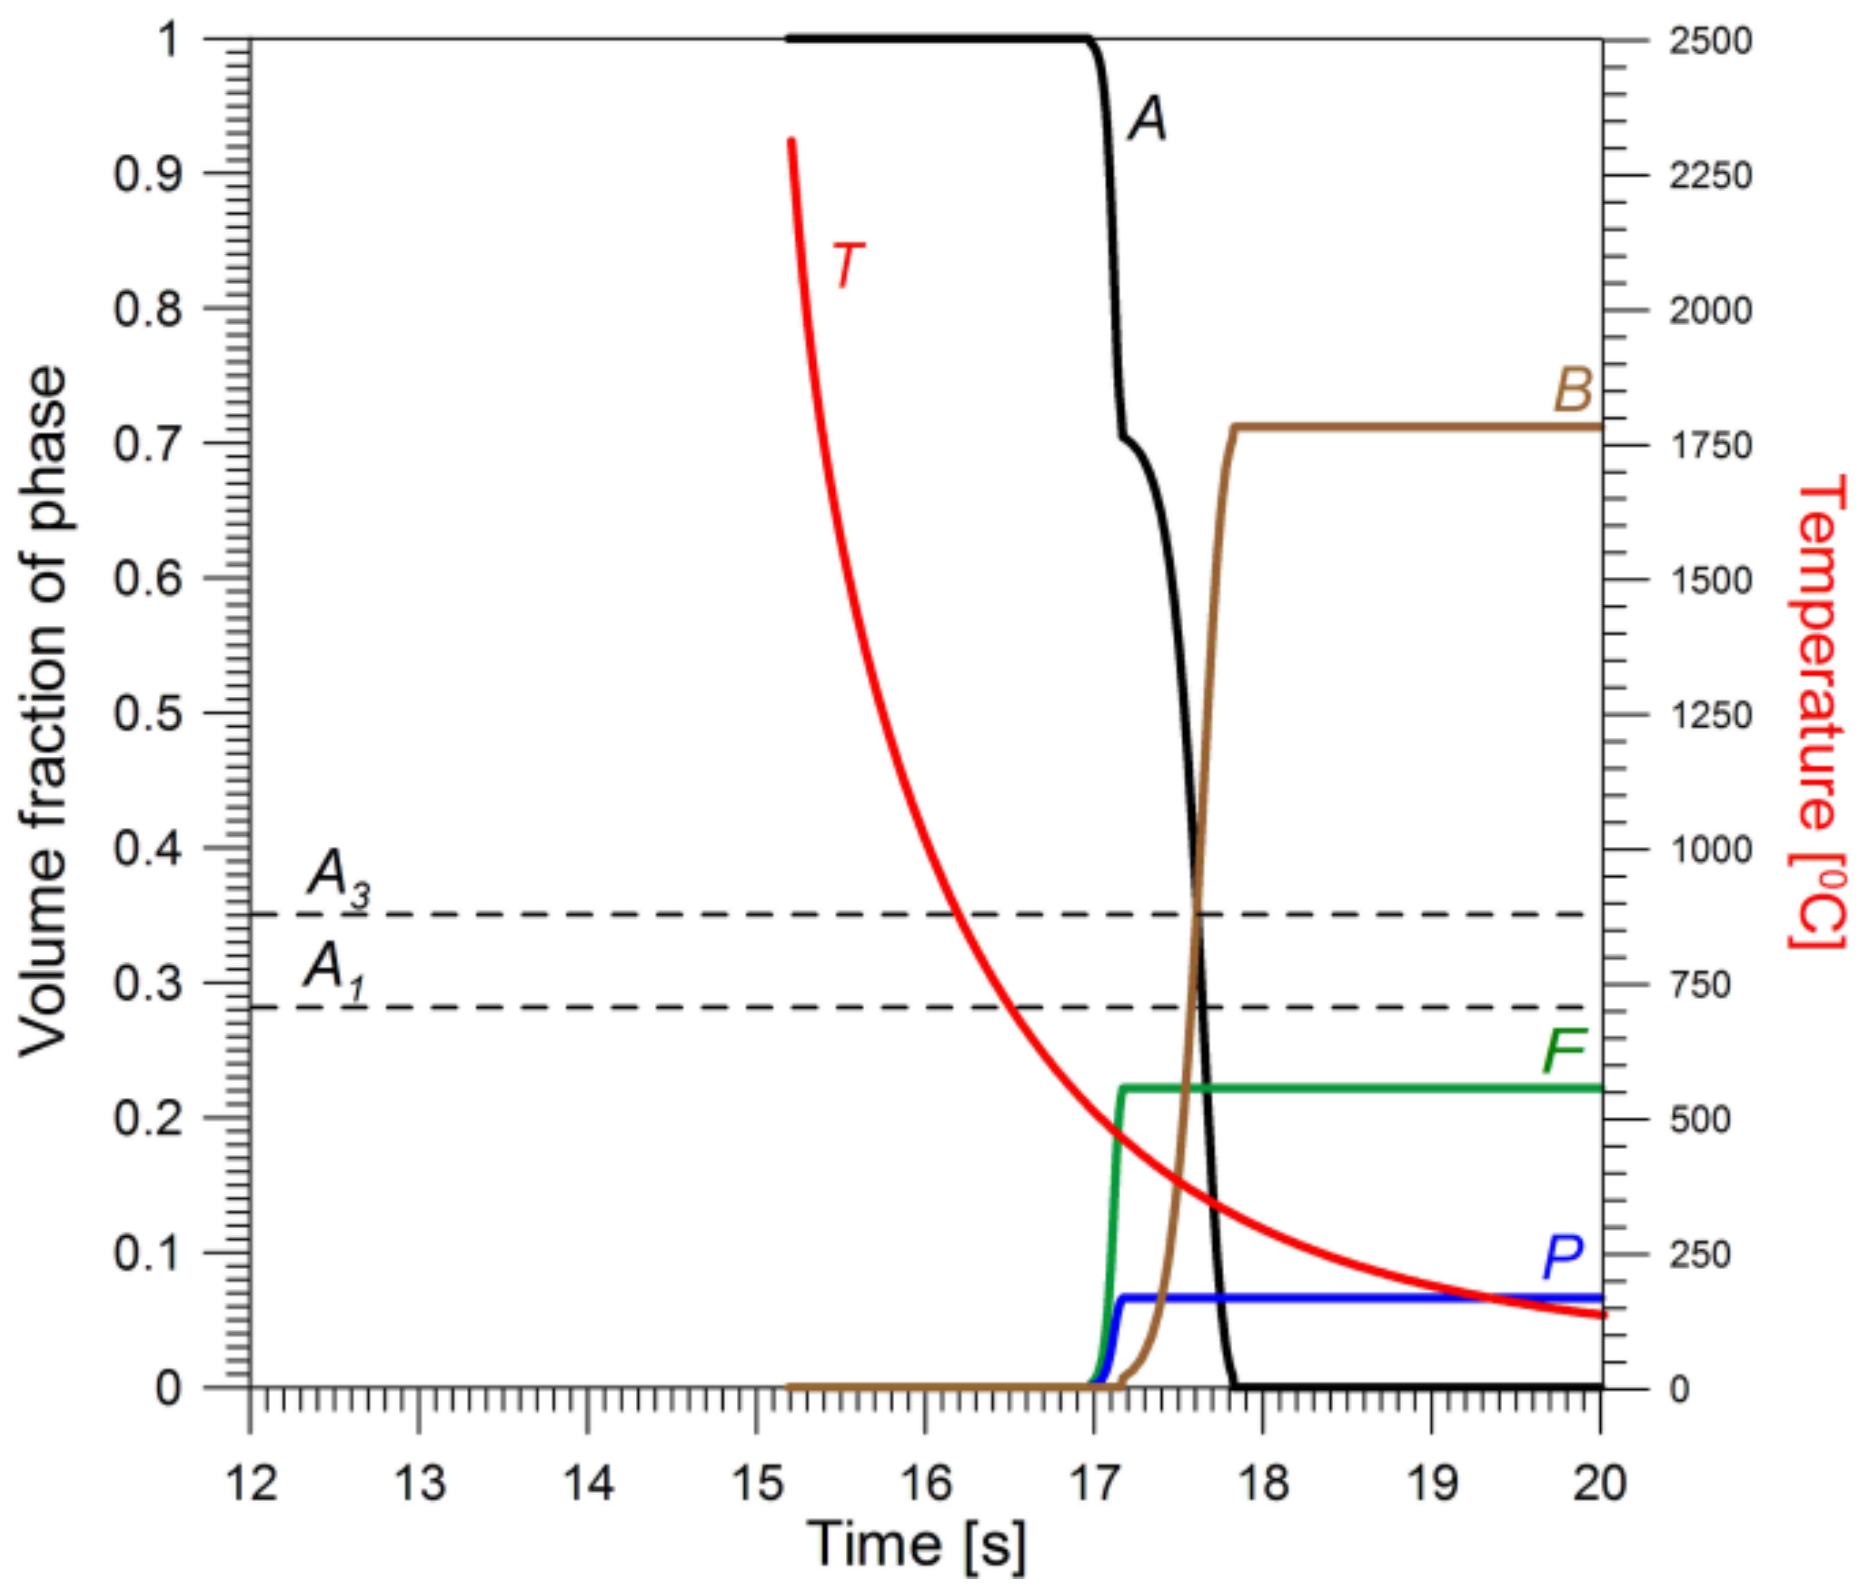
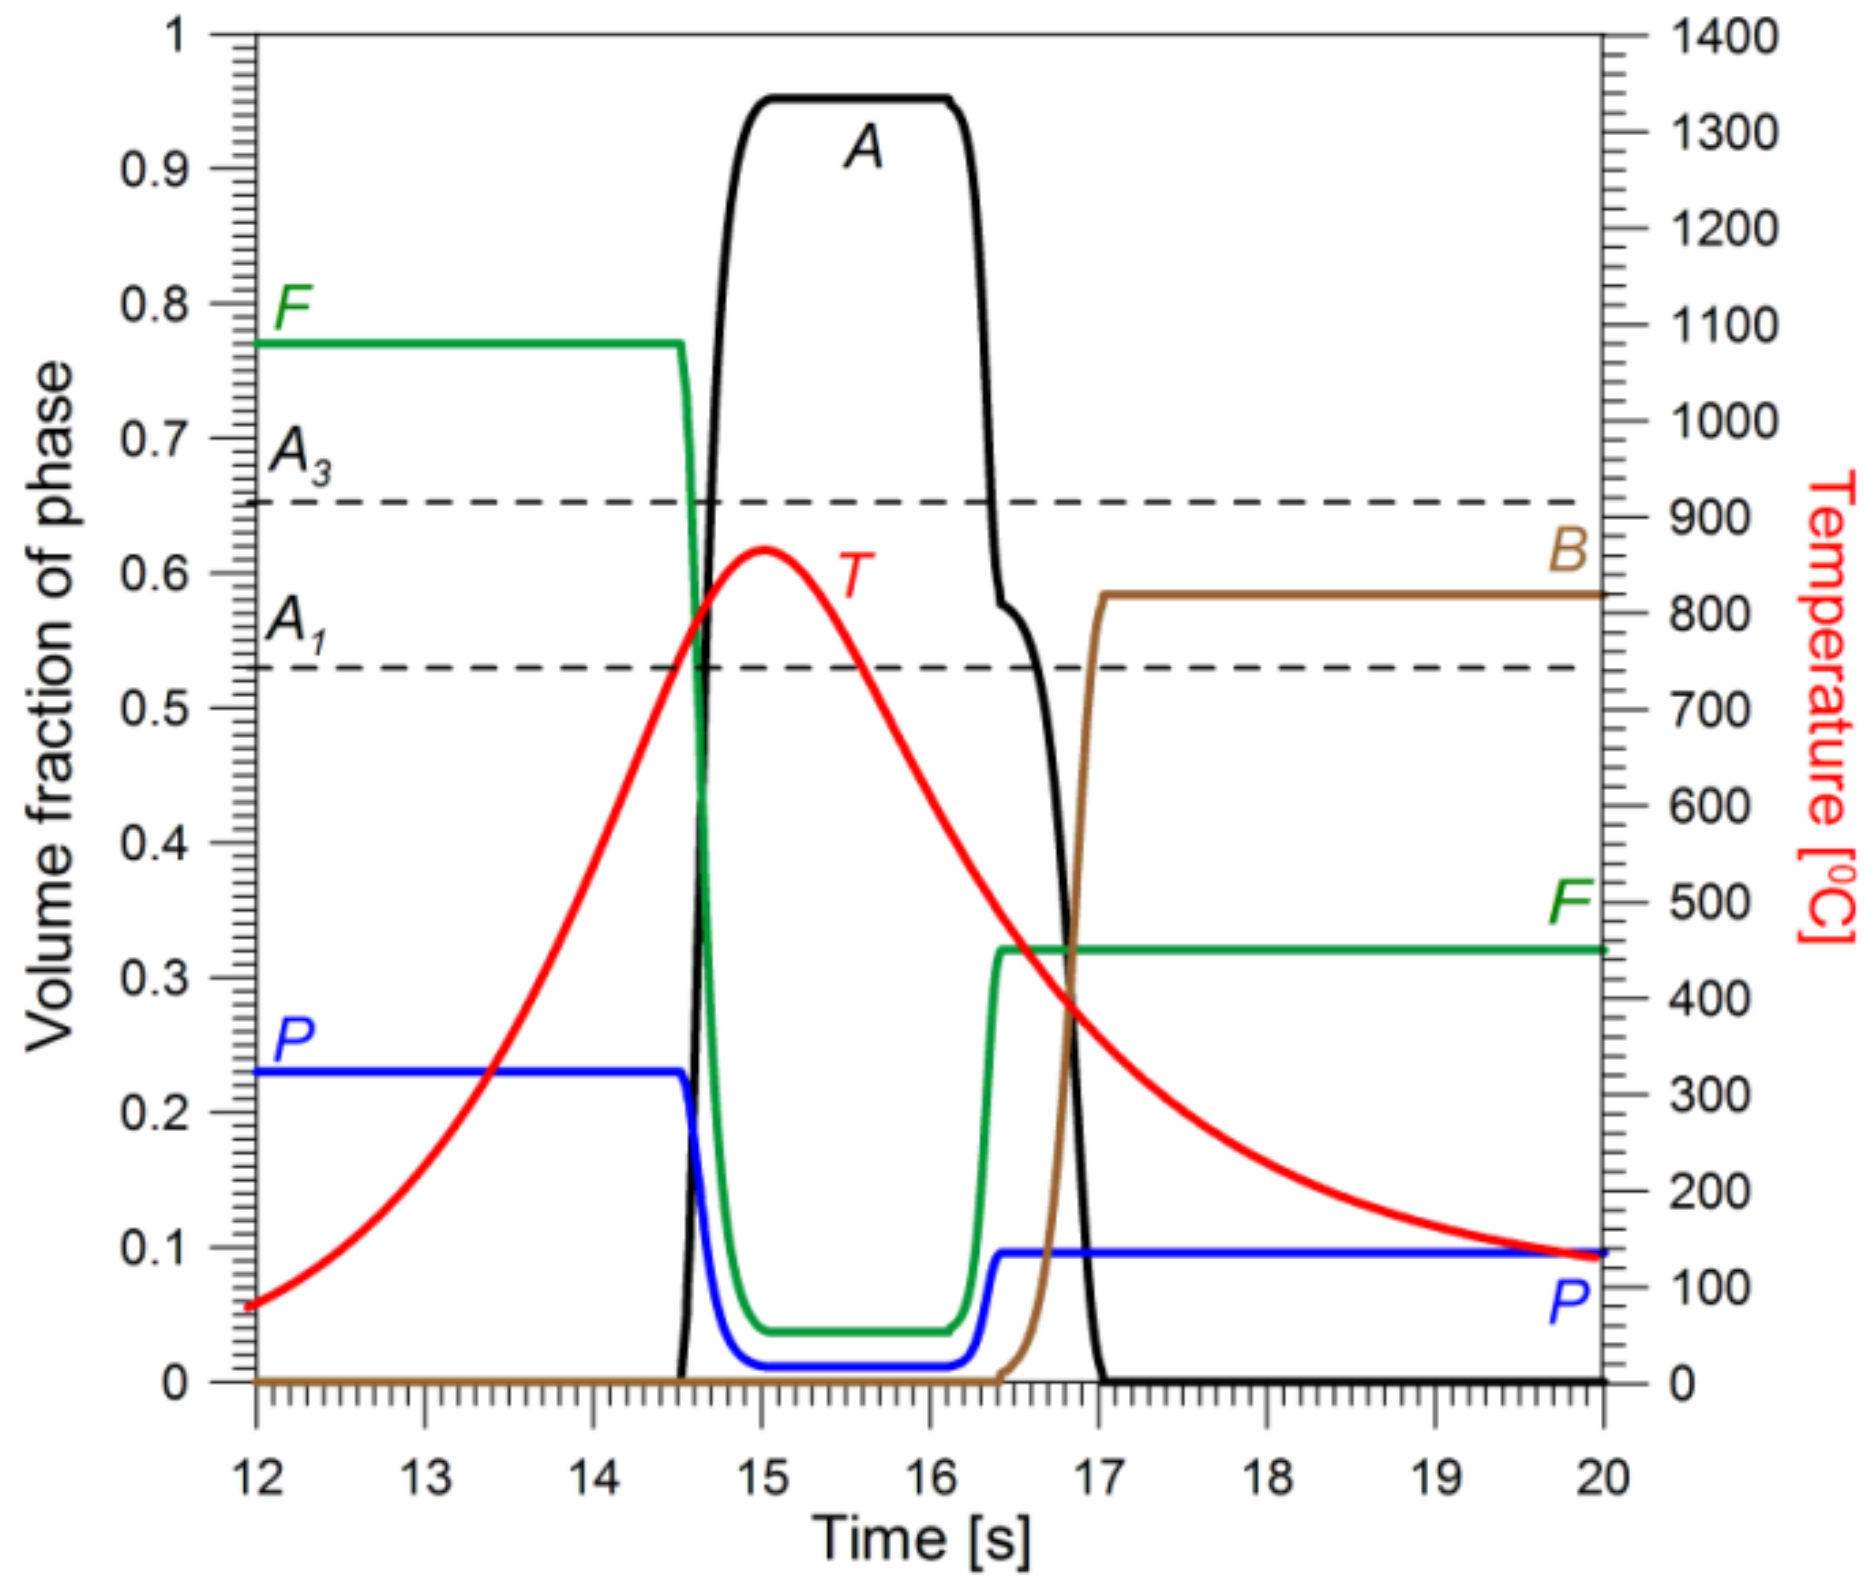
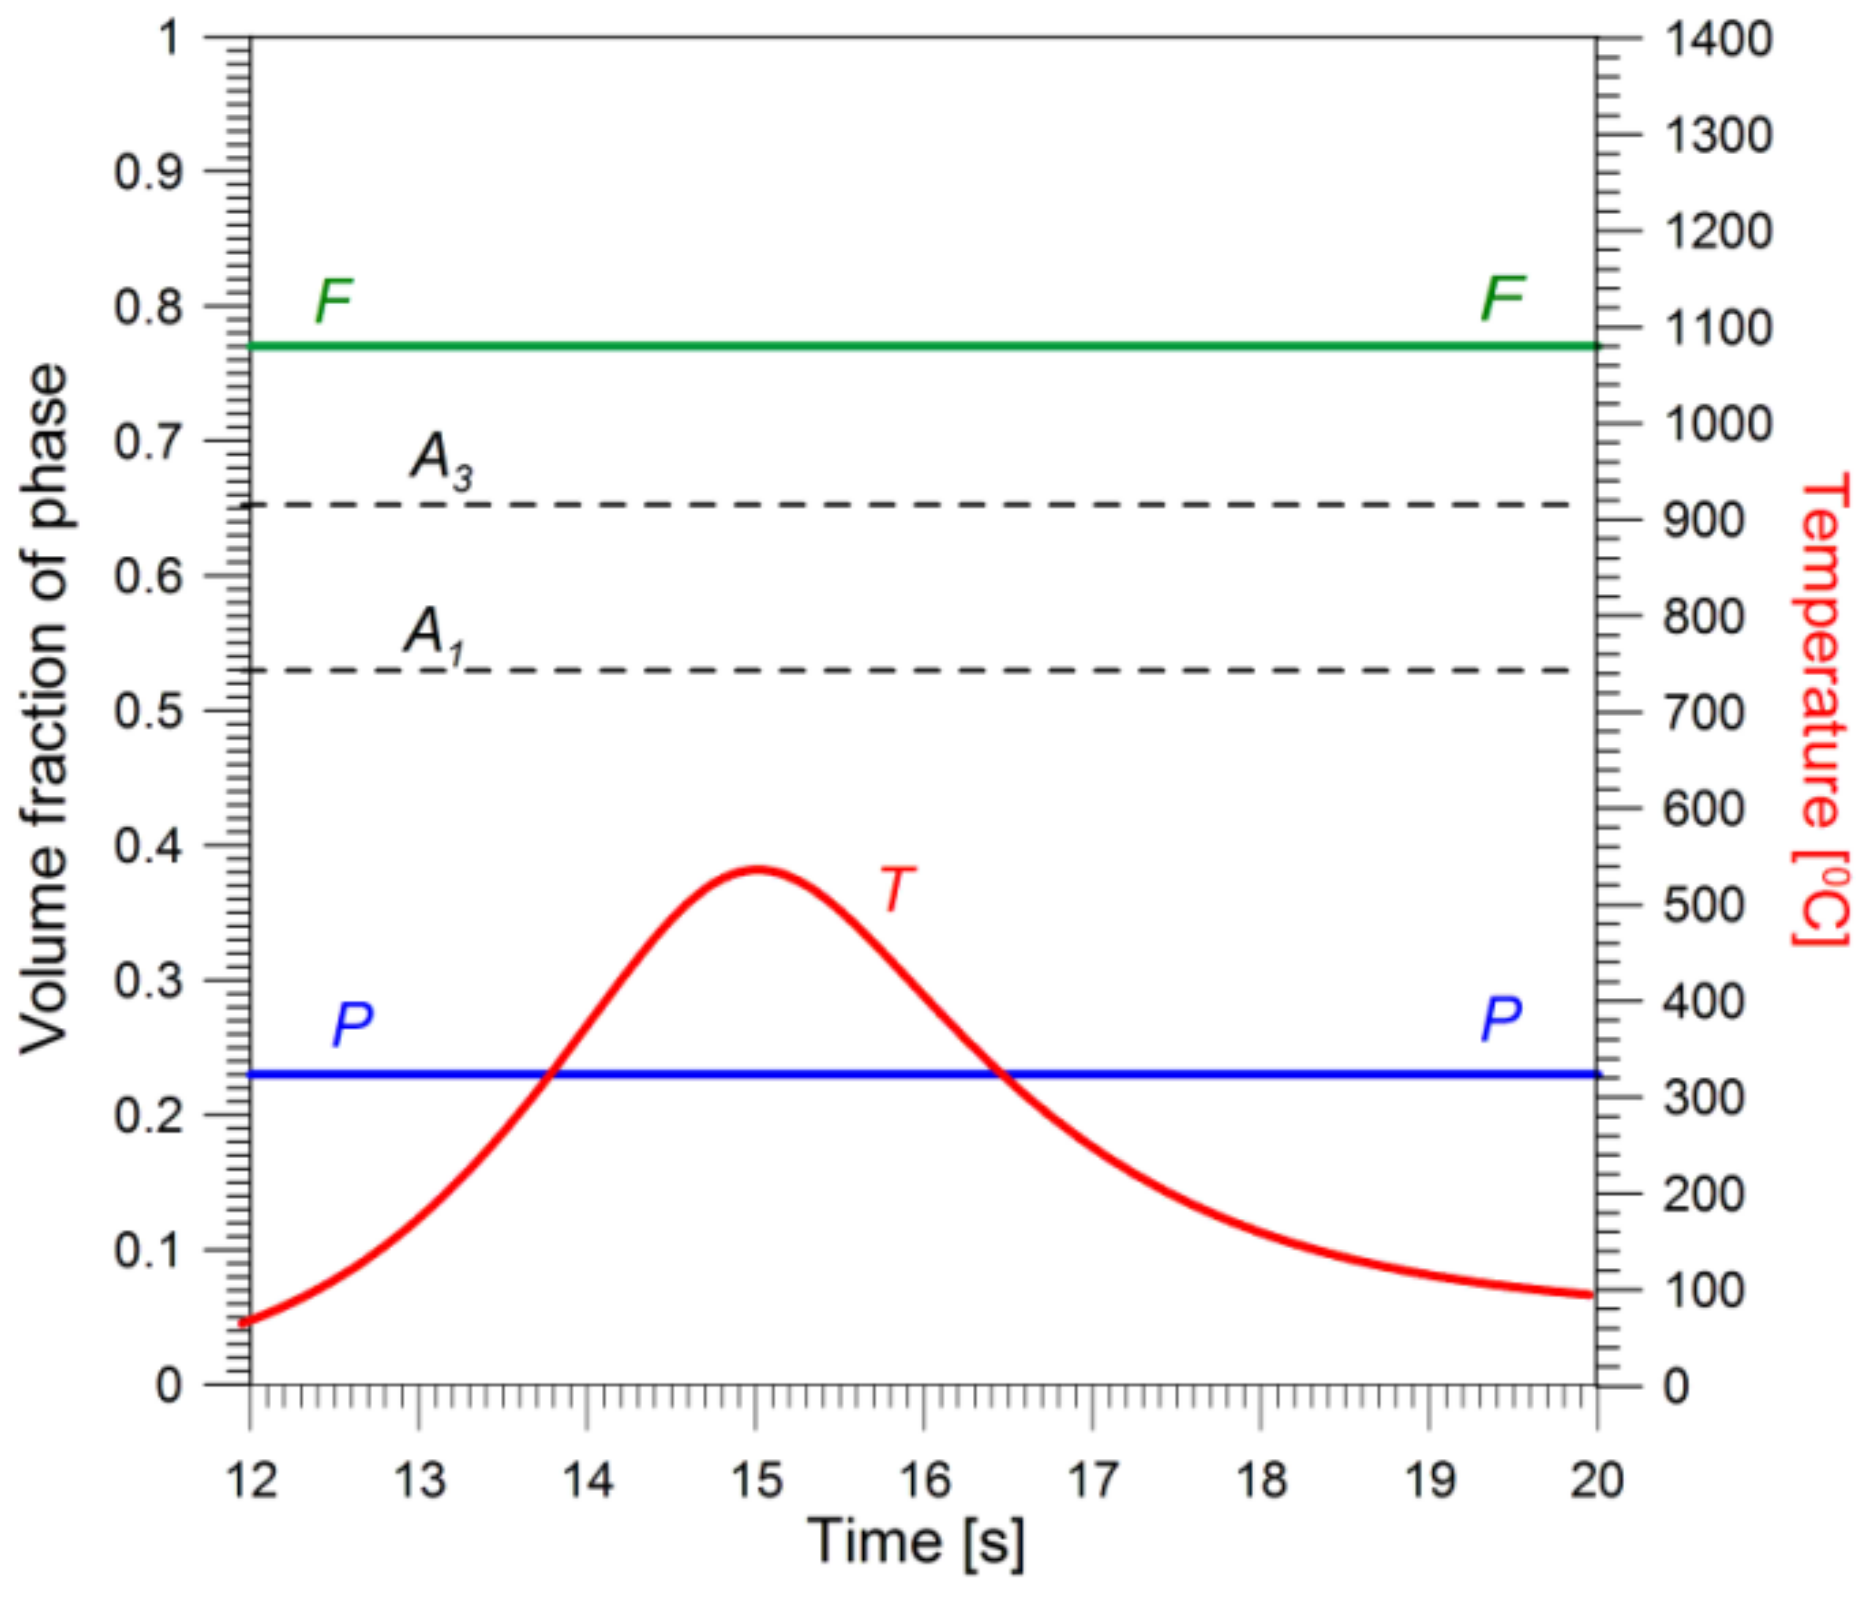
Figure 12, Figure 13, Figure 14 and Figure 15 show thermal histories and changes in the volumetric shares of the individual phases in points indicated in Figure 7. The peaks on the temperature charts indicate maximum temperature in thermal cycles.
Points 1 (Figure 12) and 2 (Figure 13) are located in fusion and full transformation zones, respectively. Therefore, the initial structure for the cooling transformation was 100% austenite. At point 3 (Figure 14) ca. 95% of the native structure transformed into austenite from the partial transformation zone during heating. In point 4, the heat structure zone (Figure 15) of the native structure of the material remained unchanged.

6. Results and Discussion

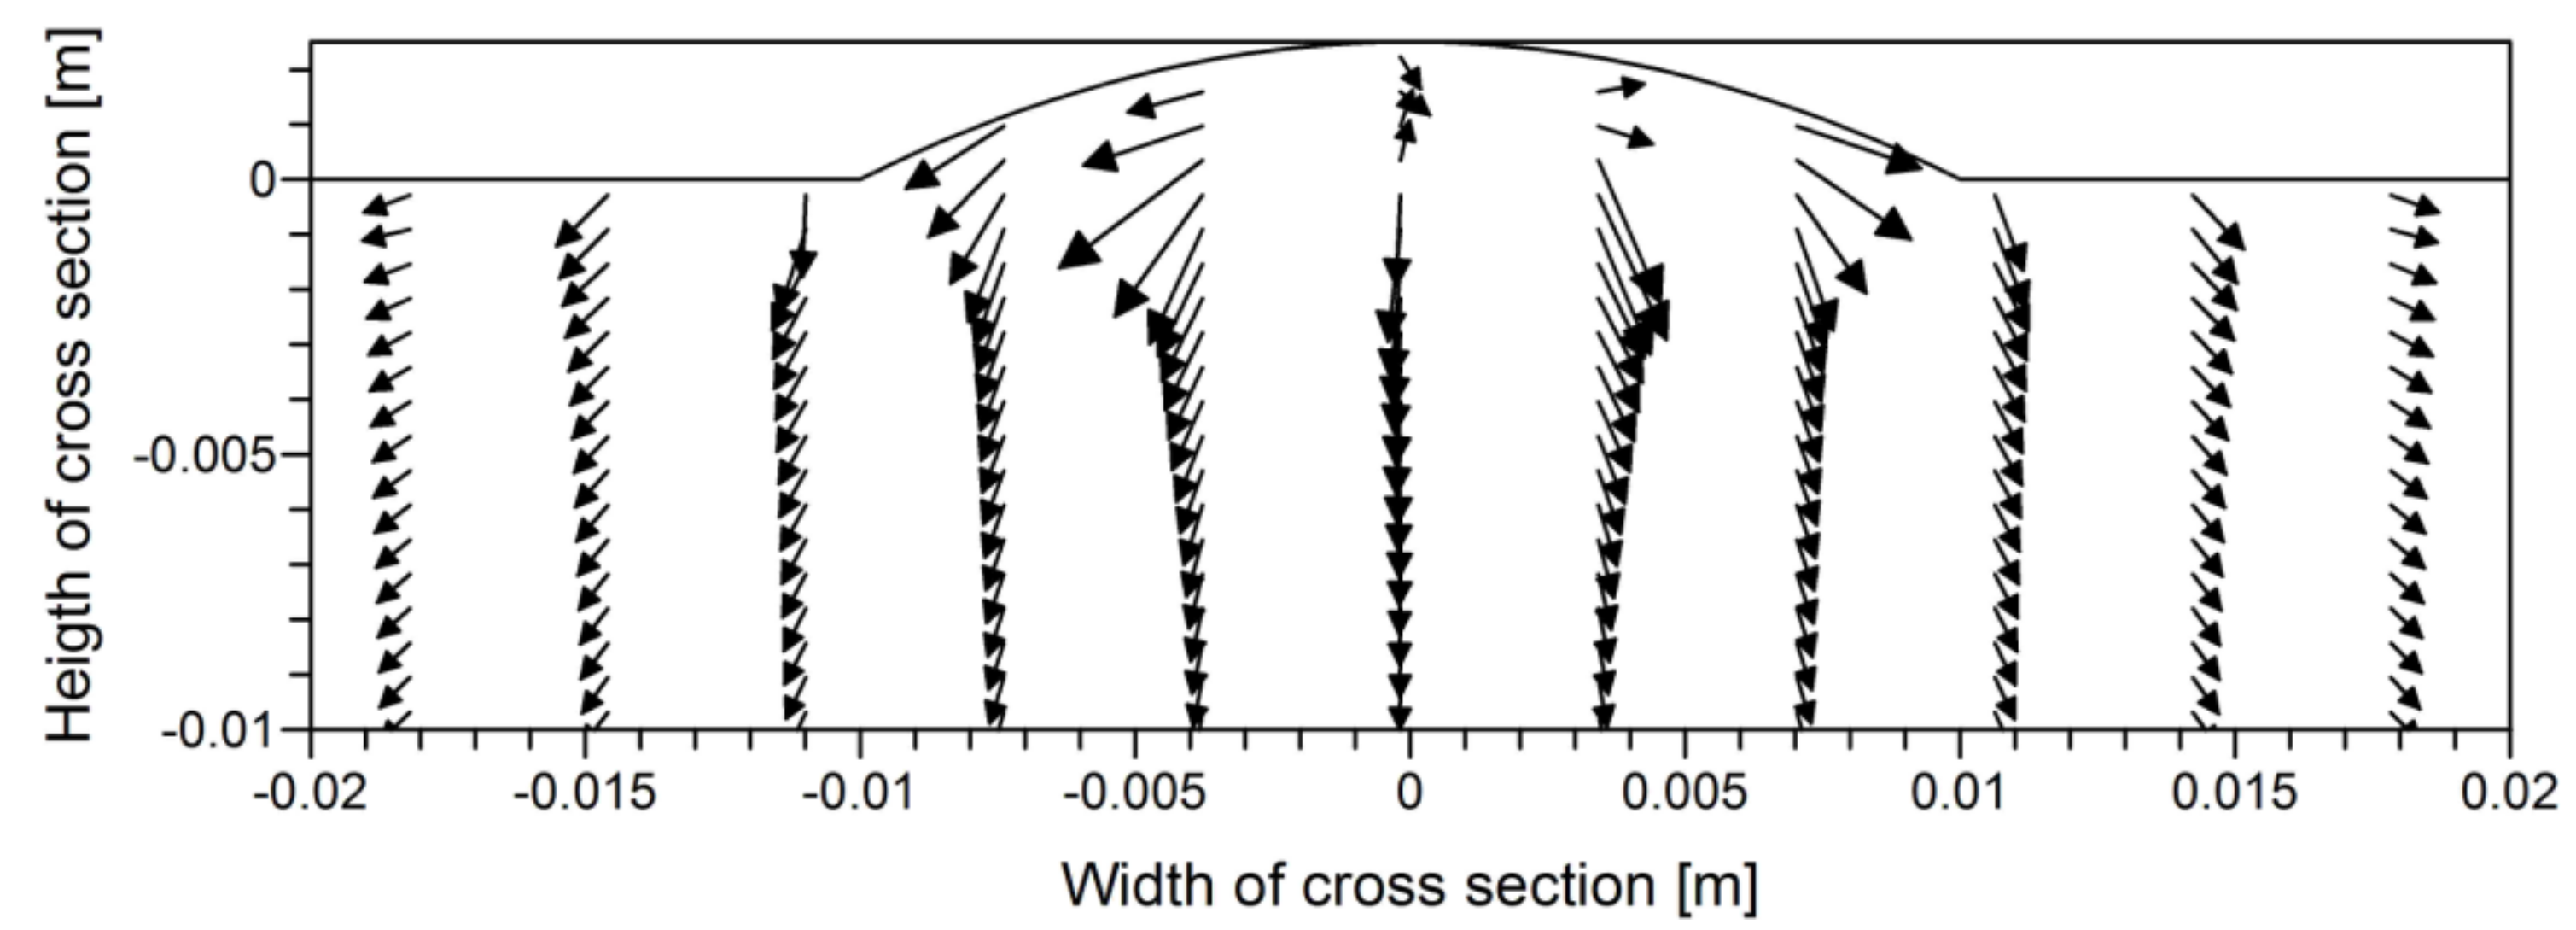
With the aim of verifying the correctness of the adopted calculation methods and the results obtained with their use, metallographic analysis of the padding was carried out (Figure 16). Based on the maximum temperature distributions (Figure 7), the fusion line marked in Figure 16 by the black line is consistent with that determined on the metallographic specimen. Analogically determined boundaries of the full transformation zone also show satisfactory agreement, especially in the main part of the metallographic sample. Figure 17 shows the distribution of calculated cooling velocity vectors in padded weld. In the reinforcement area, the directions of heat propagation with the directions of solidification were not obtained. The compatibility of calculated cooling velocity vectors with the dendritic grain growth directions can be seen in the area fusion zone (please compare Figure 16).
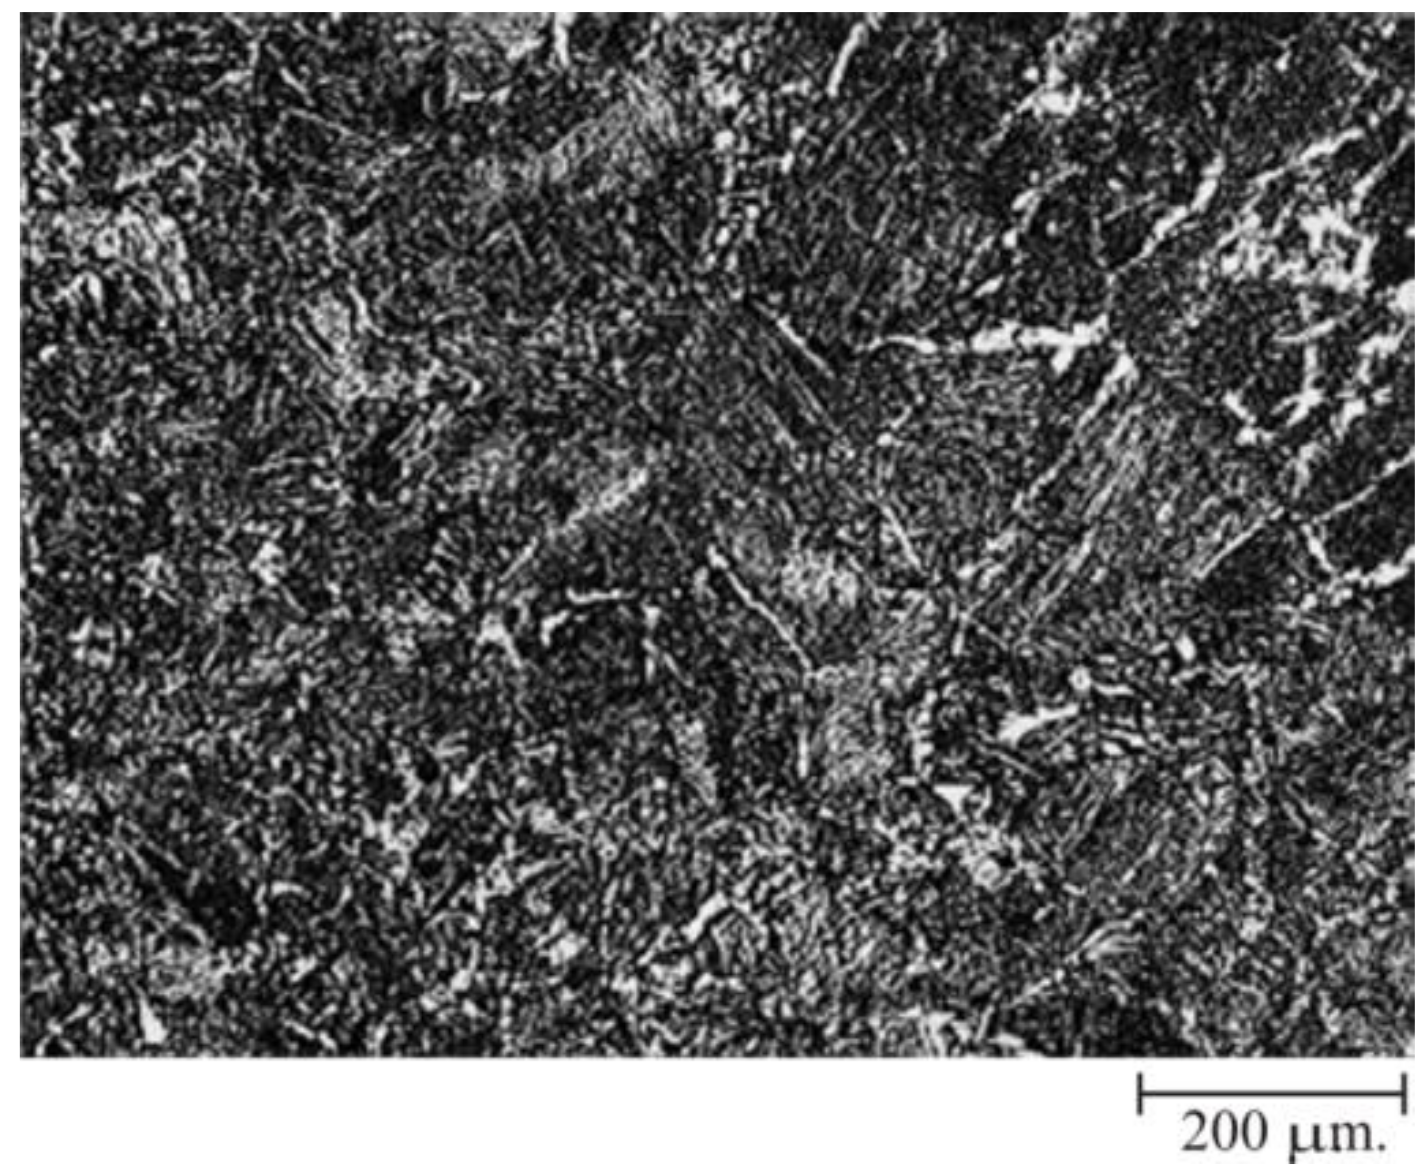
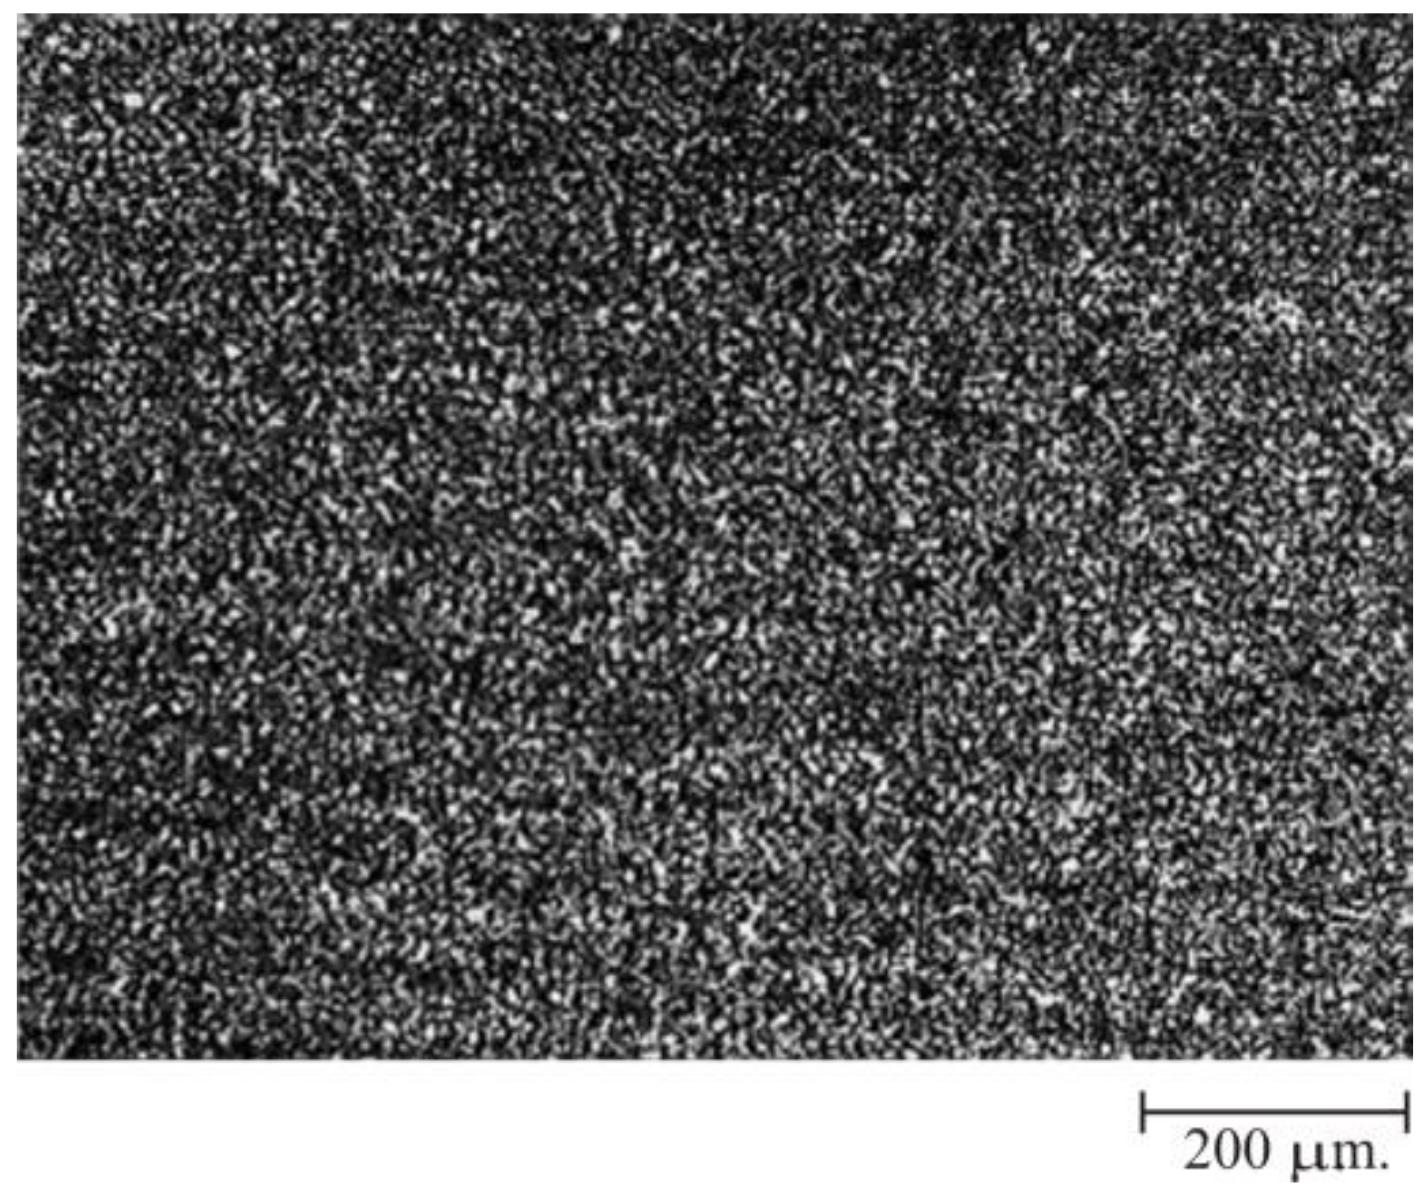
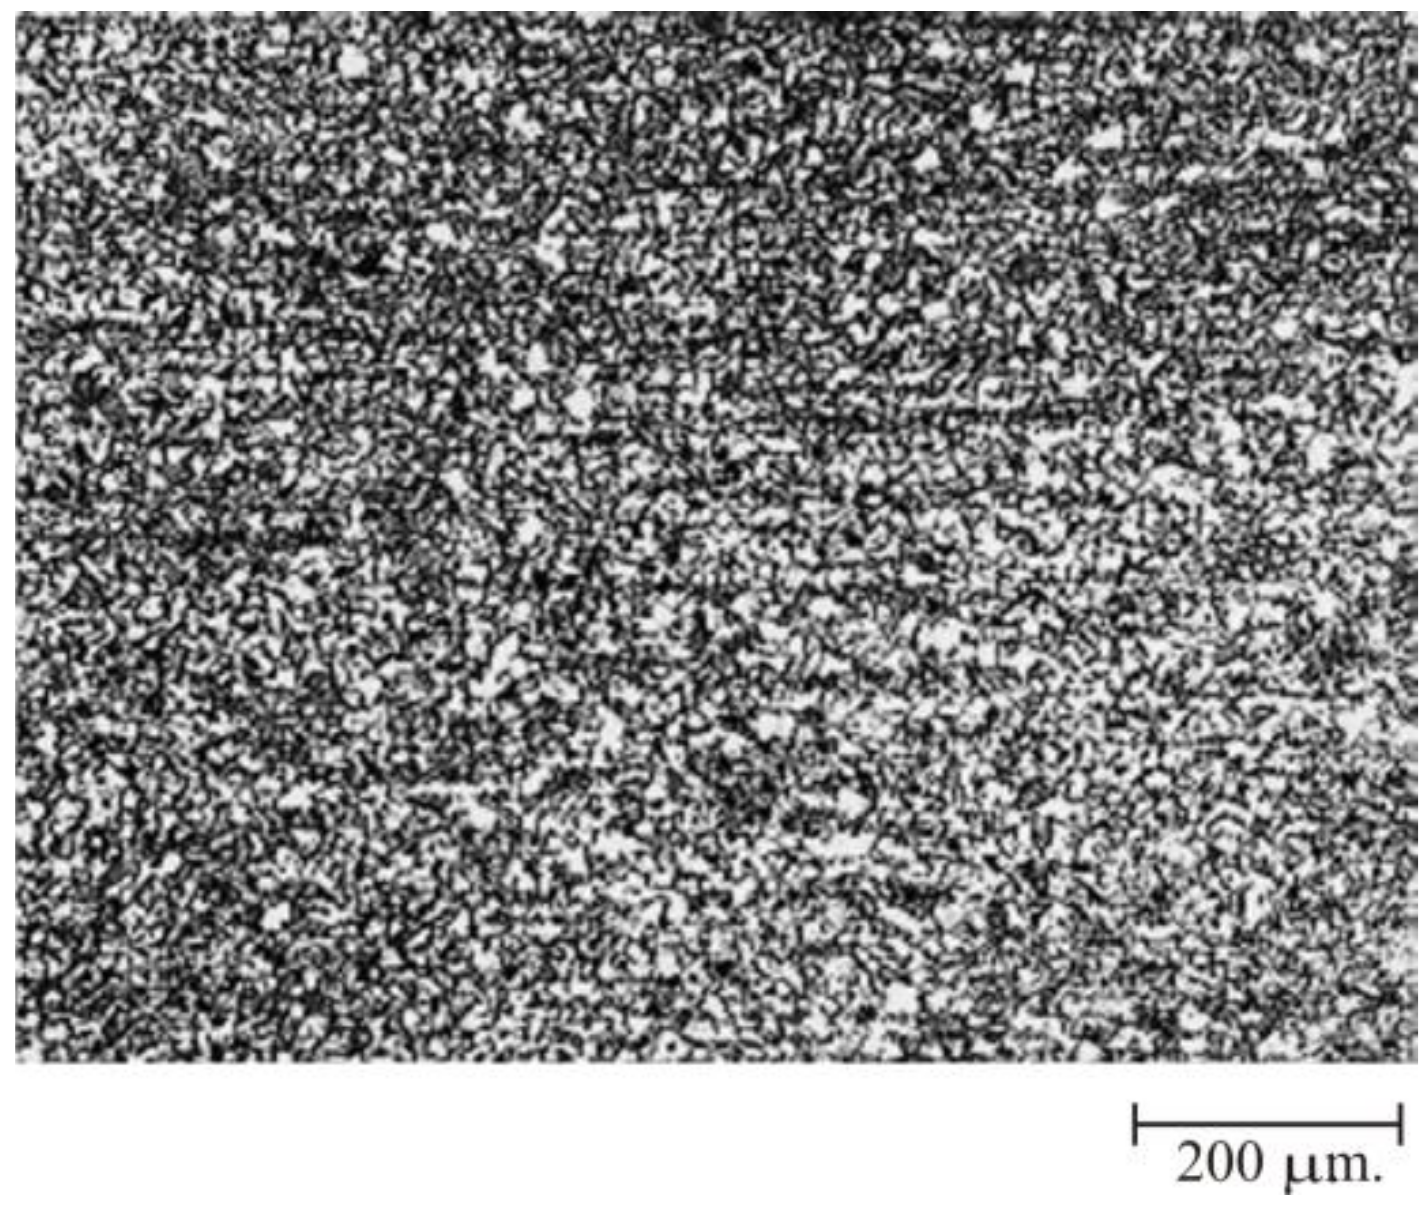
A detailed structure analysis was also performed. In the padding area (Figure 18), a mixture of bainite, pearlite, and ferrite, with dendritic structure characteristic for solidifying casts, was observed. Near the border of the fusion zone, the amount of bainite decreases slightly and the Widmanstätten structure appears (Figure 19). In the area of partial transformation, the amount of bainite falls sharply and shows a fine-grained structure (Figure 20). In the area outside the zone of heat influence, there is a ferritic-pearlitic structure of native material (Figure 21).

7. Conclusions

The paper presents the methodology for determining the temperature and material structure during SAW overlaying. Analytical methods were used to describe the phenomena occurring in the overlaying process. The calculations were carried out using our own algorithms, procedures and programs. This allowed us to achieve the following results:
  • Equations describing the temperature field in the semi-infinite model of the body were derived using the heat source model included the interaction of the electric arc, as well as the heat of weld reinforcement.
  • Considering the heat transferred by the molten electrode material in the heat source model allows one to determine the temperature field with the distribution found in welding practice.
  • This is confirmed by the fusion zone and HAZ shapes determined on the basis of calculations obtained for the source model defined in this way have been confirmed by experiments.
  • The boundaries of individual heat influence zones determined in numerical calculations and experiments show satisfactory agreement.
  • The results of metallographic studies confirmed the validity of the adopted assumptions and solutions.
The subject of further research will be to expand the possibilities of the proposed model for the calculation of temperature and structural changes for multi-pass hardfacing. In the case of applying hardening coatings, the properties and structure of the overlayed pades may differ significantly from the properties and structures of the overlayed material, especially if the material of the padding is not mixed well with the substrate. This is a new, difficult challenge in modeling the welding overlaying process. An interesting issue is also the estimation of residual stresses after regeneration by pad welding.

Author Contributions

Conceptualization, J.W. and N.S.; methodology, J.W. and N.S.; software, J.W. and E.G.; validation, J.W., E.G. and M.G.; formal analysis, N.S.; investigation, M.G.; resources, J.W.; data curation, M.G.; writing—original draft preparation, E.G.; writing—review and editing, E.G.; visualization, E.G. and M.G.; supervision, J.W.; project administration, N.S.; funding acquisition, N.S. and E.G.

Funding

This research received no external funding.

Conflicts of Interest

The authors declare no conflict of interest.

References

  1. Fassani, R.N.S.; Trevisan, O.V. Analytical modeling of multipass welding process with distributed heat source. J. Braz. Soc. Mech. Sci. Eng. 2003, 25, 302–305. [Google Scholar] [CrossRef]
  2. Fachinotti, V.D.; Anca, A.A.; Cardona, A. Analytical solutions of the thermal field induced by moving double-ellipsoidal and double elliptical heat sources in a semi-infinite body. Int. J. Num. Meth. Biomech. Eng. 2011, 27, 595–607. [Google Scholar] [CrossRef]
  3. Ghosh, A.; Barman, N.; Chattopadhyay, H.; Hloch, S. A study of thermal behaviour during submerged arc welding. Stroj. Vest. J. Mech. Eng. 2013, 59, 333–338. [Google Scholar] [CrossRef]
  4. Antonakakis, T.; Maglioni, C.; Vlachoudis, V. Closed form solutions of the heat diffusion equation with Gaussian source. Int. J. Heat Mass Transf. 2013, 62, 314–322. [Google Scholar] [CrossRef]
  5. Franco, A.; Romoli, L.; Musacchio, A. Modelling for predicting seam geometry in laser beam welding of stainless steel. Int. J. Therm. Sci. 2014, 79, 194–205. [Google Scholar] [CrossRef]
  6. Salimi, S.; Bahemmat, P.; Haghpanahi, M. A 3D transient analytical solution to the temperature field during dissimilar welding processes. Int. J. Mechn. Sci. 2014, 79, 66–74. [Google Scholar] [CrossRef]
  7. Lindgren, L.E. Numerical modelling of welding. Comput. Methods Appl. Mech. Eng. 2006, 195, 6710–6736. [Google Scholar] [CrossRef]
  8. Joshi, S.; Semetay, C.; Price, J.W.H.; Nied, H.F. Weld-induced residual stresses in a prototype dragline cluster and comparison with design codes. Thin-Walled Struct. 2010, 48, 89–102. [Google Scholar] [CrossRef]
  9. Hildebrand, J.; Starcevic, I.; Werner, F.; Heinemann, H.; Köhler, G. Numerical simulation of TIG-dressing of welded joints. In Proceedings of the Joint International Conference on Computing and Decision Making in Civil and Building Engineering, Montreal, QC, Canada, 14–16 June 2006; pp. 1487–1496. [Google Scholar]
  10. Mahapatra, M.M.; Datta, G.L.; Pradhan, B. Three-dimensional finite element analysis to predict the effects of shielded metal arc welding process parameters on temperature distributions and weldment zones in butt and one-sided fillet welds. Proc. Inst. Mech. Eng. Part B J. Eng. Manuf. 2006, 220, 837–845. [Google Scholar] [CrossRef]
  11. Joshi, S.; Hildebrand, J.; Aloraier, A.S.; Rabczuk, T. Characterization of material properties and heat source parameters in welding simulation of two overlapping beads on a substrate plate. Comput. Mater. Sci. 2013, 69, 559–565. [Google Scholar] [CrossRef]
  12. Piekarska, W.; Kubiak, M. Three-dimensional model for numerical analysis of thermal phenomena in laser-arc hybrid welding process. Int. J. Heat Mass Transf. 2011, 54, 4966–4974. [Google Scholar] [CrossRef]
  13. Moarrefzadeh, A. Numerical simulation of workpiece thermal profile in Plasma Arc Cutting (PAC) Process. WSEAS Trans. Appl. Theor. Mech. 2011, 6, 160–166. [Google Scholar]
  14. Chen, Y.; He, Y.; Chen, H.; Zhang, H.; Che, S. Effect of weave frequency and amplitude on temperature field in weaving welding process. Int. J. Adv. Manuf. Technol. 2014, 75, 803–813. [Google Scholar] [CrossRef]
  15. Sarkar, A.; Datta, A.; Dey, P.; Rai, R.N.; Saha, S.C. A numerical approach for modelling thermal profiles and effects of process parameters on it in submerged arc welding of AISI 1518 grade steel. J. Therm. Eng. 2015, 1, 505–516. [Google Scholar] [CrossRef]
  16. Nezamdost, M.R.; Nekonie Esfahani, M.R.; Hashemi, S.H.; Mirbozorgi, S.A. Investigation of temperature and residual stresses field of submerged arc welding by finite element method and experiment. Int. J. Adv. Manuf. Technol. 2016, 87, 615–624. [Google Scholar] [CrossRef]
  17. Górka, J. Assessment of steel subjected to the thermomechanical control process with respect to weldability. Metals 2018, 8, 169. [Google Scholar] [CrossRef]
  18. Ghoreishi, R.; Roohi, A.H. Analysis of the influence of cutting parameters on surface roughness and cutting forces in high speed face milling of Al/SiC MMC. Mater. Res. Express 2018, 5. [Google Scholar] [CrossRef]
  19. Urbikain, G.; Perez, J.M.; López de Lacall, L.N.; Andueza, A. Combination of friction drilling and form tapping processes on dissimilar materials for making nutless joints. Proc. Inst. Mech. Eng. Part B J. Eng. Manuf. 2016, 232, 1007–1020. [Google Scholar] [CrossRef]
  20. Świerczyńska, A.; Fydrych, D.; Rogalski, G. Diffusible hydrogen management in underwater wet self-shielded flux cored arc welding. Int. J. Hydrogen Energ. 2017, 42, 24532–24540. [Google Scholar] [CrossRef]
  21. Wang, X.; Wang, J.; Gao, Z.; Xia, D.H.; Hu, W. Tempering effects on the microstructure and properties of submerged arc surfacing layers of H13 steel. J. Mater. Process. Technol. 2019, 269, 26–34. [Google Scholar] [CrossRef]
  22. Selvabharathi, R. Effect of post weld heat treatment and TiAlSiN coating on the tensile strength of autogenous plasma arc welding of duplex/ super austenitic stainless steels. J. Manuf. Process. 2019, 38, 135–147. [Google Scholar] [CrossRef]
  23. Barbosa, L.H.S.; Modenesi, P.J.; Godefroid, L.B.; Arias, A.R. Fatigue crack growth rates on the weld metal of high heat input submerged arc welding. Int. J. Fatigue 2019, 119, 43–51. [Google Scholar] [CrossRef]
  24. Ghadikolaei, A.D.; Ibrahim, H.; Amerinatanzi, A.; Hashemi, M.; Moghaddam, N.S.; Elahinia, M. Improving corrosion resistance of additively manufactured nickel–titanium biomedical devices by micro-arc oxidation process. J. Mater. Sci. 2019, 54, 7333–7355. [Google Scholar]
  25. Kim, N.H.; Gil, W.; Lim, H.D.; Choi, C.H.; Lee, H.W. Variation of mechanical properties and corrosion properties with Mo contents of Hyper Duplex Stainless-Steel welds. Met. Mater. Int. 2019, 25, 193–206. [Google Scholar] [CrossRef]
  26. Rosenthal, D. Mathematical theory of heat distribution during welding and cutting. Weld. J. 1941, 20, 220s–234s. [Google Scholar]
  27. Rykalin, N. Fundamentals of Heat Flow in Welding; AN SSSR: Moscow, Russia, 1947. [Google Scholar]
  28. Eagar, T.W.; Tsai, N.S. Temperature fields produced by travelling distributed heat sources. Weld. J. 1983, 62, 346s–355s. [Google Scholar]
  29. Goldak, J.; Chakravarti, A.; Bibby, M. A new finite element model for welding heat sources. Metall. Mater. Trans. B 1984, 15, 299–305. [Google Scholar]
  30. Jeong, S.K.; Cho, H.S. An analytical solution to predict the transient temperature distribution in fillet arc welds. Weld. J. 1997, 76, 223s–232s. [Google Scholar]
  31. Nguyen, N.T.; Matsuoka, K.; Suzuki, N.; Maeda, Y. Analytical solutions for transient temperature of semi-infinite body subjected to 3-D moving heat sources. Weld. J. 1999, 78, 265s–274s. [Google Scholar]
  32. Gu, Y.; Li, Y.D.; Yong, Y.; Xu, F.L.; Su, L.F. Determination of parameters of double-ellipsoidal heat source model based on optimization method. Weld. World 2009. [Google Scholar] [CrossRef]
  33. Wu, C.S.; Hu, Q.X.; Gao, J.Q. An adaptive heat source model for finite-element analysis of keyhole plasma arc welding. Comput. Mater. Sci. 2009, 46, 167–172. [Google Scholar] [CrossRef]
  34. Jia, X.; Xu, J.; Liu, Z.; Huang, S.; Fan, Y.; Sun, Z. A new method to estimate heat source parameters in gas metal arc welding simulation process. Fusion Eng. Des. 2014, 89, 40–48. [Google Scholar] [CrossRef]
  35. Mikami, Y.; Nakamura, T.; Mochizuki, M. Numerical investigation of the influence of heat source modeling on simulated residual stress distribution in weaving welds. Weld. World 2016, 60, 41–49. [Google Scholar] [CrossRef]
  36. Flint, T.F.; Francis, J.A.; Smith, M.C.; Balakrishnan, J. Extension of the double-ellipsoidal heat source model to narrow-groove and keyhole weld configurations. J. Mater. Process. Technol. 2017, 246, 123–135. [Google Scholar] [CrossRef]
  37. Nasiri, M.; Enzinger, N. An analytical solution for temperature distribution in fillet arc welding based on an adaptive function. Weld. World 2018, 1–11. [Google Scholar] [CrossRef]
  38. Lv, C.; Wang, G.; Chen, H.; Wan, S. Estimation of the moving heat source intensity using the multiple model adaptive inverse method. Int. J. Therm. Sci. 2019, 138, 576–585. [Google Scholar] [CrossRef]
  39. Jeong, S.K.; Cho, H.S. An analytical solution for transient temperature distribution in fillet arc welding including the effect of molten metal. Proc. Inst. Mech. Eng. 1997, 211, 63–72. [Google Scholar] [CrossRef]
  40. Kang, S.H.; Cho, H.S. Analytical solution for transient temperature distribution in gas tungsten arc welding with consideration of filler wire. Proc. Inst. Mech. Eng. 1999, 213, 799–811. [Google Scholar] [CrossRef]
  41. PN-EN ISO 636:2016-02, Welding Consumables—Rods, Wires and Weld Metal for Welding with a Tungsten Electrode in the Inert Gas of Unalloyed Steels and Fine-Grained—Classification; Polish Committee for Standarization: Warszawa, Poland, 2016.
  42. Winczek, J. New approach to modeling of temperature field in surfaced steel elements. Int. J. Heat Mass Transf. 2011, 54, 4702–4709. [Google Scholar] [CrossRef]
  43. Winczek, J. Analytical solution to transient temperature field in a half-infinite body caused by moving volumetric heat source. Int. J. Heat Mass Transf. 2010, 53, 5774–5781. [Google Scholar] [CrossRef]
  44. Vishnu, P.R.; Li, W.B.; Easterling, K.E. Heat-flow model for pulsed welding. Mater. Sci. Technol. 1991, 7, 649–659. [Google Scholar] [CrossRef]
  45. Modenesi, P.J.; Reis, R.I. A model for melting rate phenomena in GMA welding. J. Mater. Process. Technol. 2007, 189, 199–205. [Google Scholar] [CrossRef]
  46. Avrami, M. Kinetics of phase change. I. General theory. J. Chem. Phys. 1939, 7, 1103–1112. [Google Scholar] [CrossRef]
  47. Piekarska, W.; Kubiak, M.; Saternus, Z. Numerical simulation of thermal phenomena and phase transformations in laser-arc hybrid welded joints. Arch. Metall. Mater. 2011, 56, 409–421. [Google Scholar] [CrossRef]
  48. Piekarska, W.; Goszczyńska, D.; Saternus, Z. Application of analytical methods for predicting the structures of steel phase transformations in welded joints. J. Appl. Math. Comput. Mech. 2015, 14, 61–72. [Google Scholar] [CrossRef]
  49. Winczek, J.; Makles, K.; Gucwa, M.; Gnatowska, R.; Hatala, M. Modelling of strains during SAW surfacing taking into heat of the weld in temperature field description and phase transformations. IOP Conf. Ser. Mater. Sci. Eng. 2017, 225, 012038. [Google Scholar] [CrossRef]
  50. Domański, T.; Bokota, A. Numerical models of hardening phenomena of tools steel base on the TTT and CCT diagrams. Arch. Metal. Mater. 2011, 56, 325–344. [Google Scholar] [CrossRef]
  51. Piekarska, W.; Kubiak, M. Theoretical investigation into heat transfer in laser-welded steel sheets. J. Therm. Anal. Calorim. 2012, 10, 159–166. [Google Scholar] [CrossRef]
  52. Elmer, J.W.; Palmer, T.A.; Zhang, W.; Wood, B.; DebRoy, T. Kinetic modeling of phase transformations occurring in the HAZ of C-Mn welds based on direct observations. Acta Mater. 2003, 51, 3333–3349. [Google Scholar] [CrossRef]
  53. Brózda, J.; Pilarczyk, J.; Zeman, M. TTT-Welding Diagrams Transformation of Austenite, 1st ed.; Śląsk: Katowice, Poland, 1983; pp. 32–33. [Google Scholar]
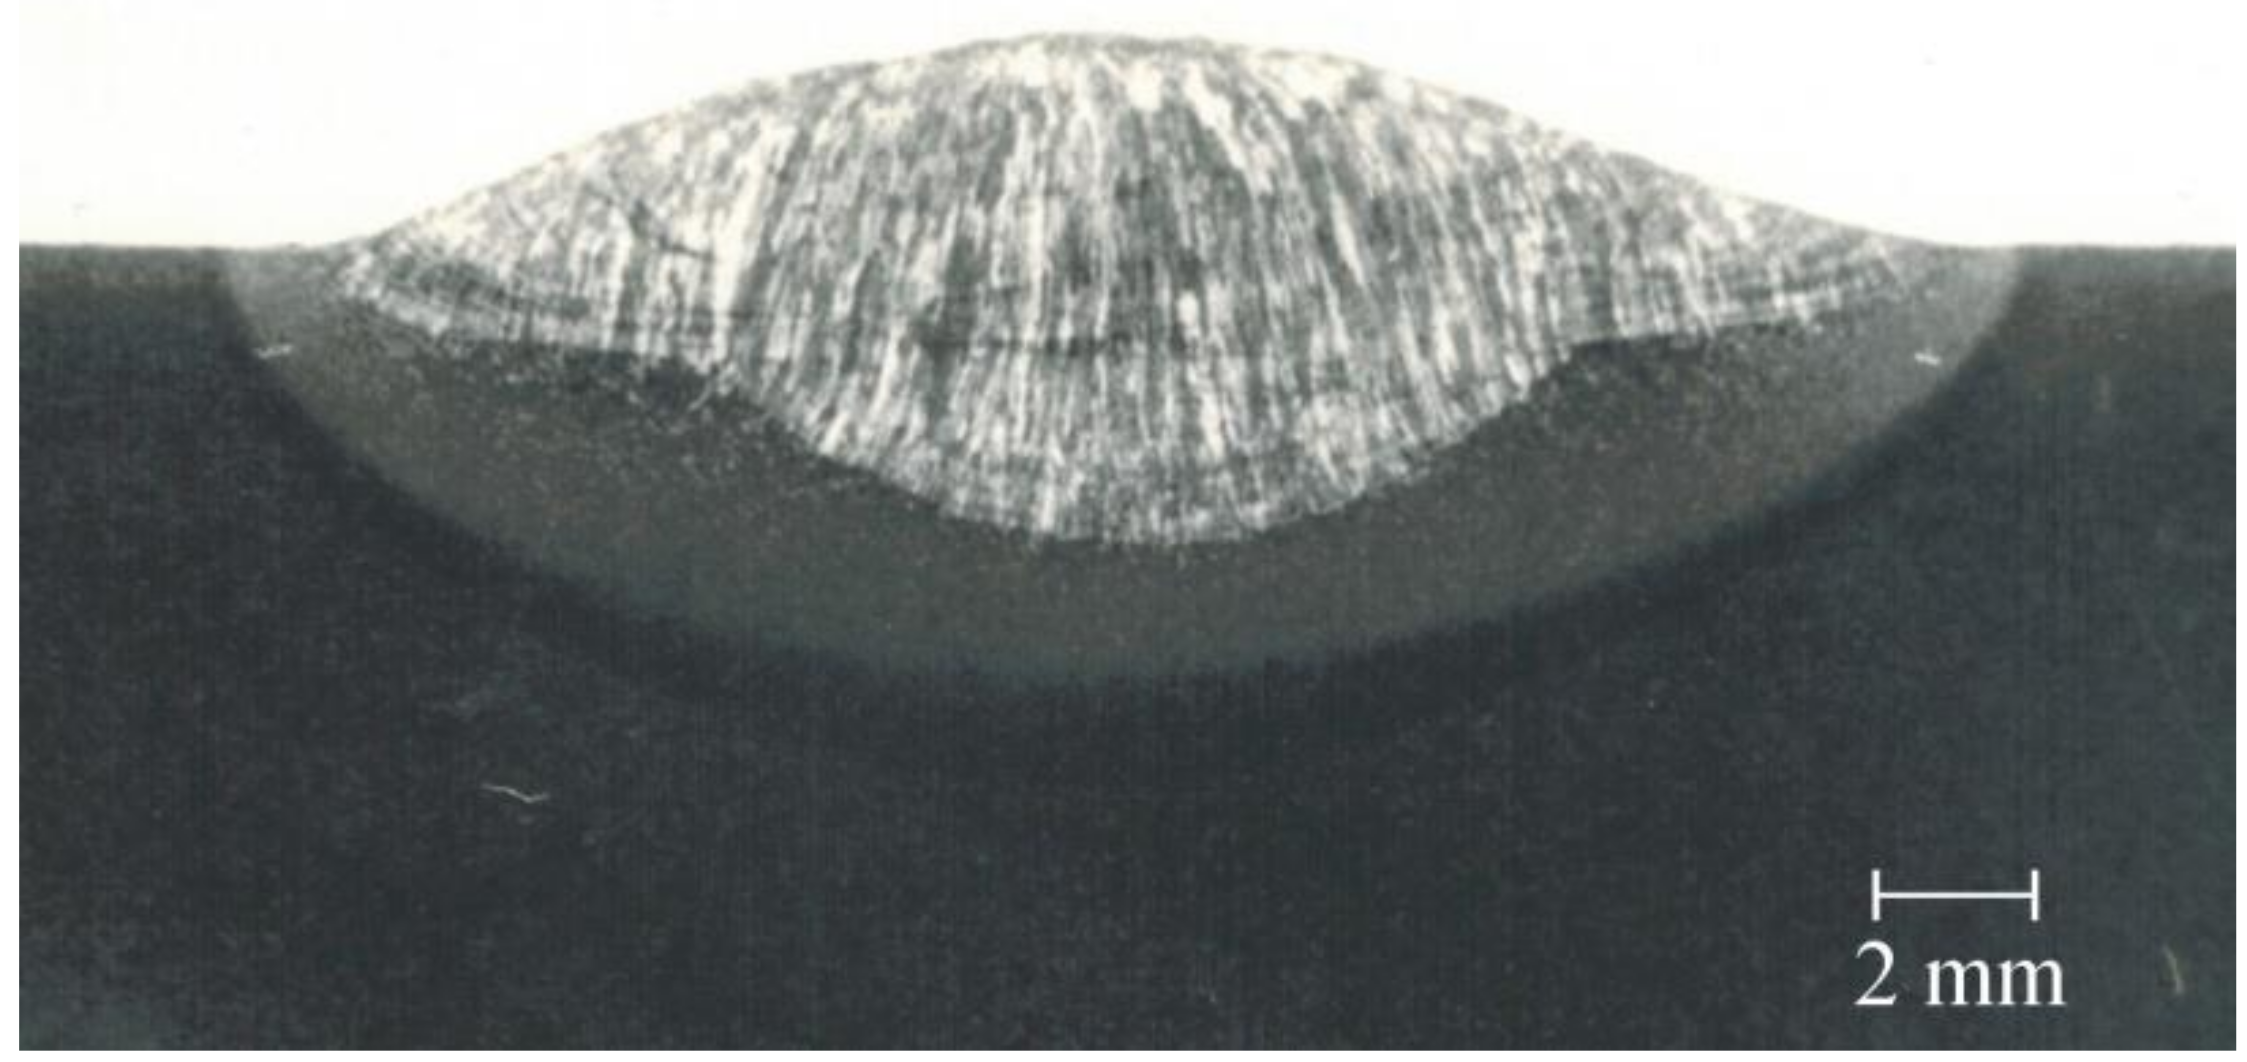
Figure 1. Metallographic specimen in the middle cross section.
Applsci 09 01472 g001
Figure 2. Padding weld geometry.
Applsci 09 01472 g002
Figure 3. Gaussian model of heat distribution.
Applsci 09 01472 g003
Figure 4. Scheme of single-pass arc overlaying.
Applsci 09 01472 g004
Figure 5. Diagram of supercooled austenite transformations.
Applsci 09 01472 g005
Figure 6. Maximum temperature field (°C).
Applsci 09 01472 g006
Figure 7. Cross section with determined heat affected zone.
Applsci 09 01472 g007
Figure 8. Time-temperature-transformation (TTT) diagram of S355 steel.
Applsci 09 01472 g008
Figure 9. Distribution of bainite share in padded weld.
Applsci 09 01472 g009
Figure 10. Distribution of pearlite share in padded weld.
Applsci 09 01472 g010
Figure 11. Distribution of ferrite share in padded weld.
Applsci 09 01472 g011
Figure 12. Thermal history at point 1: T—temperature; A, B, F, P—volume fractions of austenite, bainite, ferrite and pearlite, respectively.
Applsci 09 01472 g012
Figure 13. Thermal history at point 2: T—temperature; A, B, F, P—volume fractions of austenite, bainite, ferrite and pearlite, respectively.
Applsci 09 01472 g013
Figure 14. Thermal history at point 3: T—temperature; A, B, F, P—volume fractions of austenite, bainite, ferrite and pearlite, respectively.
Applsci 09 01472 g014
Figure 15. Thermal history at point 4: T—temperature; F, P—volume fractions of ferrite and pearlite.
Applsci 09 01472 g015
Figure 16. Metallographic specimen with comparison of calculation and experiment results.
Applsci 09 01472 g016
Figure 17. Field of calculated cooling velocity vectors in padded weld area.
Applsci 09 01472 g017
Figure 18. Dendritic structure of weld, etch. Nital.
Applsci 09 01472 g018
Figure 19. Widmanstätten structure on fusion zone board, etch. Nital.
Applsci 09 01472 g019
Figure 20. Fine-grained structure of HAZ, etch. Nital.
Applsci 09 01472 g020
Figure 21. Ferritic-pearlitic structure of native material, etch. Nital.
Applsci 09 01472 g021
Table 1. Share of chemical elements (wt%) in S355J2G3 steel.
Chemical Component Share (wt%)
CMnSiPSAlCrNiMoVNb
0.181.420.400.0180.0320.050-----