Article

Flexural Characteristics Evaluation for Reinforced Concrete Affected by Steel Corrosion Based on an Acoustic Emission Technique

College of Transportation, Jilin University, Changchun, Jilin 130025, China
*
Authors to whom correspondence should be addressed.
Appl. Sci. 2019, 9(8), 1640; https://doi.org/10.3390/app9081640
Submission received: 20 March 2019 / Revised: 12 April 2019 / Accepted: 17 April 2019 / Published: 19 April 2019
(This article belongs to the Section Civil Engineering)

Abstract

:
The purpose of this research is to utilize a more advanced test method for investigating the effect of steel corrosion on the flexural characteristics of a reinforced concrete (RC) beam on a microscopic cracking level. Firstly, over-reinforced RC beam specimens were prepared and corroded using an electrical accelerated steel corrosion setup in different ratios. Subsequently, bending and acoustic emission (AE) tests were performed on all the specimens to obtain their ultimate flexural loads, failure modes and AE signals. Furthermore, rise time/peak amplitude (R/A), ringing counts/duration (AF) and improved b (Ib) values, as the statistical parameters of AE signals, were calculated for indicating the transformation of RC specimens’ crack modes and failure modes under the effect of steel corrosion. Finally, the locations of AE events were obtained by localization technology and compared with the locations of concrete cracks (cracks map). The results revealed that the ultimate flexural load decreases with steel corrosion. The crack tends to transform from shear- to tensile-type along with the increase of the steel corrosion ratio. The trend of the Ib-value curve can reflect the formation and development of cracks; and the larger the duration of violent fluctuations in the Ib-value curve is, the larger the ultimate flexural load of the RC beam is. The region where the crack is located can be judged by the position where the relatively dense distribution of the AE events is.

1. Introduction

Reinforced concrete (RC) is widely used in construction materials for bridge structures owing to its relatively low price and good durability [1]. In practice, the high pH pore solution in concrete protects the steel bar embedded in concrete against corrosion [2]. However, when exposed to aggressive environments, concrete structures often suffer from carbonation [3], chloride penetration [4] and freeze-thaw cycles [5], which cause a loss of the alkalinity of the pore solution in the concrete cover and steel corrosion. The rust caused by steel corrosion increases the volume of the steel bars, which exerts an expansion force on the surrounding concrete. Thus, the concrete cover gradually cracks, leading to a high water and chloride diffusion coefficient of concrete, which benefits the rate of steel corrosion. With the lapse of service time, the steel bar’s cross-sectional area and yielding strength, as well as ultimate strength, will reduce. Simultaneously, the bond force between the steel bar and concrete, as well as the strength of the cracked concrete around the corroded steel bar will reduce, resulting in the deterioration of the flexural strength of the RC bridges. Therefore, it is necessary to investigate the flexural characteristics of RC under the effect of steel corrosion.
From now on, a large number of theoretical and experimental studies have been performed, focusing on the flexural characteristics of corroded RC materials. Dekoster et al. [6] established a model of the flexural behavior of RC beams subjected to localized and uniform corrosion based on the finite element method. Sun et al. [7] studied the performance of corroded rebars and RC under repeated loading; they concluded that from corroded rebars’ stress–strain curves, the yield strength reduced, the elongation decreased, and the features of the yield plateau changed. Ye et al. [8] presented an experimental study focus on the shear behavior degradation mechanism of corroded RC beams; they found the failure of RC beams occurs in shear mode instead of bending mode as the corrosion ratio of stirrups increases. Lv et al. [9] studied the deterioration performance of RC beams under the effect of an acid-salt mist and carbon-dioxide-induced steel corrosion; they claimed that the bond force between the corroded steel bar and cracked concrete decreased under the effect of an acid-salt mist. Li et al. [10] reported that the steel corrosion might cause the brittle failure of RC beams, and steel corrosion significantly reduces the ultimate loading capacity and deformation ability of RC beams. Furthermore, some scholars have considered adding fibers (including steel fibers, polypropylene fibers, etc.) into concrete in order to increase the performances of a corroded RC beam [11,12,13]. They claimed the flexural and shear capacity of fiber-reinforced concrete beams increased considerably. In summary, experimental and analytical methods applied by most of the literature discussed above included describing the failure mode and the types of cracks from a macroscopic point of view or describing the stress–strain curve of corroded RC beams. These methods belong to the category of mechanics and morphology, which cannot determine the crack propagation stage inside the RC structures; and, to date, these methods are not novel enough. Little research has been conducted to evaluate the effect of steel corrosion on flexural behaviors of a corroded RC beam on a microscopic cracking level.
Nowadays, acoustic emission (AE) technology, as a non-destructive test method, is developing rapidly. AE represents the released strain energy caused by the formation of cracks or internal friction, and it is a passive phenomenon associated with a damaging process [14,15]. Therefore, AE shows an effective way for scholars to study the failure process of concrete materials. Based on AE theory, Suzuki et al. [16] quantitatively evaluated the damage in concrete piers, and they concluded that AE behavior of the concrete under compression is dependent on the degree of damage. Raghu Prasad and Sagar [17] analyzed the relationship between the AE energy and concrete cracking energy of concrete, and they claimed both the AE and concrete cracking energy is increased with the increase of the concrete dimensions. Geng et al. [18] claimed that the sharply increased accumulated AE energy and the ringing counts could qualitatively predict the damage to the concrete. Li et al. [19] analyzed the AE behaviors of steel-fiber-reinforced concrete by the four-point bending test; and they describe the fracture process and fracture mode by the parameters with respect to AE events, including the average frequency and total events number and so on. Bhosale et al. [20] evaluated the fracture behavior of synthetic-fiber-reinforced concrete, steel-fiber-reinforced concrete, and hybrid-fiber-reinforced concrete under flexural loading utilizing the AE technique; and the AE parameters, such as hits and AE energy, were presented for illustrating the role of different fiber dosages on the fracture response. Furthermore, AE technology can also be applied to model the relationship between the damage and AE parameters by analyzing the AE characteristics caused by the mutual friction between rebar and concrete [21]. In summary, AE parameters can reflect the characteristics of concrete at different loading [22]; and there is a strong correlation between concrete AE activity and internal defect of concrete [23,24]. Thus, AE characteristic parameters can be used to monitor the cracking and failure process of RC concrete on a microscopic cracking level. However, few studies focus on the mechanical properties and the cracking process of an RC beam affected by steel corrosion on a microscopic cracking level by AE technology; this topic should be analyzed through experimental and advanced analytical methods in sufficient detail.
In this paper, a bending test and AE technology were utilized simultaneously. The parameters, including ultimate flexural loads and failure modes, as well as rise time/peak amplitude (R/A), ringing counts/duration (AF), and improved b (Ib) values (statistical parameters calculated from AE signals) were obtained for indicating the transformation of corroded RC beams’ crack modes, as well as failure modes, under the effect of steel corrosion, and further investigating the effect of steel corrosion on the flexural characteristics of the RC beam on a microscopic cracking level.

2. Materials and Experiments

2.1. Materials and Mixture

HRB335 (tensile strength is 300 MPa) steel bars with a diameter of 8 mm were cut into 420 mm long. The average line density (mass per meter) of all the steel bars needed to be tested, and the test method will be described below. According to GB 50164-2011 [25], Portland cement (PO 42.5 type), crushed stone (diameters from 2.36 mm to 20.0 mm), and natural sand (fineness modulus was tested to be 2.7) were utilized in this study. The mixture proportions of concrete are listed in Table 1.

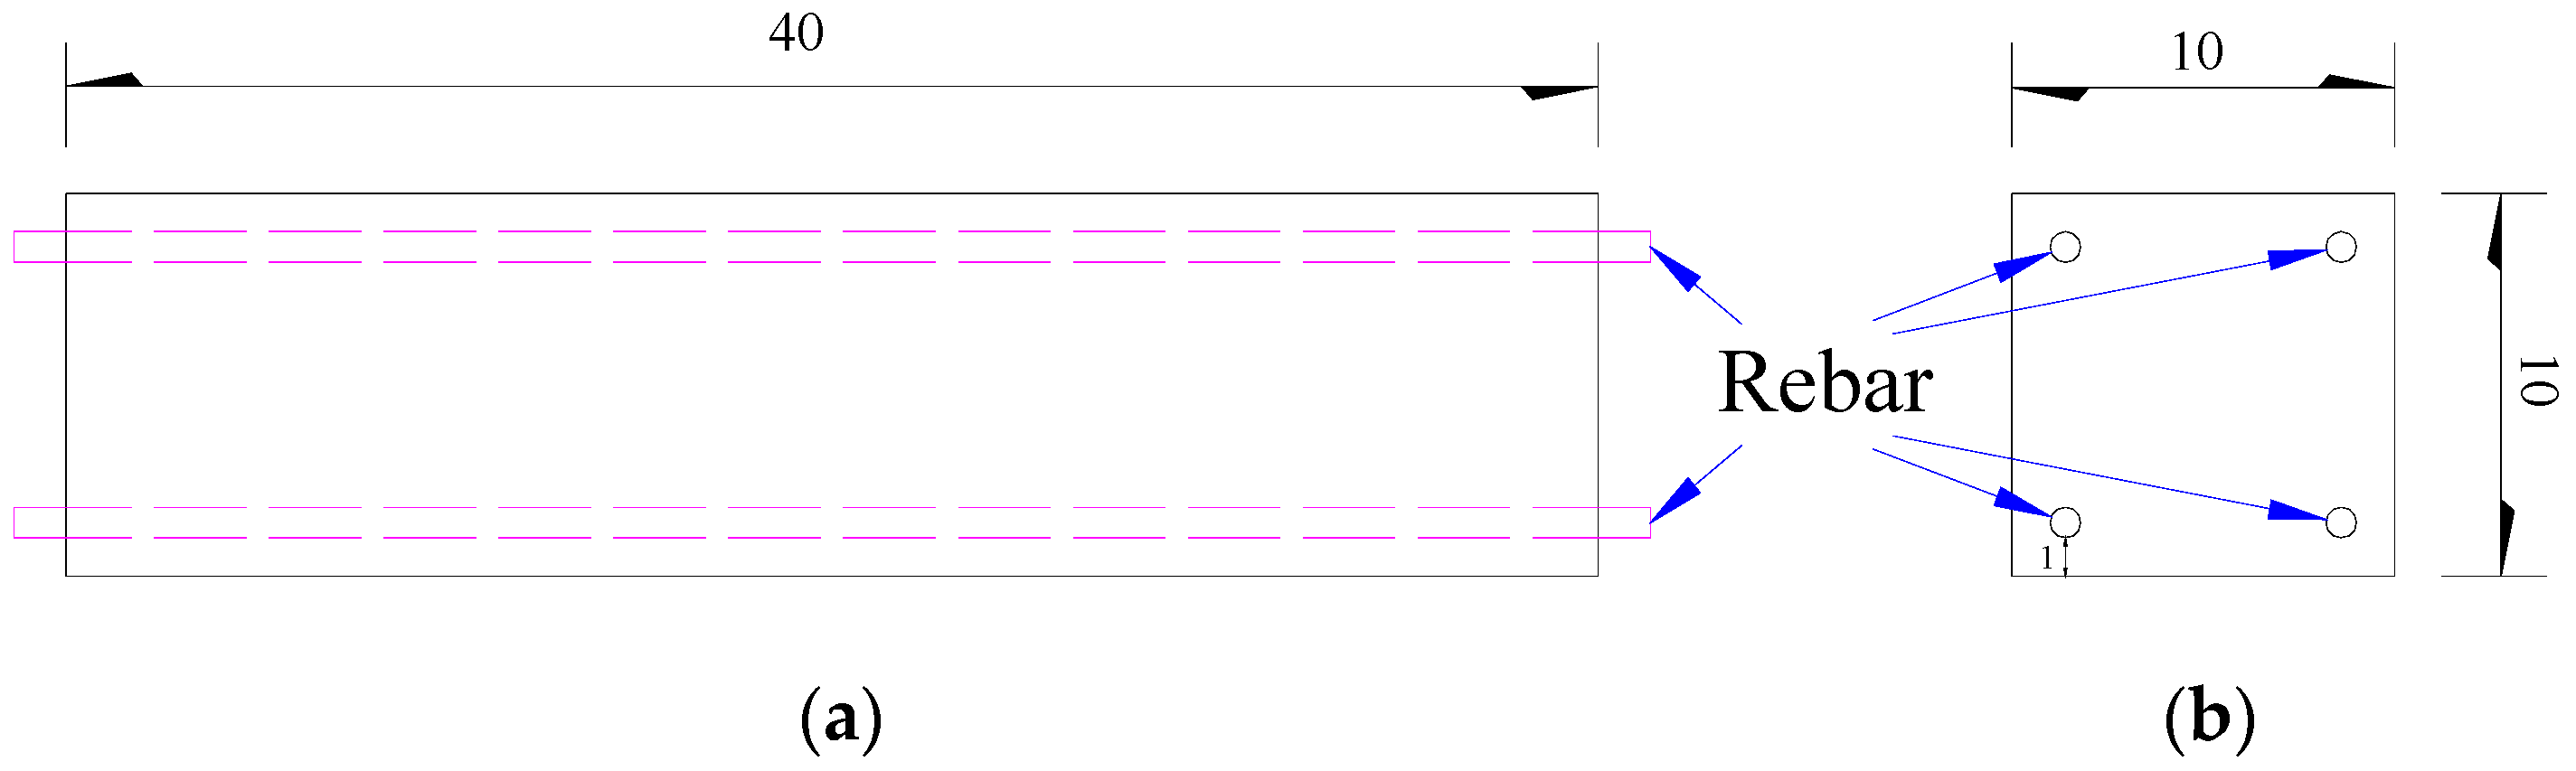
2.2. Specimen Preparation

According to the national standard [26], engineers should avoid designing an over-reinforced RC structure. However, the over-reinforced RC structures are permitted to be designed for more safety within the allowable range of loading. For this, an absolute balanced-reinforced RC bridge does not exist in reality, and many flexural building components are designed to be over-reinforced for more safety. Thus, to investigate the influence of steel corrosion on the flexural characteristics of reinforced concrete, over-reinforced beam specimens were required in this study. The effective diameter and tensile strength of the steel bar will decrease with an increased degree of steel corrosion, and the over-reinforced beam will degenerate into a balanced-reinforced or rare-reinforced beam. These three types of beams have different failure modes which are easier to observe macroscopically. A sketch of the test specimen is shown in Figure 1.
In order to ensure the quality of all RC specimens are the same, and to reduce experimental error, beam specimens should be poured in one batch. Therefore, beams of 40 cm × 10 cm × 10 cm were cast in a five-in-one wooden mold and compacted by the vibrating table. Then, they were allowed to cure for 28 days under the conditions of 20 °C and 95% relative humidity for further experiments.

2.3. Experimental Methods

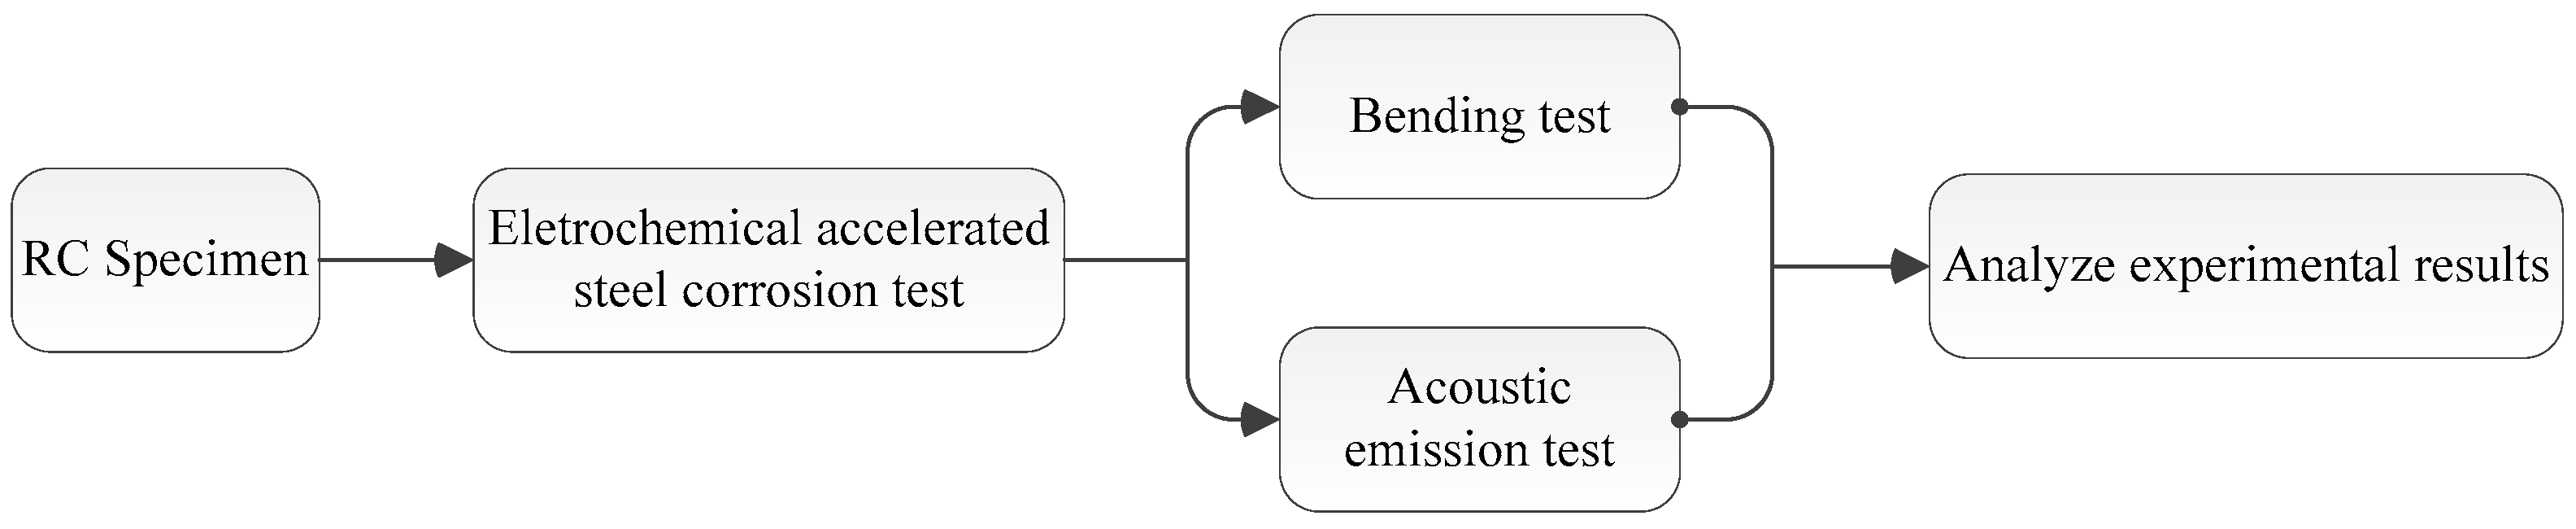
2.3.1. Scheme Design

Five RC beam specimens were required in this study to investigate the influence of steel corrosion on its flexural characteristic. The experimental procedure is shown in Figure 2. Firstly, the total amount of five specimens performed an electrochemical accelerated steel corrosion test with the intention of having one uncorroded specimen and four specimens with corrosion ratios of 10%, 20%, 30% and 40% of the mass loss. Secondly, bending tests should be performed on all the specimens to obtain the ultimate flexural load. During loading, concurrently, an AE test should be conducted for obtaining the AE parameters and analyzing the flexural characteristic of the corroded RC beams.

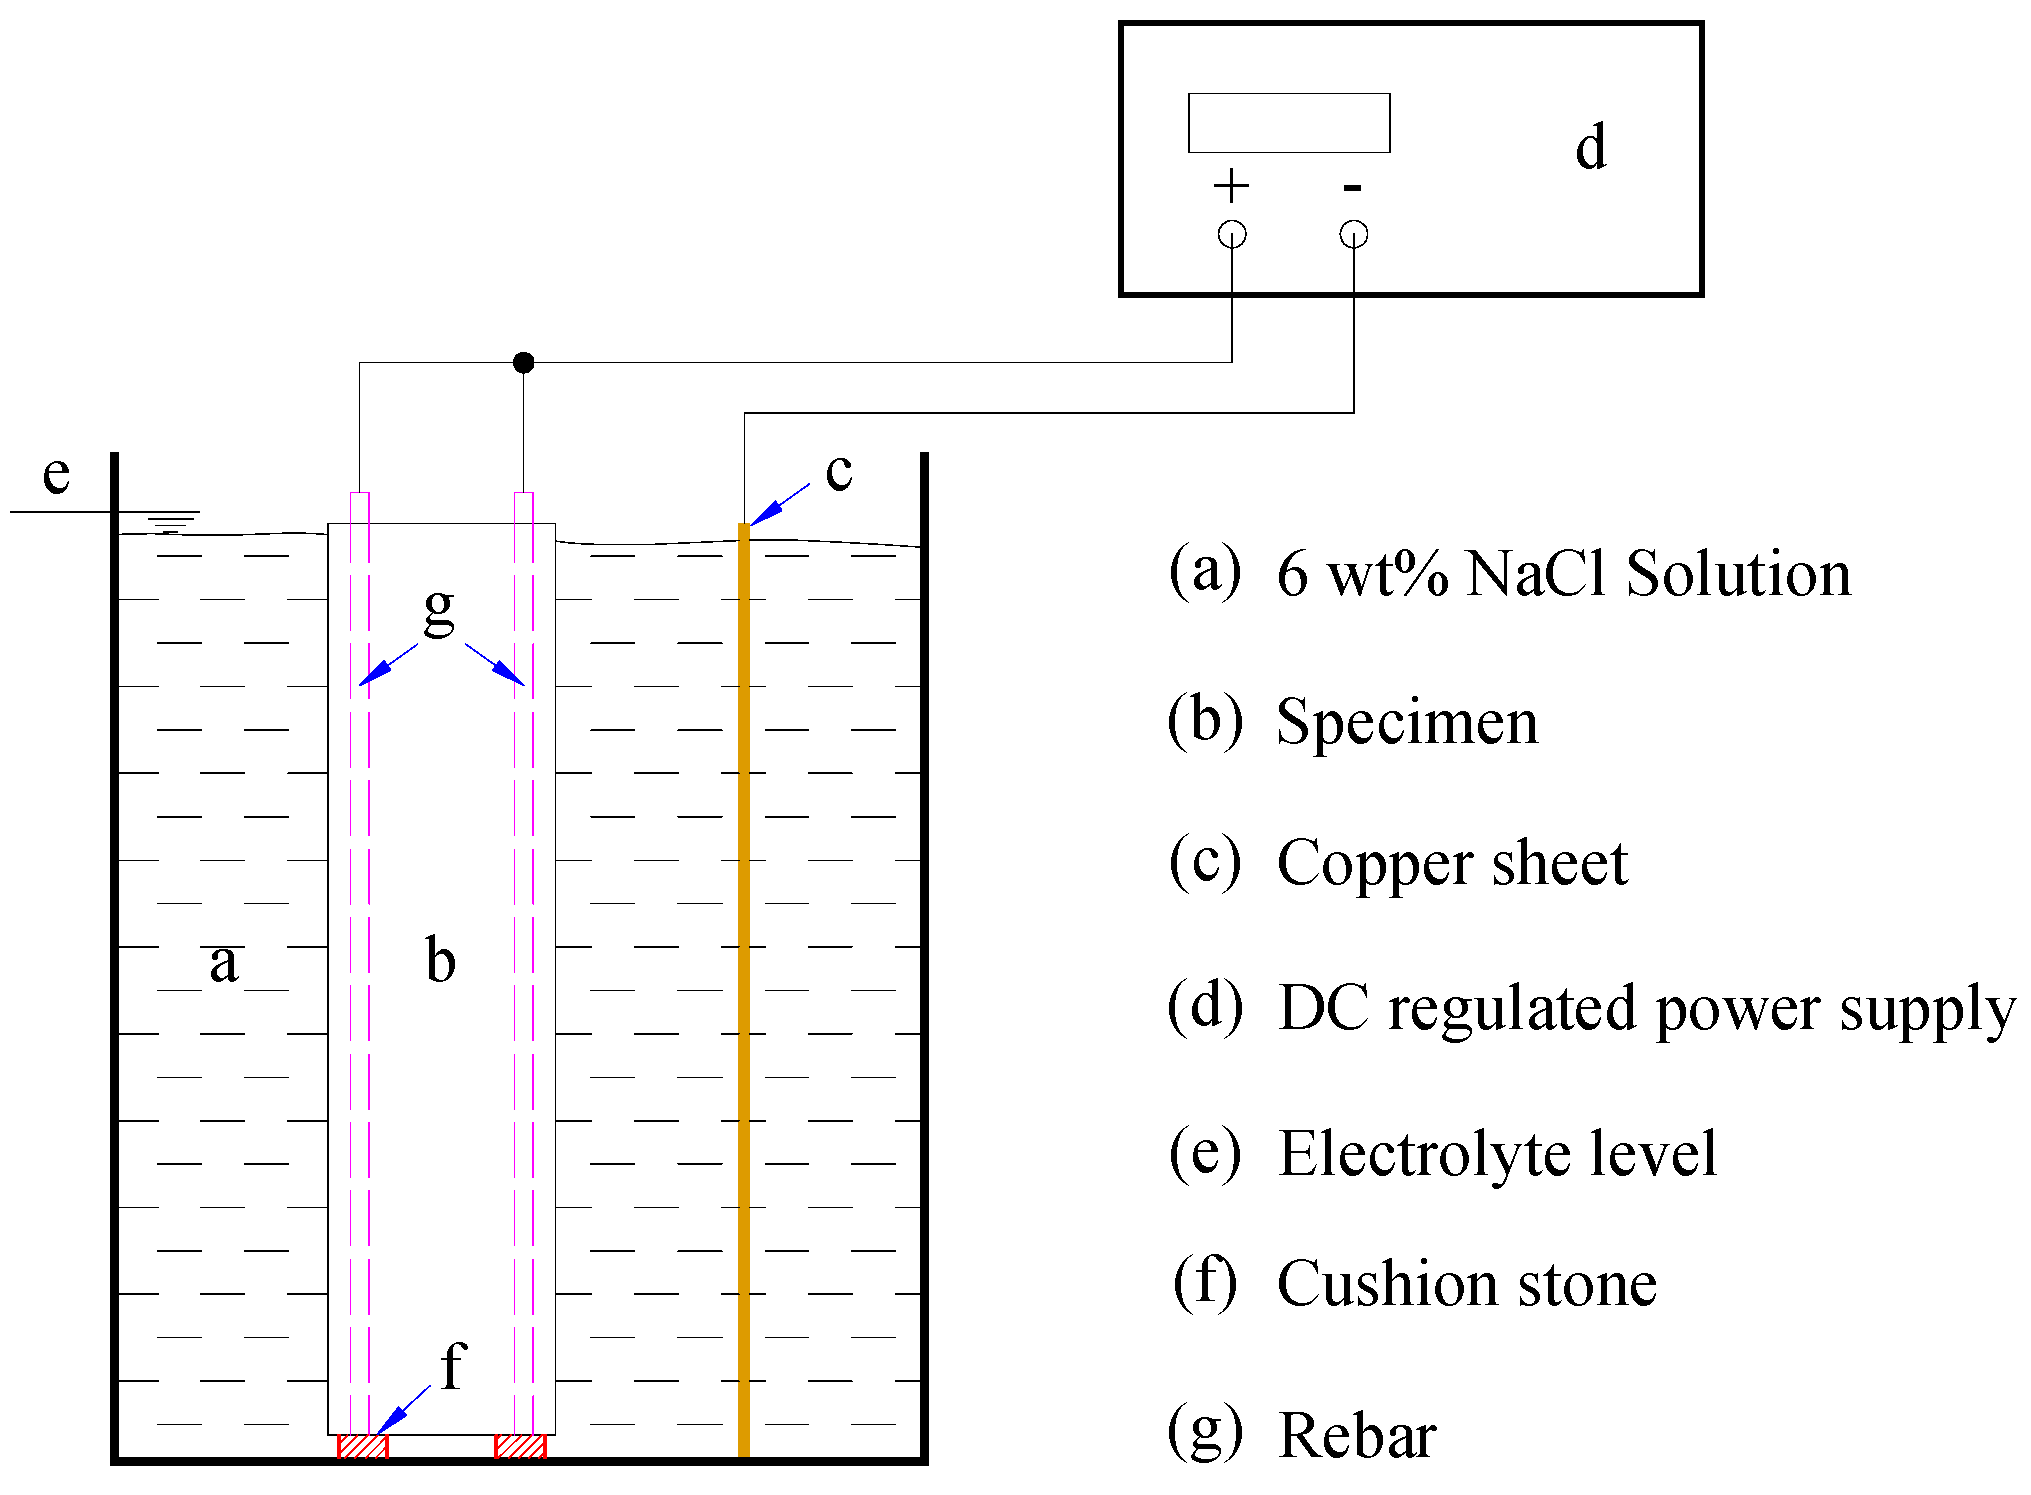
2.3.2. Electrical Accelerated Steel Corrosion
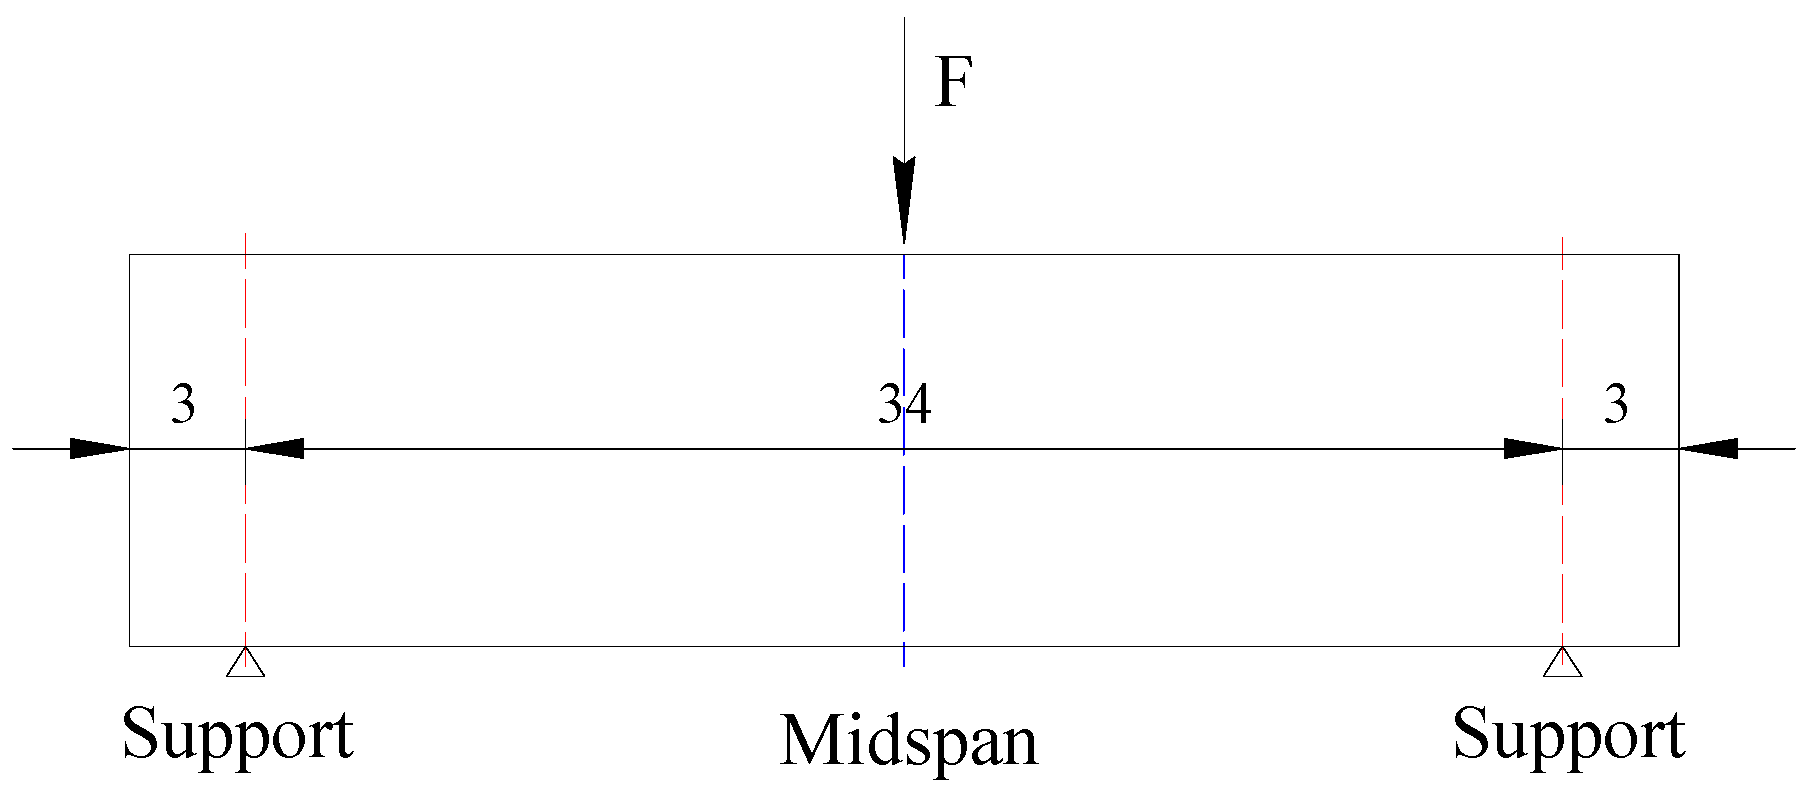
Firstly, before RC specimen preparation, rust on the surface of steel bars should be removed; then all the steel bars should be cleaned with deionized water and dried in the drying device at 20 °C for 4 h. After that, the mass (msi) and length (lsi) of each steel bar were tested using a sensitive balance and vernier caliper to obtain the average line density (ρs) of all the steel bars. ρs can be calculated by the following equation, and the value was tested to be 0.395 kg/m.
ρ s = 1 n i = 1 n m s i l s i
It takes a long time to obtain corroded beams due to the slow penetration process of chloride ions by immersing RC beams into chloride solution. Given that steel corrosion is an electrochemical process, electrochemical techniques can be used to accelerate steel corrosion [27]. The device for accelerating steel corrosion is displayed in Figure 3. Each specimen was placed into an electrolytic cell filled with 6 wt% NaCl solution. A 30 V direct current (DC) regulated power supply was used to provide impressed current. Each specimen should be vertically placed. In order to ensure the effective length of the corroded steel bar is 40 cm, the exposed part of the steel bar at the bottom of each specimen should be cut off. Additionally, the exposed parts of four steel bars at the top of the specimen were welded with copper wire and connected to the anode of DC regulated power supply in parallel mode, while the cathode was connected with a 15 cm × 40 cm copper sheet. During the accelerated corrosion test, NaCl solution should not exceed the top of the specimen and touch the steel bars.
Furthermore, in order to determine the theoretical current value and electrified duration, Faraday’s law can be used for calculating the theoretical mass loss of steel bars when subjected to the impressed current no matter what medium is surrounding this kind of metal [28,29]. The relationship between mass loss of steel bar, electrified duration and impressed current intensity is as follows:
Δ m = M I t z F
where Δm is the theoretical mass loss of the steel bar, in g; M is the atomic weight of the metal (56 g or 0.1232 lb for Fe); I is the impressed current intensity, in A; t is the electrified duration, in s; z is the ionic charge number of steel (2); F is Faraday’s constant (96,500 A/s).
In this study, the electrified duration for each steel bar to obtain a mass loss of 10% (corrosion ratio of steel bar equals 10%) was controlled at 24 h. Therefore, the applied current value for steel bars to reach the theoretical corrosion ratio can be calculated from Faraday’s law and is listed in Table 2.
It was ensured that the corrosion ratio of four steel bars embedded in one RC specimen was the same. Therefore, it can be calculated that the accelerated corrosion system needs to electrified 0, 24, 48, 72, and 96 h for RC beams to reach the target corrosion ratio (percentage of mass loss) of 0%, 10%, 20%, 30%, and 40%; and the current value applied in the DC regulated power supply for corroding each specimen is 2.52 A.

2.3.3. Bending Test

The specimen was supported on a WAW-300kN type electro-hydraulic servo universal testing machine to perform the three-point bending test. As shown in Figure 4, the distance between the two supports was set to 340 mm, and the loading rate was controlled to be 0.05 kN/s.

2.3.4. AE Test

An AE test should be performed at the same time as a bending test for obtaining AE signals and locations of AE events. Five SAEU2S-6 type AE sensors were attached to the side of specimens by epoxy resin adhesive and scotch tape. The arrangement of sensors is shown in Figure 5. Briefly, the adjacent three sensors were arranged in an isosceles triangle. The diameter of the sensor was measured as 2 cm. In Figure 5, treating the lower left corner of the specimen as the origin of coordinates, the coordinates of 1#~5# sensors were calculated as 1#(10.76 cm, 9 cm), 2#(20 cm, 9 cm), 3#(29.24 cm, 9 cm), 4#(15.38 cm, 1 cm), and 5#(24.62 cm, 1 cm), respectively. The experimental setups for the bending test and acoustic emission test are shown in Figure 6.

3. Results and Discussion

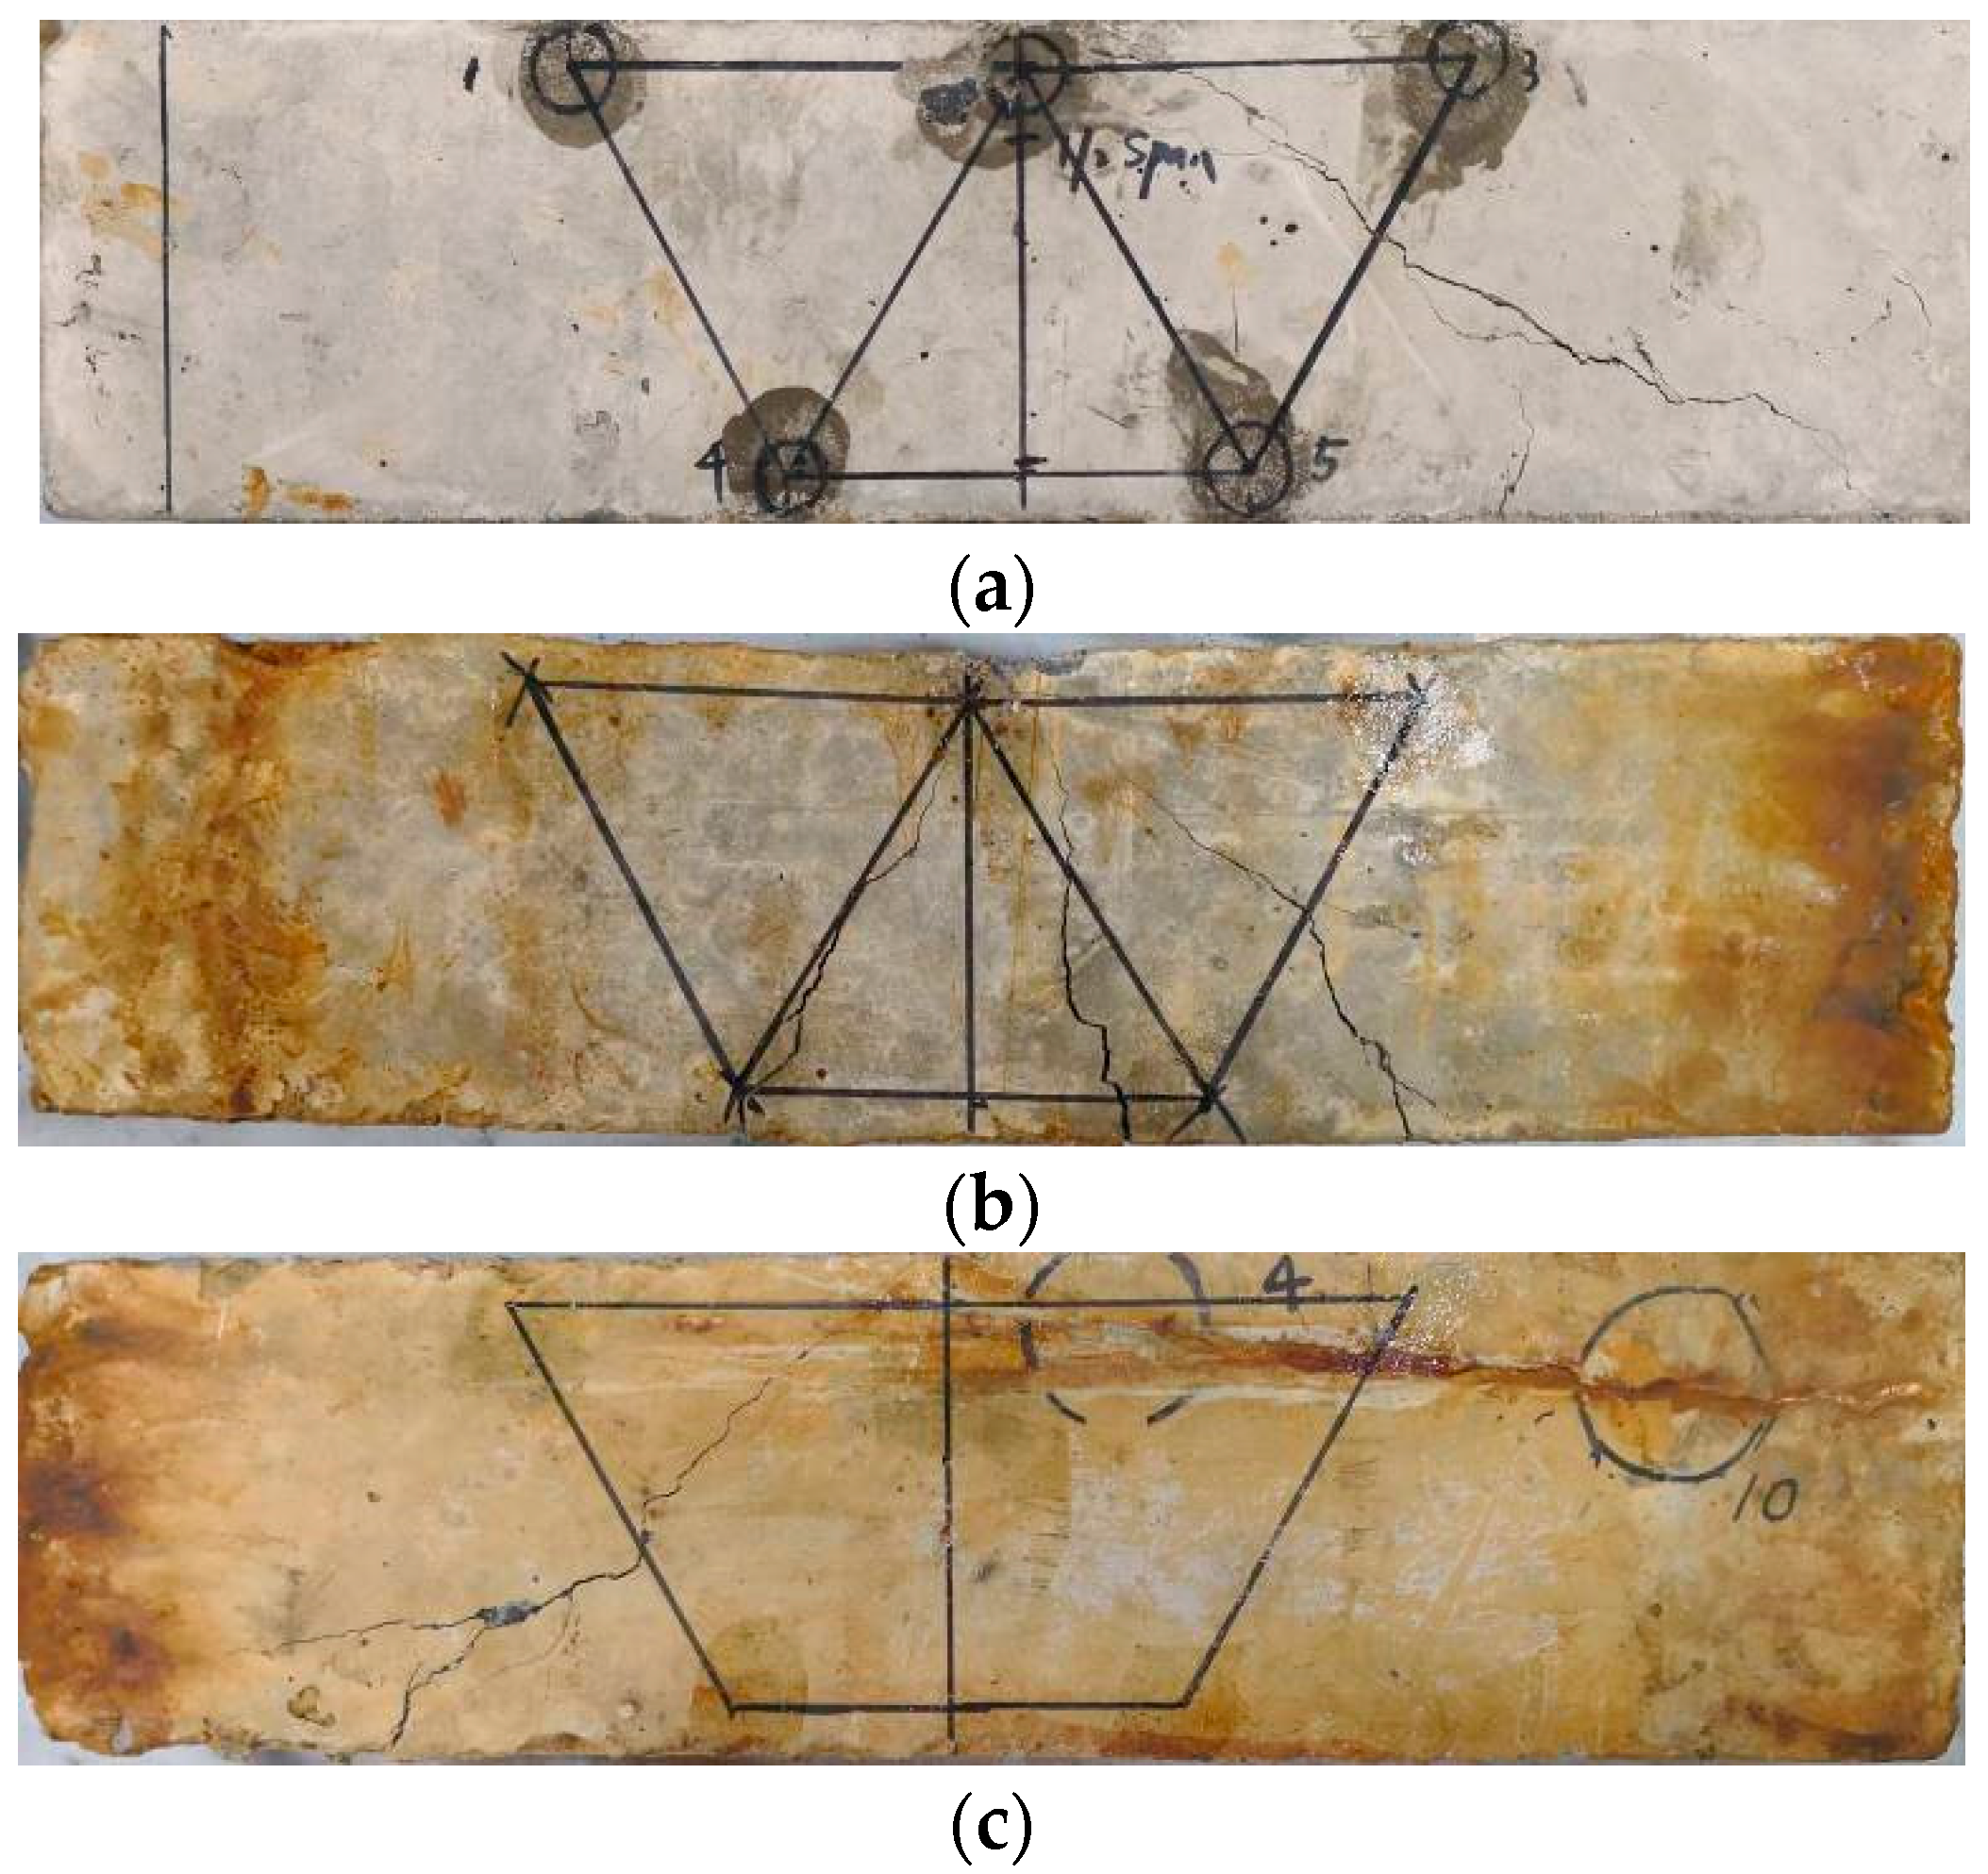
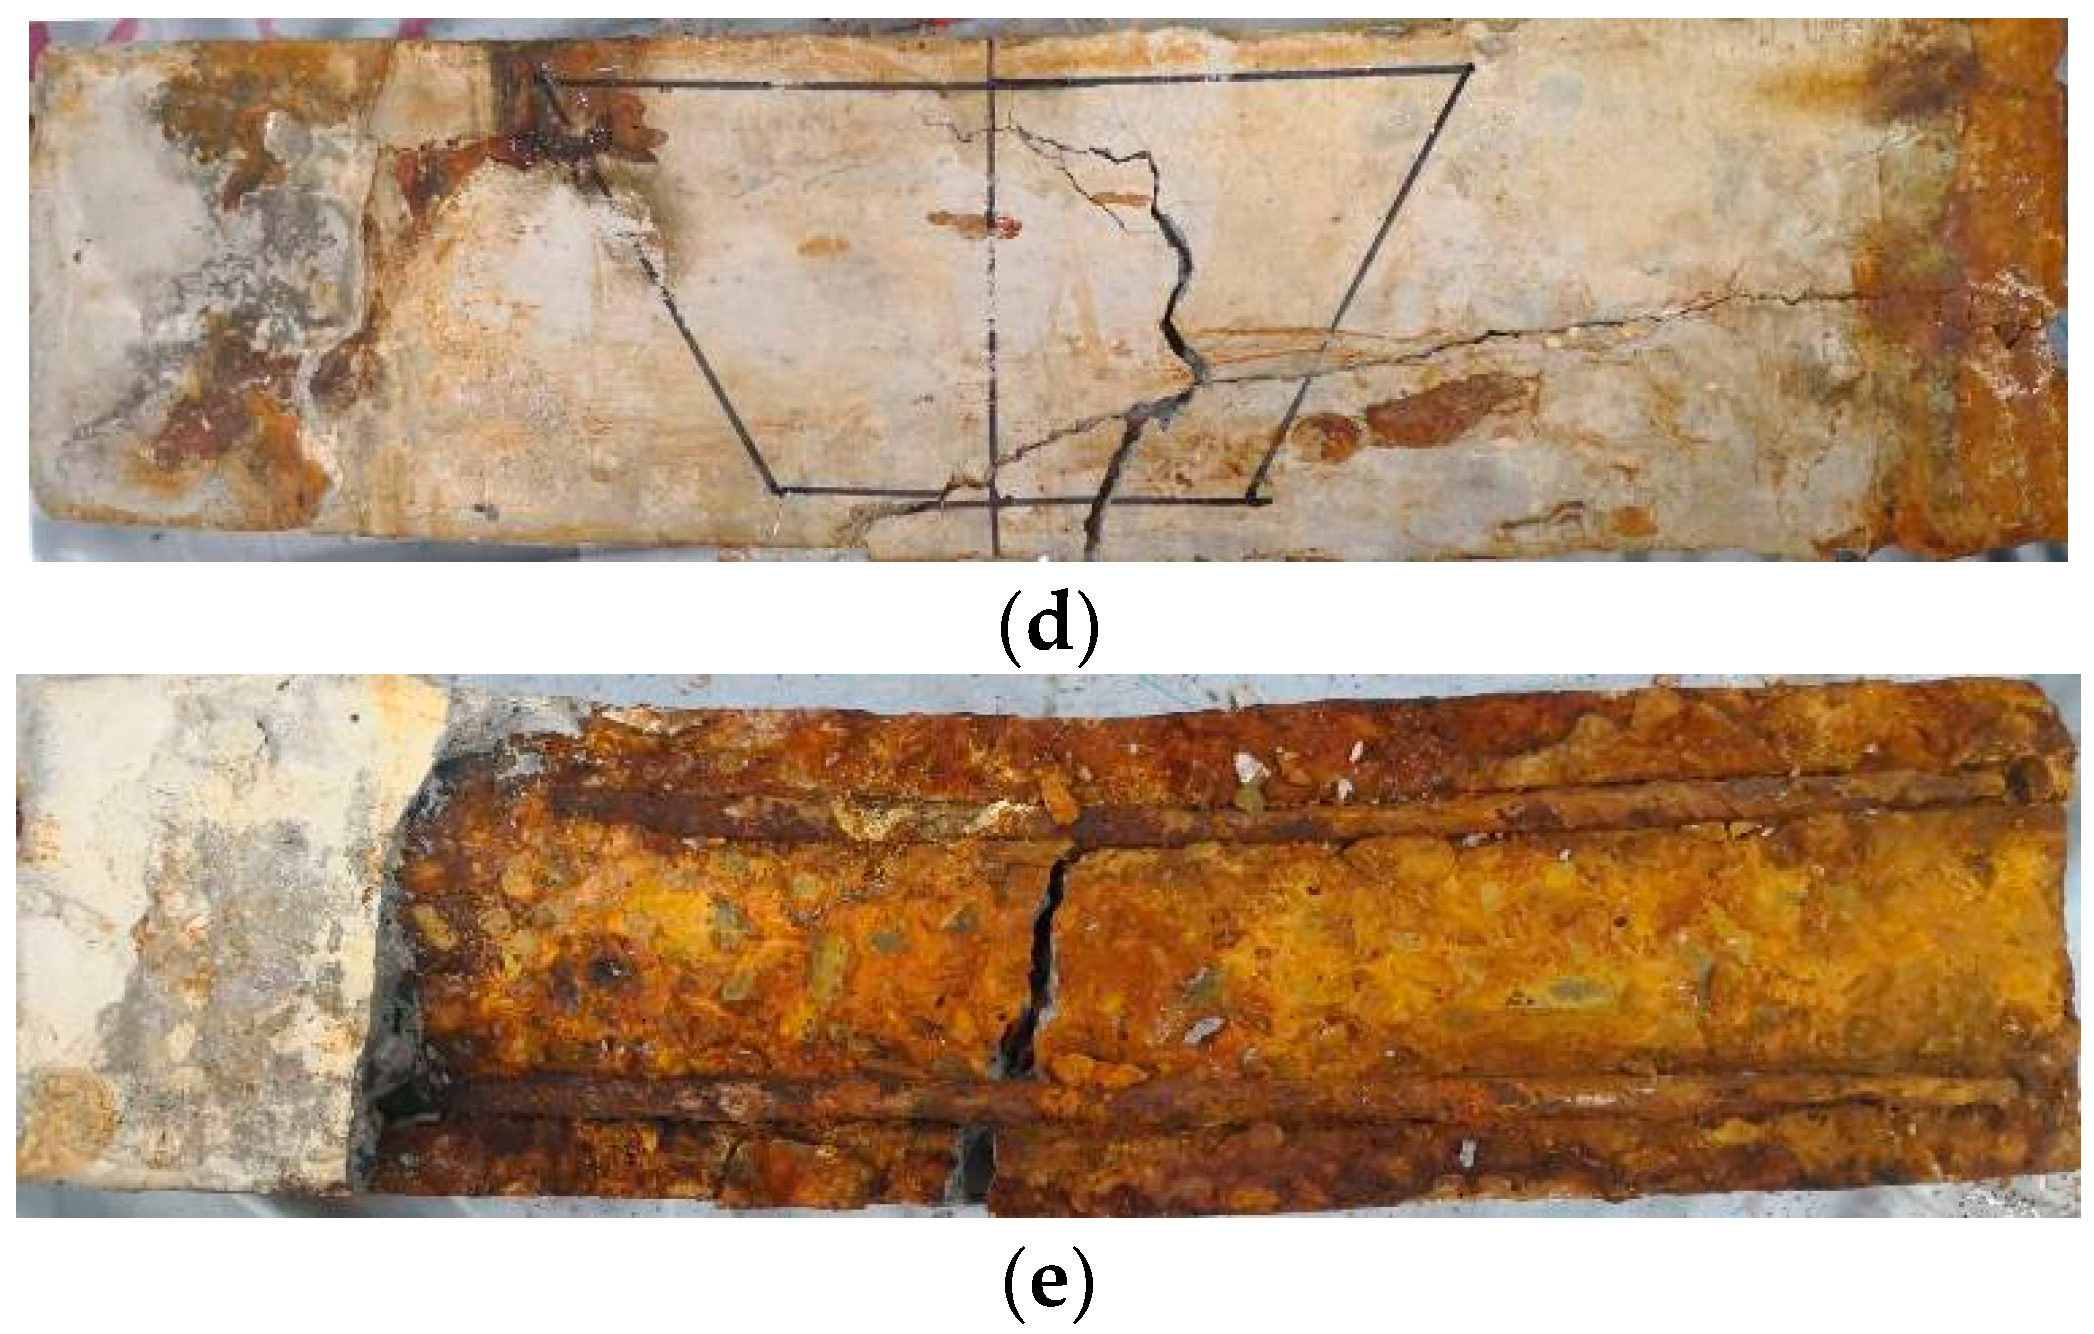
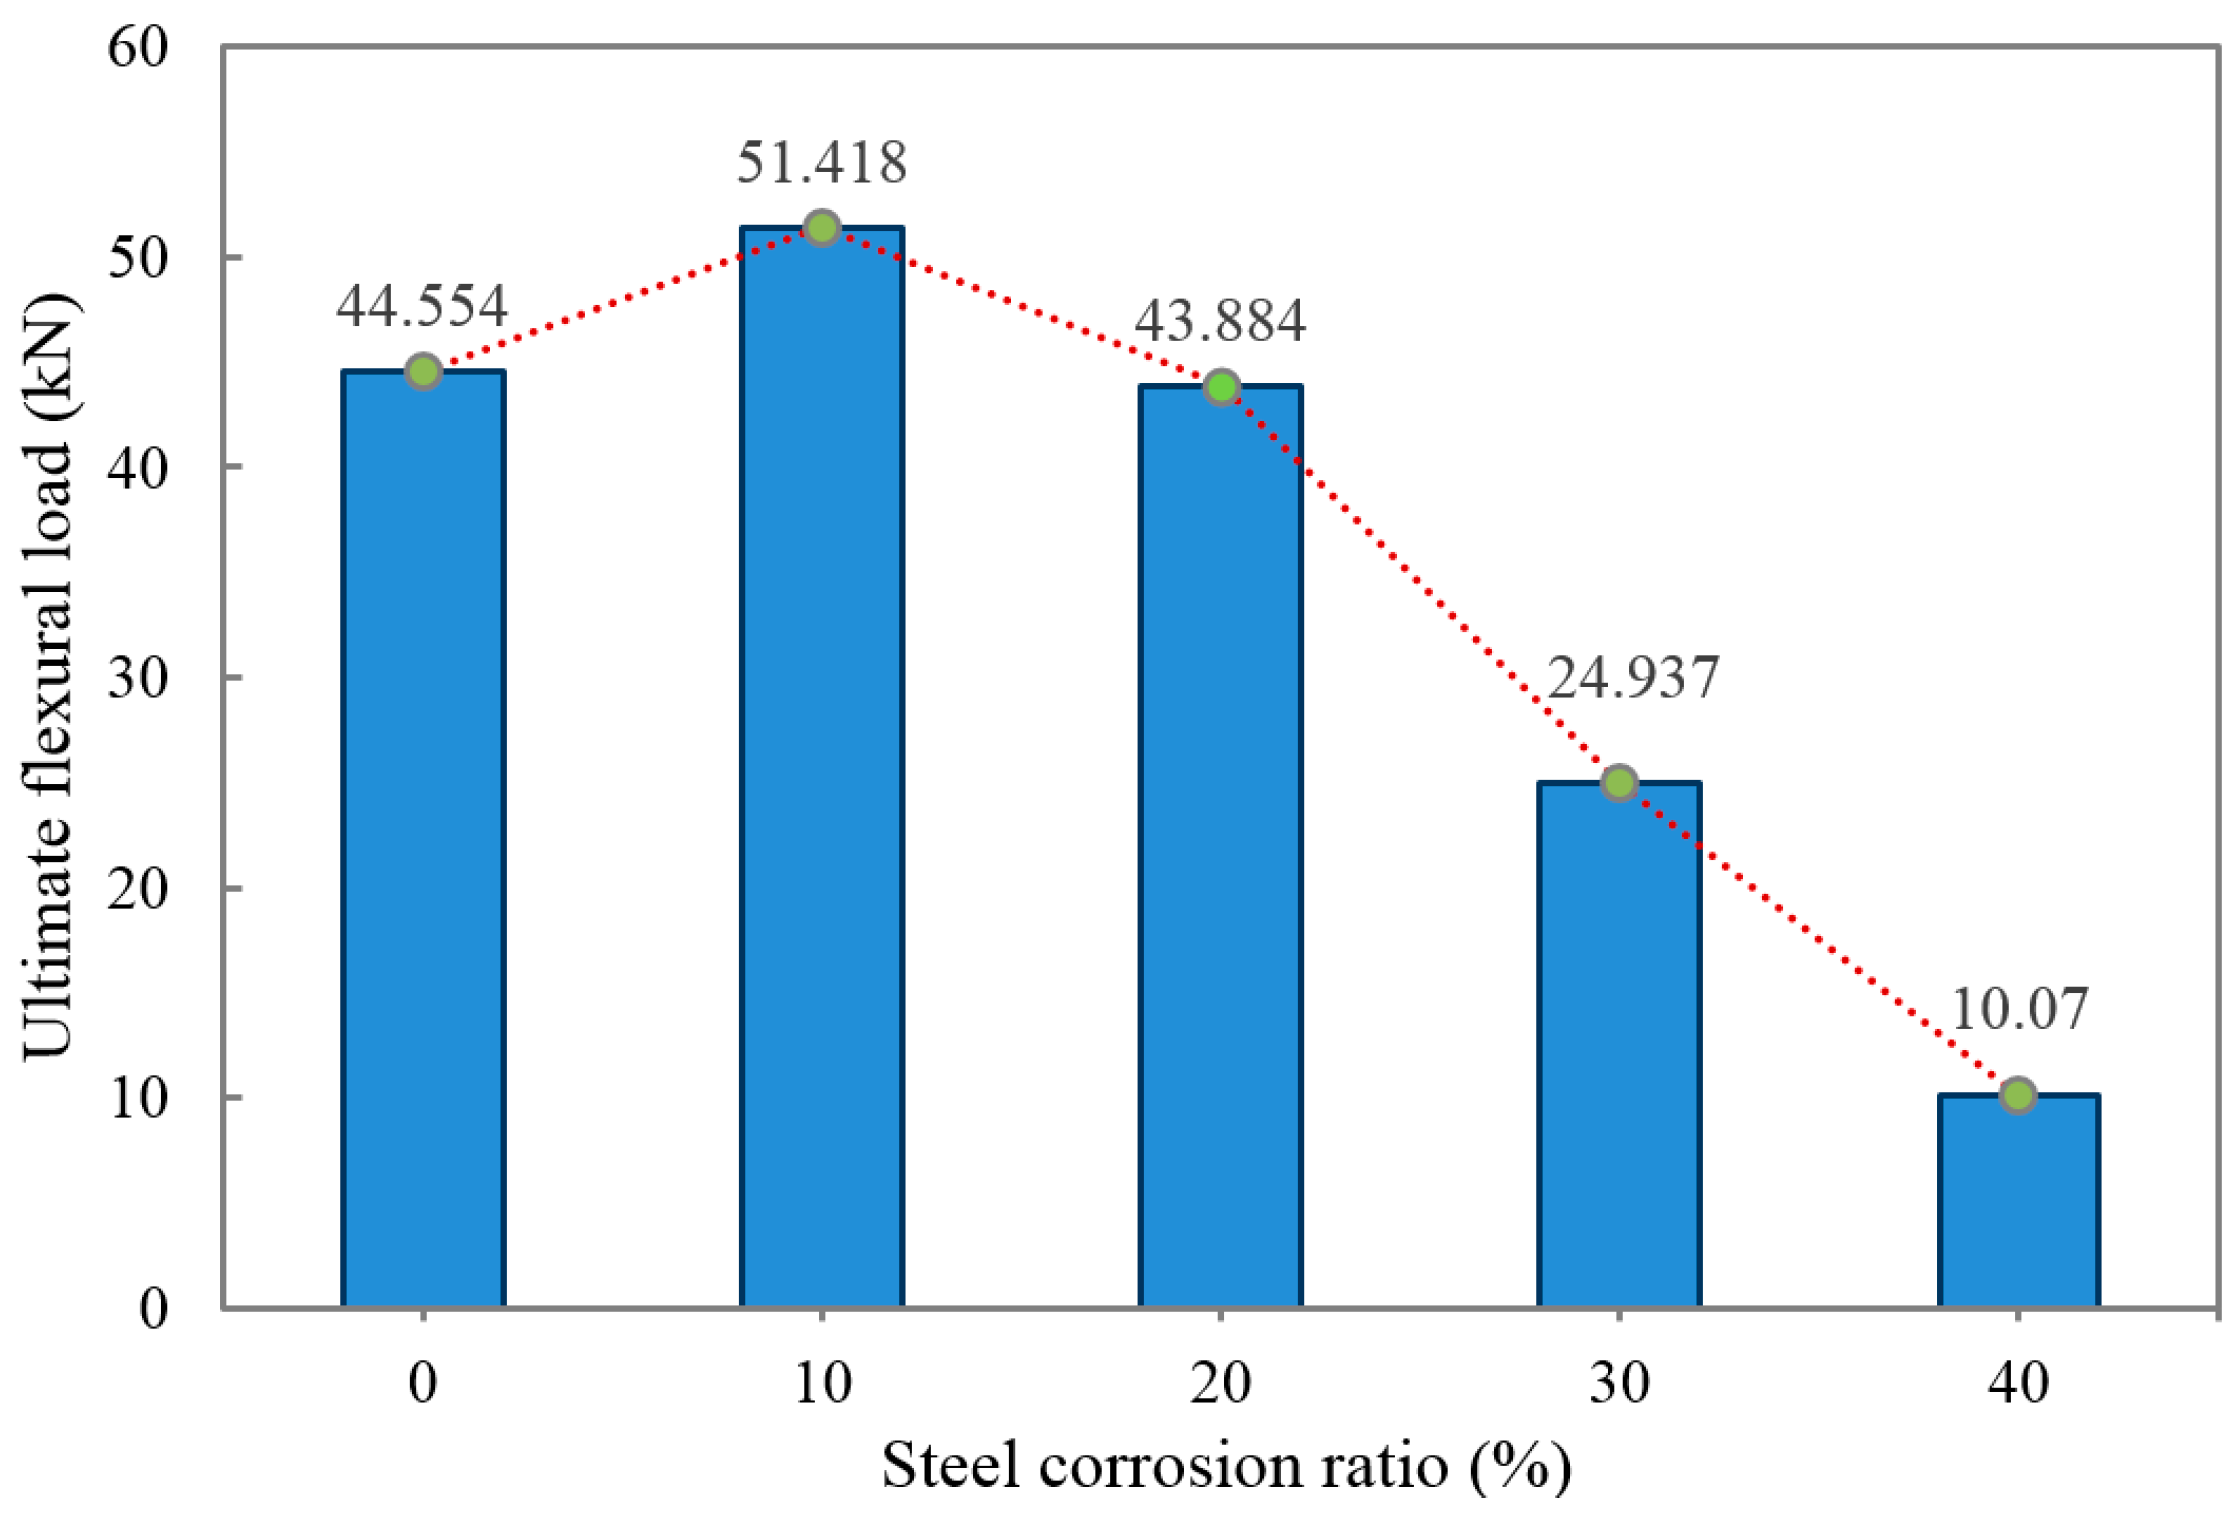
3.1. Failure Forms and Ultimate Flexural Load Affected by Steel Corrosion

In the actual RC bridge structures, the longitudinal reinforcement corrosion-induced cracks are located on the bottom and top surfaces of the bridge superstructure. Thus, in order to better mimic the actual RC bridge structures, the two most seriously cracked two opposing side surfaces of the RC specimens were set as the loading surface and the support surface. The failure forms of the five RC specimens after the bending test are shown in Figure 7.
From Figure 7a, it can be seen that the concrete was crushed at the load point during the loading process, and there was one shear crack that appeared on the side surface, indicating that the failure form of the uncorroded beam was over-reinforced.
From Figure 7b, it can be seen that the concrete at the load point was crushed while the concrete on the underside was cracked in the 10% corroded beam. Furthermore, after loading, one flexural crack and two shear cracks can be observed on the side of the specimen. These phenomena indicate that the failure form of the 10% corroded beam was balanced-reinforced.
From Figure 7c, it can be seen that the concrete at the load point was not crushed, and the concrete underside was cracked in the 20% corroded beam. Furthermore, there was only one shear crack on the side of the specimen after the bending test. These phenomena indicate that the failure form of the 20% corroded beam was rare-reinforced.
From Figure 7d, it can be seen that the concrete at the load point was not crushed, and the concrete underside was cracked severely in the 30% corroded beam. There was one extended irregularly bending crack on the side of the specimen. Furthermore, after loading, the concrete was spalling at the lower right corner of the specimen, from which it can be inferred that steel corrosion causes severe damage inside the concrete. The failure form of the 30% corroded beam was rare-reinforced.
From Figure 7e, it can be seen that there was one bending crack with a large crack width that existed in the 40% corroded RC specimen. Furthermore, the side of the specimen was almost spalling after the loading process. In addition, the steel bars embedded in the concrete were corroded severely, suggesting the tiny bonding force between concrete and steel bars. Based on these phenomena, it can be judged that the specimen was almost at the point of failure before the bending test due to steel corrosion.
The ultimate flexural load of these five RC specimens is shown in Figure 8.
The ultimate flexural loads of 10%~40% corroded RC beams decreased significantly with the increase of the steel corrosion ratio; the ultimate flexural load of the uncorroded beam was close to that of the 20% corroded beam. The reason for this is that the uncorroded beam is an over-reinforced beam; during the loading process, the concrete on the top of the RC beam will be initially damaged, resulting in low flexural strength. Therefore, the balanced-reinforced RC structures should be designed to meet the requirements of compression and flexural strength. Also, as can be seen from the failure forms of RC beams, the corroded steel bars crack the surface of concrete, decrease the bonding force between steel bars and concrete, as well as the mechanical properties of concrete material, then reduce the flexural strength of the RC beams.

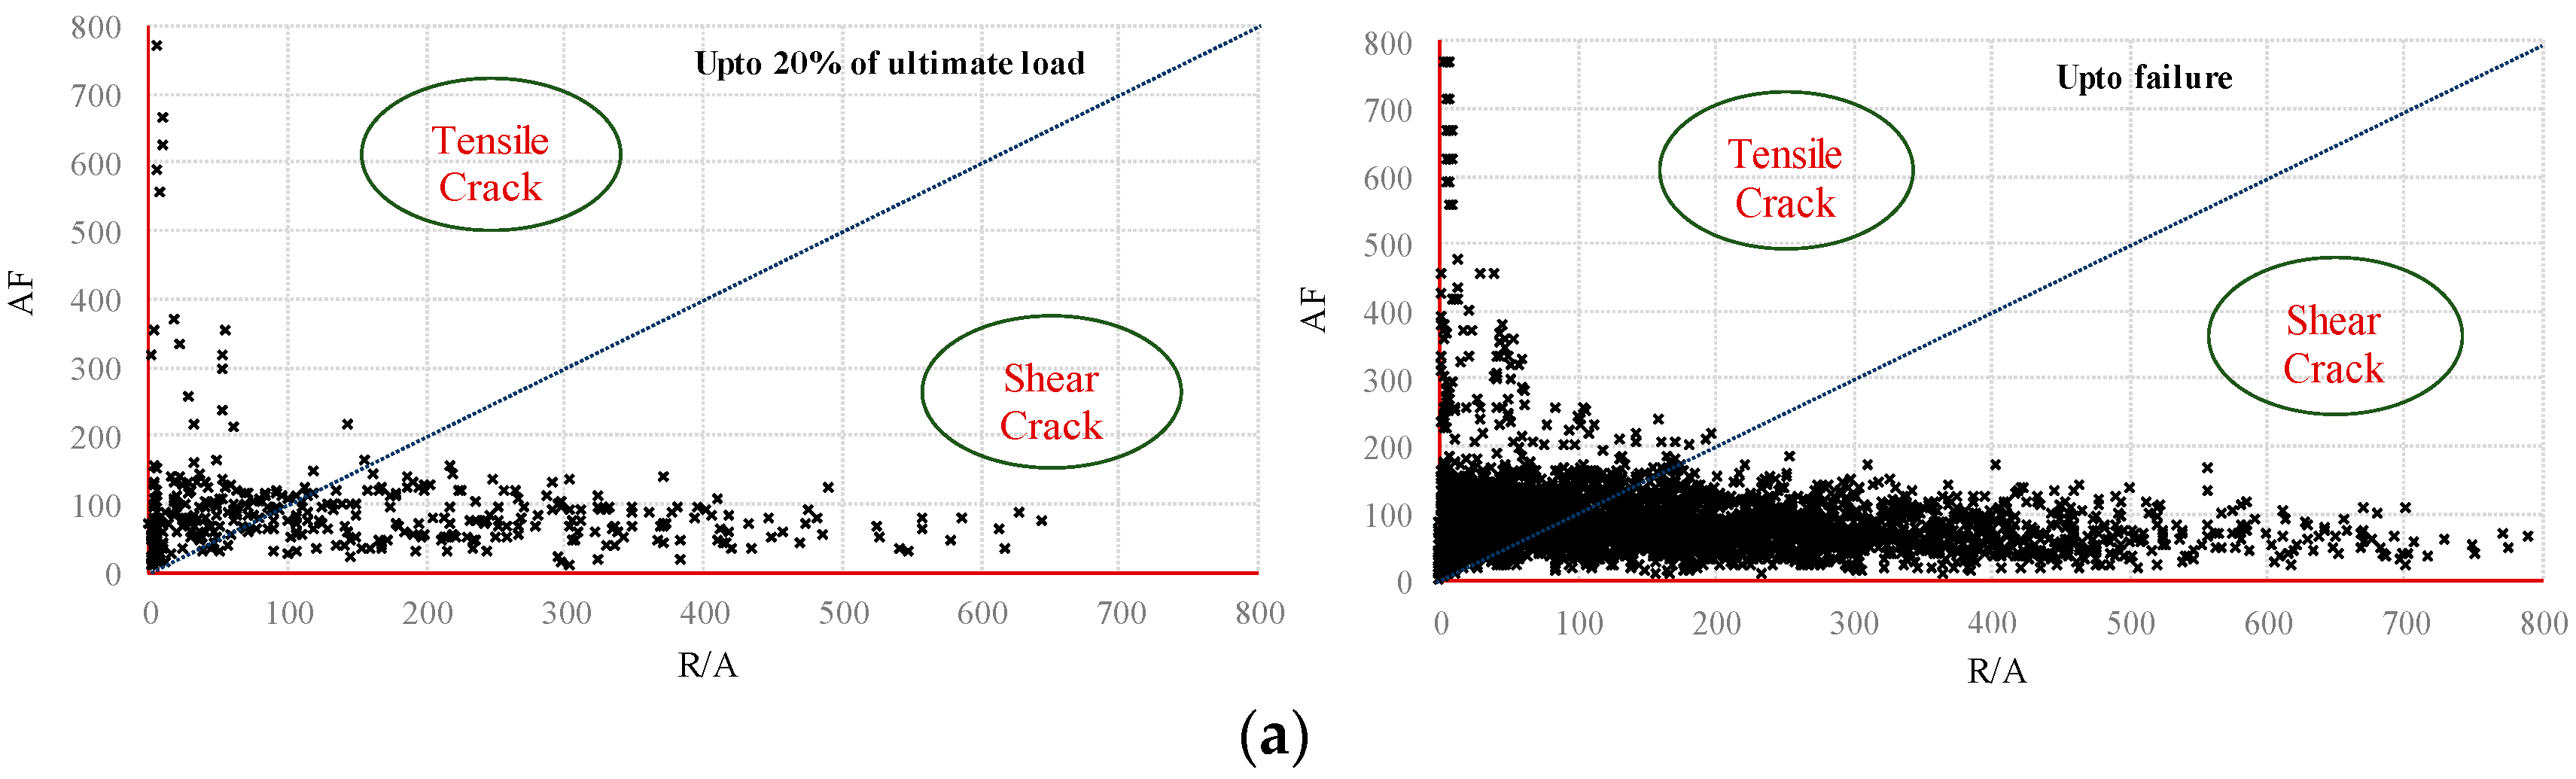
3.2. R/A-AF Association Analysis

R/A-AF association analysis shows an effective way to illustrate the failure modes of materials. R/A (measured in ms/v) is defined as the ratio of rise time and amplitude, while AF (measured in kHz) is defined as the ratio of the ringing counts and duration. The two parameters can be calculated using the following equations:
AF = Ringing counts/Duration,
R/A = Rise time/Peak Amplitude,
Ohtsu et al. [30] demonstrated that shear and tensile damage have different R/A and AF values. Generally, a large amount of energy is released immediately when a tensile crack occurs, which leads to a high associated AF value. On the contrary, a shear crack occurs leading to a long rise time and duration, which results in a high associated R/A value.
The types of cracks including tensile or shear formed in the concrete under different load stages can be qualitatively classified by analyzing the R/A-AF association diagram. Figure 9 illustrates the R/A-AF association diagrams at 20% of the ultimate load and at the failure load.
For RC structures, the bond damage in concrete is primarily caused by shear stress exerted from the ribs on the surface of the steel bar. As can be seen from all the R/A-AF association diagrams in Figure 9, shear damage dominates during the entire loading process for all the RC beams, which can be explained by the fact the ribs on the surface of the steel bar shear the surrounding concrete. For corroded RC beams, as the steel corrosion increases, the proportion of large AF values tend to increase. This phenomenon means the contribution of the tensile damage mode increases, and the action of steel corrosion leads the shear cracks to transform into tensile cracks. The reason can be explained that when the steel bar shears the surrounding concrete, the bevel of the steel bar’s rib tenses the concrete. Before the loading process, the steel corrosion- and expansion-induced tensile stress causes a large number of tensile cracks in the concrete, and the higher the steel corrosion ratio is, the more tensile cracks form in the concrete. Once the loading process begins, the original tensile cracks will continue to expand and cause greater tensile damage.
In addition, from the R/A-AF association diagrams of the five RC beams at the initial load stage (i.e., 20% of the ultimate load), the effect of steel corrosion on the types of cracks can be analyzed in detail. In the initial load stage of the 10% corroded beam, the proportions of tensile cracks and shear cracks are approximately the same, which indicates that the shear action and tensile action provided by the steel bar are the same. The balance between the shear and tensile action could result in a large bearing capacity of the RC beam. Furthermore, when comparing with the uncorroded beam in the initial stage, it is evident that the tensile action of the 20% corroded beam tends to increase while the shear action tends to decrease. The reasons for this can be explained as, in the uncorroded RC beam, the concrete in the compression zone is sheared by the steel bar’s rib; as the steel corrosion ratio increases, the reduced area of the compression zone causes the steel bars to put pressure on almost all the concrete, which increases the proportion of tensile cracks. Meanwhile, the corroded rib on the surface of steel bars reduces its ability to shear the surrounding concrete, resulting in the declined shear action. Moreover, in the 30% and 40% corroded RC beams, the development of tensile and shear cracks, which is reflected in the increase in the large R/A and AF values indicates that severe damage occurs in the initial load stage.
Therefore, the variation trend of the tensile crack and shear crack can be clearly seen from the R/A-AF association diagram, which facilitates the analysis of the damage affected by steel corrosion in concrete from the perspective of the cracking mode. Using R/A-AF association analysis, the type of damage in the RC beams can be identified with reasonable accuracy. Furthermore, R/A and AF values are important parameters used for characterizing the cracking mode for corroded RC beams.

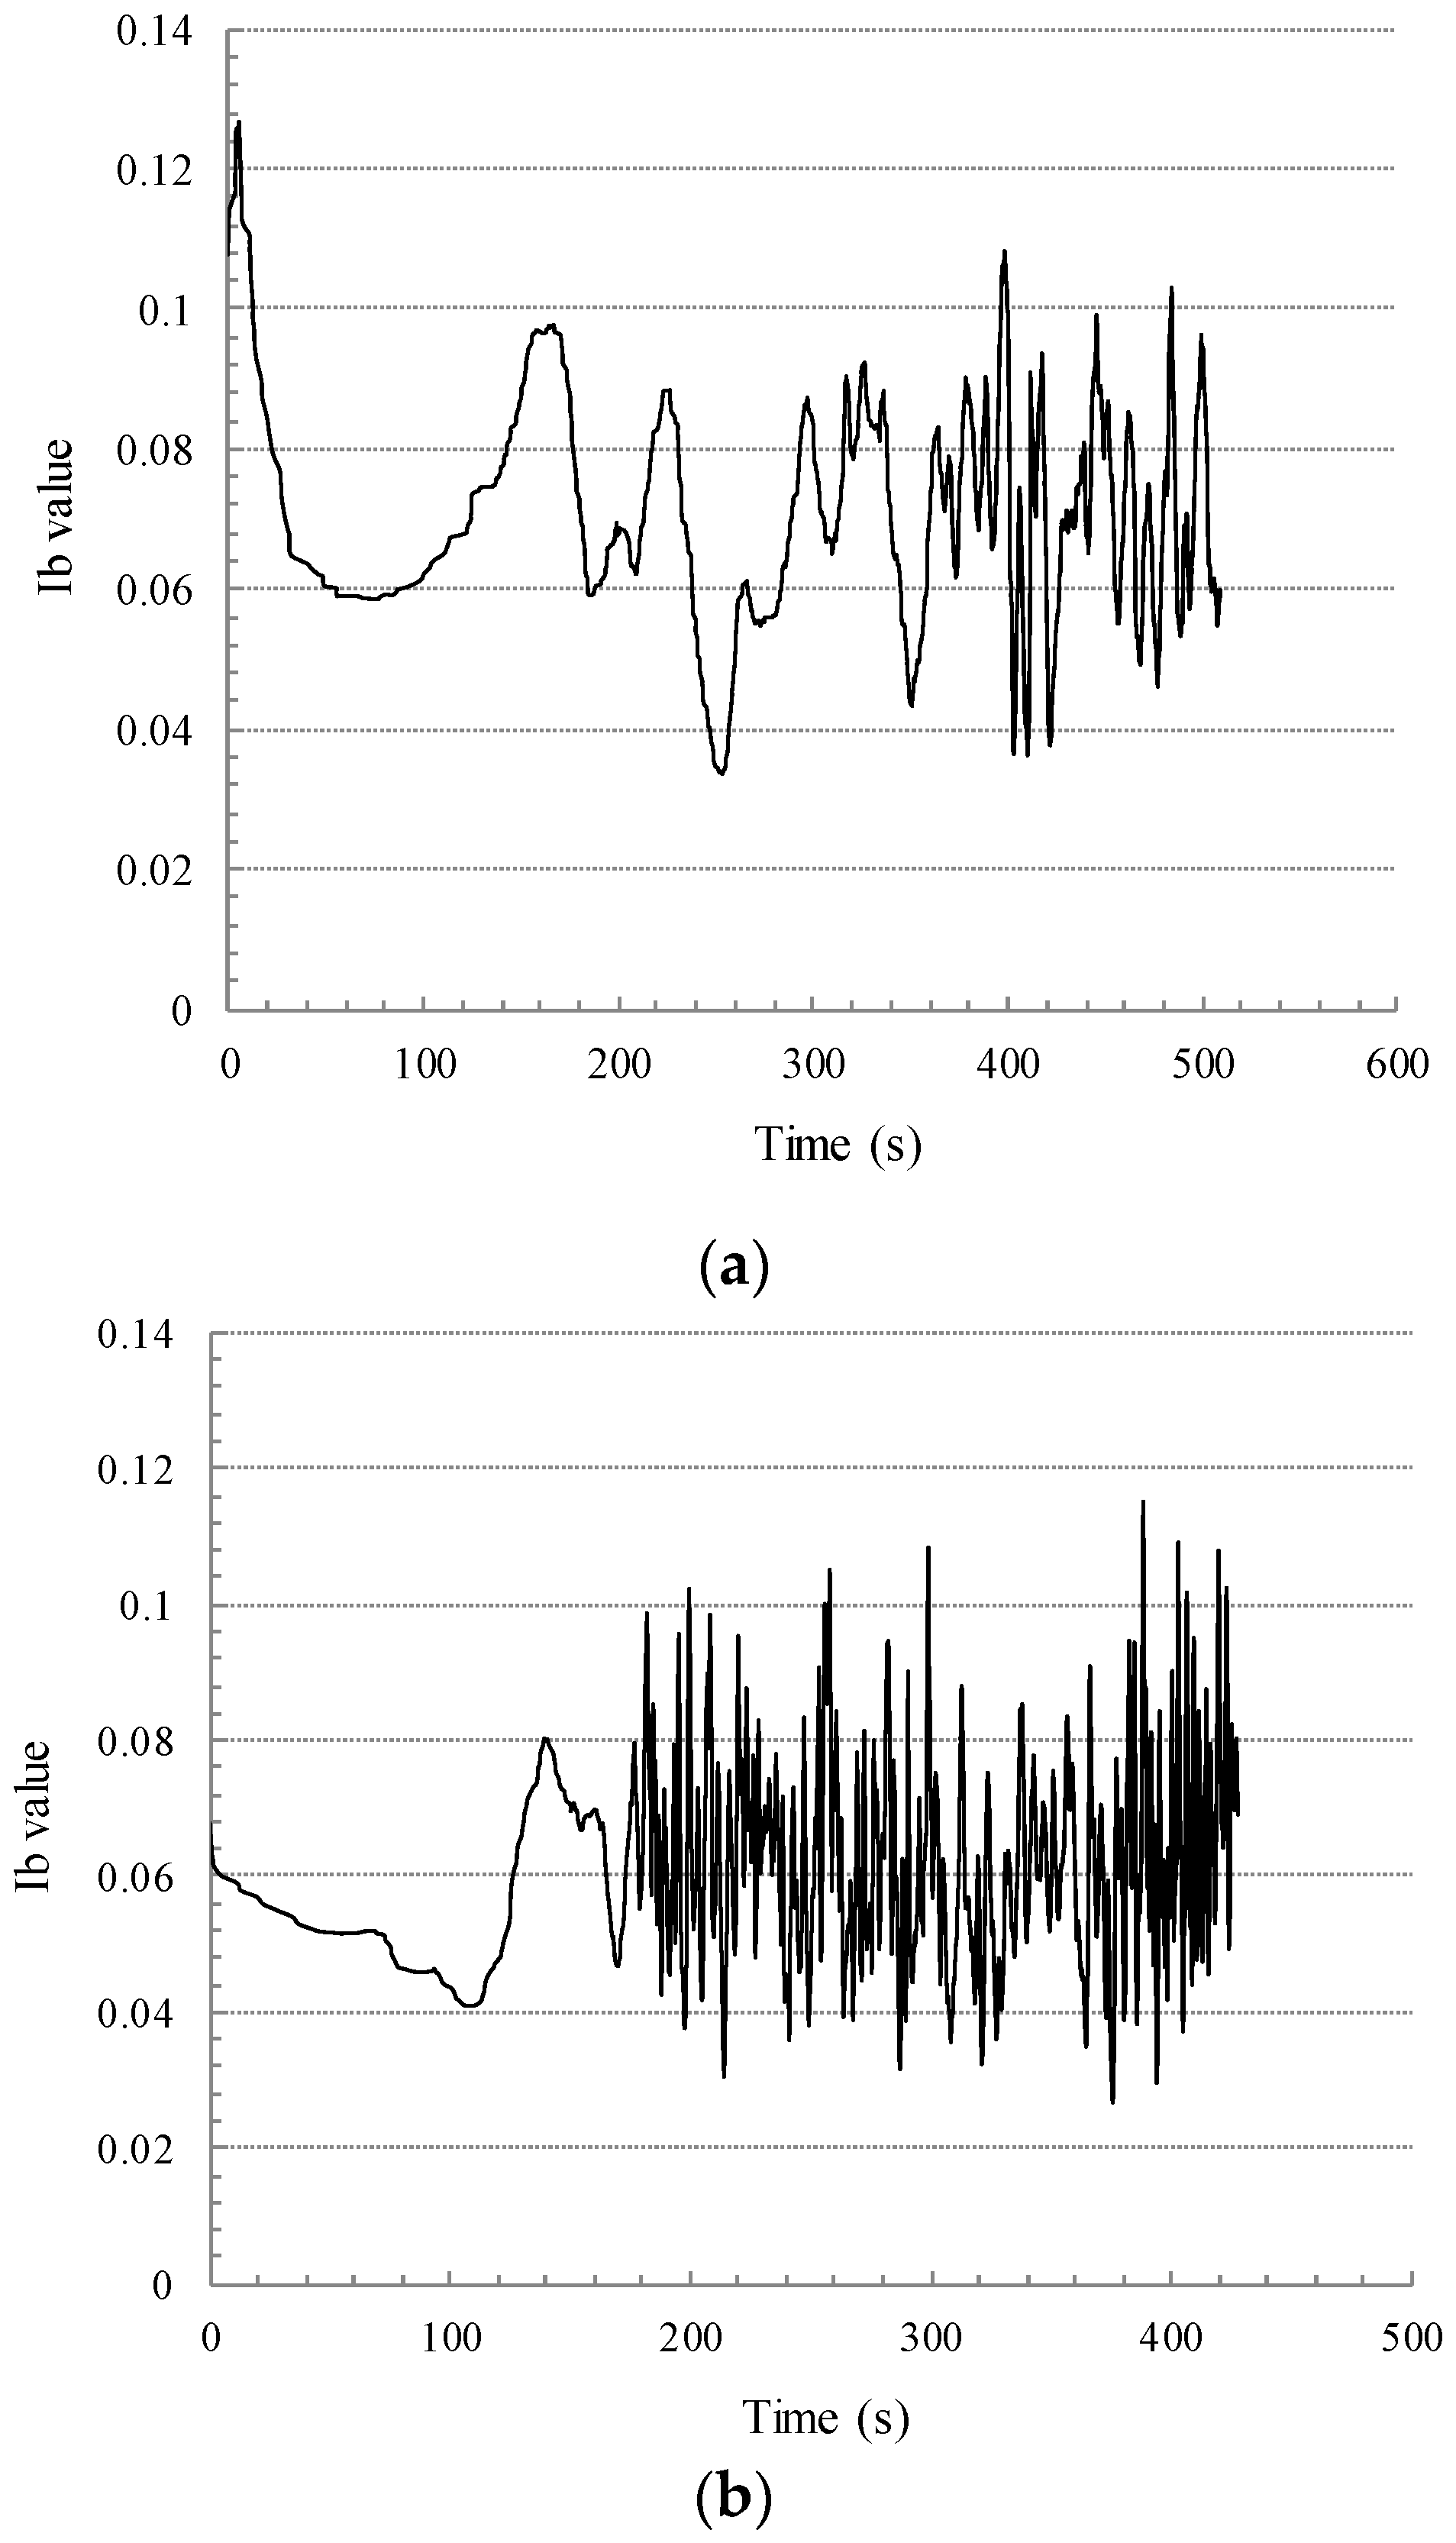
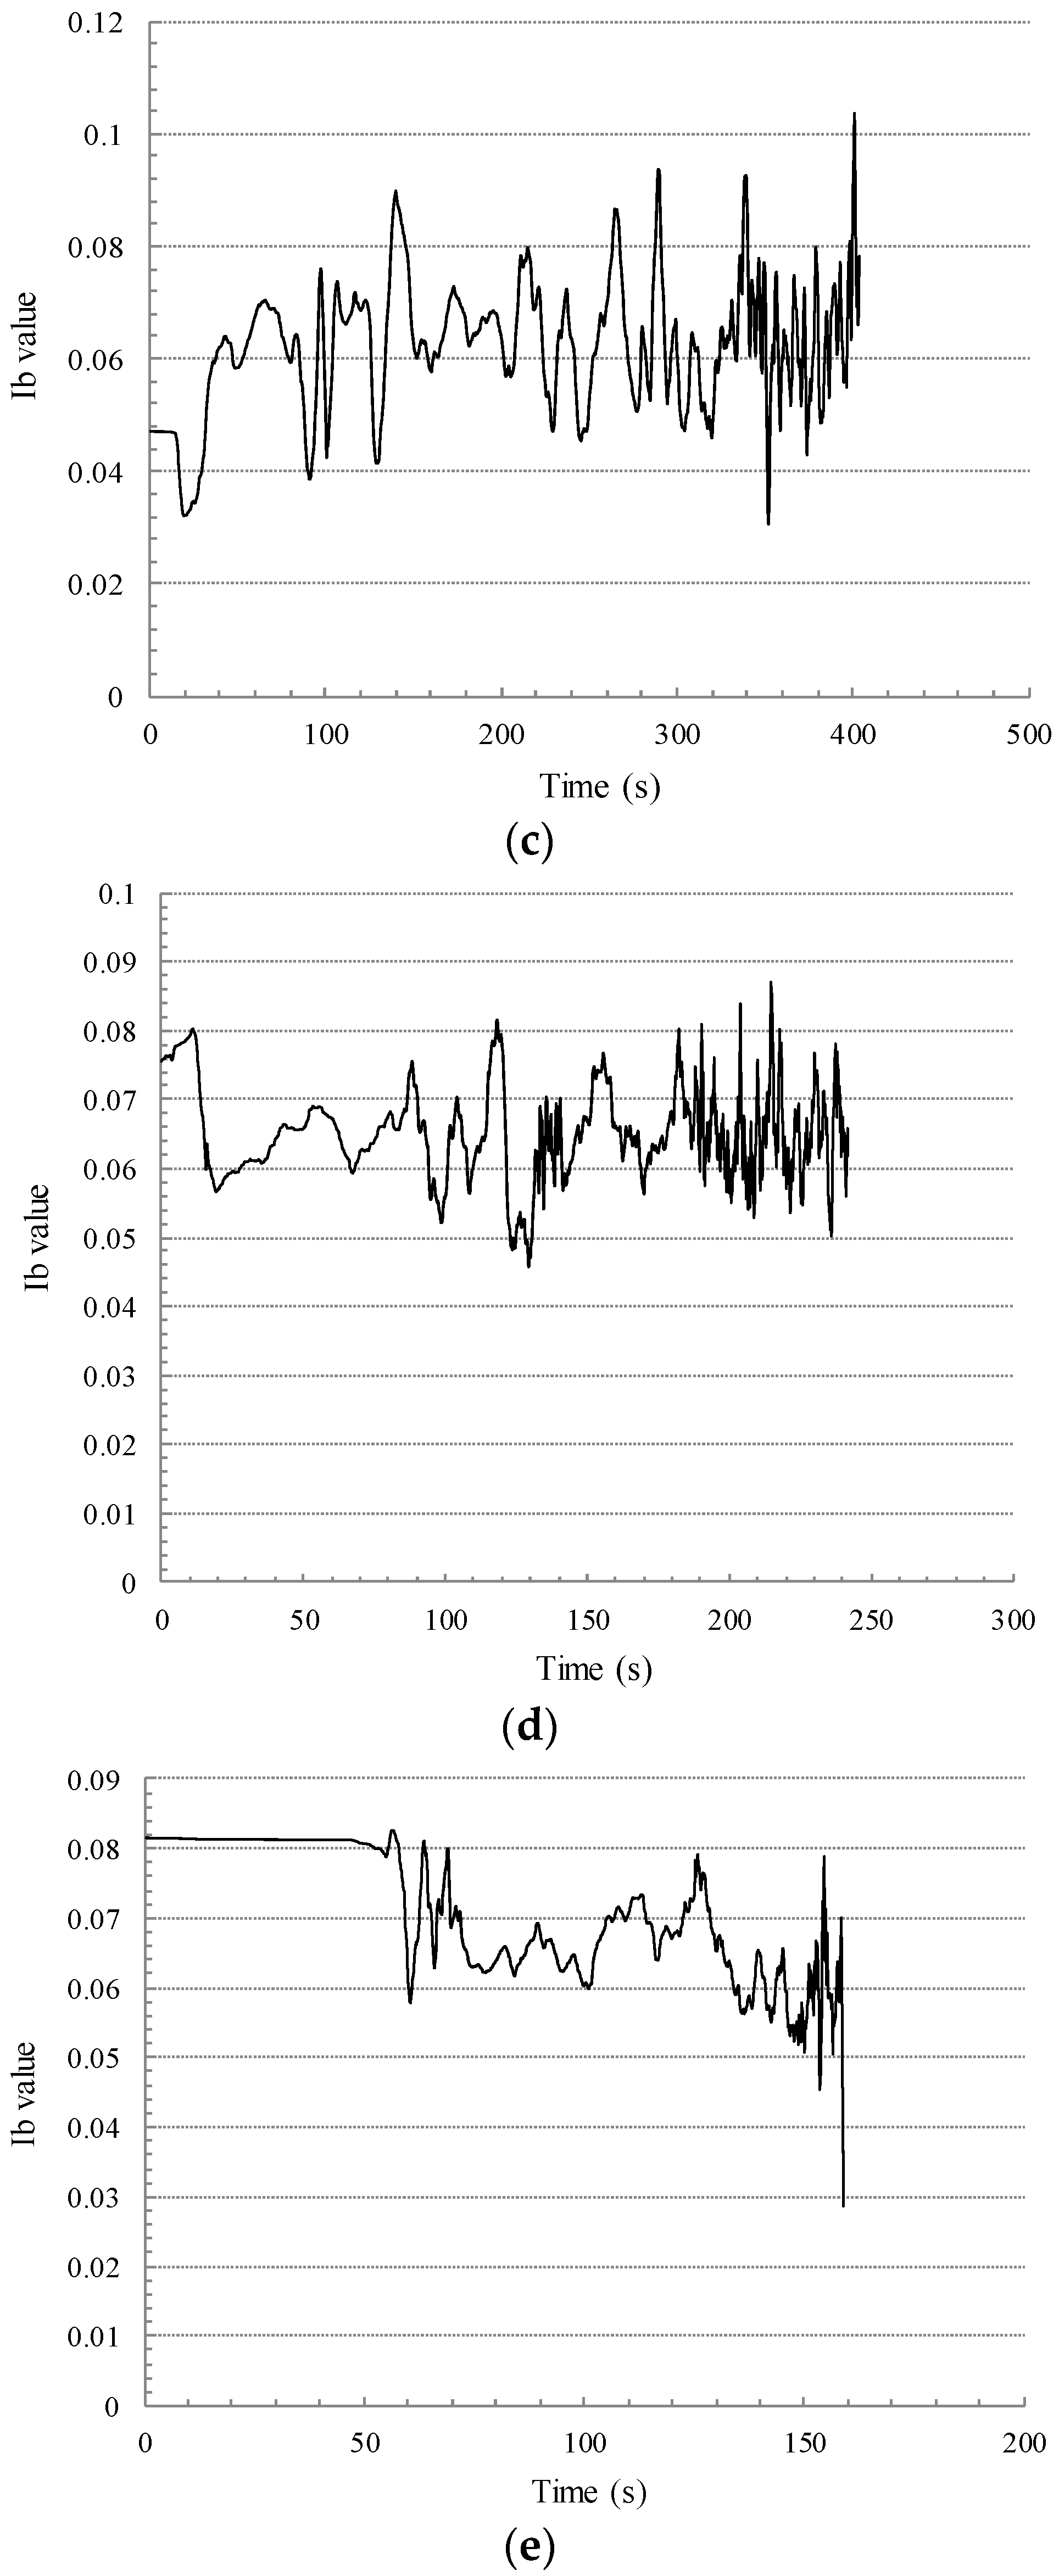
3.3. Ib-Value Analysis

A B-value analysis method was first applied for analyzing seismic waves, and it has been recognized extensively by scholars for its advantages in quantifying seismicity [31]. The B-value analysis method can also be applied in the AE field for cases when the waves in acoustic emission are similar to the waves in an earthquake [21]. The B-value can be defined as follows:
log 10 N = a b ( A d B 20 )
where AdB is the amplitude of AE signal; N is the number of AE signals with the amplitude above AdB; a and b are the parameters of linear fitting, a is the intercept of the regression line, and b is the slope of the regression line, also called the b-value of these AE events.
Ib-value (improved b-value) method, which is evolved from the B-value analysis method, has been applied in the civil engineering field in the past few years [32]. The Ib-value is a calculated statistical value from AE events, which can be obtained by:
I b = log 10 N ( μ α 1 σ ) log 10 N ( μ + α 2 σ ) ( α 1 + α 2 ) σ
where μ and σ are the mean and standard deviation of the amplitude distribution in recent N AE signals; usually the α1 and α2 are constant values between 0 and 1, in this paper, the two parameters are given the values of 0 and 1, respectively; N is set to 100, which is the population of recent hits.
The Ib-value is a transient feature, and the value will be updated with each new AE signal recorded during the cracking process of the material. When micro-cracks (smaller-scale and weaker damage) begin to form, bigger Ib-values can be obtained. The reason for this is that during the cracking process of micro-cracks, the cracked surfaces rub against each other, although the number of AE events is large, the amplitude of AE signals is small. On the contrary, when macro-cracks (larger-scale and stronger damage) forms, smaller Ib-values can be obtained. Thus, the Ib-value analysis method (as a statistical analysis method) can effectively distinguish the internal damage type throughout the entire loading process. Figure 10 shows the Ib-value curves of RC beams with different corrosion ratios under the load of 0.05 kN/s. The maximum and minimum values of the five Ib-value curves are listed in Table 3.
From Figure 10 and Table 3, it can be considered that the maximum and minimum values of the five Ib-value curves are decreased with the increasing of the steel corrosion ratio. According to the physical meaning of the Ib-value, steel corrosion increases the proportion of the large amplitude of AE events in the fracture process, which infers that the proportion of macro-cracks is increased along with the steel corrosion ratio. Furthermore, even without loading, there are a large number of micro-cracks that form in concrete due to steel corrosion. Once the mechanical loading process begins, the micro-cracks could increase together rapidly and develop into macro-cracks, which demonstrates that steel corrosion seriously reduces the flexural properties of the RC beam.
In the early load stage from 0 s to 100 s of the uncorroded RC specimen, the Ib-value curve falls sharply, which indicates a large amount of large-amplitude AE events, in other words, there are lots of macro-cracks formed during this stage. Then, in the 100~150 s load stage, the sharply increasing curve indicates that there are lots of micro-cracks formed. Later on, in the 150~350 s load stage, the proportions of macro-cracks and micro-cracks are nearly the same, which indicates that the RC beam is in the crack stable extension stage. In the load stage after 350 s, the curve fluctuates violently. Such a situation demonstrates that a large amount of both micro- and macro-cracks were formed in the RC beam continually, and the RC beam had entered into the unstable fracture extension stage. Finally, unstable failure of the beam occurs. In summary, the uncorroded RC beam represents a poor bending strength because it formed a large number of macro-cracks and was crushed at the load point in the early stage of loading. Therefore, the Ib-value curve shows that the uncorroded RC beam conforms to the failure mode of over-reinforced, which is consistent with the previous analysis results in Section 3.1.
From the Ib-value curve of the 10% corroded beam, it can be seen that in the early load stage from 0s to 100 s, the curve, at first, decreases slowly, which indicates that the RC beam is in the crack initiation stage. While for the period of 100~180 s, curve gradually rises and then falls, showing that lots of macro-cracks are formed, and then the micro-cracks continue to extend; the RC beam is in the crack stable extension stage. Later on, in the load stage after 180 s, the curve fluctuates violently, a large number of AE signals generated by the initiation of cracks or relative movement between steel and concrete are detected by sensors, meaning that the RC beam is in the unstable fracture extension stage. In summary, the Ib-value curve shows that the 10% corroded RC beam conforms to the failure mode of balanced-reinforced.
From the Ib-value curve of the 20% corroded beam, it can be observed from the curve that proportions of the formed micro- and macro-cracks are nearly the same from 0 to 350 s, suggesting that the RC beam is in the crack stable extension stage. After 350 s, the curve fluctuates violently, indicating that the RC beam is in the unstable fracture extension stage. Comparing with the 10% corroded beam, the 20% corroded beam enters into the crack stable extension stage earlier, and its’ duration over which its curve violently fluctuates is shorter.
It can be seen from the Ib-value curve of the 30% corroded beam, there are macro-cracks formed in the RC beam at the early load stage of 0 to 20 s, which is caused by cracking at the bottom of the beam. Then, the RC beam enters in the crack stable extension stage from the 20 to 180 s. Finally, after 180 s, the RC beam is in the unstable fracture extension stage.
Comparing with the 30% corroded RC beam, the amplitude of AE signals for the 40% corroded RC beam is stable during the early stage from 0 to 50 s. This phenomenon indicates that the bond behavior between the steel bar and concrete is weak and almost all the AE events are produced by concrete. Later on, cracks extend steadily from 20 s to 150 s. After 150 s, a large number of macro-cracks are formed within a very short time, and the specimen is destroyed immediately. In summary, it can be concluded that the steel bar has little contribution to the flexural strength of the 40% corroded RC beam, and this beam conforms to the failure mode of rare-reinforced.
In summary, it can be concluded that steel corrosion reduces the maximum and minimum values (i.e., the variation range) of the Ib-value curves due to the generation of macro-cracks in concrete due to the expansion stress of steel bars. Steel corrosion also reduces the duration of the violent fluctuation of the Ib-value curve; where there is a longer duration of a violently fluctuating Ib-value curve, the bearing capacity of the RC beam is larger. Hence, the Ib-value curve can be used for bearing capacity identification. Furthermore, from the trend in the Ib-value curves, the fracture states of the RC beams in different load stages can be determined, which can be used to further determine the failure forms of the beams. In addition, the analysis results are consistent with the real failure mode of the beams; therefore, AE technology is an effective method to describe the whole process from stress to failure of RC structures. Thus, after identifying many Ib-value curves of RC structures with different failure modes, engineers and technicians can utilize AE technology and Ib-value curve to evaluate the status of in-service RC structures effectively.

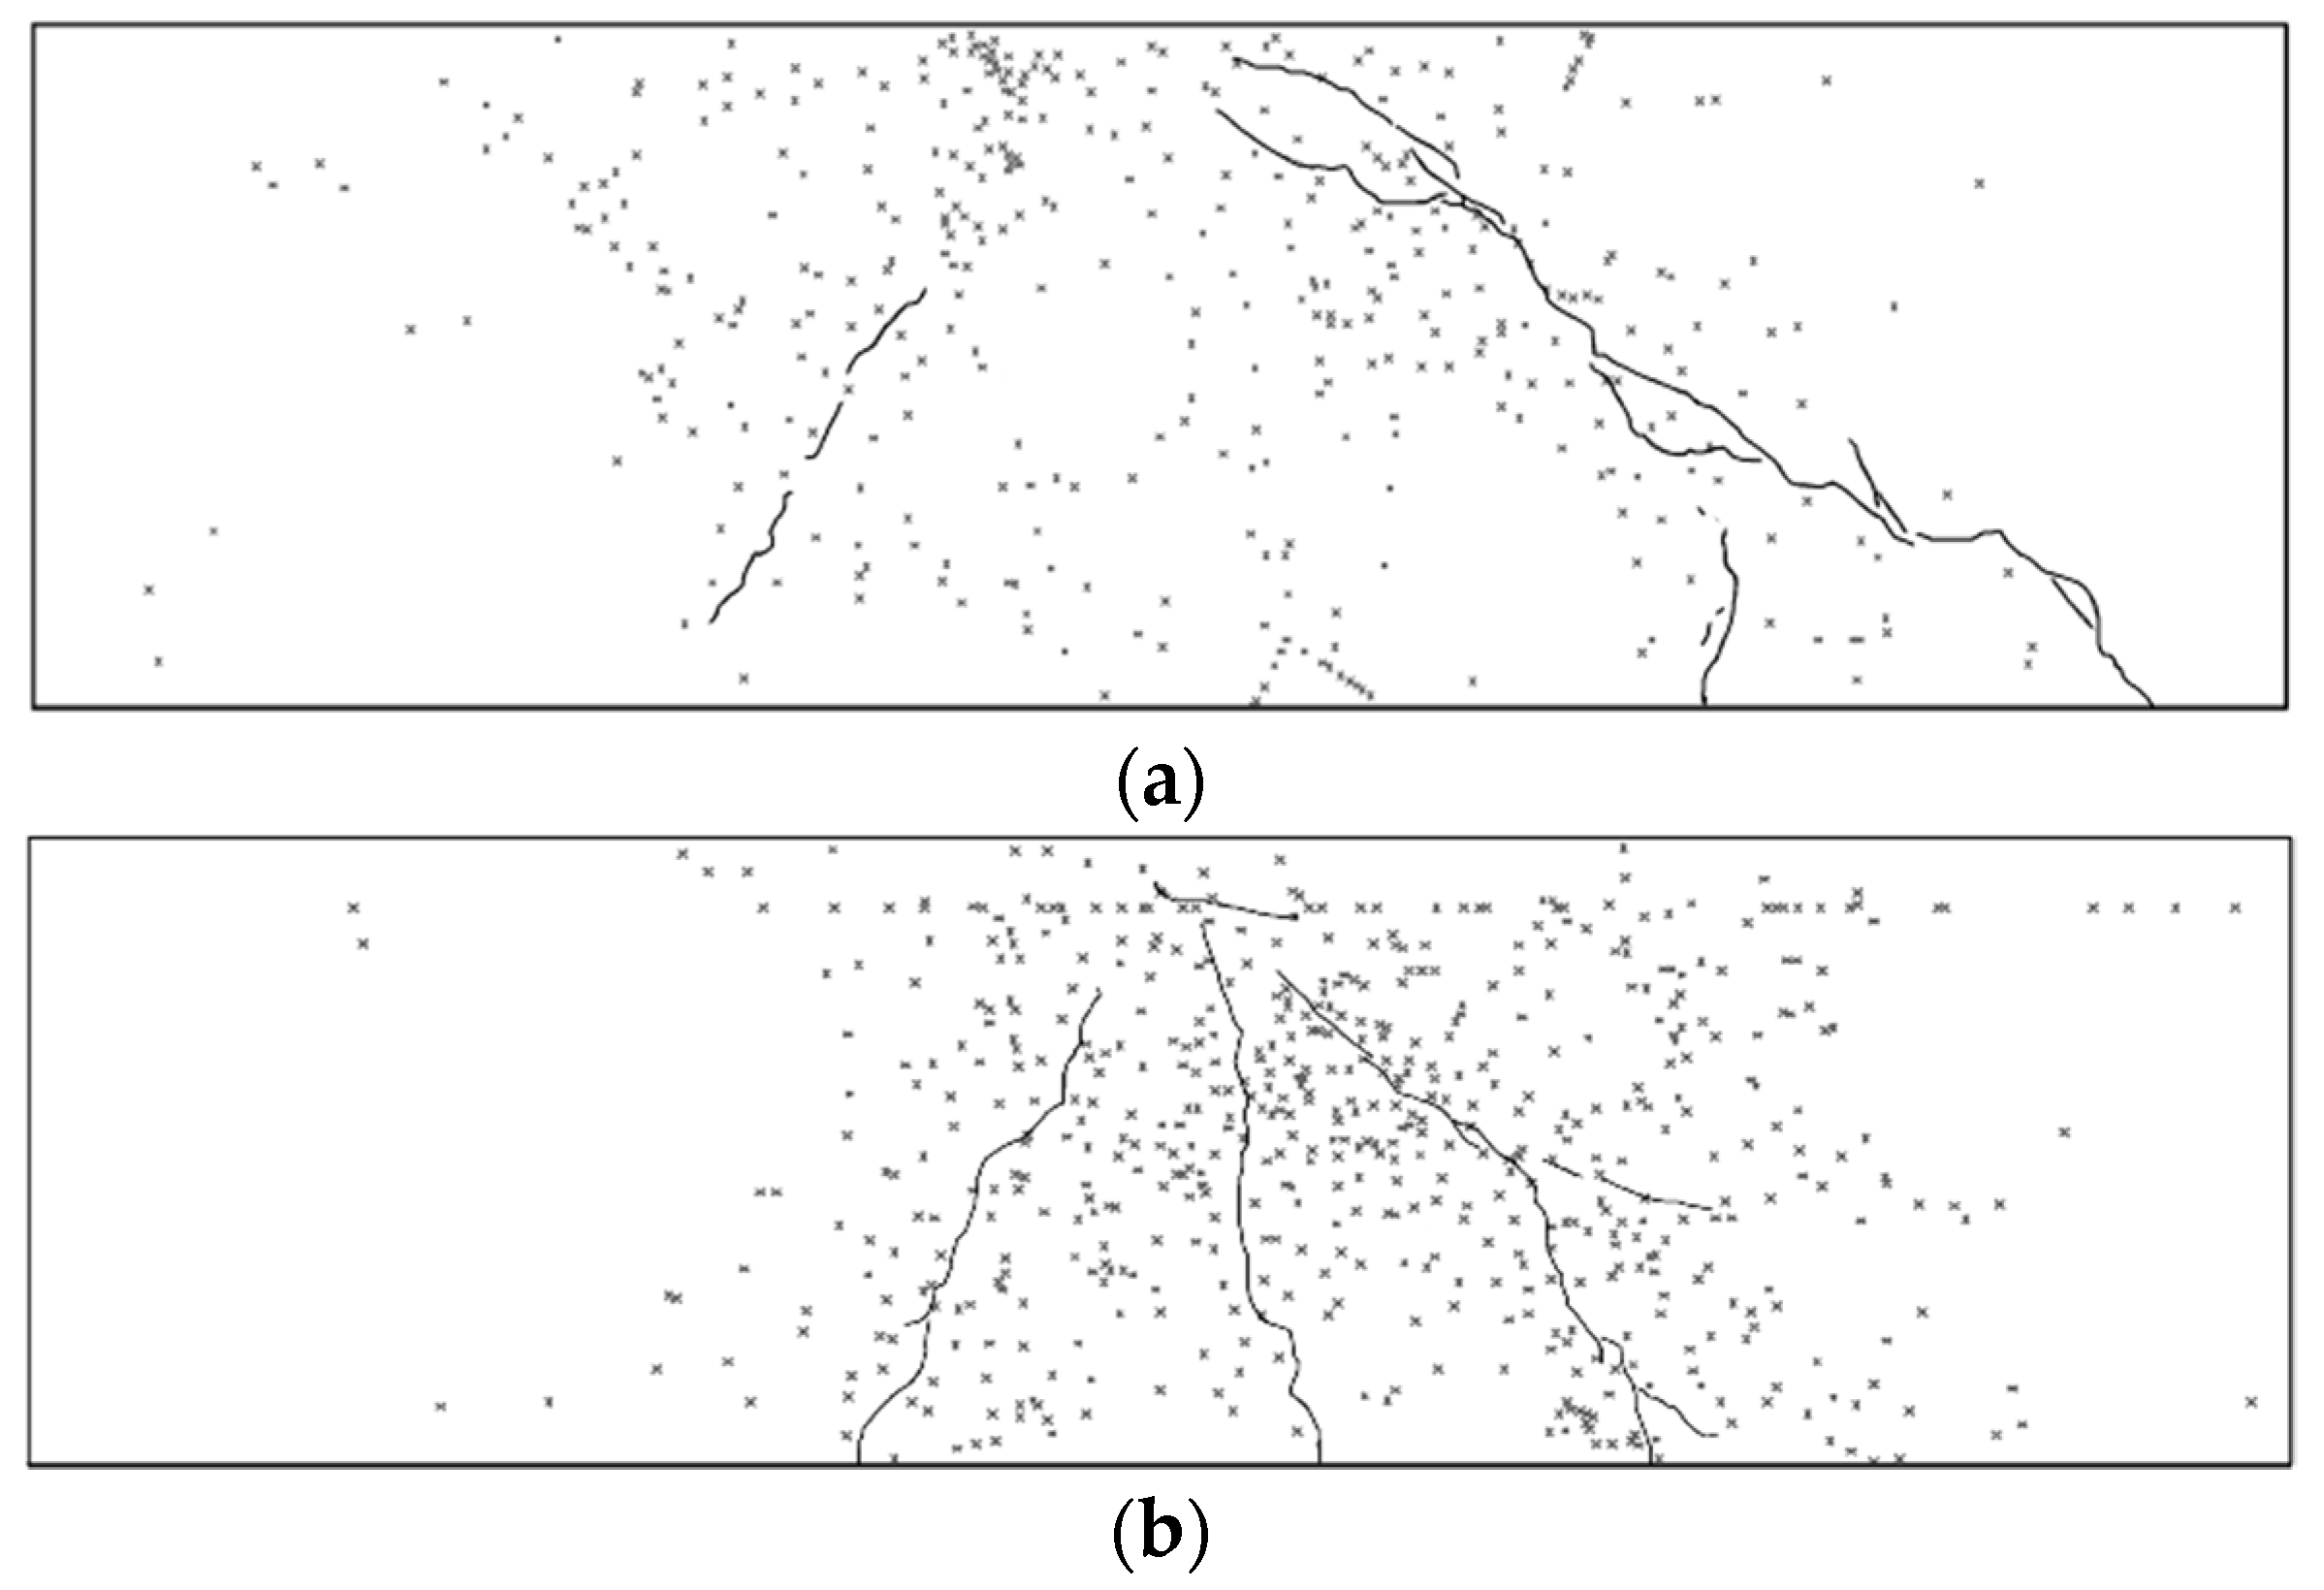
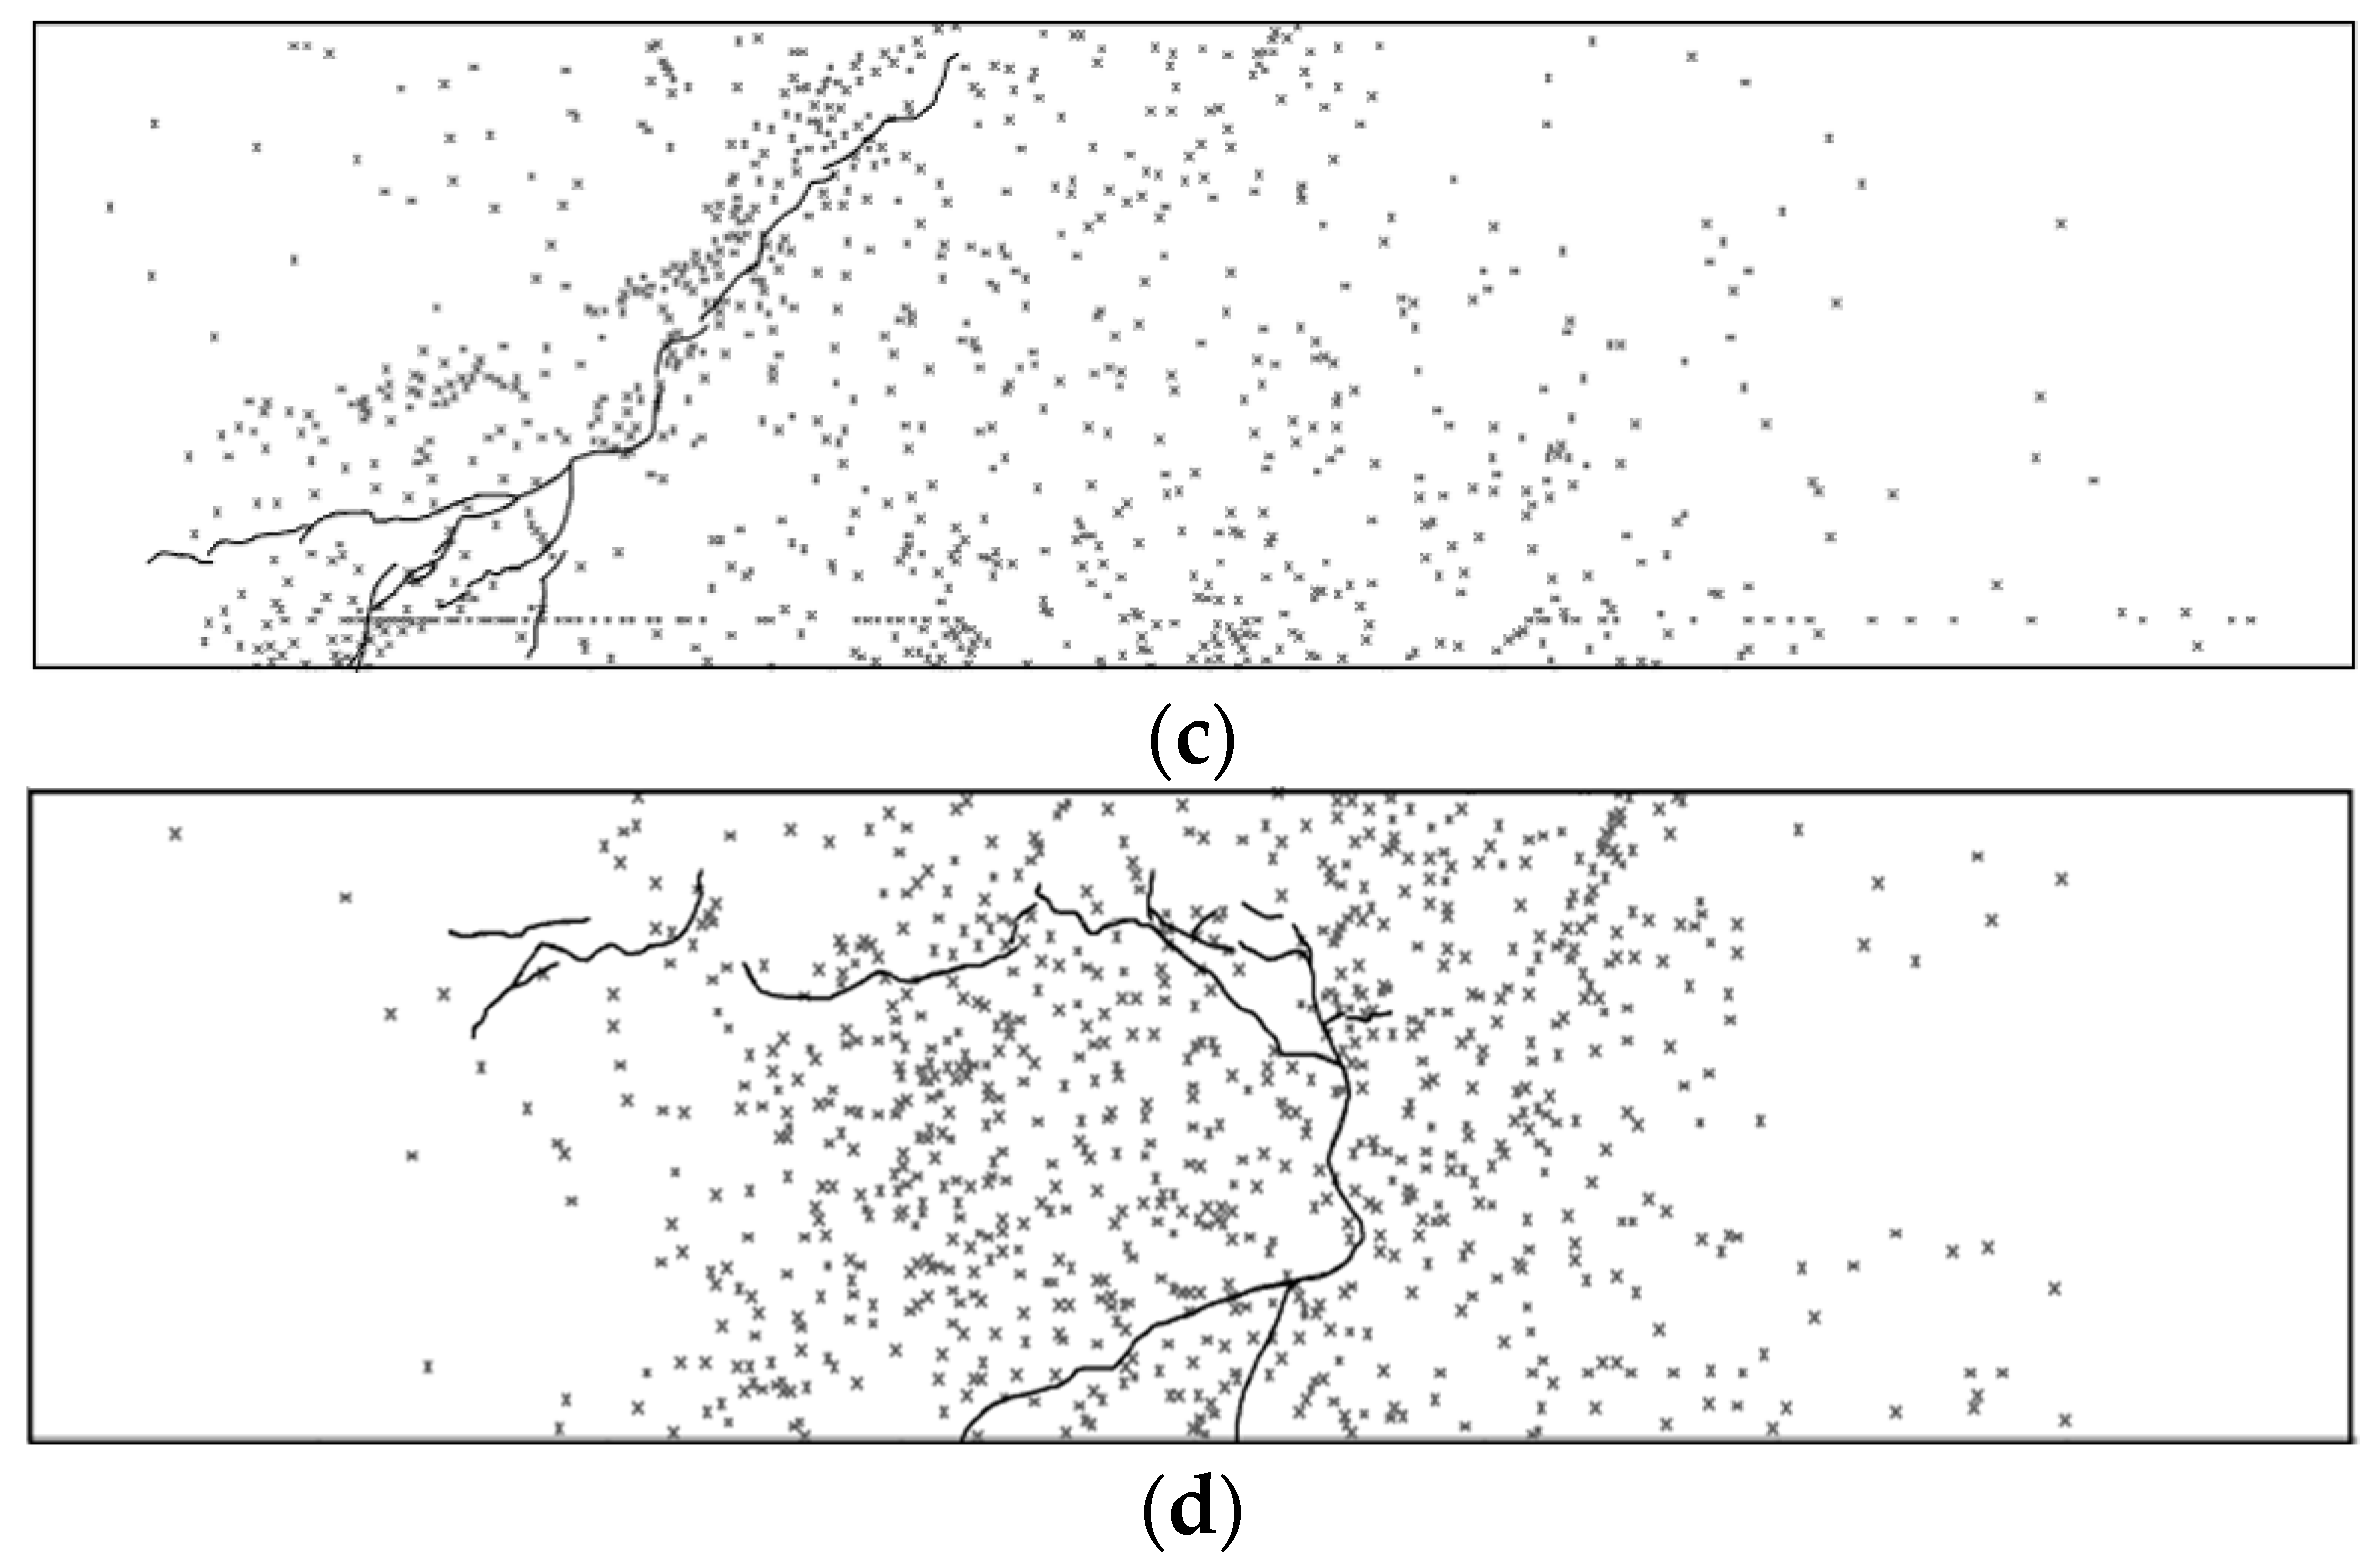
3.4. Localization of AE Events

In this study, five AE sensors were used to obtain the location of AE events. The five AE sensors have their own independent coordinates. When an AE signal occurs, the time at which the AE signal reaches the five sensors is different. After obtaining the coordinates of the five sensors and the difference between the time when the AE signal reaches the five sensors, the coordinates of this AE event can be determined, and the locations of AE signals for each specimen can be inferred.
In order to determine whether the localization results of AE events are consistent with the locations of real cracks, the locations of cracks (namely, cracks map) after beam failure are also obtained. According to the previous studies done by our team [33,34], image recognition technology can be used for depicting the cracks map. Since this work is not the focus of this study, it is briefly described here. Step 1, collect the digital images of the side of each of the cracked RC beams and erase the sensor positions markers using the Photoshop Software. Step 2, convert the color image into a grey scale image; Step 3, denoise the grey scale image using Wiener filtering and Median filtering methods. Step 4, use the piecewise linear gray level transformation method to enhance the contrast of the cracks. Step 5, use the Sobel edge detection operator to identify and depict the locations of cracks. Step 2 to Step 5 are processed in the Matlab software.
Since concrete on the side of the 40% corroded RC beam had extensive spalling after loading, see Figure 7, crack maps of this sample can’t be depicted. Thus, both the locations of AE events and cracks of RC beams with the corrosion ratios of 0% to 30% are shown in Figure 10.
From cracks maps in Figure 11, there are several main cracks generated on the side surface of RC beams. Cracks in Figure 11a,c mainly belong to shear cracks. From a macro point of view, the location points of AE events mainly exist near the region of the crack, namely. The AE events location points are densely distributed near the cracks. While the AE events location points are sparsely and irregularly distributed away from the cracks. From Figure 11a, it can be clearly observed that there are many AE event location points distributed near the midpoint on the upper surface of the RC beam; these must be generated by the crushed concrete at the load point during the early load stage. This finding from experimental observations is verified by the AE events localization results.
From Figure 11b,d, it can be concluded that the extension form of cracks is diverse and the AE events location points are distributed disorderly. Interestingly, the AE event location points also densely distributed near the cracks while they are sparsely distributed away from the cracks.
Therefore, it is believed that the region where the crack is located can be roughly judged by the region where the relatively dense distribution of the AE events is. In other words, the denser distribution of the AE events is, the higher the probability that cracks form in this region.
In addition, the reason that the many localization points of AE events exist away from cracks may be as follows:
  • The sensors are placed only on the side surface of RC beams, so AE events can only be located in a two-dimensional way. However, AE events occur in a three-dimensional space in the RC beams, so the localization results of AE events are the projection of its spatial position on the plane where sensors are placed.
  • The diffraction of AE signals due to the existence of cracks caused by steel corrosion hinders the propagation of signals, which makes an inaccurate AE signal transmission time and localization results.
  • The AE signal is reflected during the propagation from the cracking position of the beam to the position of the sensor to cause attenuation of the wave. This process causes the signal from the actual cracking position to differ from the signal received by the sensor which could interfere with the judgment.
In summary, localization technology of AE events can be used for damage identification, and it is of great significance to obtain the structural state information and develop corresponding maintenance measures using AE technology to locate the damage region of the in-service RC structures. Furthermore, although locating the AE events in a three-dimensional way can determine the location of the cracks and cracks’ extension states more accurately, the number of required sensors, the difficulty of the localization algorithm and computation will greatly increase. Furthermore, the density value of the AE event location points near or away from cracks, and the distance between the cracks and the AE event location points are interesting issues, which can be quantitively analyzed by the regression or correlation analysis method. With regard to wondering whether the distance between the AE events location points and the cracks at different load stages is affected by the steel corrosion ratio, this also has become the topic upon which the authors will further deliberate on.

4. Conclusions

In this paper, five over-reinforced RC beam specimens were prepared and corroded by an electrical accelerated steel corrosion setup in different ratios. Bending and AE tests were utilized for evaluating the flexural characteristics of the RC beam under the effect of steel corrosion. The following conclusions can be achieved:
(1)
In general, the ultimate flexural load of the RC beam decreases along with steel corrosion. Interestingly, the ultimate flexural load of the 10% corroded RC beam was the largest instead of the uncorroded one; the reason is that failure form of the uncorroded RC beam is over-reinforced. It is proof that the balanced-reinforced RC structures should be designed to meet the requirements of compression and flexural strength.
(2)
The cracking failure modes of the corroded RC beams were analyzed according to the R/A and AF values and their association diagram. Results revealed that for each specimen, shear damage dominates during the loading process. Furthermore, the cracks’ type tends to transform from shear cracks to tensile cracks along with the increase of steel corrosion ratio.
(3)
Results concluded from Ib-value curves revealed that the proportion of larger-scale and stronger damage increases along with the steel corrosion. Furthermore, the trend of the Ib-value curve can reflect the formation and extension of cracks, which corresponds highly with the actual failure process and modes. Furthermore, a larger duration of the violent fluctuations in the Ib-value curve results in a higher the ultimate flexural load of the RC beam. Therefore, the violent degree of fluctuations for the Ib-value can be considered as the threshold to alert attention to the severity of the RC structures.
(4)
The location of cracks and their extension states can be determined by the two-dimensional localization technology of the AE signal. The denser the distribution of the AE events is, the higher the probability that cracks form in this region, which corresponds highly with the macroscopic morphology of cracks and provides a basis for further research on crack growth and spatial form.

Author Contributions

Conceptualization, Y.Z. and Y.C.; Funding acquisition, G.T.; Data curation, Y.Z., G.T., S.W. and S.Y.; Writing—original draft, S.W., S.Y. and X.S.; Writing—review & editing, Y.Z., G.T. and S.W.

Acknowledgments

The authors express their appreciation for the financial supports of National Natural Science Foundation of China (Nos. 51478203, 51408258).

Conflicts of Interest

The authors declare no conflict of interest.

References

  1. Yanweerasak, T.; Kea, T.M.; Ishibashi, H.; Akiyama, M. Effect of Recycled Aggregate Quality on the Bond Behavior and Shear Strength of RC Members. Appl. Sci. 2018, 8, 2054. [Google Scholar] [CrossRef]
  2. Cheng, Y.; Zhang, Y.; Tan, G.; Jiao, Y. Effect of Crack on Durability of RC Material under the Chloride Aggressive Environment. Sustainability 2018, 10, 430. [Google Scholar] [CrossRef]
  3. Zhou, Y.; Gencturk, B.; Willam, K.; Attar, A. Carbonation-Induced and Chloride-Induced Corrosion in Reinforced Concrete Structures. J. Mater. Civ. Eng. 2014, 27, 46–70. [Google Scholar] [CrossRef]
  4. Jang, J.G.; Kim, H.K.; Kim, T.S.; Min, B.J.; Lee, H.K. Improved flexural fatigue resistance of PVA fiber-reinforced concrete subjected to freezing and thawing cycles. Constr. Build. Mater. 2014, 59, 129–135. [Google Scholar] [CrossRef]
  5. Cheng, Y.; Zhang, Y.; Jiao, Y.; Yang, J. Quantitative analysis of concrete property under effects of crack, freeze-thaw and carbonation. Constr. Build. Mater. 2016, 129, 106–115. [Google Scholar] [CrossRef]
  6. Dekoster, M.; François, B.B.; Maurel, O.; Delmas, Y. Modelling of flexural behaviour of RC Beams subjected to localised and uniform corrosion. Eng. Struct. 2003, 25, 1333–1341. [Google Scholar] [CrossRef]
  7. Sun, J.; Huang, Q.; Ren, Y. Performance deterioration of corroded RC beams and reinforcing bars under repeated loading. Constr. Build. Mater. 2015, 96, 404–415. [Google Scholar] [CrossRef]
  8. Ye, Z.; Zhang, W.; Gu, X. Deterioration of shear behavior of corroded reinforced concrete beams. Eng. Struct. 2018, 168, 708–720. [Google Scholar] [CrossRef]
  9. Lv, H.L.; Wu, Y.Z.; Fang, Z.N.; Zhou, S.C. Deterioration behavior of reinforced concrete beam under compound effects of acid-salt mist and carbon dioxide. Constr. Build. Mater. 2015, 77, 253–259. [Google Scholar] [CrossRef]
  10. Li, H.; Li, B.; Jin, R.; Li, S.; Yu, J.G. Effects of sustained loading and corrosion on the performance of reinforced concrete beams. Constr. Build. Mater. 2018, 169, 179–187. [Google Scholar] [CrossRef]
  11. Berrocal, C.G.; Löfgren, I.; Lundgren, K. The effect of fibres on steel bar corrosion and flexural behaviour of corroded RC beams. Eng. Struct. 2018, 163, 409–425. [Google Scholar] [CrossRef]
  12. Bicer, K.; Yalciner, H.; Pekrioglu Balkıs, A.; Kumbasaroglu, A. Effect of corrosion on flexural strength of reinforced concrete beams with polypropylene fibers. Constr. Build. Mater. 2018, 185, 574–588. [Google Scholar] [CrossRef]
  13. Nikbakht, E.; Al-Fakih, A.; Hui, C.C.; Jake, L.Y.; Mahzabin, M.S. An experimental investigation on the shear and flexural behavior of steel reinforced HPSCC beams. Structures 2019, 19, 286–295. [Google Scholar] [CrossRef]
  14. Kocur, G.K.; Saenger, E.H.; Grosse, C.U.; Vogel, T. Time reverse modeling of acoustic emissions in a reinforced concrete beam. Ultrasonics 2016, 65, 96–104. [Google Scholar] [CrossRef]
  15. Ohtsu, M. Acoustic Emission and Related Non-Destructive Evaluation Techniques in the Fracture Mechanics of Concrete: Fundamentals and Applications; Woodhead Publishing Series in Civil and Structural Engineering; Elsevier: Amsterdam, The Netherlands, 2015. [Google Scholar]
  16. Suzuki, T.; Obtsu, M. Quantitative damage evaluation of structural concrete by a compression test based on AE rate process analysis core test of concrete. Constr. Build. Mater. 2004, 3, 197–202. [Google Scholar] [CrossRef]
  17. Raghu Prasad, B.K.; Sagar, R.V. Relationship between AE energy and fracture energy of plain concrete beams: Experimental study. J. Mater. Civ. Eng. 2008, 3, 212–220. [Google Scholar] [CrossRef]
  18. Geng, J.; Sun, Q.; Zhang, Y.; Cao, L.; Zhang, W. Studying the dynamic damage failure of concrete based on acoustic emission. Constr. Build. Mater. 2017, 149, 9–16. [Google Scholar] [CrossRef]
  19. Li, B.; Xu, L.; Shi, Y.; Chi, Y.; Liu, Q.; Li, C. Effects of fiber type, volume fraction and aspect ratio on the flexural and acoustic emission behaviors of steel fiber reinforced concrete. Constr. Build. Mater. 2018, 181, 474–486. [Google Scholar] [CrossRef]
  20. Bhosale, A.; Rasheed, M.; Prakash, S.S.; Raju, G. A study on the efficiency of steel vs. synthetic vs. hybrid fibers on fracture behavior of concrete in flexure using acoustic emission. Constr. Build. Mater. 2019, 199, 256–268. [Google Scholar] [CrossRef]
  21. Xu, J.; Shu, S.; Han, Q.; Liu, C. Experimental research on bond behavior of reinforced recycled aggregate concrete based on the acoustic emission technique. Constr. Build. Mater. 2018, 191, 1230–1241. [Google Scholar] [CrossRef]
  22. Tam, N.T.; Narintsoa, R.; Jean-Paul, B. Characterization of damage in concrete beams under bending with Acoustic Emission Technique (AET). Constr. Build. Mater. 2018, 187, 487–500. [Google Scholar]
  23. Tsangouri, E.E. Assessment of Acoustic Emission localization accuracy on damaged and healed concrete. Constr. Build. Mater. 2016, 129, 163–171. [Google Scholar] [CrossRef]
  24. Di, B.; Wang, J.; Li, H.; Zheng, J.; Zheng, Y.; Song, G. Investigation of Bonding Behavior of FRP and Steel Bars in Self-Compacting Concrete Structures Using Acoustic Emission Method. Sensors 2019, 19, 159. [Google Scholar] [CrossRef]
  25. Ministry of Housing and Urban-Rural Development of the People’s Republic of China. Standard for Quality Control of Concrete; Ministry of Housing and Urban-Rural Development of the People’s Republic of China: Beijing, China, 2011. (In Chinese)
  26. Ministry of Housing and Urban-Rural Development of the People’s Republic of China. Code for Design of Concrete Structures; Ministry of Housing and Urban-Rural Development of the People’s Republic of China: Beijing, China, 2011. (In Chinese)
  27. Liu, R.; Jiang, L.; Xu, J.; Xiong, C.; Song, Z. Influence of carbonation on chloride-induced reinforcement corrosion in simulated concrete pore solutions. Constr. Build. Mater. 2014, 56, 16–20. [Google Scholar] [CrossRef]
  28. Tondolo, F. Bond behaviour with reinforcement corrosion. Constr. Build. Mater. 2015, 93, 926–932. [Google Scholar] [CrossRef]
  29. Gao, Z.; Liang, R.; Patnaik, A. Effects of sustained loading and pre-existing cracks on corrosion behavior of reinforced concrete slabs. Constr. Build. Mater. 2016, 124, 776–785. [Google Scholar] [CrossRef]
  30. Ohtsu, M.; Isoda, T.; Tomoda, Y. Acoustic emission techniques standardized for concrete structures. J. Acoust. Emiss. 2007, 25, 21–32. [Google Scholar]
  31. Han, Q.; Yang, G.; Xu, J.; Fu, Z.; Lacidogna, G.; Carpinteri, A. Acoustic emission data analyses based on crumb rubber concrete beam bending tests. Eng. Fract. Mech. 2018, in press. [Google Scholar] [CrossRef]
  32. Shiotani, T.; Yuyama, S.; Li, Z.W.; Ohtsu, M. Application of AE improved b-value to quantitative evaluation of fracture process in concrete materials. J. Acoust. Emiss. 2001, 19, 118–133. [Google Scholar]
  33. Cheng, Y.; Zhang, Y.; Wu, C. Experimental and Simulation Study on Diffusion Behavior of Chloride Ion in Cracking Concrete and Reinforcement Corrosion. Adv. Mater. Sci. Eng. 2018, 12, 1–14. [Google Scholar] [CrossRef]
  34. Guo, Q.; Cheng, Y.; Tao, J. Research of Aggregate Adhesion Effect Segmentation Method in Asphalt Concrete Digital Image. J. Highw. Transp. Res. Dev. 2015, 32, 32–36. [Google Scholar]
Figure 1. Sketch of test specimen (unit: cm): (a) Front view; (b) lateral view.
Applsci 09 01640 g001
Figure 2. Experimental procedure.
Applsci 09 01640 g002
Figure 3. Sketch of the device for accelerating steel corrosion.
Applsci 09 01640 g003
Figure 4. Sketch of three-point bending test (unit: cm).
Applsci 09 01640 g004
Figure 5. The arrangement of acoustic emission (AE) sensors (unit: cm).
Applsci 09 01640 g005
Figure 6. Experimental setups for the bending test and AE test.
Applsci 09 01640 g006
Figure 7. Failure forms of corroded reinforced concrete (RC) beams: (a) Uncorroded RC beam; (b) 10% corroded RC beam; (c) 20% corroded RC beam; (d) 30% corroded RC beam; (e) 40% corroded RC beam.
Applsci 09 01640 g007aApplsci 09 01640 g007b
Figure 8. Ultimate flexural load.
Applsci 09 01640 g008
Figure 9. R/A-AF association diagram: (a) Uncorroded RC beam; (b) 10% corroded RC beam; (c) 20% corroded RC beam; (d) 30% corroded RC beam; (e) 40% corroded RC beam.
Applsci 09 01640 g009aApplsci 09 01640 g009b
Figure 10. Ib-value curves of corroded RC beams: (a) Uncorroded RC beam; (b) 10% corroded RC beam; (c) 20% corroded RC beam; (d) 30% corroded RC beam; (e) 40% corroded RC beam.
Applsci 09 01640 g010aApplsci 09 01640 g010b
Figure 11. Localization of AE events and cracks: (a) Uncorroded RC beam; (b) 10% corroded RC beam; (c) 20% corroded RC beam; (d) 30% corroded RC beam.
Applsci 09 01640 g011aApplsci 09 01640 g011b
Table 1. Mixture proportions of concrete.
MaterialsNominal Proportions (kg/m3)
Cement433
Water195
Fine aggregate567
Coarse aggregate1205
Table 2. Applied current value for theoretical mass loss.
Steel Corrosion RatioAverage Line Density (kg/m)Corrosion Length (mm)Mass Loss (g)Corrosion Duration (s)Current Intensity (A)
10%0.3954015.886,4000.63
Table 3. Maximum and minimum values of the improved b (Ib)-value curves.
Ib-Value Curves for RC BeamsMaximum ValueMinimum Value
Uncorroded RC beam0.1290.032
10% corroded RC beam0.1160.031
20% corroded RC beam0.1040.031
30% corroded RC beam0.0870.046
40% corroded RC beam0.0830.028

