Article

Quantitative Assessment of the Environmental Impacts of Dredging and Dumping Activities at Sea

1
Sustainable Management of Natural Resources and Environment Research Group, Faculty of Environment and Labour Safety, Ton Duc Thang University, Ho Chi Minh 70000, Vietnam
2
School of Civil and Environmental Engineering, Faculty of Engineering and Information Technology CB11.11.213, University of Technology, Sydney 2007, Australia
3
Water Resources Institute, No. 8 Phao Dai Lang str., Dong Da, Hanoi 10000, Vietnam
*
Author to whom correspondence should be addressed.
Appl. Sci. 2019, 9(8), 1703; https://doi.org/10.3390/app9081703
Submission received: 15 March 2019 / Revised: 15 April 2019 / Accepted: 19 April 2019 / Published: 25 April 2019

Abstract

:
The dumping of dredge materials often raises concerns about the release of pollutants to the marine environment. Wind data from the Global Forecast System (GFS) model was used to simulate the wind-wave propagation from offshore in a two-dimensional (2D) model during September and October 2016. The calibration and validation of the 2D model showed a high conformity in both the phases and amplitude between the observed and simulated data. The 2D mud transport simulation results of three scenarios showed that the concentration of suspended material in the third scenario tested (scenario 3) was greater than 0.004 kg/m3 in the low tide, spreading to a 9 km2 area, and in the high tide, the concentration was 0.004 kg/m3 in a 6 km2 area. Finally, the results of 2D particle tracking (PT) showed changes in the seabed due to the concentration of dredged material, and its dump (approximately 180 days) increased from 0.08 m to 0.16 m in 2.85 ha. In scenario 3, the element block moved quite far—approximately 2.9 km—from the dredge position. Therefore, the simulation results were qualified, as the dredging position situated far from the sea is significantly affected by the direction and velocity of wave-wind in the dredging position.

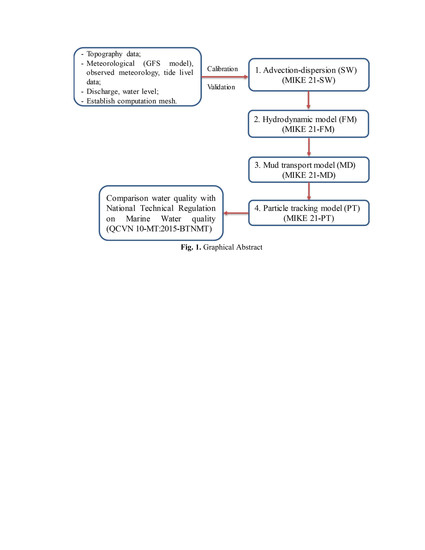
Graphical Abstract

1. Introduction

Dredging is a crucial activity, regularly carried out to maintain safe passage for boats and ships at ports and harbors [1,2,3,4,5,6]. In another sense, dredging is important for maintaining harbor operations, i.e., importing and exporting goods. However, the disposal of dredged spoil at sea can potentially affect the marine environment and its ecosystems [7,8]. The dredging and dumping of spoils at sea inevitably increase the turbidity levels and settlement of fine sediment over an extended area [9,10]. This can propagate to a large area around the dumped location [11,12,13,14,15,16,17,18]. The dumping of spoils can lead to the smothering of the seabed environment, coral reefs, egg-laying nests of fish and can disturb their navigations [19,20,21]. Finally, dredging and dumping change the topography of the seabed at both the dredging and dumping locations and therefore, can change local flow patterns [22]. As a result, dredging and its related activities should be monitored, controlled and their impacts on the marine environments should be evaluated [23].
The Qui Nhon Port is one of the largest international ports in Central Viet Nam, with a capability to berth ships up to 30,000 tons at the regular operating frequency [24]. The port serves for the exchange of goods between Binh Dinh Province and the Central and Central Highland Viet Nam, as well as for Cambodia, Laos, and Thailand. To maintain navigation, dredging is usually carried out twice per year. Existing considerations are the method of dredging and location of suitable locations to dump the spoils without adversely affecting the surrounding environment. Diggers are used to dredge the port area. The dredged spoils are transported in hopper barges that open at the bottom. The barges have specialized designs and are typically used for transporting and disposing of dredged materials, in order to ensure environmental protection in a cost-effective manner. In particular, this method can minimize the diffusion of dredged materials and limit the increased turbidity in seawater. In this manner, it can minimize the impacts on the surrounding ecological environment.
To evaluate the effect of dredging and dumping activities on the marine environment, previous studies have mostly used two- and three-dimensional models [25,26,27,28,29,30,31,32] based on field data, calibration and validation for realistic assessment of the physical process and simulation of the sediment dispersion of the bed load movement of the dredged materials near the port [33,34,35,36,37,38,39,40,41]. This study combines the two-dimensional (2D) numerical approach (using MIKE 21) with numerical weather predictions (Global Forecast System (GFS) model) and is a new modeling approach for the assessment of dredging and dumping activities in Viet Nam. The study develops a two-dimensional hydrodynamic advection-diffusion model to simulate the propagation of contaminants in dredged materials to the sea with the assumption that the total volume of dredged materials from Quy Nhon port is transported by barges to the dumping location. The principal objective was to assess the impacts of dredging and dumping using a hybrid modeling approach (numerical weather prediction and hydrodynamics). The aims of this study were (1) the simulation of wind-wave propagation from offshore to the study area using wind data from the GFS global model in a 2D model, (2) the validation and calibration of wave height in a 2D model, (3) the validation and calibration of the hydraulics using the 2D model, (4) the simulation of the sediment transport process in a 2D mud transport (MT) model, and (5) the simulation of the diffusion of materials at the dumping location in a 2D particle tracking (PT) model.

2. Materials and Methods

2.1. Description of Study Site

The study site is located inside Quy Nhon and the Thi Nai Port, encompassing an area of 95.1 ha (Figure 1). Quy Nhon Port, 68.10 ha in surface area, belongs to the Hai Cang commune. Its eastern boundary is adjacent to vessels operating at the port, Dong Da Port is to the west, boat shelters are located at the Thi Nai lagoon in the south. Quy Nhon Port is one of the ten largest ports in Viet Nam and serves vessels that can load up to 30,000 tons with the regular operating frequency, and the port capacity is 10 million tons per year. The dredging and maintenance requirements of Quy Nhon Port play an important role in the transportation, evaluation, and selection of dredging location and dredging volume. The dredging area is 7.6 km from the port, 4.6 km from Hai Giang seashore, and 8.7 km from the Ghenh Rang tourist attraction (Figure 1). The water depth at the dredging position is approximately −28 m to −30 m.
A dredger boat was used to dredge the bed surrounding the port. The spoils are transported by means of a hopper barge with a bottom discharge. The spoils can be dumped at sea by opening the floor of the barge, minimizing the diffusion of these materials in water and the turbidity of the ocean, thereby reducing the negative effects on the surrounding ecological environment. The impacts of discharge on the surrounding environment were evaluated using a combination of spectral wind-wave and 2D flow model, the mud transport module and the particle tracking module.

2.2. Model Description

In this study, the wave field data was an important factor to support the calculated water quality spread process. A two-dimensional (2D) spectral wind-wave (SW) model was used to simulate the wave field in the study area. This model was used to calculate the wave field based on unstructured meshes. This model calculated the growth, decline and transmitted waves generated by wind and swells in offshore and nearshore areas. The dynamics of the gravity wave was simulated based on the equation of the wave action density [42,43]. The formula was used in the Cartesian coordinate system for small areas; spherical polar coordinates were applied to large areas. The conservation equation for wave action is expressed as follows:
N t + · ( ν ¯ N ) = S σ
where N ( x ¯ , σ , θ , t ) is the action density; t is the time; x ¯ = ( x , y ) is the Cartesian coordinates; ν ¯ = ( c x , c y , c σ , c θ ) is the propagation velocity of a wave group in the four-dimensional phase space x ¯ , σ and θ ; S is the source term for the energy balance equation, and is the four-dimensional differential operator in the x ¯ , σ , θ -space.
The governing equations of unsteady 2D flow are based on the nonlinear, vertically integrated 2D equations of conservation of mass and momentum to delineate variations in the flow and water level of all the grids [44]. The continuity equation representing the conservation of mass is given as follows:
ς t + p x + q y = 0
The momentum equation in the x-direction is as follows:
p t + x ( p 2 h ) + y ( p q h ) + g h ς x + g p p 2 + q 2 C 2 · h 2 1 ρ w [ x ( h τ x x ) + y ( h τ y y ) ] Ω q f V V x + h ρ w x ( p a ) = 0
The momentum equation in the y-direction is as follows:
q t + y ( q 2 h ) + x ( p q h ) + g h ς y + g p p 2 + q 2 C 2 · h 2 1 ρ w [ y ( h τ y y ) + x ( h τ x y ) ] Ω q f V V y + h ρ w x y ( p a ) = 0
where p and q (m3/s/m) are the fluxes in the x- and y-directions, respectively; t (s) is the time, x and y (m) are the Cartesian coordinates; h (m) is the water depth; d is the time-varying water depth (m); g (9.81 m/s2) is the acceleration due to gravity; ζ (m) is the sea surface elevation; C is a Chezy resistance parameter (m1/2/s); f(V) is the wind friction factor; V, Vx, and Vy are the wind speed and its components in the x- and y-directions (m/s), respectively; Ω is the Coriolis parameter, which is latitude dependent(s−1); Pa is the atmospheric pressure (kg/m/s2); ρw is the density of water (kg/m3); and τxx, τxy, τyy are the components of effective shear stress.
Sediment transport formulations are built into advection-dispersion module, 2D-AD. 2D solves the advection-dispersion equation as follows:
c ¯ t + u c ¯ x + ν c ¯ y = 1 h x ( h D x c ¯ x ) + 1 h y ( h D y c ¯ y ) + Q L C L 1 h S
where c ¯ is depth averaged mass concentration (kg·m−3) u; ν is depth averaged flow velocities (m·s−1); Dx and Dy are dispersion coefficients; h is water depth; S is the deposition/erosion term (km·m−3·s−1); QL is the source discharge per unit horizontal area (m3·s−1·m−2); and CL is the concentration of the source discharge (kg·m−3). The bottom shear stress τ b (N·m−2) is calculated with respect to current and waves using following equation:
τ b = 1 2 ρ f w ( U b 2 + U δ 2 + 2 U b U δ cos β )
where ρ is the density of water (kg·m−3); fw is the wave friction factor; Ub is the horizontal mean wave orbital velocity at the bed (m·s−1); U δ is the current velocity at top of water boundary layer (m·s−1); and β is the angle between the average wave direction and the observed wave direction (degree). Formula for sediment deposition was originally proposed by Krone (1962) [45] as
S D = w s C b p d
where SD is deposition rate (kg·m−3·s−1); ws is settling velocity (m·s−1); Cb is near bed concentration (kg·m−3); pd is probability of deposition which is calculated by
p d = 1 τ b τ c d , τ b τ c d
where τ b is bed shear stress (N·m−2) and τ c d is critical bed shear stress for deposition (N·m−2). Settling velocity, ws, described flocculation process. Flocculation is when the concentration of sediment is high enough for the sediment flocs to influence each other settling velocity. The modification of settling velocity also computed due to salinity variation.
w s , s = w s ( 1 C 1 e s · C 2 )
where ws,s is settling velocity due to salinity variation; C1 and C2 are calibration parameters; and S is salinity. Erosion formula was described as soft partly consolidated sediment [46].
S E = E e x p [ α ( τ b τ c e ) 1 / 2 ] , τ b > τ c e
where SE is the erosion rate (g·m−2); E is the erosion coefficient (g·m−2·s−1); τ c e is critical bed shear stress for erosion (N·m−2); and α is coefficient (m·N−0.5).
The overall transport of particles during a time interval, Δ t , results from an advective component and a dispersive component, which accounts for the non-resolved flow processes. The particle transport equation at the i’th time step can be expressed as:
x ¯ i + 1 = x ¯ i + ν ¯ · Δ t + D _ _ · V ¯ + γ ¯
where
V ¯ = ( u x u y V s e t t ) ; | U ¯ | = u x 2 + u y 2 ; D _ _ = 1 | U ¯ | ( Δ D L Δ D T 0 Δ D L Δ D T 0 0 0 0 ) ; γ ¯ = ( Δ D 0 Δ D 0 Δ D 0 W )
Δ D L is longitudinal dispersion caused by turbulence; Δ D T is transversal dispersion; Δ D 0 is neutral dispersion; Δ D 0 W is dispersion caused by wind acting on the surface; x ¯ i is particle coordinates in three dimensions at time steps i (m); Δ t is time steps (s); ux and uy are horizontal current velocities (m/s); Vsett is settling velocity (m/s); DL is the longitudinal dispersion coefficient (m2/s); DT is the transversal dispersion coefficient (m2/s); D0 is the neutral dispersion coefficient (m2/s); and Dw is dispersion due to wind (m2/s).

2.3. Data Collection

2.3.1. Wind Data Collection

During the period from September to November, cold weather occurs accompanied by storms, tropical cyclones and the intertropical convergence zone in the south-central region. The prevailing wind from September to November blows from the northeast with intensities that increase from 21.6% to 51.6% (the greatest intensity is in November with the value of 51.6%) (Table 1, Figure 2). The winter monsoon lasts from December to January of the following year. This is advantageous as it is a high-pressure system. Subsidiary high-pressure systems along the eastern sea of China, with frequencies ranging from 60–70%, stabilize the winter monsoon. During this period, the prevailing wind blows from the northeast, with frequencies between 44–51%. A drop in the winter monsoon is usually observed from February to March. Although the winter is still harsh, the frequency of the winter monsoon reduces to approximately 10%. The high-pressure systems along the eastern sea of China with higher intensities account for 70% of the winter monsoon, while the Pacific high-pressure systems account for the rest of the winter monsoon. The prevailing wind in Quy Nhon still blows from the northeast, with a reduced frequency between 30–40%.
In addition to the changes in air from the polar region, high pressure cold continental winds move to the east, splitting from the Siberian high, and another subsidiary high-pressure system appears near the tropics and diffuses along the eastern sea of China. This high pressure affects the humidity, is warmer than the continental polar air mass and causes an increase in intensity of 26%, together with the southeast wind in March. Throughout the second half of April and early May, this period experiences a conflict between western and eastern systems, because cold high-pressure decreases, western low pressure moves to the east and becomes more intensive, reversing the subtropical high pressure to the east. The wind in the East Sea gradually changes direction from southeasterly to northerly, convective clouds develop strongly in mountainous areas, subtropical high pressure affects the East Sea, but the effect slowly moves to the north along with the low range equator. In this period, the prevailing wind at Quy Nhon station is in the southeast direction, with the intensity ranging from 32–37%.
From June to August, in the low range, low pressure warm air, originating from the Burmese–Indian border, tends to change direction from the east to the southeast. The monsoon season in northern China, accompanied by tropical cyclones during the monsoon of South Asia, is closely associated to the southwest monsoon season. In the upper atmosphere, the Pacific subtropical high is degraded by the weakness and retreats to the south of the subtropical west wind. The subtropical high in the Southern Hemisphere gently ascends to the north to provide a chance for the southeast wind of the high-pressure area of Australia to move above the equator. A low equatorial ridge also ascends to the north to become active at 16° N–20° N, and accordingly, a tropical cyclone is formed to stimulate a southwest monsoon. However, due the effect of the topography, the prevailing wind at Quy Nhon Port is in the southeast direction, with a frequency from 19–26%. Moreover, during this period, the southwest and north winds dominate at Quy Nhon Port, with a frequency from 10–20%. In reality, the monsoon does not blow continuously and constantly, but periodically. Therefore, during the monsoon periods, the wind magnitude is relatively small, and the observed wind speed is 0 m/s; this is known as “calm wind” (written as “Calm” on the wind rose) (Figure 2). According to the statistics for Quy Nhon Port, the greatest frequency of calm wind was seen from April to October, and the frequency fluctuated from 23–26% (Table 1).
Another important factor of the feature of the wind regime is the wind speed. The wind speed in coastal areas is likely to be more intensive than on the Mainland. In Quy Nhon, the annual average wind speed in the mainland fluctuates from 2.4–2.6 m/s, with monthly fluctuation from 1.8–4.2 m/s (Table 2). The greatest fluctuation occurs in September and December (according to statistics over the past 5 years) and is approximately 3.1–3.2 m/s.

2.3.2. The Regime of Tide

The research area is affected by two types of tide: Semidiurnal tide and irregular tide. The number of days when semidiurnal tide occurs is between 18–22 days each month, and irregular tide occurs the rest of the month. There is a small waterflow in the low tide. The time of the high tide is often longer than the ebb tide. The amplitude of tide ranges from 1.5–2 m, and this hardly changes in high tide. However, between the high tide and low tide, the magnitude changes considerably. At low tide, the flood rises and ebbs in a range of 0.5 m. At Quy Nhon station, there are four days of semidiurnal tide. The peak tide rises at 5.30 pm and ebbs most rapidly at 11.30 am in midiurnal tide, while the peak tide rises at 6.30 am and ebbs most rapidly at 7.00 am in the semidiurnal tide, with 1.53 m of the high tide and 0.61 m of the low tide.
According to statistics of Quy Nhon station, which is located at 13°46′ North–109°13′ East, the regime of tide is mostly irregular. Apart from general features, the amplitude of the tide in this area also depends on the hydraulic discharge of Kon River and Ha Thanh River that discharges to sea. The average tidal amplitude over the years at Quy Nhon ranges from 2.2 m to 2.3 m, and the maximum tidal amplitude is 2.6 m. The tidal peaks are often observed in October, November and December and the historical record was measured on 3 December 1986 at 3.06 m. The lowest peak is observed in July and August, and 0.36 m was the lowest measured tide on 8 August 1987.

2.3.3. The Characteristics of Streamflow

The characteristics of streamflow at Quy Nhon area is influenced by two monsoon periods including the northeast and southwest: (1) During the northeast monsoon, the streamflow in the estuary is virtually in the south-southwest direction. The streamflow in bottom layer is in the southeast direction going away from the shore. The streamflow speed in coastal areas is about 10–14 cm/s; the flow in the estuary area has a higher speed of about 20–25 cm/s. The flow speed at the middle layer is between 10–15 cm/s and the flow speed at the bottom layer is between 7–9 cm/s. (2) During the southwest monsoon, the flow at surface layer at the estuary area is to the north. The flow in coastal area in the south area is to the northwest. The flow at the bottom layer throughout the study area is virtually in the northeast direction from offshore to coastal. The flow speed in the northwest is between 3–14 cm/s; the flow speed in the remaining areas is between 20–28 cm/s. The flow speed at the middle layer and the bottom layer ranged between 13–18 cm/s, 5–9 cm/s, respectively. Finally, the flow at Quy Nhon area is strongly influenced by the China East Sea circulation system under the influence of monsoons.

3. Results

3.1. Calibration and Validation Spectral Wind-Wave (SW) Model

3.1.1. Establishing Mesh in SW 2D Model

To evaluate wave propagation in the study area, the bathymetry within the wave mesh was surveyed and expanded to a wide area. The computation grid is an unstructured grid of the whole study area. The computation mesh had a total of 9083 grids and 4857 nodes. The computation mesh can produce detailed results in the study area with its small and smooth grids while reducing computation steps with the use of more sparse grids offshore. An unstructured grid was established for the offshore zone with the maximum mesh size 3000 m and for the coastal area with the minimum mesh size 50 m (Figure 3b). It was then used to create the wave mesh for the study area (Figure 3a). Based on topographic features of the study area, the wave in the South China Sea hardly propagates in the Quy Nhon port. The wave at Quy Nhon port is normally generated from the wind. As the wind speed and velocity are relatively small, the wave in the port is small as well. The front of the port (the east of the port) is hardly affected by waves. Parameters were chosen based on the interaction between outside and inside the study area to outline its border (Figure 3b). The northern boundary of the study area ranges from 14°00′ N, 109°15′ E to 14°00′ N, 109°30′ E, the southern boundary ranges from 13°30′ N, 109°30′ E to 13°30′ N, 109°15′ E, and the eastern boundary ranges from 14°00′ N, 109°30′ E to 13°30′ N, 109°30′ E (Figure 3b).
Nowadays, the application of the products of meteorological models such as Global Forecast System (GFS), Weather Research and Forecasting (WRF) as input for hydrological and hydraulic 2D models is increasingly popular and effective [40,47,48]. The wind statistics are produced from the NOAA GFS model, with a resolution of 0.5 degrees and a time span of 3 h at ftp://nomads.ncdc.noaa.gov/GFS/Grid4. The Climate Data Operators (CDO) tool and Grid Analysis and Display System (GraDs) were used to produce wind direction and velocity to provide input data for a simulation spectral wind-wave model (SW). The simulation results were produced from 1 September 2017 to 31 October 2017.
The collected wind data at Ly Son station was used to evaluate the simulation results (wind direction and velocity) produced from the numerical weather prediction at the study area. The wind statistics from the GFS model are highly reliable, with the modification of real data from global ocean observing stations. The data is suitable for the simulation of the wave regime in the study area. The results of the wave field were used to produce input data for the hydraulic model MIKE 21 HD.

3.1.2. Calibration and Validation of Spectral Wind-Wave in 2D Model

In the seaside of Nhon Hai ward, the sea is relatively deep, the slope of the shoreline is steep, and the 20 m isobath is 15 km from the shore. In the study area, the wave regime is suitable for the wind regime, and the wave regime is divided into two seasons. In the winter, the direction of the wave is northeast (NE) with an average height between 0.8 and 0.9 m, and it may range from 1.1 to 1.2 m during the first three months. The biggest wave varies from 4.0–4.5 m. In the summer, the direction of the wave is south west (SW) and southeast (SE). The average height ranges from 0.6 to 0.7 m. The largest wave can be 4.0 m.
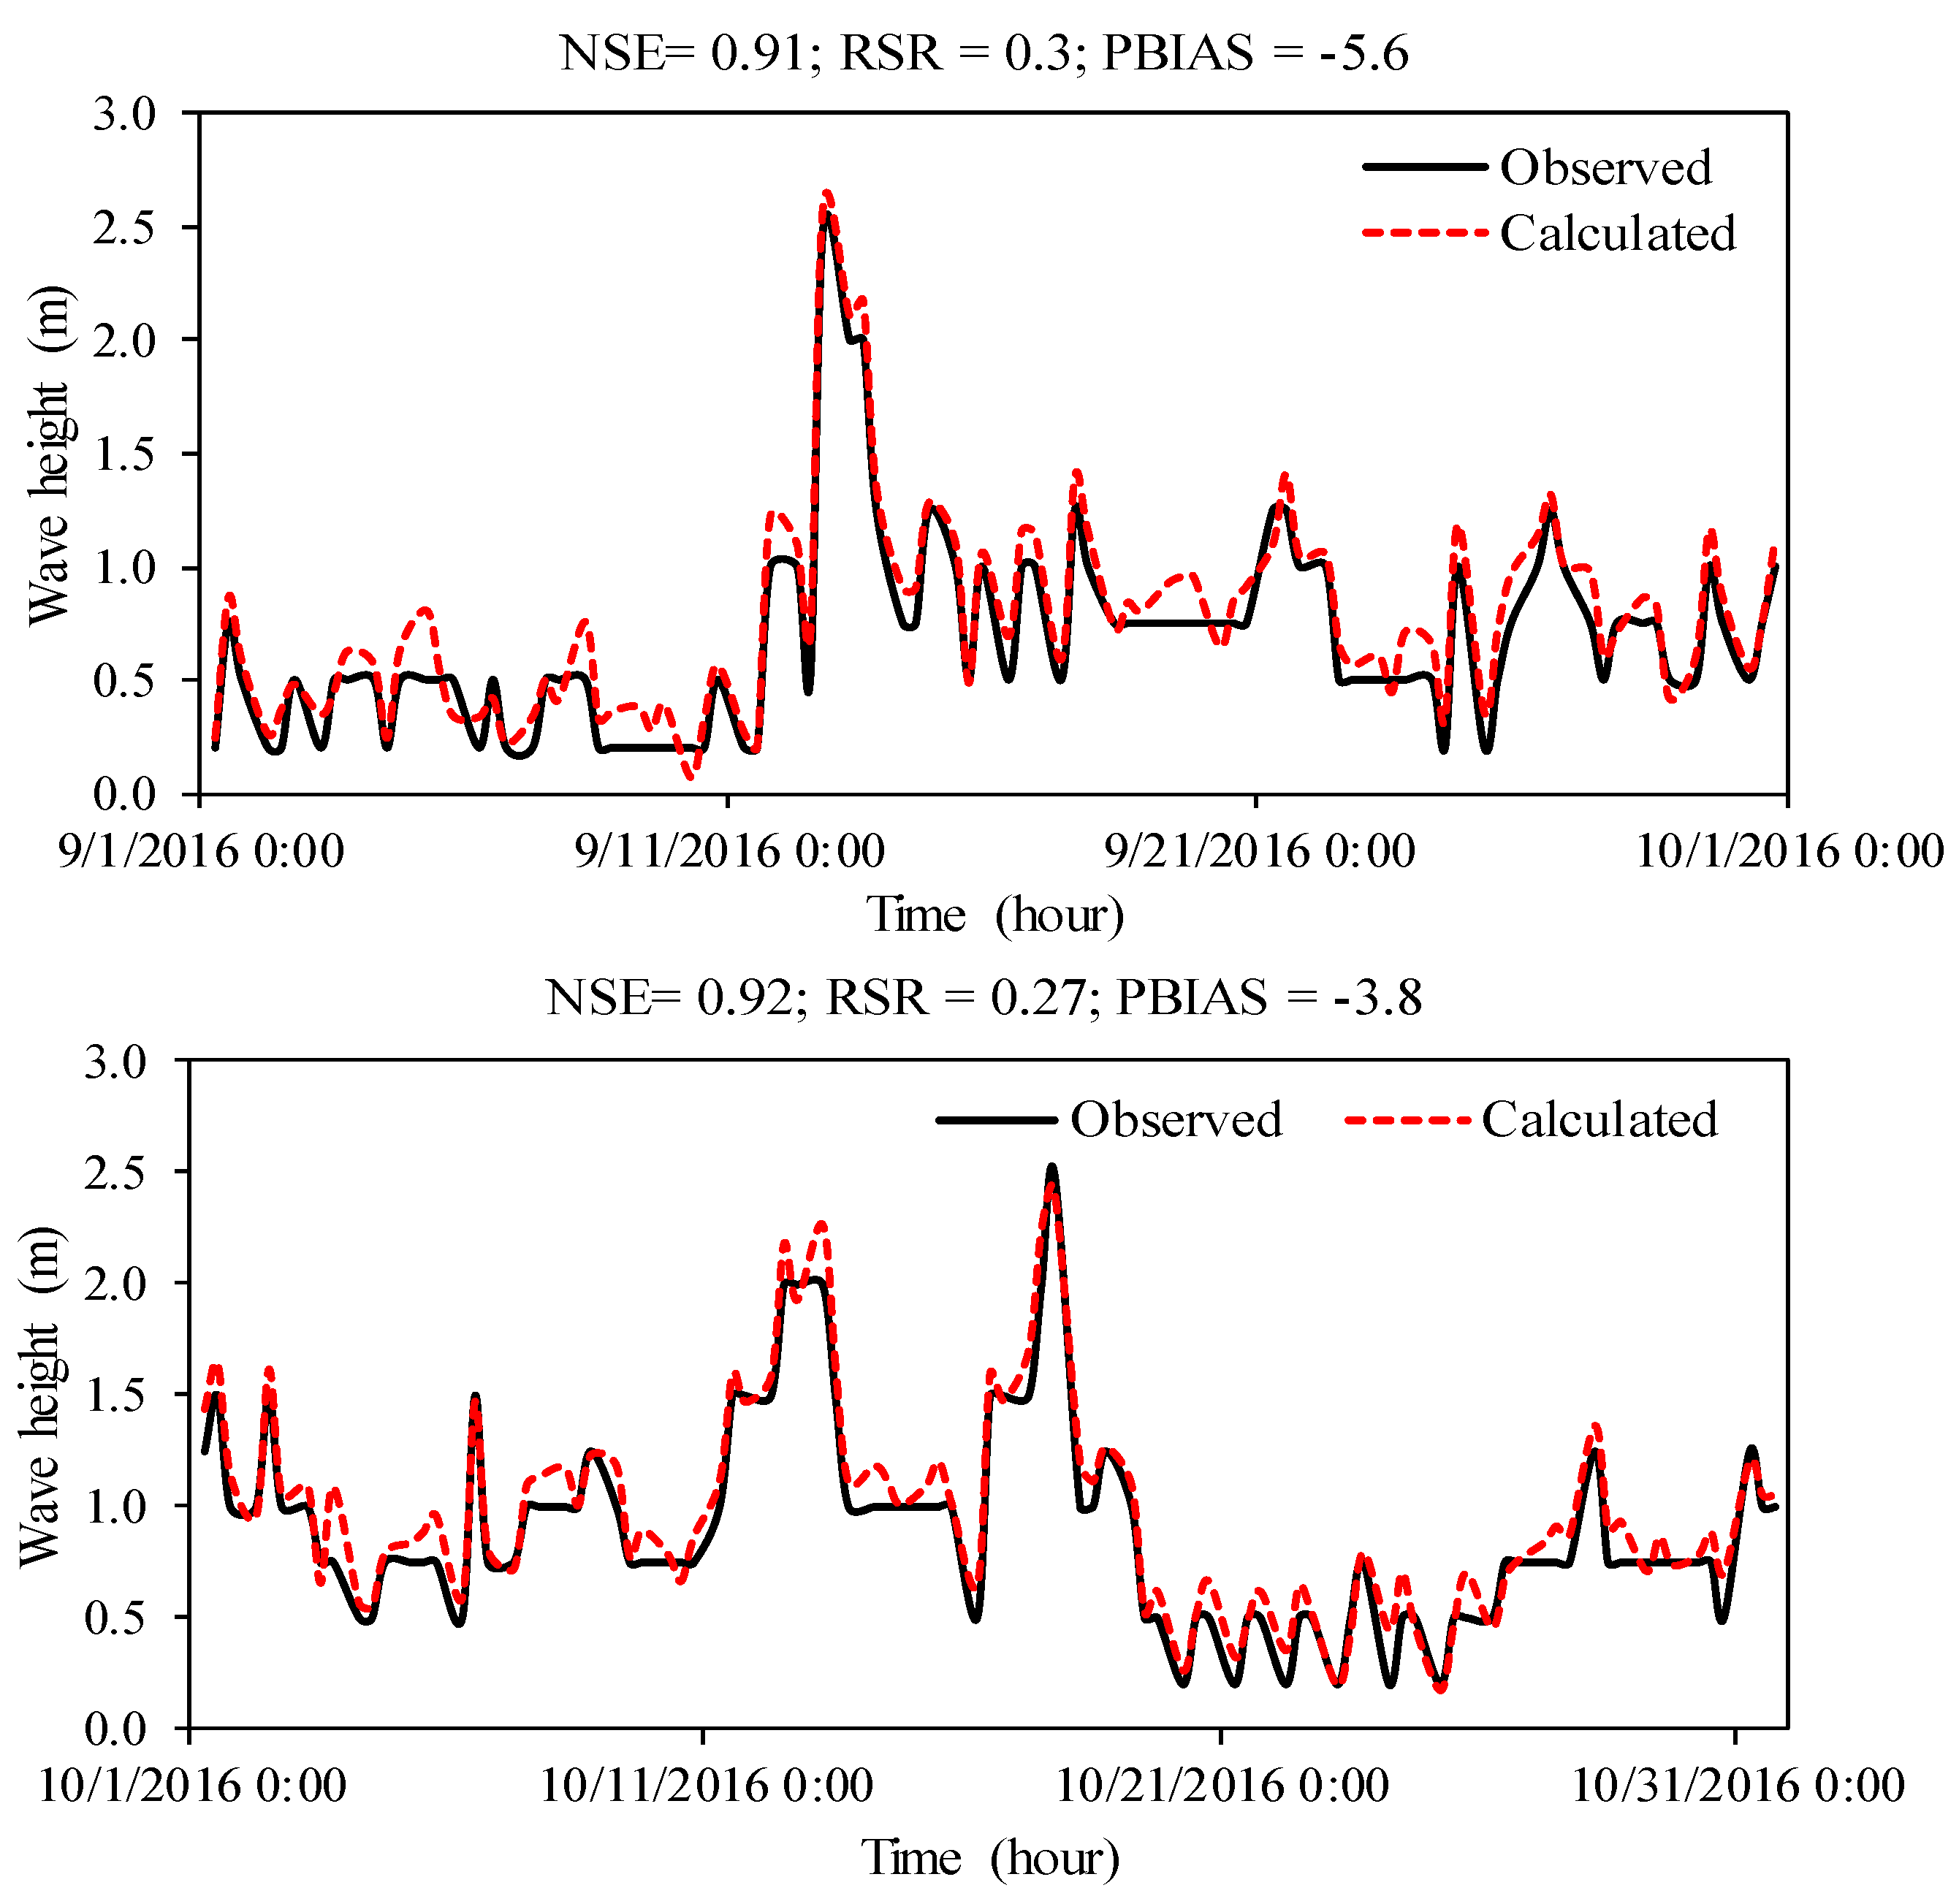
The calibration and validation of spectral wind-waves in a 2D model was undertaken using observed wave height data at Ly Son station during 1–30 September 2016 and 1–31 October 2016, respectively. The calculation of the wave characteristics showed that the simulated and observed wave heights were in good agreement in terms of the vibration amplitude, absolute value, and tidal phases during both the calibration and validation processes (Figure 4). The Nash–Sutcliffe efficient (NSE) [49] values ranged from 0.91 to 0.92 in the calibration and validation processes. Root mean square error (RMSE)-observations standard deviation ratio (RSR) values ranged from 0.27–0.3 in both calibration and validation. Percent bias (PBIAS) values for calibration and validation ranged from −5.6% to −3.8% (Percent Bias (PBIAS) < ± 10%) [50]. During the southwest monsoon, the 2D SW model simulated the general trend of the wave peaks well. The parameters obtained in calibration were maintained in the validation process with the bottom friction, based on Nikuradse roughness, ranged from 0.038–0.04 m. Dissipation coefficients white-capping (Cdis and Delta dis) were 4.5 and 0.5, respectively. The wave breaking coefficient ranged from 0.68–0.73. The validation results showed that the 2D SW model had successfully simulated the wave propagation in the study area (Figure 5). The parameters were reliable enough to conduct the wave field simulations under different scenarios in the study area.

3.2. Calibration and Validation of Hydrodynamic in 2D Model

Calibration and validation of hydrodynamics in the 2D model used an observed water level tide at Quy Nhon station during 1–30 September 2016 and 1–31 October 2016, respectively. In this study, Nash–Sutcliffe efficient (NSE), Percent bias (PBIAS), and RMSE-observations standard deviation ratio (RSR) were used to evaluate the observed and simulated water levels [49,50]. The results of the calculated and observed water levels were in good agreement in terms of the vibration amplitude, absolute value, and tidal phases during both the calibration and validation processes (Figure 6). The NSE value for calibration and validation of the water level at Quy Nhon station ranged from 0.84–0.86. The maximum tide peak error in calibration and validation were 0.14 m and 0.16 m, respectively. According to the guidelines for model evaluation [50], the 2D model simulated the streamflow trends very well, as demonstrated by the statistical results, which were in agreement with the graphical results. The RSR values ranged from 0.32–0.44 for both calibration and validation. The PBIAS values ranged from −4.7 to −3.5 for both calibration and validation. The average magnitude of the simulated values had a good performance rating (PBIAS < ± 10%) for both calibration and validation. The simulation results for the streamflow regime using the 2D model were very good in terms of performance ratings, as revealed by NSE, RSR, and PBIAS. The calibration parameters used in the model validation process were the bed resistance Manning coefficients, which varied from 52–57 (m1/3/s), the eddy viscosity coefficient (Smagorinsky) [51,52,53], which ranged from 0.28–0.32 (m2/s), and wind friction, which ranged from 0.0018–0.002. The time step was 72 s. The last parameters were used to simulate mud transport in the dumping zone of the 2D model under different scenarios.
The model results showed that the flow field in the study area was strongly impacted by topography, flow in the river, wind and wave fields (Figure 7). The flow field has tremendous fluctuations in both direction and speed. This means that the flow field can impact the sedimentation process differently in the various scenarios. To avoid this, the study decoupled the hydrodynamic module and mud transport module in the 2D model to simulate the sedimentation of the submerged zone.

3.3. Result of Mud Transport (MT) in 2D Model

The scenarios tested in the mud transport module are as below:
Scenario 1 (S1): Using the reanalysis of wind data from September and October 2017 produced from the NOAA GFS model for the study area.
Scenario 2 (S2): Calm wind
Scenario 3 (S3): Using the wind direction from September and October 2017, and additionally, the wind velocity reaches Beaufort level 4, with a wind speed of 6,7 m/s.
The simulation time was from 10 September 2017 to 30 September 2017, the time step for the simulation was 72 s, and the iteration was 60,000 steps.
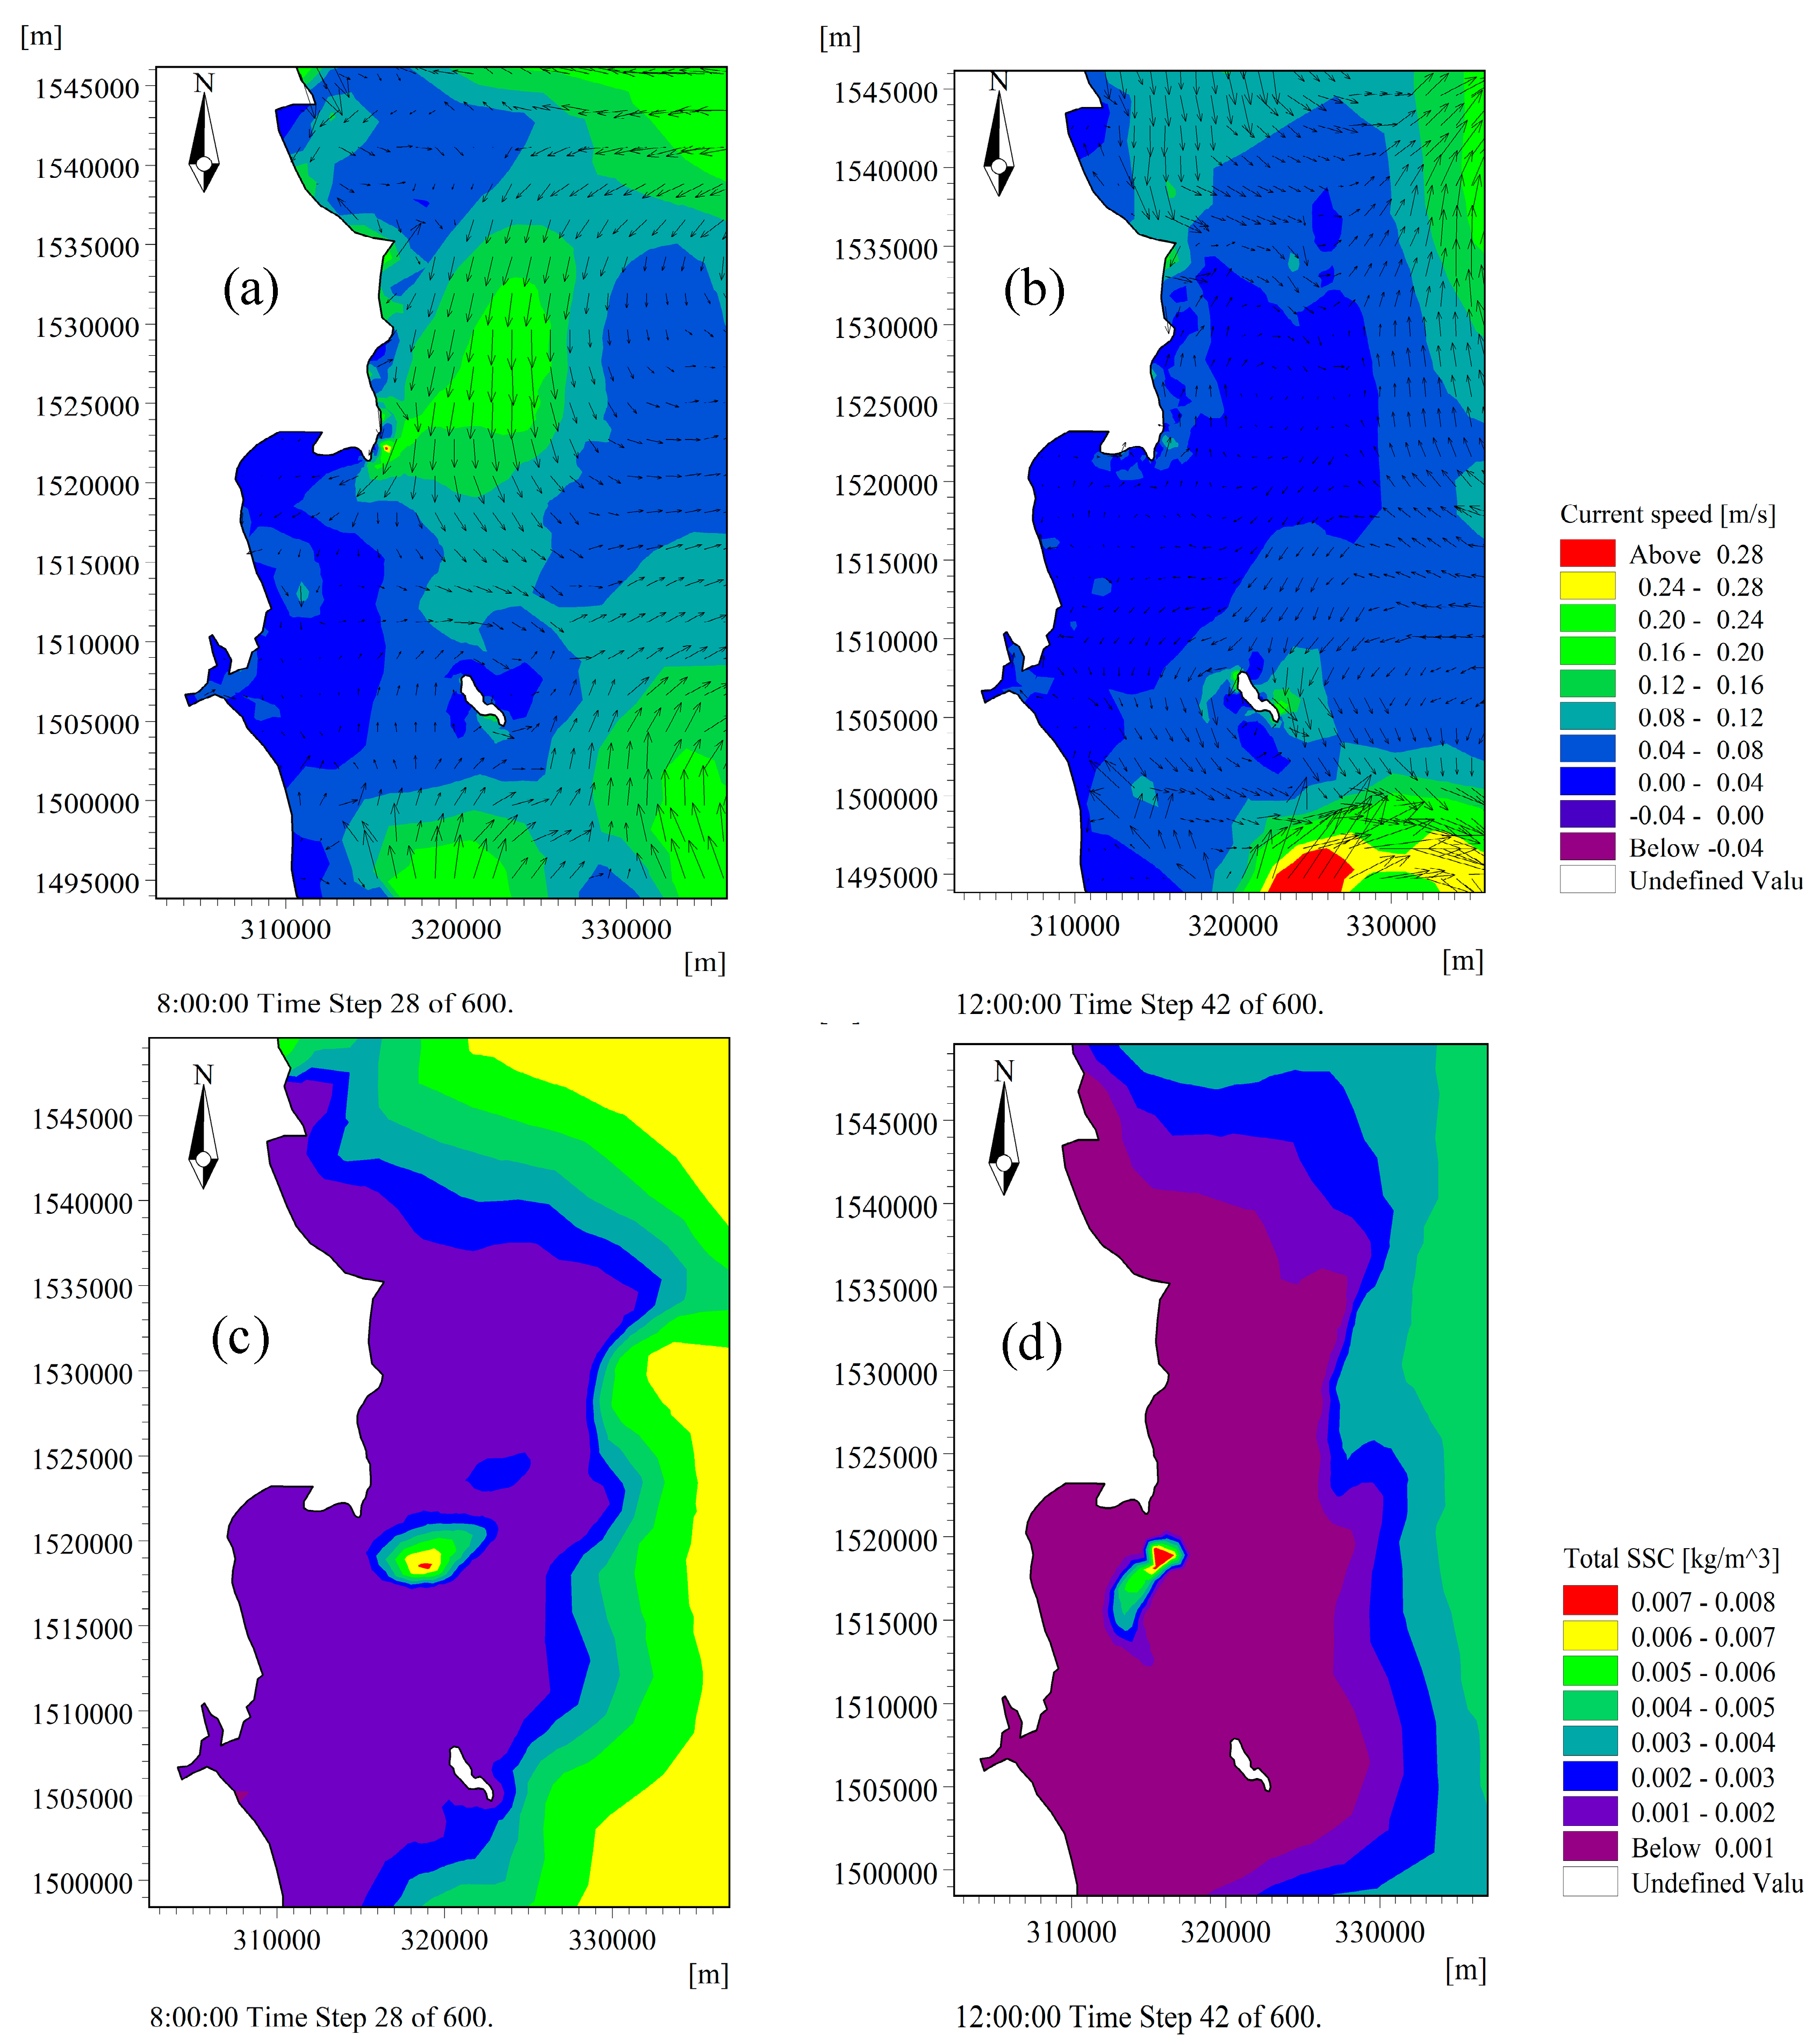
Scenario 1 (S1): This scenario applied the reanalysis of wind data in September and October 2017 produced from the NOAA GFS model for the study area. The results of the hydraulic simulation demonstrated that streamflow velocity fluctuated from 0.08–0.72 m/s in the dredged area, streamflow velocity fluctuated from 0.08–0.16 m/s in the dredged area, the tidal flow in high tide could reach 0.36 m/s, and the flow velocity in the dredged area ranged from 0.12–0.28 m/s in the southeast (Figure 8a,b).
The hydraulic results affected the diffusion of total suspended solids (TSS) in the 2D MT model. Based on the results, the concentration of floating sludge under calm wind was 0.08 kg/m3, which is below the acceptable limit (the tolerance limit of QCVN 10-MT:2015/BTNMT [54] is 0.5 kg/m3). At low tide, the concentration was higher, at 0.0072 kg/m3 diffused in an area of 6 km2, but at high tide, the concentration was greater than 0.0045 kg/m3 in an area of 8 km2 (Figure 8c,d). However, this concentration was much lower than the acceptable limit; therefore, the dumping of dredged materials in this area was unlikely to increase the concentration of suspended material to beyond the acceptable limit.
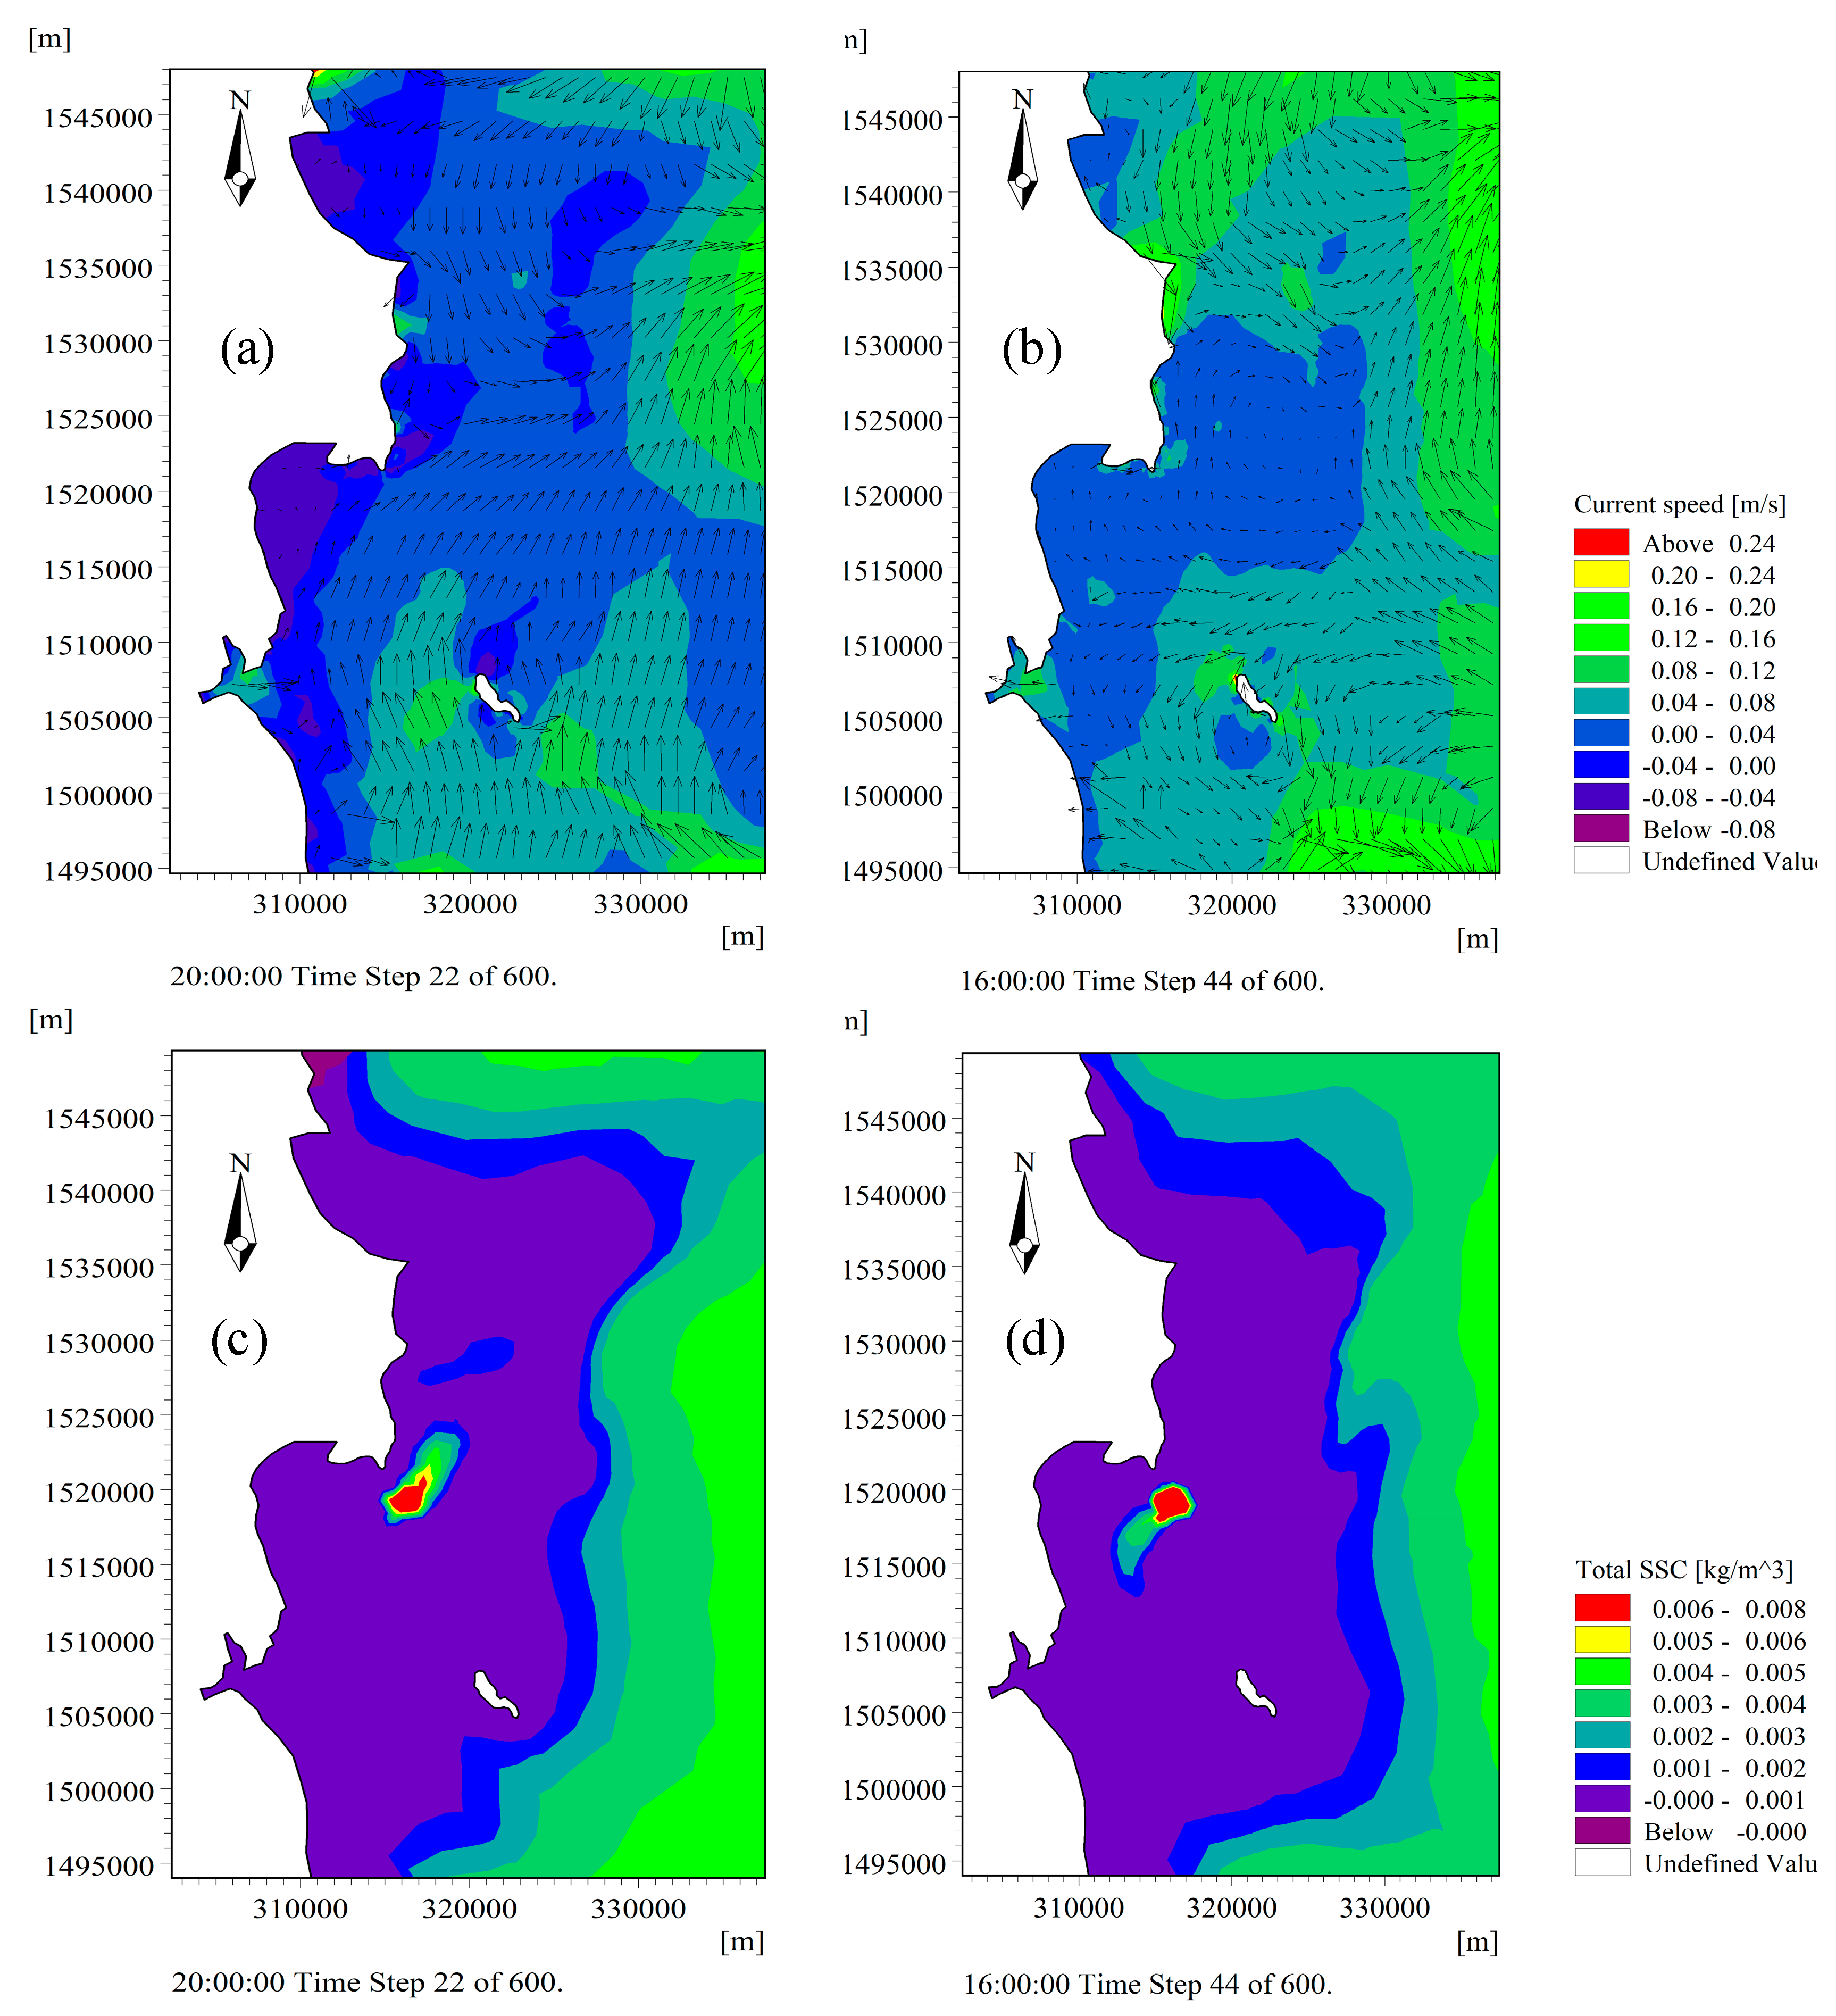
Scenario 2 (S2): The simulation in calm wind showed that during peak and low tides, the flow velocity was smaller than 0.03 m/s. In the dredged area, flow velocity was in the southwest during the peak tide and in the west during low tide. In the ebb tide, flow velocity was northeast, at 0.04–0.36 m/s. At high tide, the flow was upstream, southwest, at 0.03–0.05 m/s (Figure 9a,b).
The streamflow in the dredged area was quite stable, and the velocity was similar in both high and low tides. Therefore, the effect of streamflow on the concentration of total suspended solids was minimal. The suspended material moved to the northeast in the ebb tide and moved upstream to the southwest in the high tide. As a result, the distribution of the suspended material was an elliptical shape with the northeast–southwest axis. The simulation results showed that the maximum concentration of suspended sludge was under the acceptable limit [54] (the acceptance of QCVN 10-MT:2015/BTNMT is 0.5 kg/m3). The concentration of suspended sludge was greater than 0.004 kg/m3, spread over a 3 km2 area (Figure 9c,d). However, this concentration was much smaller than the acceptable limit, so dumping dredged materials in this area is unlikely to adversely increase the concentration of suspended material.
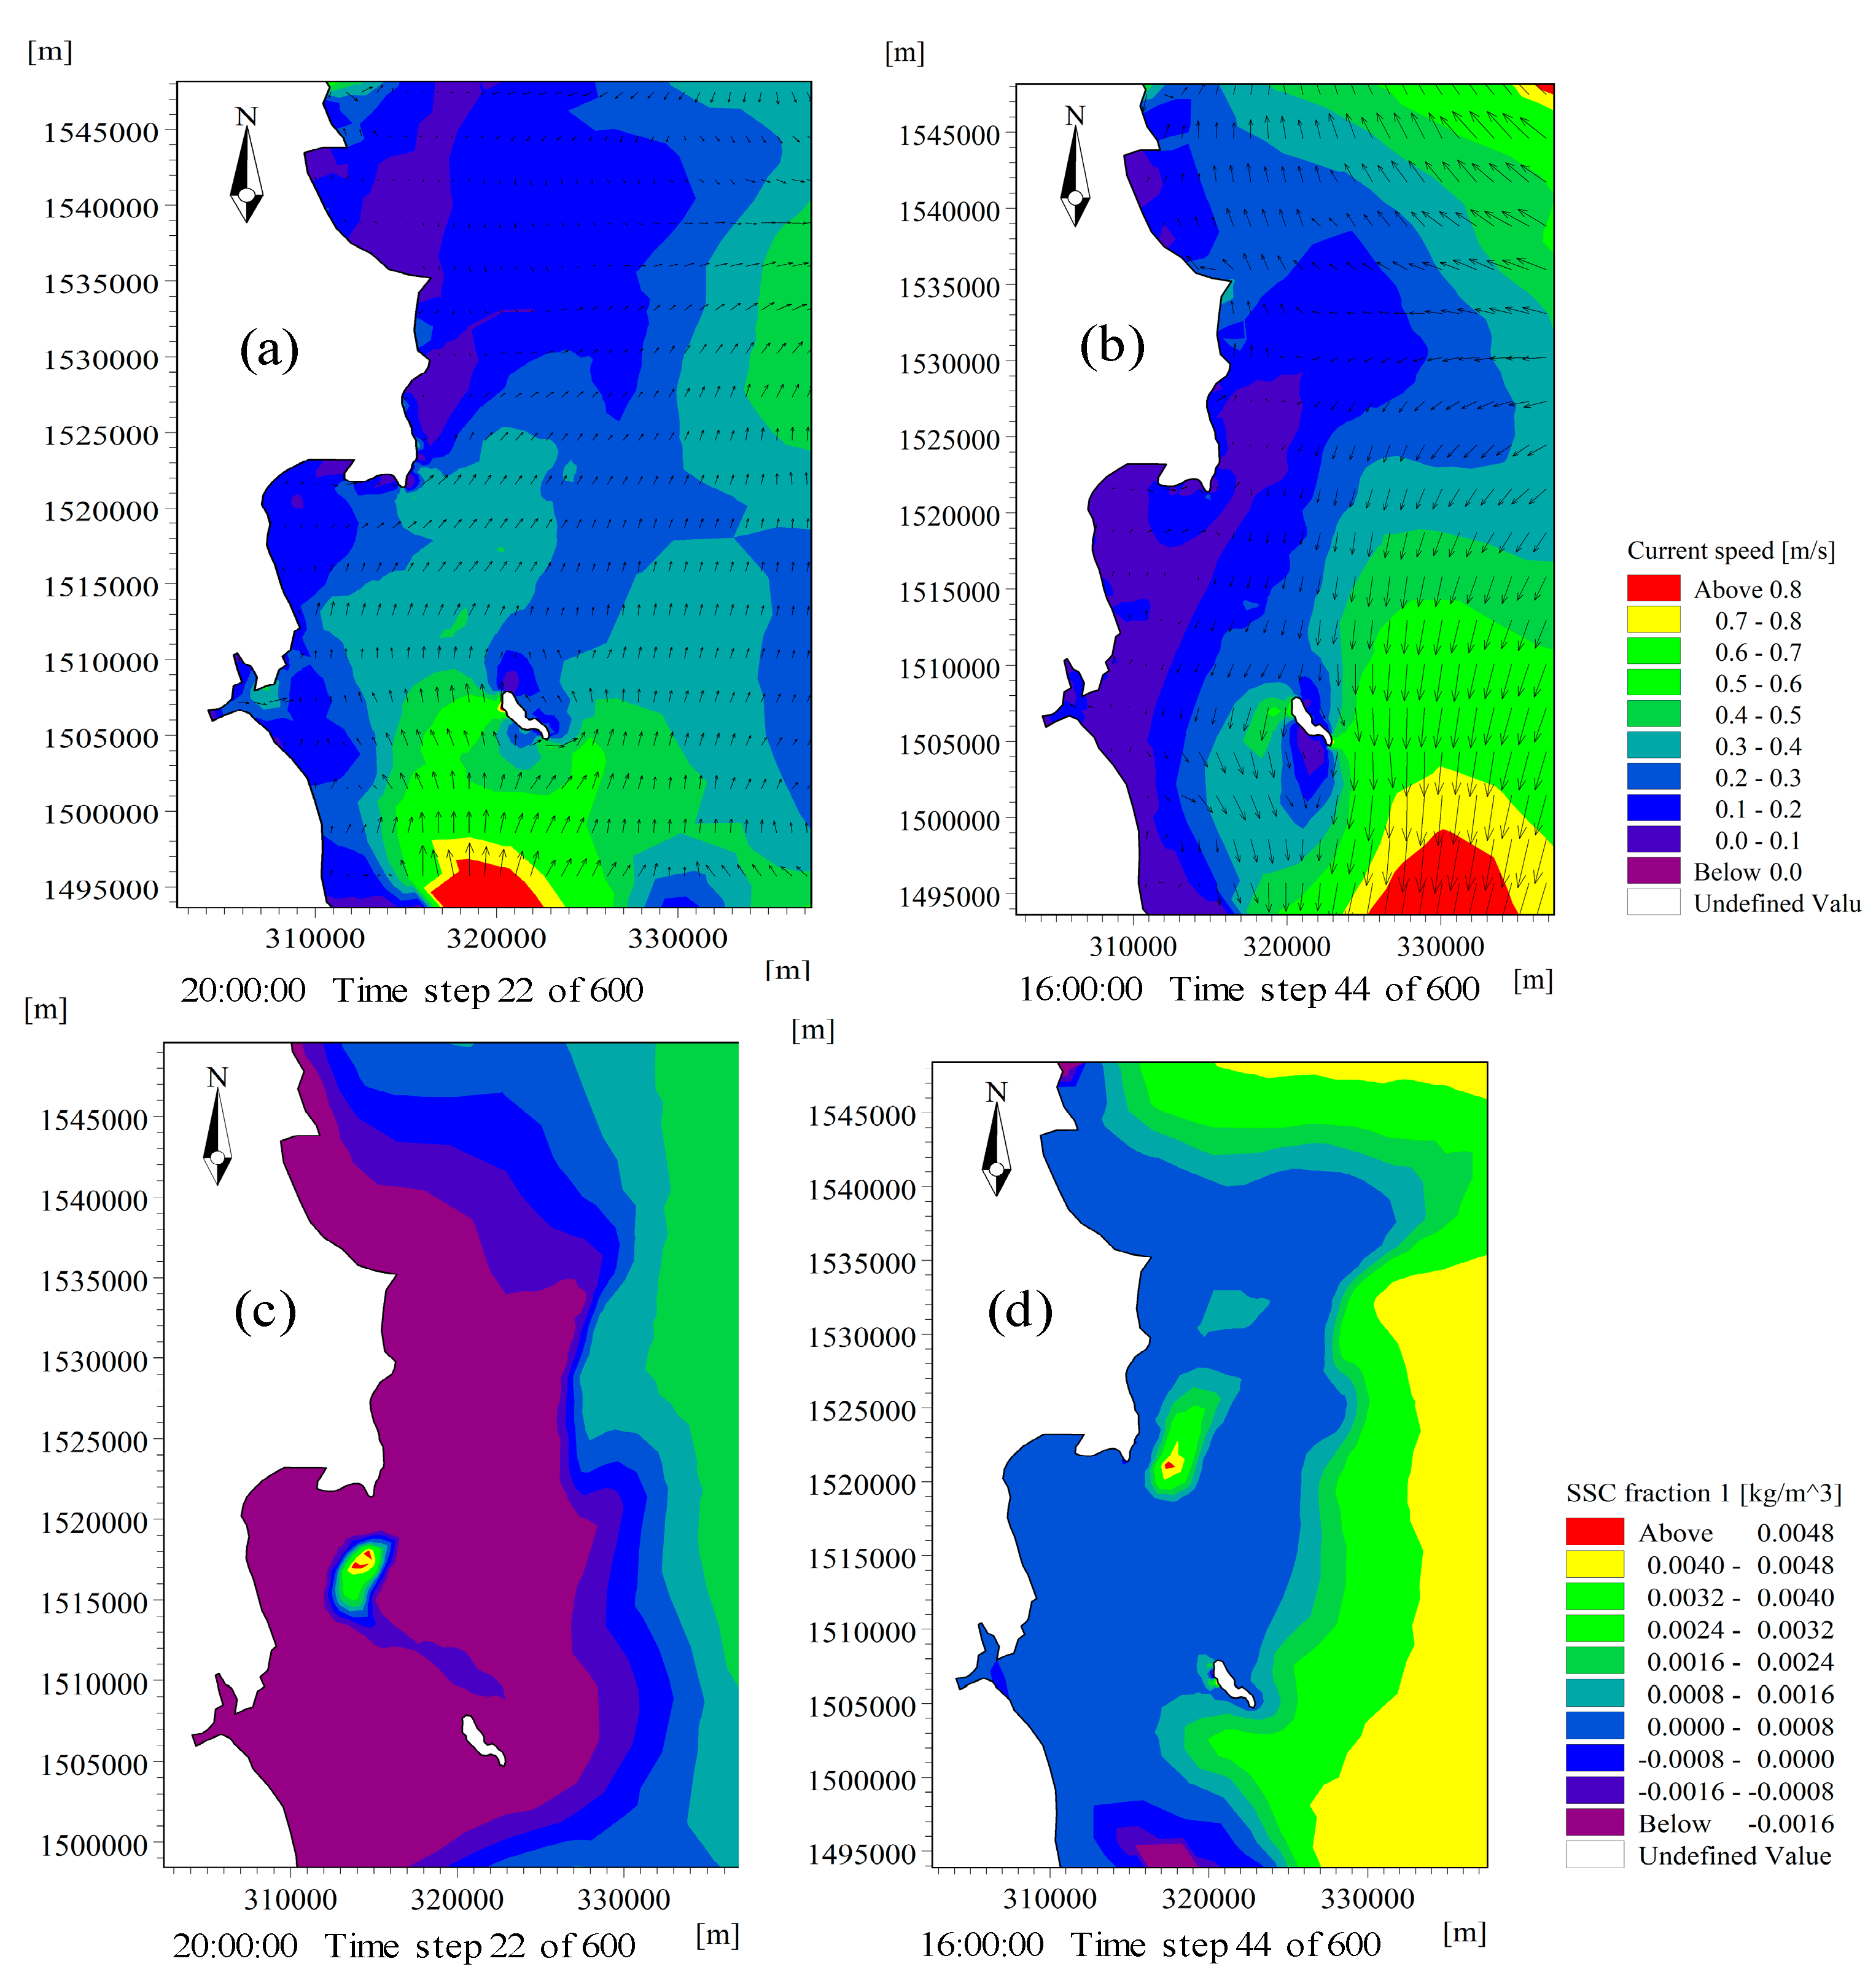
Scenario 3 (S3): According to the simulated wind velocity during September and October 2017, the wind blew from the north to the south. At the dredged area, the direction of streamflow was southwest, and the current speed ranged from 0.08–0.24 m/s. At the outside of Hon Kho, the current speed could reach 0.6–0.75 m/s. During the ebb tide, the direction of run-off was similar, from the north to the south. At the dredged area, the streamflow was southwest, with speeds from 0.15–0.45 m/s. The streamflow outside Hong Kho extended to the south, with speed from 0.32–0.48 m/s (Figure 10a,b). The simulation of sediment sludge showed that the concentration was less than 0.05 kg/m3 (the acceptable limit of QCVN 10-MT:2015/BTNMT [54]). At low tide, the concentration of suspended material was greater than 0.004 kg/m3, spread over a 9 km2 area, and during high tide, the concentration was 0.004 kg/m3 over a 6 km2 area (Figure 10c,d). However, this concentration was much lower than the acceptable limit, so the dump of dredged material in this area was unlikely to adversely increase the concentration of suspended material.

3.4. Results of Particle Tracking (PT) in 2D Model

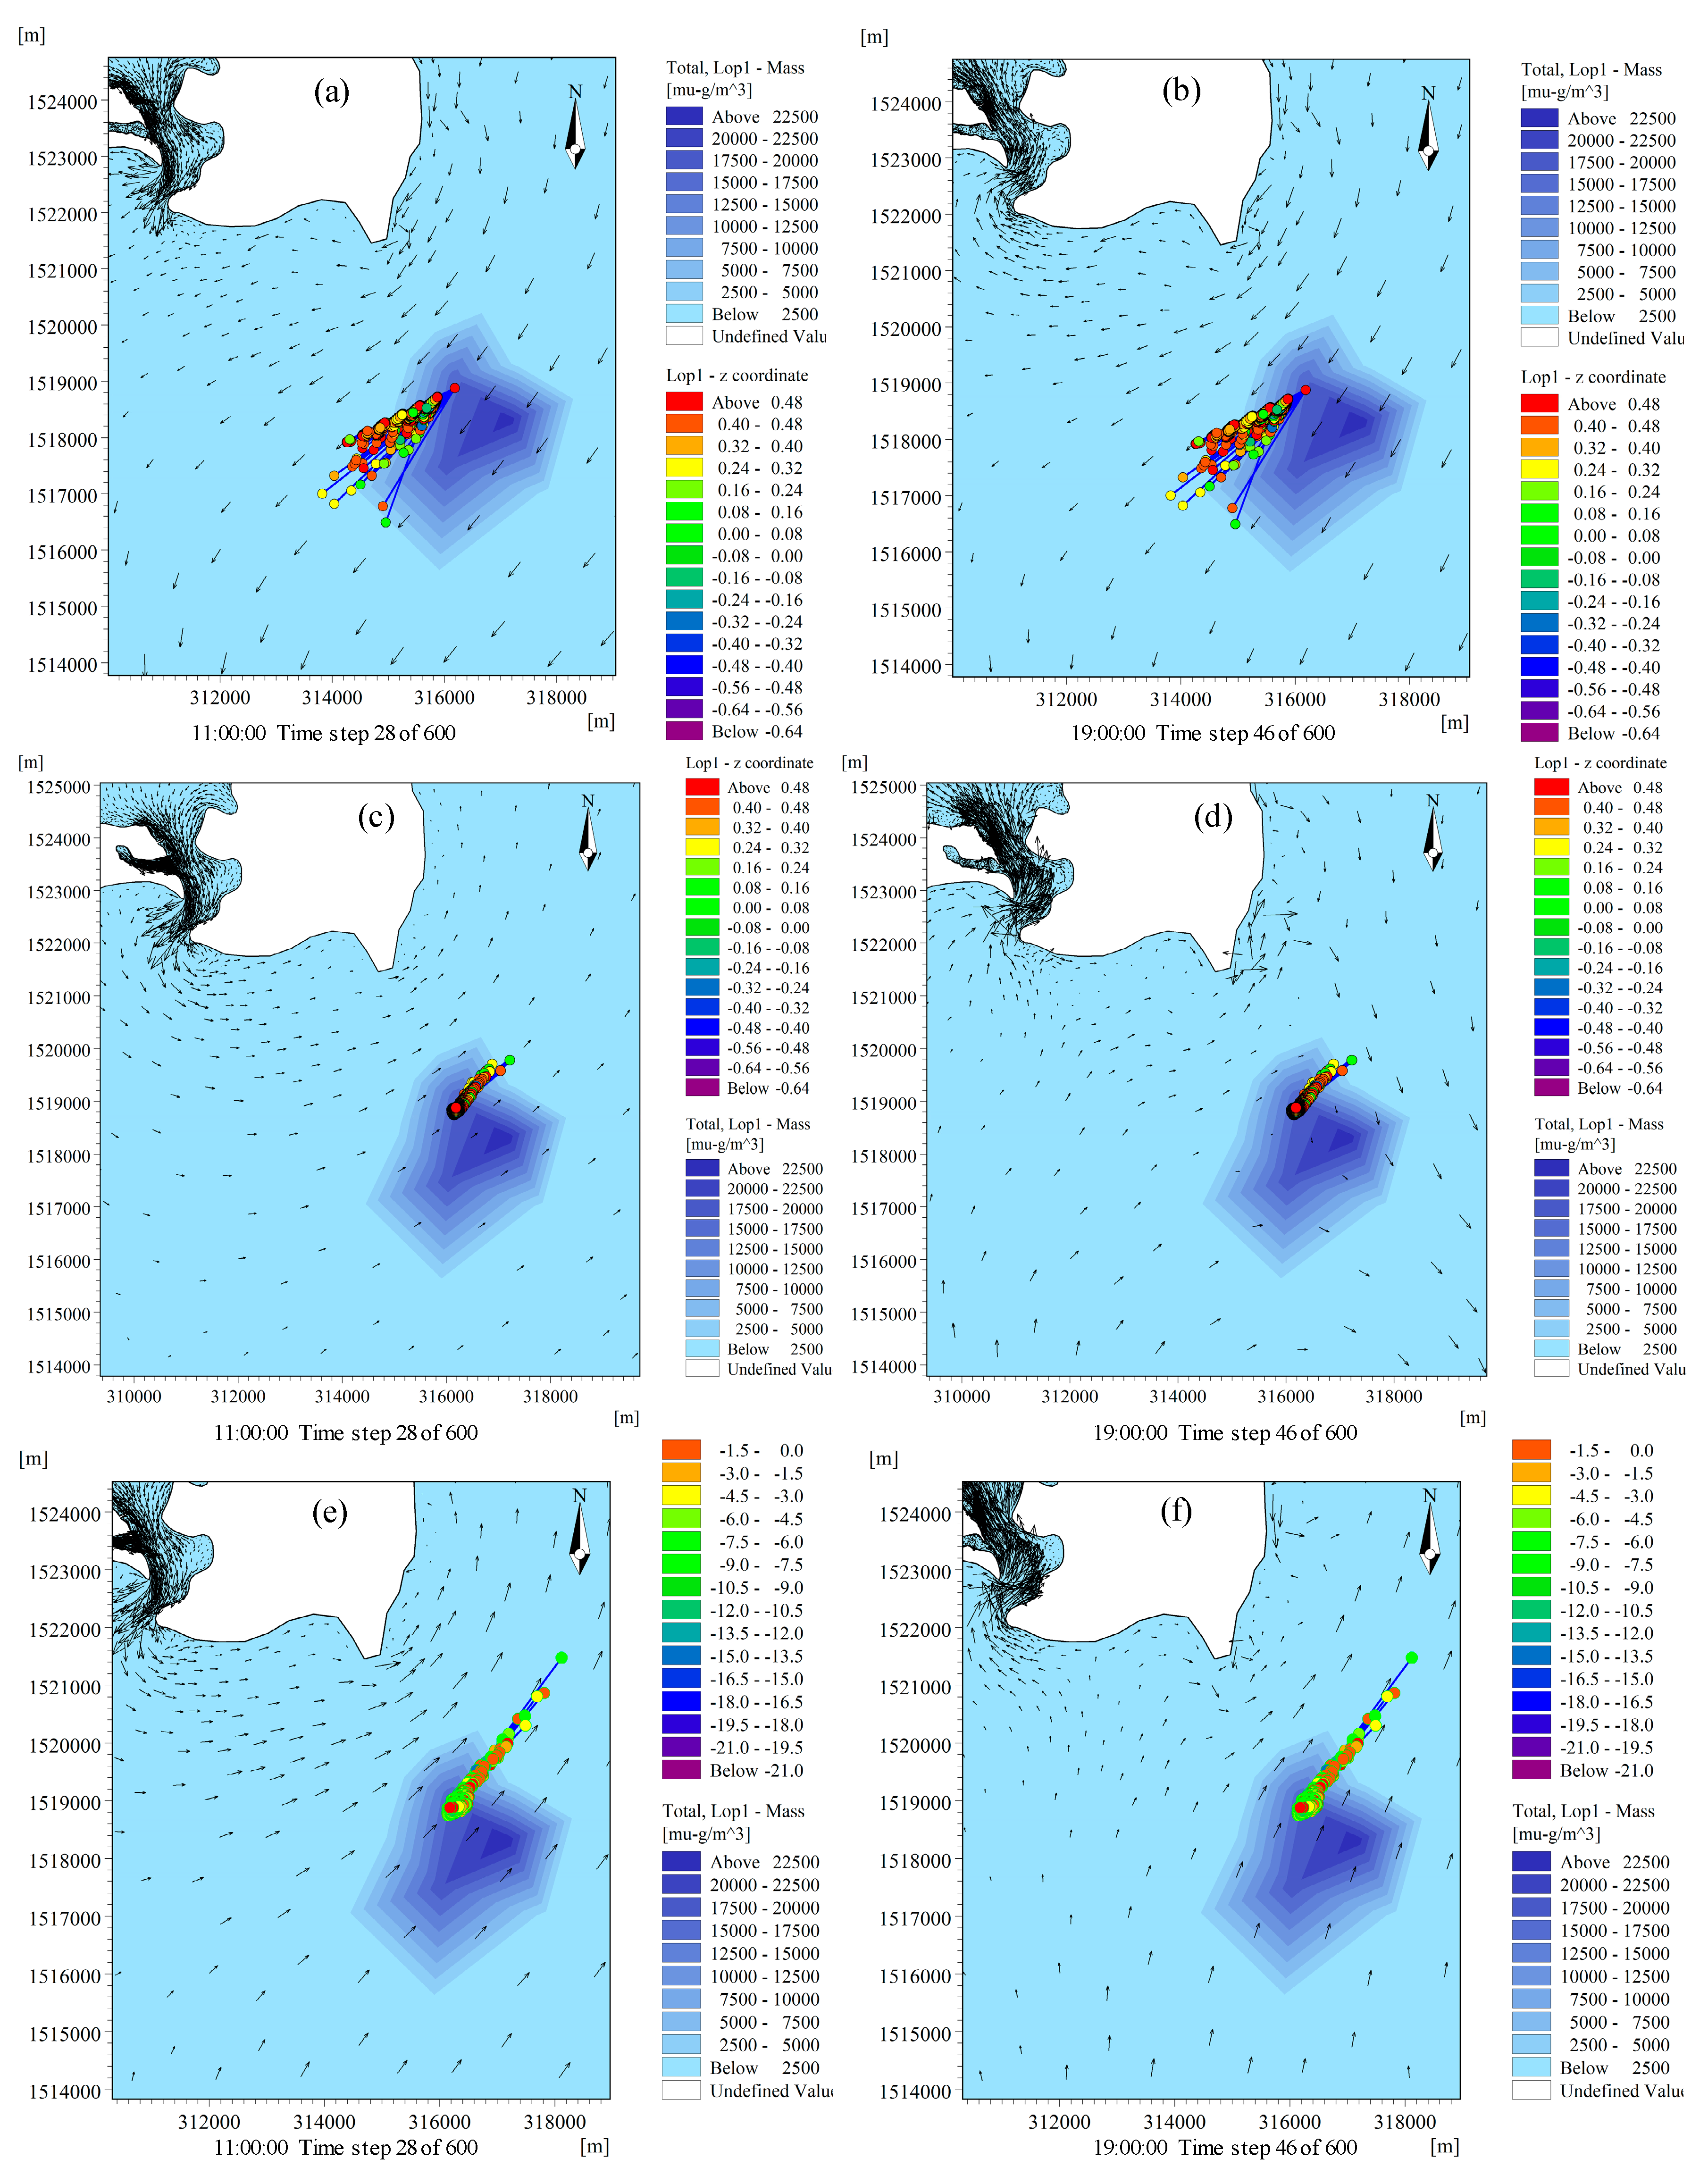
The impact of the dumped spoils on water quality of Nhon Hai commune, Quy Nhon resulted from the concentration of suspended material. The landfill of dredged material was 2.6 km to the south of the Nhon Hai commune (Figure 1). The dredged material, transported to the landfill by a hopper barge, was dumped in the following steps: The bottom door of the hopper barge was opened, and the material fell out of the deck and plunged into the sea. To evaluate the environmental impacts of dredge deposits, the study undertook a 2D model simulation, assuming that the dredged material was transported by a hopper barge at a rate of 2304 m3/day; the concentration of suspended solids at the dumping position was 0.04 m3/s and 0.50% of particles split from the dumped materials. MIKE 21 PT was decoupled from the hydraulic MIKE 21 HD. The simulated streamflow, as well as its momentum, would affect the concentration of the material. The results of the simulation of the three scenarios: Northeast (S1), calm wind (S2), and southwest (S3), are shown in Figure 11. The parameters of particle tracking (PT) used to simulate these scenarios in the 2D model are presented in Table 3. The distribution of sediment and the transmission distance of sediment particles are presented in Figure 11. After dumping, the seabed level in scenario 1 (S1) did not increase considerably (0.04 m); however, the seabed level in scenario 3 (S3) increased by 0.1 m to 0.2 m, and the seabed level increased by 0.05 m in the calm wind scenario (S2). The results of MIKE 21 PT show the following changes in seabed at the dumping position:
-
In the case of calm wind (S2) and northeast wind (S1), the changes in seabed level due to the dumping of spoils were relatively similar.
-
The increase in seabed level due to the dumping of spoils over a period of approximately 180 days was between 0.08–0.16 m over 0.0285 km2.
As for the movement of particles at the dredged position, the element block moved to under the dredging position approximately 2.4 km in S1, and above the dredging position in S2 approximately 1.3 km. In S3, the element block moved quite far from the dredging position, approximately 2.9 km. Therefore, the results of the simulation were qualified, as the dredging position was situated far from the sea; therefore, it is significantly affected by the direction and velocity of wave and wind in the dredging position.

4. Conclusions and Discussion

The study simulates and evaluates the effects of dumping dredged spoils at Quy Nhon Port, which is one of the largest ports in Central Viet Nam. The dredging and maintenance of Quy Nhon Port play an important role in the transportation, evaluation and selection of dredging position and dredging volume. This study applies a 2D numerical model to simulate the propagation of contaminants in dredge materials to the marine environment, with the assumption that the total volume of dredged materials from Quy Nhon Port is transported by barges to the dumping location.
The reanalysis of wind data from the NOAA GFS model, with a high resolution of 0.5 degrees and a time span of 3 h, was used to simulate the wave-wind propagation in the 2D model. The simulation results were from 1 September 2017 to 31 October 2017. The calculated results of wave characteristics showed that the simulated and observed wave height were in good agreement in terms of the vibration amplitude, absolute value, and tidal phases in both the calibration and validation processes. The parameters were reliable enough to conduct wave field simulations under different scenarios in the study area. Calibration and validation of hydrodynamics in the 2D model used an observed water level tide at Quy Nhon station during 1–30 September 2016 and 1–31 October 2016, respectively. The results of the calculated and observed water levels were in good agreement in terms of the vibration amplitude, absolute value, and tidal phases, during both the calibration and validation processes.
The results of hydrodynamics and spectral wind-wave in the 2D model were used to simulate three scenarios using the mud transport module in the 2D model. The simulation results showed that the maximum concentration of suspended sludge was below the acceptable limit (the acceptance of [54] QCVN 10-MT:2015/BTNMT is 0.5 kg/m3) for all three scenarios. The study used the particle tracking (PT) module in the 2D model to evaluate the environmental impact of dredge materials. The dredged materials were transported by hopper barge at 2304 m3/day; the concentration was 0.04 m3/s at the dredging position and 0.5% particles split from the dumped materials. The simulated results of the 2D PT model showed that the element block in scenario 3 moved the furthest from the dredging position, i.e., approximately 2.9 km. The results of the simulation were qualified, as the dredging position was situated far from the sea; therefore, it was significantly affected by the direction and velocity of wave and wind at the dredging position. For a future study, it is recommended that the uncertainty of the modeling needs is reduced. The following aspects may be improved:
-
The computation time steps of the 2D model are currently large, although it takes approximately 4 to 5 h for one simulation of the 2D SW, HD, MT, PT model. A smaller time step can refine the results and provide more clarity, especially for sedimentation and particle tracking.
-
The number of calibration and validation locations in the 2D models are few. It may not be enough to evaluate the adequacy of the model in the study area.
-
The results of the 2D PT model only evaluate the distribution concentration and distance transmission of particles after the dredged materials. The results will be more useful and expanded if these are combined with the survey deposit patterns in the area surrounding the dump site.

Author Contributions

Conceptualization, D.Q.T. and J.K.; Methodology, D.Q.T.; Software, D.Q.T. and N.C.D.; Calibration and validation, D.Q.T. and N.C.D.; Formal analysis, J.K.; Investigation, N.C.D.; Data curation, D.Q.T.; Writing–original draft preparation, D.Q.T. and N.C.D.; Writing–review and editing, J.K.; Visualization, D.Q.T.

Funding

The authors gratefully acknowledge the financial support from the Ton Duc Thang University and the permission to use its facilities to perform the study.

Conflicts of Interest

The authors declare no conflict of interest.

References

  1. Bolam, S.G.; Rees, H.L. Minimizing impacts of maintenance dredged material disposal in the coastal environment: A habitat approach. Environ. Manag. 2003, 32, 171–188. [Google Scholar] [CrossRef]
  2. Simonini, R.; Ansaloni, I.; Cavallini, F.; Graziosi, F.; Iotti, M.; N’Siala, G.M.; Mauri, M.; Montanari, G.; Preti, M.; Prevedelli, D. Effects of long-term dumping of dredged material on macrozoobenthos at four disposal sites along the Emilia-Romagna coast (Northern Adriatic Sea, Italy). Mar. Pollut. Bull. 2005, 50, 1595–1605. [Google Scholar] [CrossRef] [PubMed]
  3. Leipe, T.; Kersten, M.; Heise, S.; Pohl, C.; Witt, G.; Liehr, G.; Zettler, M.; Tauber, F. Ecotoxicity assessment of natural attenuation effects at a historical dumping site in the western Baltic Sea. Mar. Pollut. Bull. 2005, 50, 446–459. [Google Scholar] [CrossRef] [PubMed]
  4. Ware, S.; Bolam, S.G.; Rees, H.L. Impact and recovery associated with the deposition of capital dredgings at UK disposal sites: Lessions for future licensing and monitoring. Mar. Pollut. Bull. 2010, 60, 79–90. [Google Scholar] [CrossRef]
  5. Kapsimalis, V.; Panagiotopoulos, I.; Kanellopoulos, T.; Hatzianestis, I.; Antoniou, P.; Anagnostou, C. A multi-criteria approach for the dumping of dredged material in the Thermaikos Gulf, Northern Greece. J. Environ. Manag. 2010, 91, 2455–2465. [Google Scholar] [CrossRef]
  6. Bellas, J.; Nieto, Ó.; Beiras, R. Integrative assessment of coastal pollution: Development and evaluation of sediment quality criteria from chemical contamination and ecotoxicological data. Cont. Self Res. 2011, 31, 448–456. [Google Scholar] [CrossRef]
  7. Aarninkhof, S.; Luijendijk, A. Safe disposal of dredged material in anenvironmentally sensitive environment. Port Technol. Int. 2010, 47, 39–45. [Google Scholar]
  8. Erftemeijer, P.L.A.; Riegl, B.; Hoeksema, B.W.; Todd, P.A. Environmental impacts of dredging and other sediment disturbances on corals. Mar. Pollut. Bull. 2012, 64, 1737–1765. [Google Scholar] [CrossRef]
  9. Maren, D.S.; Kessel, T.; Cronin, K.; Sittoni, L. The impact of channel deepening and dredging on estuarine sediment concentration. Cont. Self Res. 2015, 95, 1–14. [Google Scholar] [CrossRef] [Green Version]
  10. Staniszewska, M.; Boniecka, H. Dangerous compounds in the dredged material from the sea—Assessment of the current approach to the evaluation of contaminations based on the data from the Polish coastal zone (the Baltic Sea). Mar. Pollut. Bull. 2018, 130, 324–334. [Google Scholar] [CrossRef]
  11. Frenzel, P.; Bormann, C.; Lauenburg, B.; Bohling, B.; Bartholdy, J. Environment impact assessment of sediment dumping in the southern Baltic Sea using meiofaunal indicators. J. Mar. Syst. 2009, 75, 430–440. [Google Scholar] [CrossRef]
  12. Boniecka, H.; Staniszewska, M.; Sapota, G.; Dembska, G.; Suzdalev, S. Przewodnik do wyznaczania nowych miejsc pod klapowiska. In Guideline for the Location of New Dumping Sites, ECODUMP; Maritime Institute of Gdańsk: Gdańsk, Poland, 2014; p. 36. [Google Scholar]
  13. Staniszewska, M.; Boniecka, H.; Gajecka, A. Prace pogłębiarskie w polskiej strefie przybrzeżnej-aktualne problemy (Dredging works in the polish coastal zone-actual problems). Inż. Ekol. 2014, 40, 157–172. [Google Scholar] [CrossRef]
  14. Staniszewska, M.; Boniecka, H.; Cylkowska, H. Dredging works in the Polish open sea ports as an anthropogenic factor of development of sea coastal zones. Bull. Marit. Inst. Gdan. 2016, 31, 180–187. [Google Scholar] [CrossRef]
  15. Staniszewska, M.; Boniecka, H. The Environmental Protection Aspects of Handling Dredged Material. BMI Bull. Marit. Inst. Gdan. 2015, 30, 51–58. [Google Scholar] [CrossRef]
  16. Staniszewska, M.; Boniecka, H. Managing dredged material in the coastal zone of the Baltic Sea. Environ. Monit. Assess. 2017, 189, 46. [Google Scholar] [CrossRef]
  17. Arizaga, J.; Amat, J.A.; Ganuzas, M.M. The negative effect of dredging and dumping on shorebirds at a coastal wetland in northern Spain. J. Nat. Conserv. 2017, 37, 1–7. [Google Scholar] [CrossRef]
  18. Chen, C.F.; Chen, C.W.; Ju, Y.R.; Kao, C.M.; Dong, C.D. Impact of disposal of dredged material on sediment quality in the Kaohsiung Ocean Dredged Material Disposal Site, Taiwan. Chemosphere 2018, 191, 555–565. [Google Scholar] [CrossRef] [PubMed]
  19. Erftemeijer, P.L.A.; Lewis, R.R., III. Environmental impacts of dredging on seagrasses: A review. Mar. Pollut. Bull. 2006, 52, 1553–1572. [Google Scholar] [CrossRef] [PubMed]
  20. Hoeksema, B.W. Delineation of the Indo-Malayan Centre of maximum marine biodiversity: The Coral Triangle. In Biogeography, Time and Place. Distributions. Barriers and Islands; Renema, W., Ed.; Springer: Dordrecht, The Netherlands, 2007; pp. 117–178. [Google Scholar]
  21. Jones, R.; Browne, P.B.; Fisher, R.; Klonowski, W.; Slivkoff, M. Assessing the impacts of sediments from dredging on corals. Mar. Pollut. Bull. 2016, 102, 9–29. [Google Scholar] [CrossRef]
  22. Staniszewska, M.; Boniecka, H. Badania przesiewowe w ocenie stopnia zanieczyszczenia urobku. Screening methods for dredged material contamination assessment. BMI Bull. Marit. Inst. Gdan. 2016, 31, 80–87. [Google Scholar] [CrossRef]
  23. Foster, G.; Annan, J.D.; Jones, P.D.; Mann, M.E.; Mullan, B.; Renwick, J.; Salinger, J.; Schmidt, G.A.; Trenberth, K.E. Comment on “Influence of the Southern Oscillation on tropospheric temperature” by J. D. McLean, C. R. de Freitas, and R. M. Carter. J. Geophys. Res. 2010, 115, D09110. [Google Scholar] [CrossRef]
  24. Quy Nhon Port. 2012. Available online: http://www.quinhonport.com.vn/en/gioi-thieu/17/gioi-thieu-chung- (accessed on May 2011).
  25. Hervouet, J.M. Hydrodynamics of Free Surface Flows: Modelling with the Finite Element Method; John Wiley & Sons Ltd.: Chichester, UK, 2007. [Google Scholar]
  26. Maerker, C.; Malcherek, A. The Simulation Tool DredgeSim—Predicting Dredging Needs in 2- and 3-Dimensional Models to Evaluate Dredging Strategies; Dittrich, A., Koll, K., Aberle, J., Geisenhainer, P., Eds.; Available online: https://hdl.handle.net/20.500.11970/99824 (accessed on 26 November 2014).
  27. Guerrero, M.; di Federico, V.; Lamberti, A. Calibration of a 2-D morphodynamic model using water-sediment flux maps derived from an ADCP recording. J. Hydroinform. 2013, 15, 813–828. [Google Scholar] [CrossRef]
  28. Paarlberg, A.J.; Guerrero, M.; Huthoff, F.; Re, M. Optimizing Dredge-and-Dump Activities for River Navigability Using a Hydro-Morphodynamic Model. Water 2015, 7, 3943–3962. [Google Scholar] [CrossRef] [Green Version]
  29. Shukla, V.K.; Konkane, V.D.; Nagendra, T.; Agrawal, J.D. Dredged Material Dumping Site Selection Using Mathematical Models. Procedia Eng. 2015, 116, 809–817. [Google Scholar] [CrossRef] [Green Version]
  30. Ramli, A.Y.; de Lange, W.; Bryan, K.; Mullarney, J. Coupled Flow-Wave Numerical Model in Assessing the Impact of Dredging on the Morphology of Matakana Banks. In Proceedings of the Australasian Coasts & Ports Conference 2015, Auckland, New Zealand, 15–18 September 2015. [Google Scholar]
  31. Morais, M.; Dibajnia, M.; Lu, Q.; Fournier, C. 3D modelling of combined dredge and disposal plumes dispersion, ponta da madeira, Brazil. In Proceedings of the WEDA XXXIV Technical Conference & TAMU 45 Dredging Seminar, Toronto, ON, Canada, June 2014. [Google Scholar]
  32. Gaeta, M.G.; Bonaldo, D.; Samaras, A.G.; Carniel, S.; Archetti, R. Coupled Wave-2D Hydrodynamics Modeling at the Reno River Mouth (Italy) under Climate Change Scenarios. Water 2018, 10, 1380. [Google Scholar] [CrossRef]
  33. Davies, S.; Mirfenderesk, H.; Tomlinson, R.; Szylkarski, S. Hydrodynamic, water quality and sediment transport modeling of estuarine and coastal waters on the gold coast Australia. Proc. J. Coast. Res. 2009, 56, 937–941. [Google Scholar]
  34. Doan, Q.T.; Nguyen, C.D.; Chen, Y.C. Trajectory Modelling of Marine Oil Spills: Case Study of Lach Huyen Port, Vietnam. Lowl. Technol. Int. 2013, 15, 41–51. [Google Scholar] [CrossRef]
  35. Menendez, A.N.; Badano, N.D.; Lopolito, M.F.; Re, M. Water quality assessment for a coastal zone through numerical modeling. J. Appl. Water Eng. Res. 2013, 1, 8–16. [Google Scholar] [CrossRef]
  36. Shi, Z. Estuaries: Dynamics, mixing, sedimentation and morphology. J. Coast. Res. 2010, 26, 586–587. [Google Scholar] [CrossRef]
  37. Fossati, M.; Piedra-Cueva, I. A 3D hydrodynamic numerical model of the Río de la Plata and Montevideo’s coastal zone. Appl. Math. Model. 2013, 37, 1310–1332. [Google Scholar] [CrossRef]
  38. Doan, Q.T.; Nguyen, C.D.; Chen, Y.C.; Pawan, K.M. Application of Environmental Sensitivity Index (ESI) Maps of Shoreline for the Coastal Oil Spills: Case Study of Cat Ba Island, Vietnam. Environ. Earth Sci. 2015, 74, 3433–3451. [Google Scholar] [CrossRef]
  39. Suntoyo; Ikhwani, H.; Zikra, M.; Sukmasari, N.A.; Angraeni, G.; Tanaka, H.; Umeda, M.; Kure, S. Modelling of the COD, TSS, Phosphate and Nitrate Distribution Due to the Sidoardjo Mud Flow into Porong River Estuary. Procedia Earth Planet. Sci. 2015, 14, 144–151. [Google Scholar] [CrossRef] [Green Version]
  40. Doan, Q.T.; Nguyen, T.M.L.; Nguyen, C.D. Using numerical modelling in the simulation of mass fish death phenomenon along the Central Coast of Vietnam. Mar. Pollut. Bull. 2018, 129, 740–749. [Google Scholar] [CrossRef]
  41. Doan, Q.T.; Nguyen, T.M.L.; Tran, H.T.; Kandasamy, J. Application of 1D-2D Coupled Modeling in Water Quality Assessment: A Case Study in Ca Mau Peninsula, Vietnam. Phys. Chem. Earth 2018. [Google Scholar] [CrossRef]
  42. Komen, G.J.; Cavaleri, L.; Doneland, M.; Hasselmann, K.; Hasselmann, S.; Janssen, P.A.E.M. Dynamics and Modeling of Ocean Waves; Cambridge University Press: Cambridge, UK, 1994; p. 560. [Google Scholar]
  43. Young, I.R. Wind-generated Ocean waves. In Elsevier Ocean Engineering Book Series; Bhattacharyya, R., McCormick, M.E., Eds.; 1999; Volume 2, Available online: https://www.elsevier.com/books/wind-generated-ocean-waves/young/978-0-08-043317-2 (accessed on 23 March 1999).
  44. Martin, J.L.; McCutcheon, S.C. Hydrodynamics and Transport for Water Quality Modeling; Taylor & Francis Group: Boca Raton, London, 1998; 816p, Available online: https://www.crcpress.com/Hydrodynamicsand-Transport-for-Water-Quality-Modeling/Martin-McCutcheon/p/book/9780873716123 (accessed on 4 May 2018).
  45. Krone, R.B. Flume Studies of the Transport of Sediment in Estuarial Processes; Final Report; Hydraulic Engineering Laboratory and Sanitary Engineering Research Laboratory, University of California: Barkeley, CA, USA, 1962. [Google Scholar]
  46. Mehta, A.J.; Hayter, E.J.; Parker, W.R.; Krone, R.B.; Teeter, A.M. Cohesive sediment transport. J. Hydraul. Eng. 1989, 115, 1076–1093. [Google Scholar] [CrossRef]
  47. Sikder, S.; Hossain, F. Assessment of the weather research and forecasting model generalized parameterization schemes for advancement of precipitation forecasting in monsoon-driven river basins. J. Adv. Model. Earth Syst. 2016, 8, 1210–1228. [Google Scholar] [CrossRef] [Green Version]
  48. Doan, Q.T.; Nguyen, T.M.L.; Quach, T.T.T.; Tran, A.P.; Nguyen, C.D. Assessment of Water Quality in Coastal Estuaries Under Impact of Industrial Zone in Hai Phong, Vietnam. Phys. Chem. Earth 2019, accepted. [Google Scholar]
  49. Nash, J.E.; Sutcliffe, J.V. River flow forecasting through conceptual models parts I—A discussion of principles. J. Hydrol. 1970, 10, 282–290. [Google Scholar] [CrossRef]
  50. Moriasi, D.N.; Arnold, J.G.; Van Liew, M.W.; Bingner, R.L.; Harmel, R.D.; Veith, T.L. Model evaluation guidelines for systematic quantification of accuracy in watershed simulations. Trans. ASABE 2007, 50, 885–900. [Google Scholar] [CrossRef]
  51. Akira, Y. Eddy-viscosity-type subgrid-scale model with a variable Smagorinsky coefficient and its relationship with the one-equation model in large eddy simulation. Phys. Fluids 1991, 3, 2007–2009. [Google Scholar] [CrossRef]
  52. Cui, G.X.; Xu, C.X.; Fang, L.F.; Shao, L.; Zhang, Z.S. A new subgrid eddy-viscosity model for large-eddy simulation of anisotropic turbulence. J. Fluid Mech. 2007, 582, 377–397. [Google Scholar] [CrossRef]
  53. Romit, M.; Omer, S. Dynamic modeling of the horizontal eddy viscosity coefficient for quasigeostrophic ocean circulation problems. J. Ocean Eng. Sci. 2016, 1, 300–324. [Google Scholar] [CrossRef] [Green Version]
  54. Circulars 67, QCVN 10-MT/BTNMT, National Technical Regulation on Marine Water Quality. 2015. Available online: https://thuvienphapluat.vn/van-ban/Tai-nguyen-Moi-truong/Thong-tu-67-2015-TT-BTNMT-quy-chuan-ky-thuat-quoc-gia-moi-truong-301666.aspx (accessed on 21 December 2015).
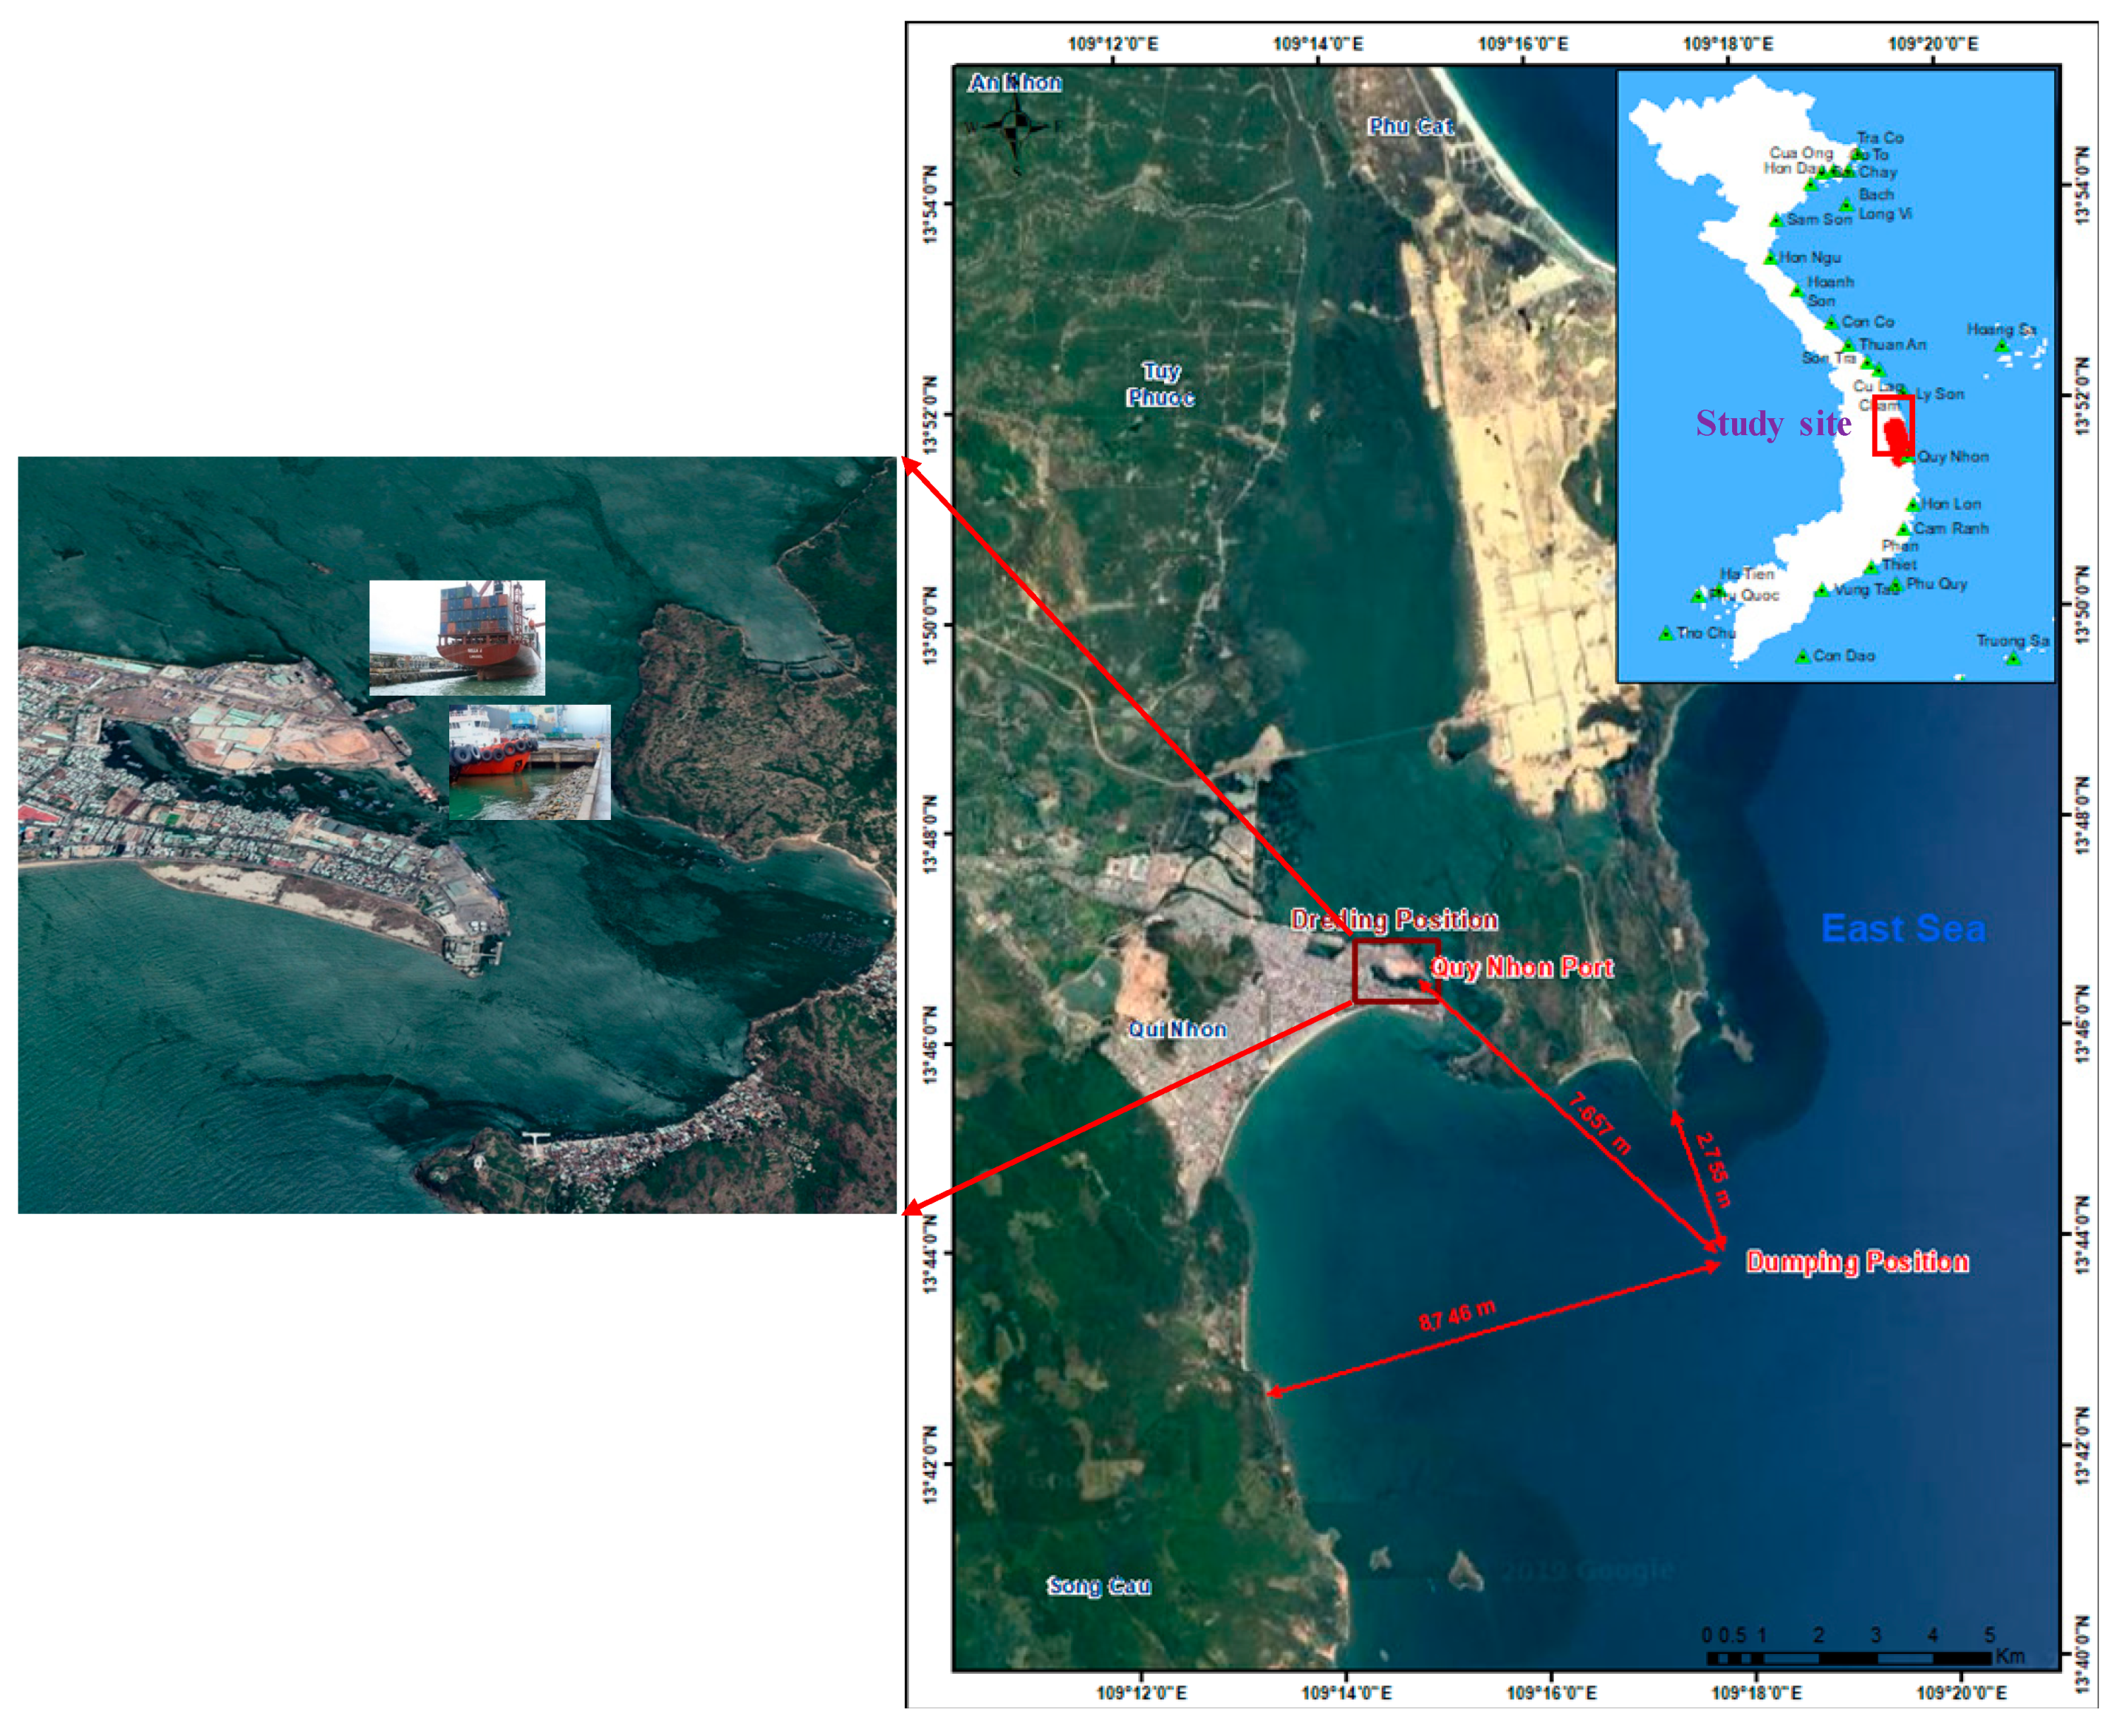
Figure 1. Location of study area (Quy Nhon Port, 2012).
Applsci 09 01703 g001
Figure 2. The wind speed frequency distribution and the “wind calm” (%) based on directions.
Applsci 09 01703 g002
Figure 3. (a) 2D visualization bathymetry of wave mesh; (b) Detailed mesh of study area.
Applsci 09 01703 g003
Figure 4. Calibration and validation of the wave height in 2D SW model at Ly Son station.
Applsci 09 01703 g004
Figure 5. The results of wave field: (a) low tide and (b) high tide.
Applsci 09 01703 g005
Figure 6. Calibration and validation of water level at Quy Nhon station.
Applsci 09 01703 g006
Figure 7. The flow field results at a closer view of Quy Nhon port.
Applsci 09 01703 g007
Figure 8. The simulation results of S1. Streamflow field during (a) low tide; (b) high tide. Distribution of suspended sediment concentration (SSC) during (c) low tide; (d) high tide.
Applsci 09 01703 g008
Figure 9. The simulation results of S2. Streamflow field during (a) low tide; (b) high tide. Distribution of suspended sediment concentration (SSC) during (c) low tide; (d) high tide.
Applsci 09 01703 g009
Figure 10. The simulation results of S3. Streamflow field during (a) low tide; (b) high tide. Distribution of suspended sediment concentration (SSC) during (c) low tide; (d) high tide.
Applsci 09 01703 g010
Figure 11. The simulation results of transferring sedimentation position in low tide and high tide in S1 (a,b); S2 (c,d); S3 (e,f).
Applsci 09 01703 g011
Table 1. The frequency and “calm wind” (%) based on directions at Quy Nhon station.
MonthCalm WindDirection
NorthNorth-EastEastSouth-EastSouthSouth-WestWestNorth-West
19.512.643.72.34.1231.24
214.78.941.23.510.36.126.630.1
319.66.730.26.126.211.716.22.50.4
423.65.918.19.136.719.49.11.10.6
526.15.3137.532.321.41172
625.32.86.5625.817.416.8213.6
722.62.45.92.623.912.318.1313.6
822.82.37.13.319.29.519.6344.2
925.65.721.64.517.111.621.4 3.2
1014.712.836.44.85.8429.4 0.5
117.913.151.62.51.51.126.3 0.1
126.410.6511.61.20.930.8
Table 2. The monthly average wind speed at Quy Nhon station from 2011–2016 (m/s).
Month123456789101112
Year
20112.42.21.92.21.92.31.93.12.21.92.43.7
20122.02.12.12.02.02.02.32.84.22.52.02.8
20132.93.02.02.12.12.12.43.54.02.21.92.9
20142.52.71.92.71.82.72.22.62.71.82.52.5
20153.22.93.13.02.82.42.42.52.63.13.23.3
20162.52.72.63.01.92.22.12.23.42.73.43.3
Table 3. The parameters of particle tracking (PT) in 2D model.
No.ParameterValueUnit
1Flux8.3kg/s
2Number of particles per time step20Integer
3Decay Rate0.05/sec
4Settling velocity data0.1m/s
5Settling parameters
5.1Minimum concentration for0.01kg/m3
5.2Maximum concentration for10kg/m3
5.3Alpha1.01
6Dispersion coefficient formulation0.05m2/s