

Impact of Stimulation Duration in taVNS—Exploring Multiple Physiological and Cognitive Outcomes
 , ,
, ,
Abstract
:1. Introduction
2. Materials and Methods
2.1. Sample
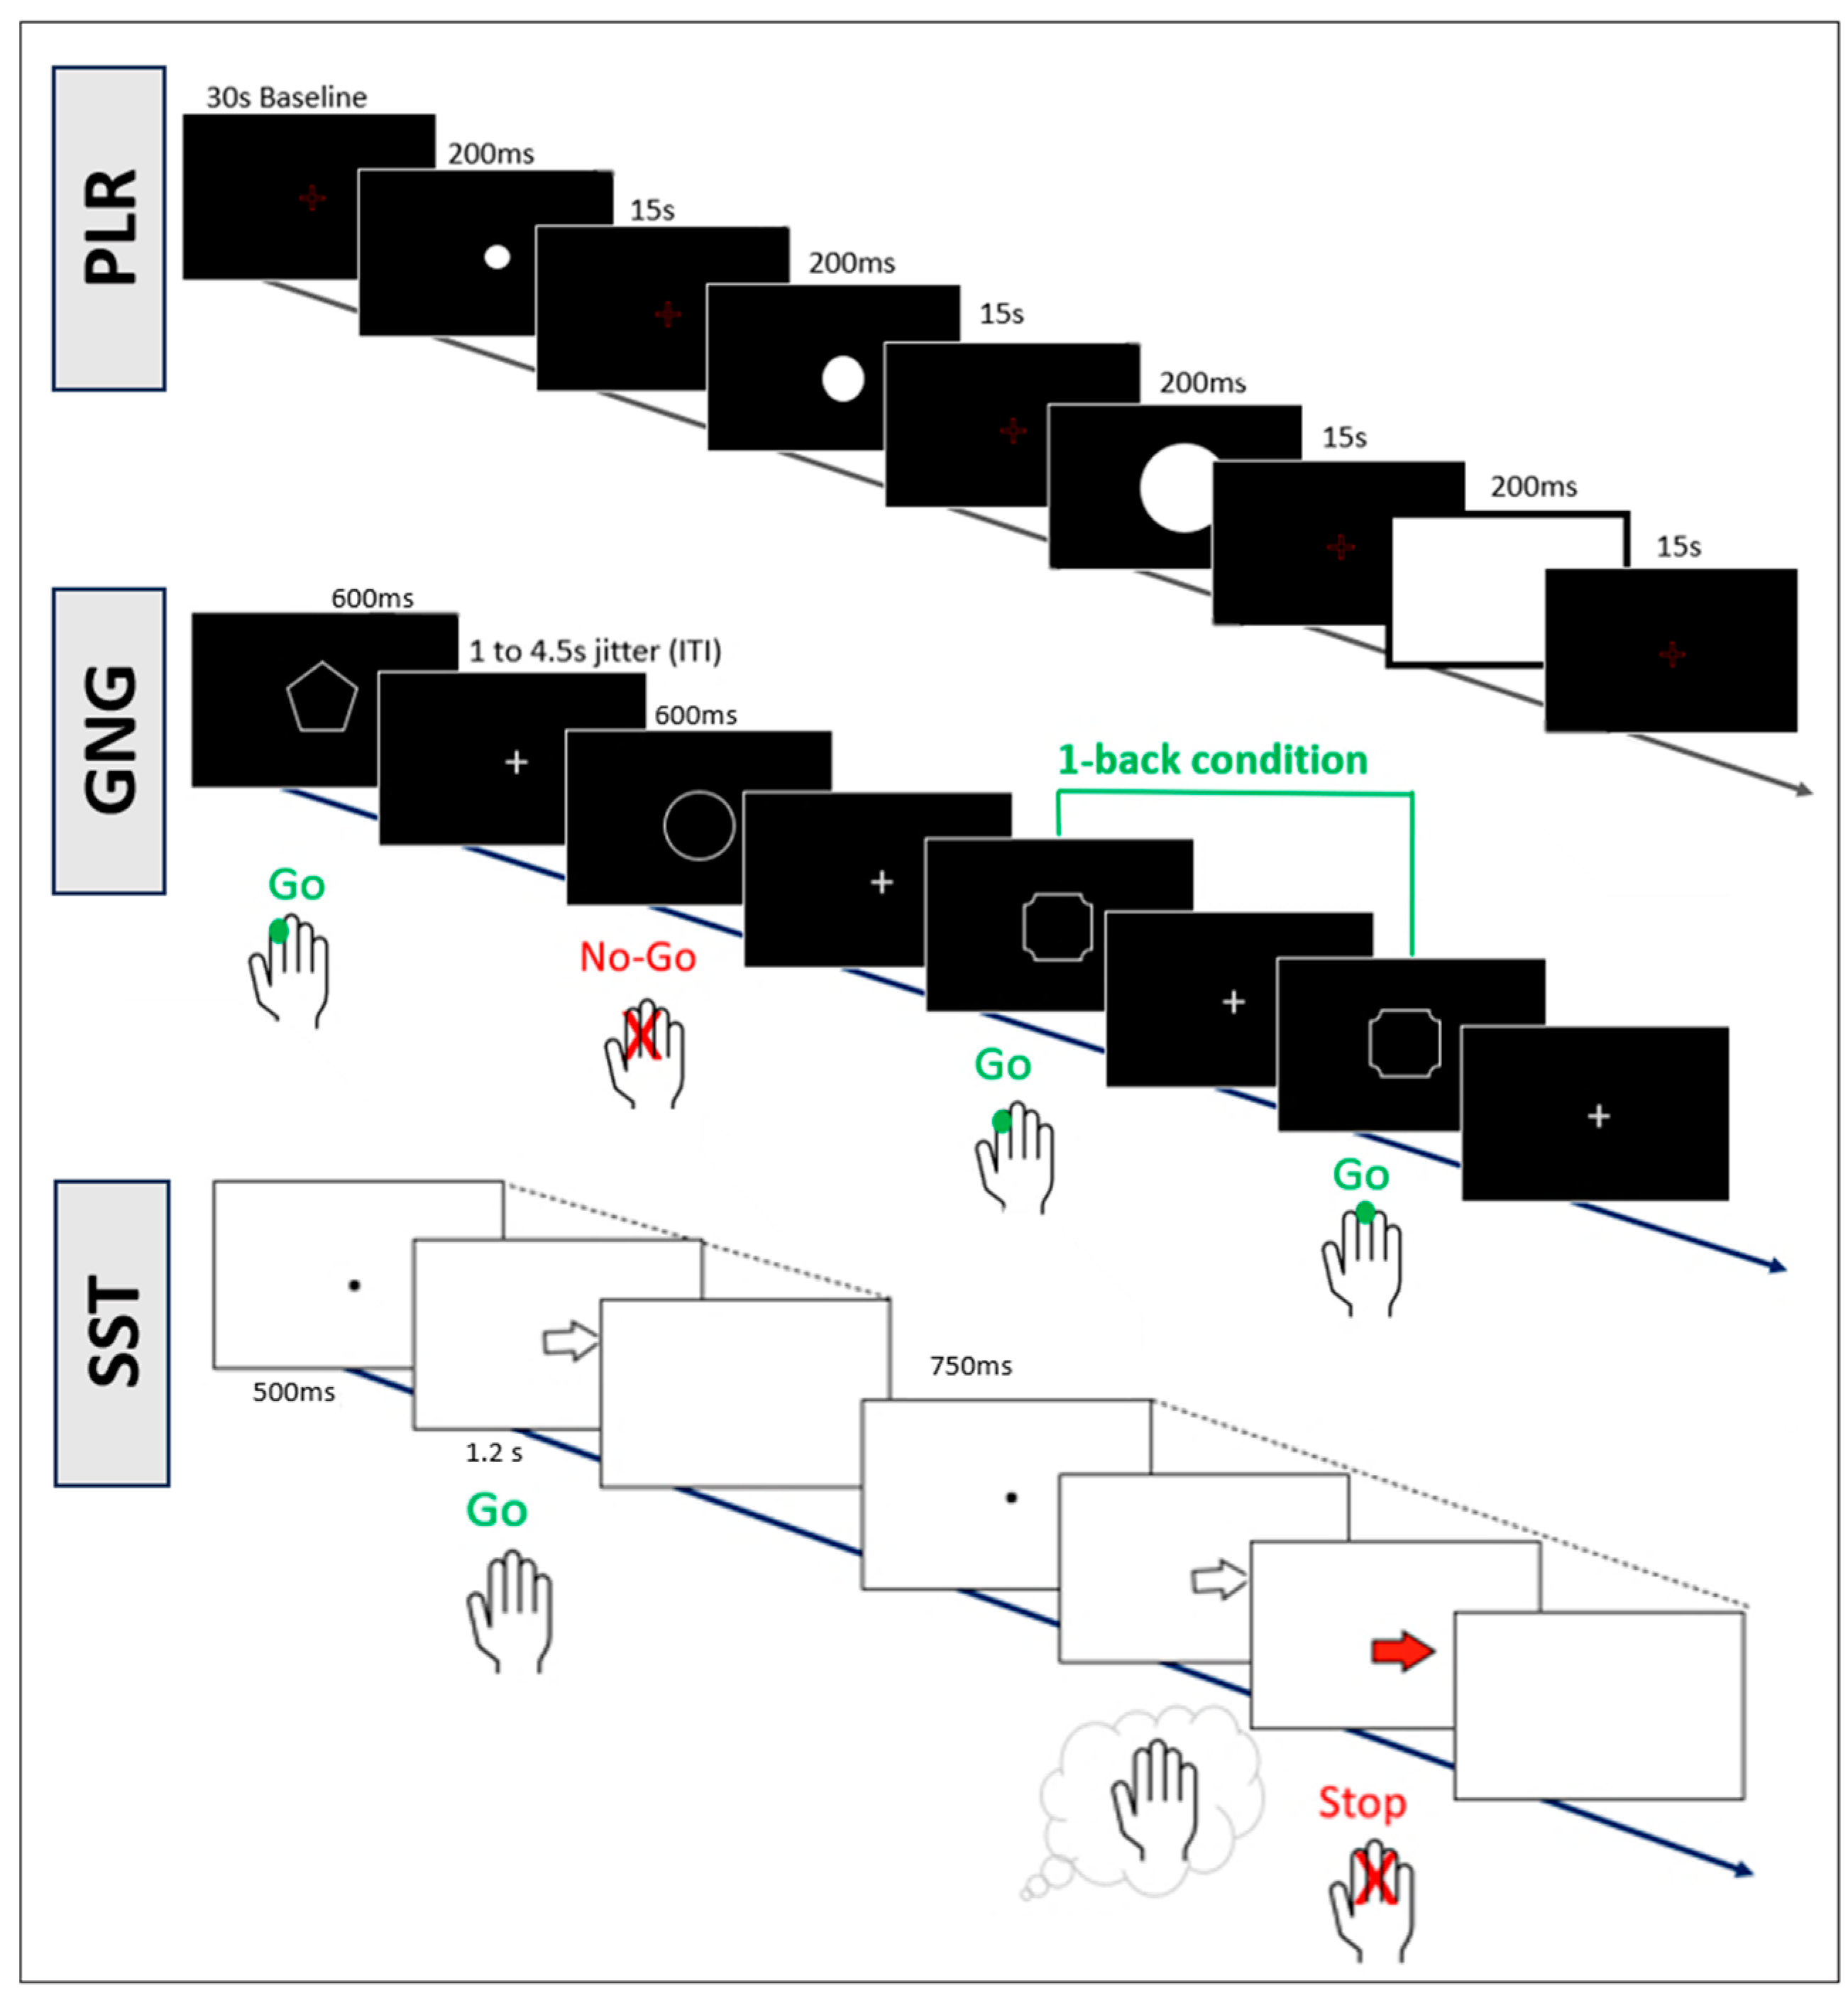
2.2. Procedure
2.3. Stimulation
2.4. Main Outcome Parameters
2.4.1. Saliva
2.4.2. Pupil
2.4.3. EEG
2.4.4. Cognitive Tasks
2.5. Statistical Analysis
Additional Analyses
3. Results
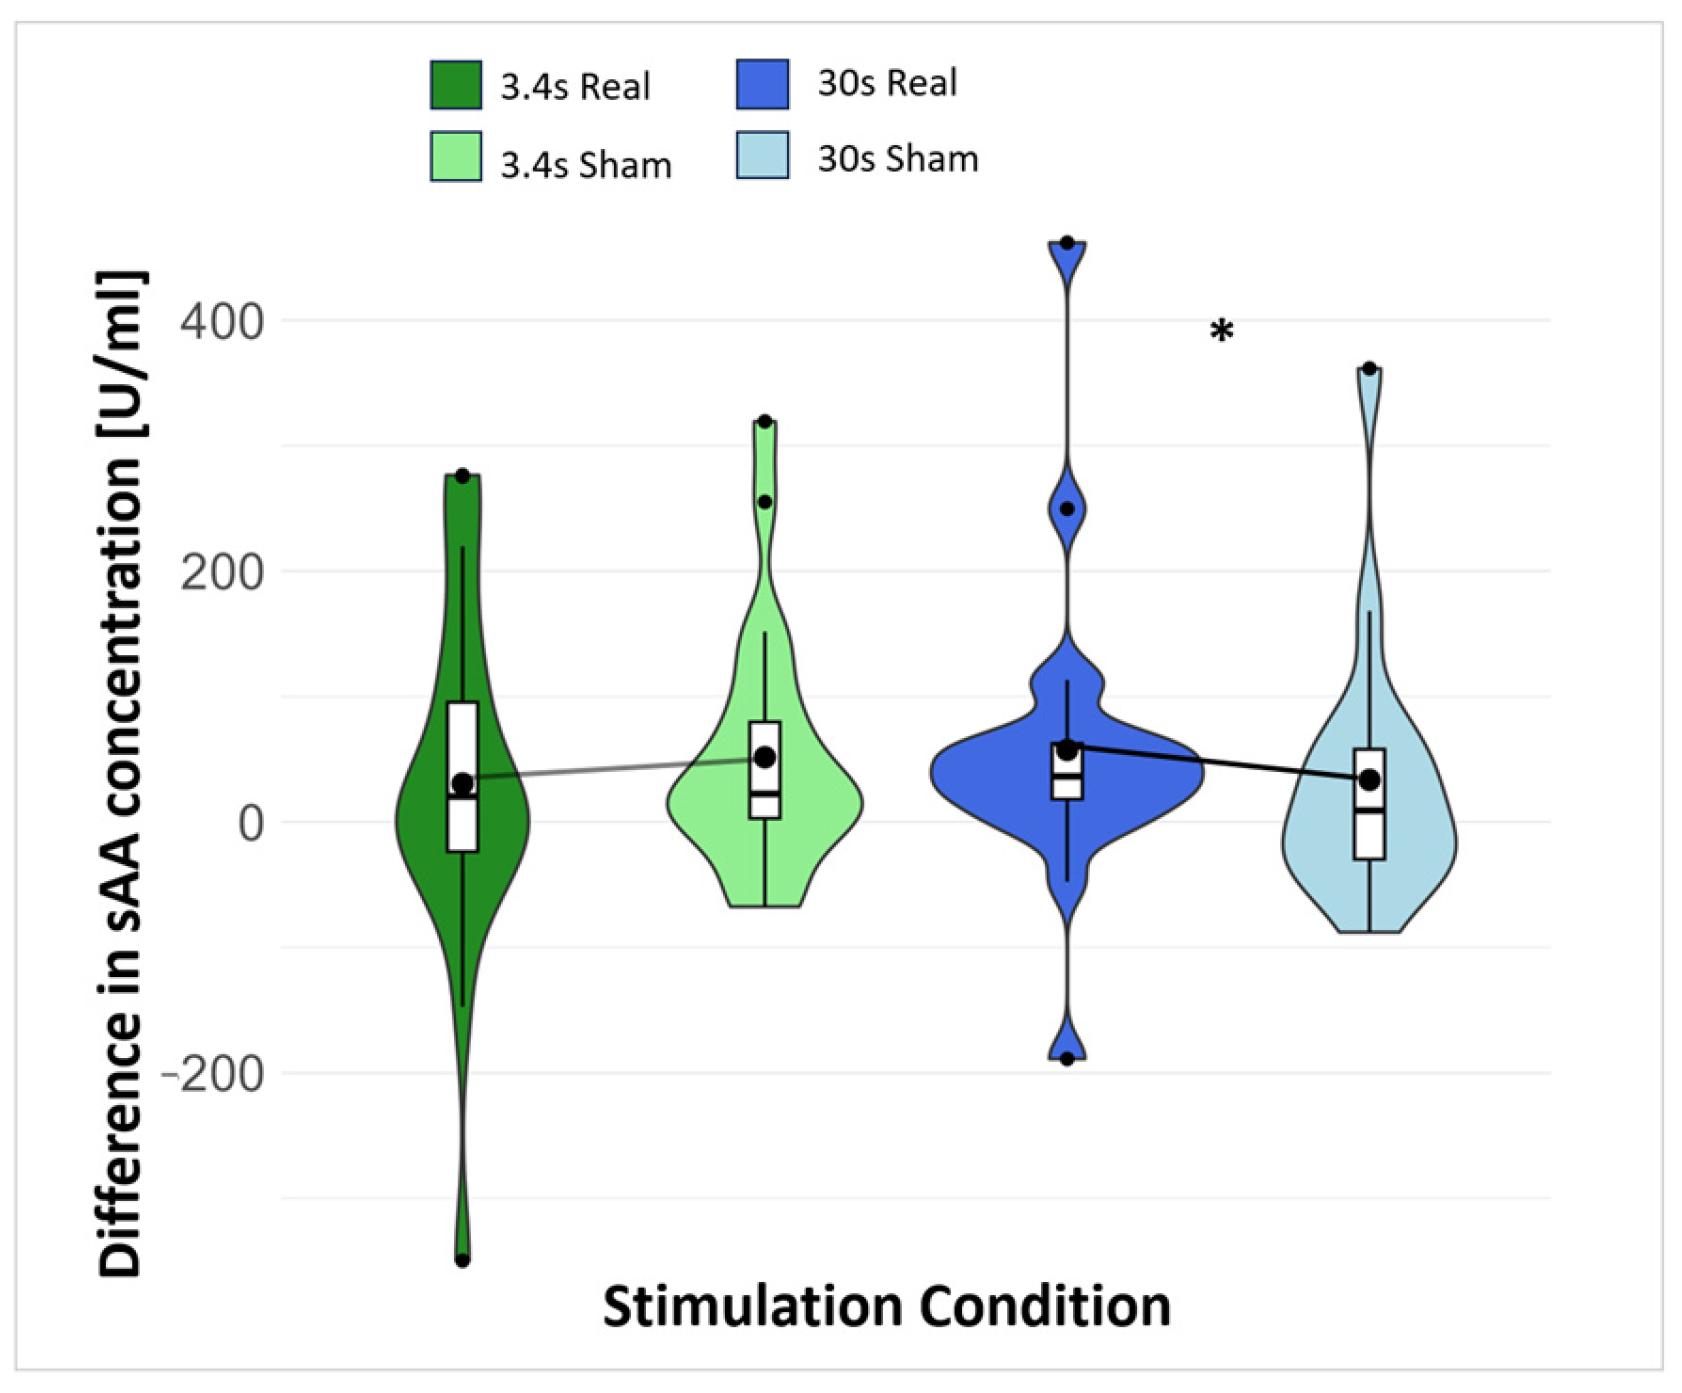
3.1. Saliva
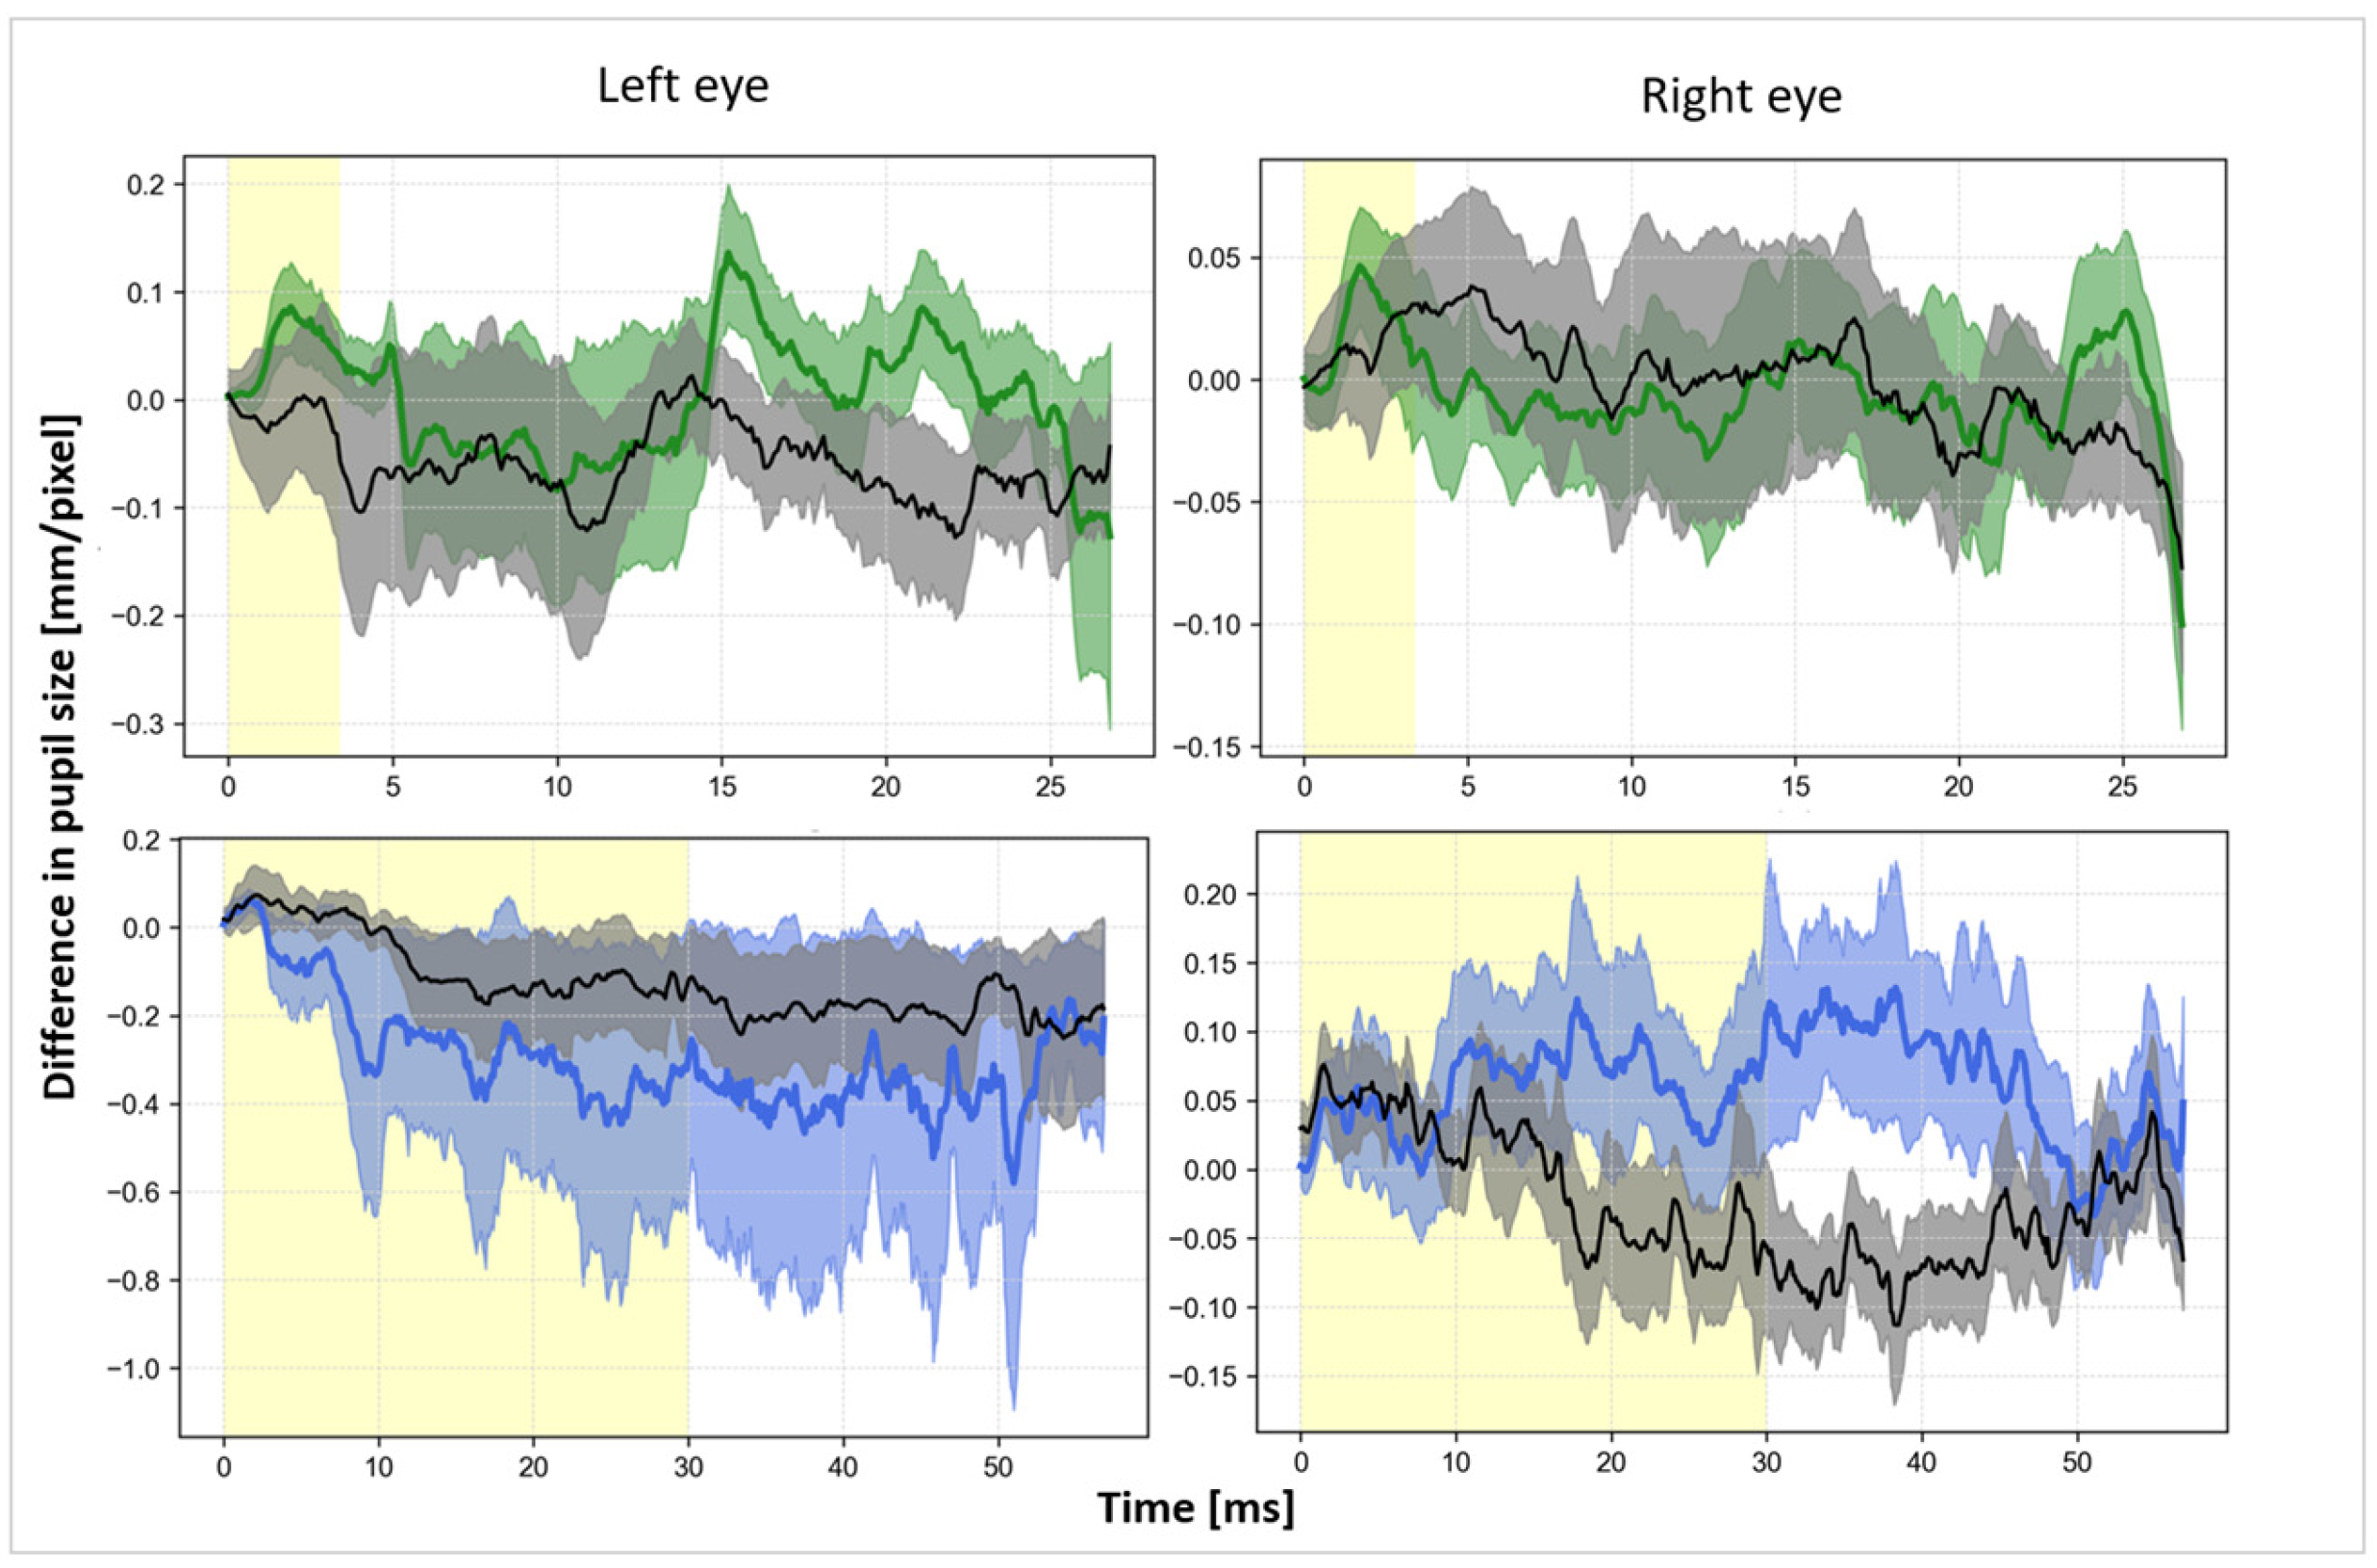
3.2. Pupil
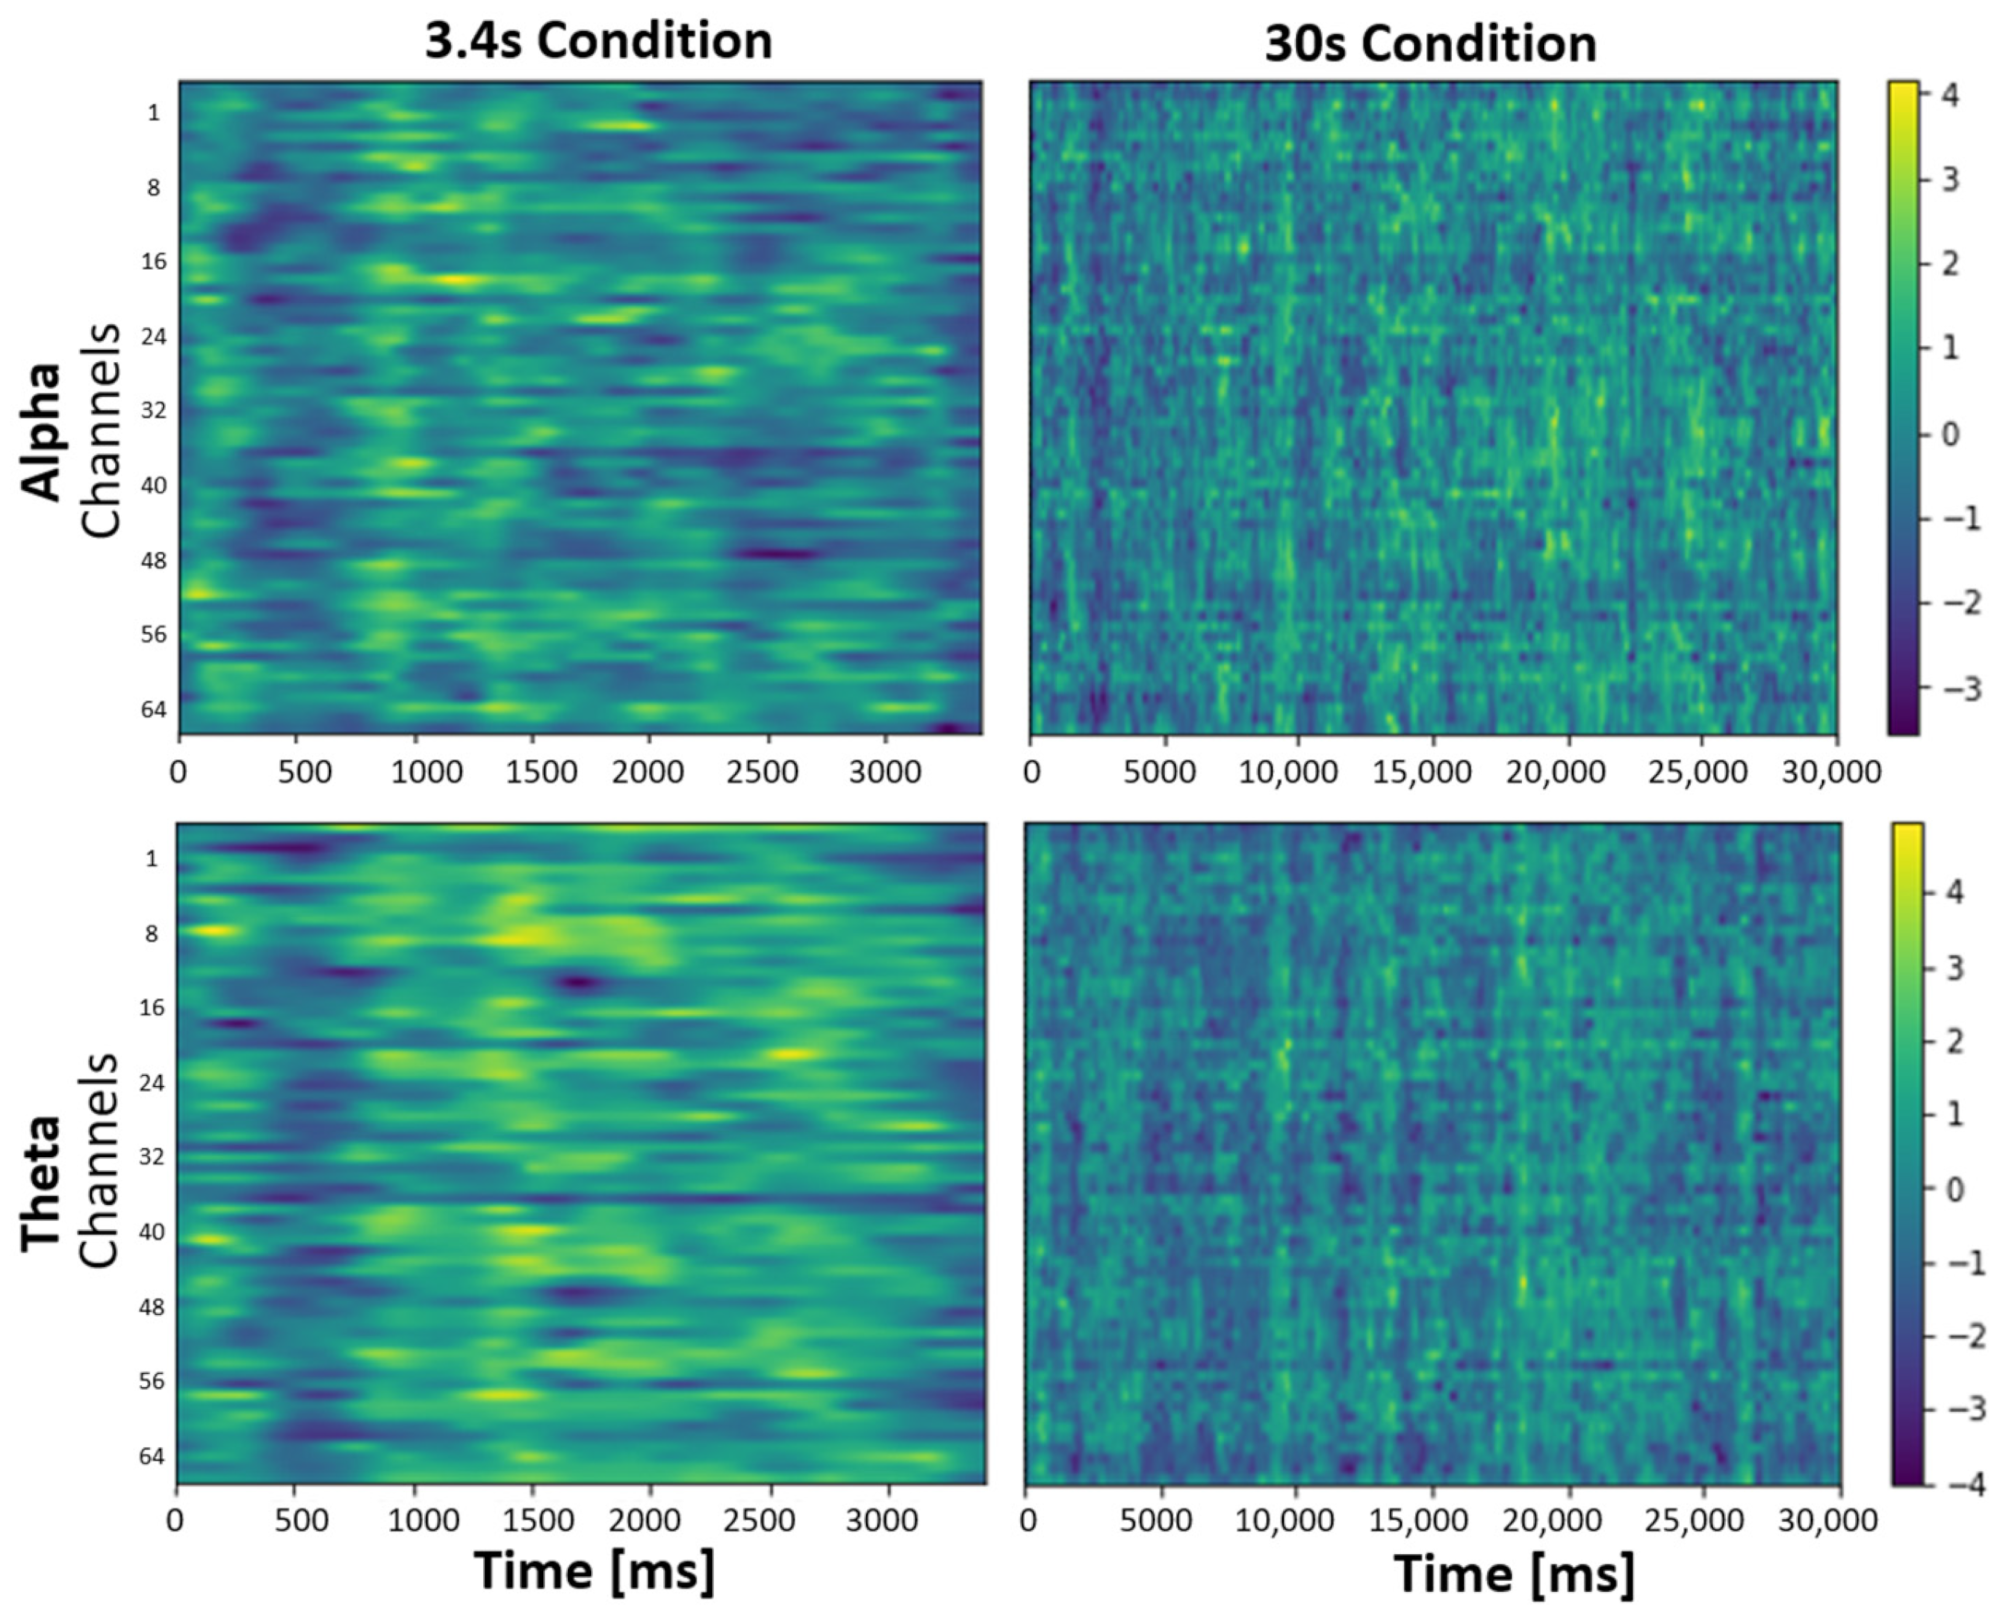
3.3. EEG
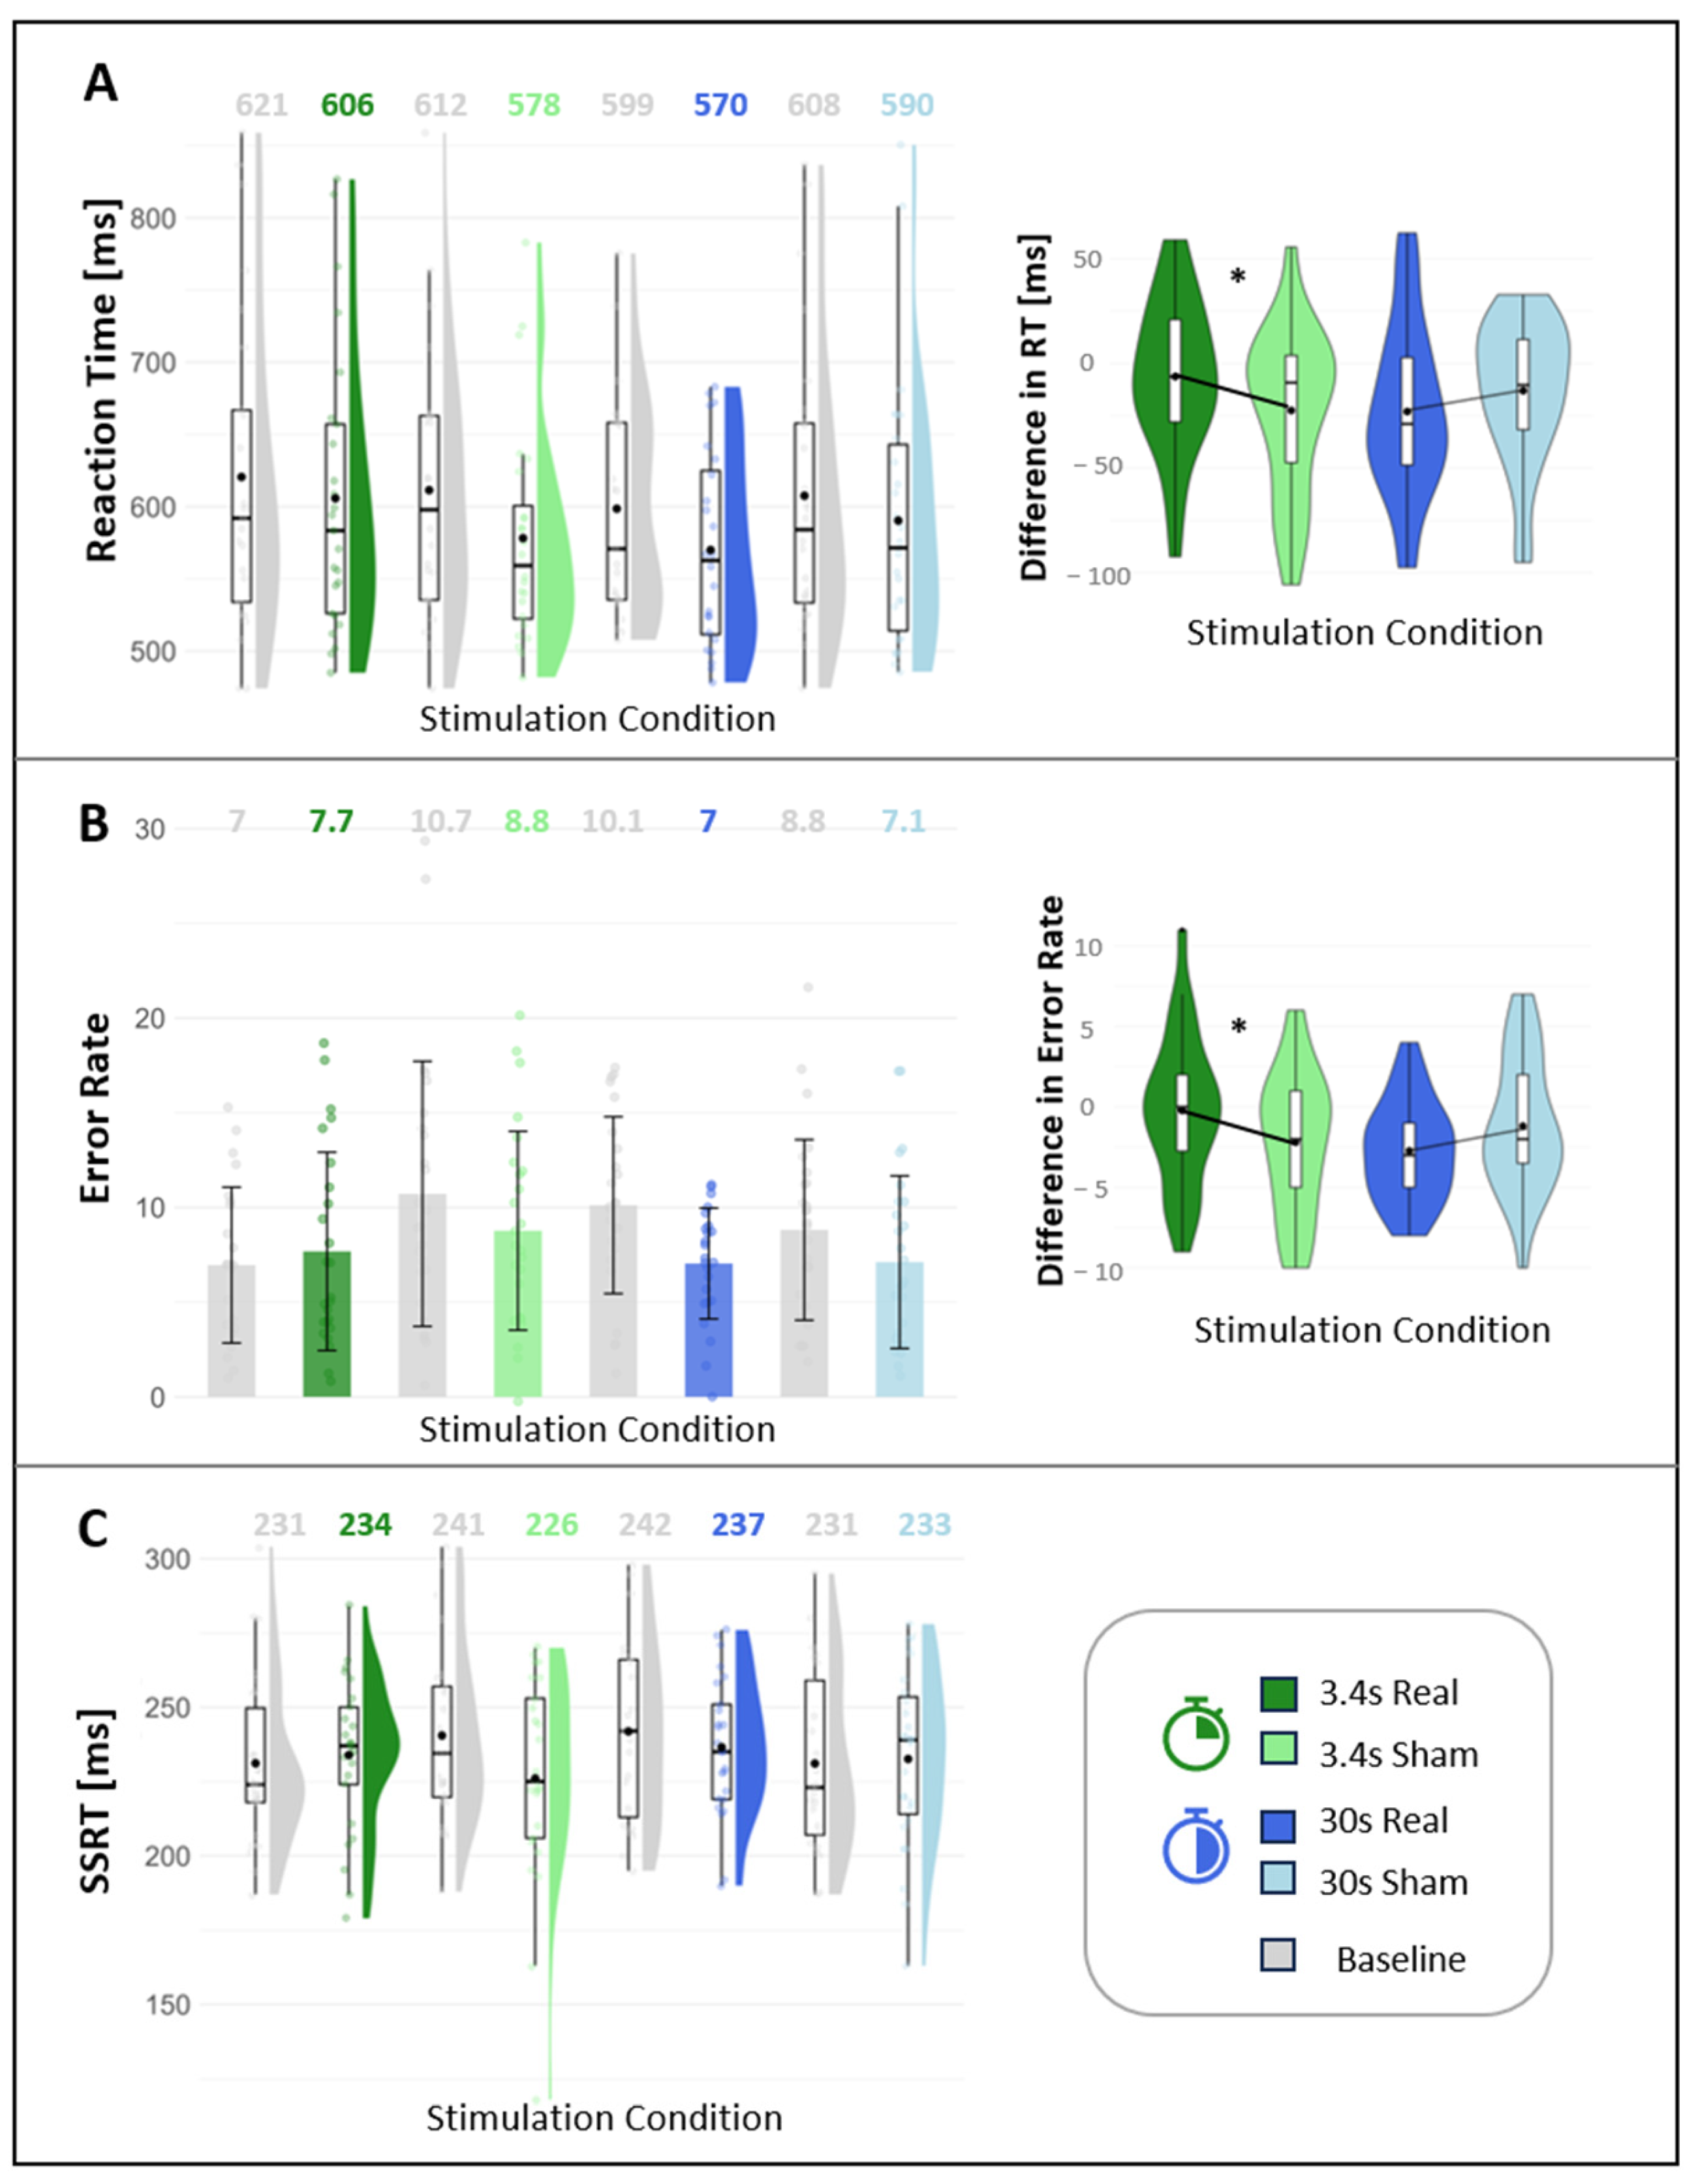
3.4. Cognition
4. Discussion
4.1. Effect of the taVNS on Saliva Marker
4.2. Effect of the taVNS on Pupil Size
4.3. Effect of taVNS on EEG
4.4. Effect of the taVNS on Cognition
4.5. Differences between Invasive and Non-Invasive VNS
4.6. Limitations and Future Directions
5. Conclusions
Author Contributions
Funding
Institutional Review Board Statement
Informed Consent Statement
Data Availability Statement
Acknowledgments
Conflicts of Interest
Appendix A

| Parameter | Unit | Description | Phase of PLR | Controlled by | Effect of LC-NE Activation on Pupil Size |
|---|---|---|---|---|---|
| D1 | mm | Output variable (mean value 1 s before annotation) | 1 | P | larger |
| D2 | mm | Minimal pupil size | 1 | P | larger |
| AMP | mm | Constriction amplitude: Difference between initial width and max. constriction (D1-D2) | 1 | P | smaller |
| VCmax | mm/s | Maximum constriction speed | 1 | P | smaller |
| ACmax | mm/s2 | Maximum constriction acceleration | 1 | P | smaller |
| T1 | s | Latency from light annotation to maximum acceleration (ACmax) | 1 | P | larger |
| T2 | s | Latency from light annotation to maximum speed (VCmax) | 1 | P | larger |
| T3 | s | Latency from light annotation to maximum constriction (D2) | 1 | P | larger |
| Rel_AMP | % | Constriction amplitude in relation to the output width (AMP/D1) | 1 | P/S | smaller |
| Redil_25 | s | Time after max. constriction until pupil size reaches 25% of initial value | 2 | P/S | smaller |
| Redil_50 | s | Time after max. constriction until pupil size reaches 50% of the initial value | 2 | P/S | smaller |
| Redil_75 | s | Time after max. constriction until pupil size reaches 75% of the initial value | 3 | S | smaller |
| Light Stimulus Sequence | Width in Height Units 1 | Height in Height Units | Brightness in Lux |
|---|---|---|---|
| 1 | 0.1 | 0.1 | 0.0 2 |
| 2 | 0.15 | 0.15 | 1.8 |
| 3 | 0.25 | 0.25 | 5.0 |
| 4 | 5.00 | 5.00 | 130.0 |
Appendix B
| Condition | Contrast | Estimated Value (ß) | Standard Error | Degrees of Freedom | t-Value | p-Value | Adjusted p-Value |
|---|---|---|---|---|---|---|---|
| 3.4 s | morning vs. afternoon | −13.96 | 22.33 | 52.47 | −0.62 | 0.535 | 0.802 |
| morning vs. noon | 6.66 | 25.07 | 54.68 | 0.27 | 0.792 | 0.847 | |
| noon vs. afternoon | −20.61 | 26.50 | 52.33 | −0.78 | 0.440 | 0.802 | |
| 30 s | morning vs. afternoon | −4.73 | 24.44 | 53.51 | −0.29 | 0.847 | 0.847 |
| morning vs. noon | −59.98 | 26.13 | 53.62 | −2.30 | 0.026 | 0.154 | |
| noon vs. afternoon | 55.25 | 28.20 | 52.29 | 1.96 | 0.055 | 0.166 |
| 3.4 s Real | 3.4 s Sham | 30 s Real | 30 s Sham | |
|---|---|---|---|---|
| Sample (n) | 21 | 22 | 21 | 16 |
| Mean (U/mL) | 19.12 | 21.84 | 24.61 | 7.37 |
| Standard deviation | 41.38 | 40.51 | 44.30 | 26.52 |
| Shapiro-wilk (p-value) | 0.00005 | 0.00018 | 0.00006 | 0.006 |
| Correlation coefficient (r) | −0.03 | −0.03 | −0.42 | 0.17 |
| p-value | 0.897 | 0.909 | 0.057 | 0.517 |
Appendix C
| Stimulation Duration | Eye | Number of Subjects | Threshold | Number of Clusters | p-Values |
|---|---|---|---|---|---|
| 30 s | left | 19 | 2.100922 | 0 | - |
| right | 25 | 2.063899 | 4 | 0.101; 0.357; 0.214; 0.396 | |
| 3.4 s | left | 25 | 2.063899 | 0 | - |
| right | 21 | 2.085963 | 0 | - |
| Parameter | 3.4 s Real | 3.4 s Sham | 30 s Real | 30 s Sham |
|---|---|---|---|---|
| D1 | −0.323 (0.339) | −0.425 (0.164) | −0.312 (1.934) | 0.541 (2.358) |
| D2 | −0.216 (0.190) | −0.332 (0.117) | −0.268 (0.098) | −0.229 (0.147) |
| AMP | −0.107 (0.167) | −0.094 (0.120) | −0.092 (0.095) | −0.007 (0.086) |
| VCmax | 0.383 (1.649) | −0.677 (0.842) | −0.722 (0.660) | 0.326 (0.656) |
| ACmax | 15.054 (31.004) | −8.031 (11.917) | −12.584 (14.293) | 4.463 (11.757) |
| T1 | −0.003 (0.060) | −0.042 (0.054) | −0.027 (0.046) | −0.008 (0.048) |
| T2 | 0.073 (0.181) | 0.323 (0.386) | −0.155 (0.165) | 0.000 0.283 |
| T3 | 0.074 (0.174) | −0.021 (0.065) | −0.224 (0.264) | −0.006 (0.188) |
| rel_AMP | 0.001 (0.018) | 0.010 (0.022) | 0.001 (0.018) | 0.008 (0.014) |
| redil_75 | −0.214 (0.544) | −0.080 (0.343) | 0.015 (0.458) | 0.038 (0.251) |
| redil_50 | −0.079 (0.164) | −0.001 (0.060) | −0.033 (0.094) | 0.010 (0.089) |
| redil_25 | −0.039 (0.037) | −0.010 (0.030) | −0.007 (0.037) | 0.012 (0.057) |
| Independent Variables | Parameter | Estimated Value (ß) | Standard Error | Degrees of Freedom | t-Value | p-Value | Adjusted p-Value |
|---|---|---|---|---|---|---|---|
| ACmax | (Intercept) | −7.65 | 6.86 | 35.65 | −1.11 | 0.272 | 0.272 |
| 3.4 s real vs. sham | 20.358 | 8.372 | 508.897 | 2.432 | 0.015 | 0.038 | |
| 30 s real vs. sham | −15.72 | 8.23 | 517.33 | −1.91 | 0.057 | 0.094 | |
| Light strength (Lux) | −0.08 | 0.05 | 502.07 | −1.46 | 0.145 | 0.181 | |
| AMP | (Intercept) | −0.10 | 0.06 | 27.34 | −1.80 | 0.082 | 0.335 |
| 3.4 s real vs. sham | −0.03 | 0.06 | 507.42 | −0.45 | 0.656 | 0.656 | |
| 30 s real vs. sham | −0.05 | 0.06 | 517.80 | −0.82 | 0.414 | 0.518 | |
| Light strength (Lux) | −0.0005 | 0.0004 | 500.56 | −1.25 | 0.210 | 0.351 | |
| rel_AMP | (Intercept) | 0.002 | 0.01 | 42.50 | 0.21 | 0.832 | 0.832 |
| 3.4 s real vs. sham | −0.01 | 0.01 | 514.15 | −1.07 | 0.286 | 0.715 | |
| 30 s real vs. sham | −0.01 | 0.01 | 521.71 | −0.73 | 0.466 | 0.716 | |
| Light strength (Lux) | −0.00004 | 0.00007 | 506.07 | −0.56 | 0.573 | 0.716 | |
| D1 | (Intercept) | −0.89 | 0.44 | 70.17 | −2.01 | 0.048 | 0.102 |
| 3.4 s real vs. sham | 0.14 | 0.72 | 519.32 | 0.19 | 0.848 | 0.851 | |
| 30 s real vs. sham | −0.13 | 0.71 | 523.91 | −0.19 | 0.851 | 0.851 | |
| Light strength (Lux) | 0.01 | 0.005 | 510.57 | 2.37 | 0.018 | 0.090 | |
| D2 | (Intercept) | −0.44 | 0.14 | 19.70 | −3.04 | 0.007 | 0.033 |
| 3.4 s real vs. sham | 0.13 | 0.09 | 501.39 | 1.434 | 0.152 | 0.379 | |
| 30 s real vs. sham | 0.08 | 0.09 | 508.47 | 0.93 | 0.355 | 0.592 | |
| Light strength (Lux) | 0.00003 | 0.0006 | 499.07 | 0.05 | 0.964 | 0.964 | |
| VCmax | (Intercept) | −0.58 | 0.38 | 37.08 | −1.52 | 0.137 | 0.172 |
| 3.4 s real vs. sham | 0.95 | 0.47 | 511.55 | 2.04 | 0.042 | 0.069 | |
| 30 s real vs. sham | −0.94 | 0.46 | 519.68 | −2.05 | 0.041 | 0.069 | |
| Light strength (Lux) | −0.002 | 0.003 | 504.94 | −0.72 | 0.469 | 0.469 | |
| Redil_25 | (Intercept) | 0.001 | 0.02 | 35.22 | 0.06 | 0.954 | 0.954 |
| 3.4 s real vs. sham | −0.03 | 0.02 | 509.68 | −1.45 | 0.147 | 0.367 | |
| 30 s real vs. sham | −0.01 | 0.02 | 518.35 | −0.62 | 0.533 | 0.781 | |
| Light strength (Lux) | 0.00006 | 0.0001 | 502.70 | 0.49 | 0.625 | 0.781 | |
| Redil_50 | (Intercept) | 0.06 | 0.05 | 32.13 | 1.004 | 0.323 | 0.404 |
| 3.4 s real vs. sham | −0.09 | 0.06 | 510.40 | −1.39 | 0.164 | 0.379 | |
| 30 s real vs. sham | −0.01 | 0.06 | 519.23 | −0.25 | 0.805 | 0.805 | |
| Light strength (Lux) | −0.00045 | 0.0004 | 504.52 | −1.21 | 0.228 | 0.379 | |
| Redil_75 | (Intercept) | 0.07 | 0.15 | 41.16 | 0.44 | 0.661 | 0.964 |
| 3.4 s real vs. sham | −0.15 | 0.21 | 513.67 | −0.70 | 0.481 | 0.964 | |
| 30 s real vs. sham | 0.01 | 0.21 | 521.54 | 0.045 | 0.964 | 0.964 | |
| Light strength (Lux) | −0.003 | 0.001 | 504.89 | −2.43 | 0.02 | 0.08 | |
| T1 | (Intercept) | 0.01 | 0.02 | 37.61 | 0.59 | 0.556 | 0.556 |
| 3.4 s real vs. sham | 0.04 | 0.02 | 511.60 | 1.62 | 0.106 | 0.177 | |
| 30 s real vs. sham | −0.01 | 0.02 | 519.70 | −0.66 | 0.511 | 0.556 | |
| Light strength (Lux) | −0.0003 | 0.0001 | 504.22 | −1.84 | 0.0677 | 0.167 | |
| T2 | (Intercept) | 0.008 | 0.08 | 515.00 | 0.10 | 0.924 | 0.924 |
| 3.4 s real vs. sham | −0.28 | 0.16 | 515.00 | −1.79 | 0.073 | 0.249 | |
| 30 s real vs. sham | −0.16 | 0.15 | 515.00 | −1.08 | 0.279 | 0.348 | |
| Light strength (Lux) | −0.001 | 0.001 | 515.00 | −1.12 | 0.263 | 0.348 | |
| T3 | (Intercept) | −0.06 | 0.09 | 37.53 | −0.61 | 0.547 | 0.571 |
| 3.4 s real vs. sham | 0.07 | 0.11 | 502.80 | 0.65 | 0.515 | 0.571 | |
| 30 s real vs. sham | −0.22 | 0.11 | 510.76 | −2.01 | 0.045 | 0.224 | |
| Light strength (Lux) | 0.0008 | 0.0007 | 496.83 | 1.11 | 0.270 | 0.571 |
| Study | iVNS | nVNS |
|---|---|---|
| Alpha Amylase | ||
| Doerr et al., 2023 [99] 10.1002/epi4.12774 (Patients with epilepsy) | - | No effect of tVNS on sAA activity |
| Warren et al., 2019 * 10.1016/j.brs.2018.12.224 (Healthy individuals) | - | taVNS increased sAA |
| Venutra-Bort et al., 2018 * 10.3389/fnhum.2018.00202 (Healthy individuals) | - | taVNS increased sAA levels after stimulation |
| D’Agostini et al., 2021 * 10.1111/psyp.13885 (Healthy individuals) | - | taVNS did not increase sAA |
| D’Agostini 2023 * 10.1016/j.biopsycho.2023.108646 (Healthy individuals) | - | TaVNS did not increase sAA |
| D’Agostini et al., 2022 * 10.1111/psyp.13984 (Healthy individuals) | - | No effect on sAA secretion with taVNS |
| Giraudier et al., 2020 [100] 10.3389/fpsyg.2020.01276 (Healthy individuals) | - | No tVNS effects on sAA level changes |
| Koenig et al., 2019 [101] 10.1017/S0033291719003490 (Adolescents with depression) | - | No effect of tVNS on sAA |
| Pupil Response | ||
| Vespa et al., 2022 [102] 10.1016/j.brs.2022.11.002 (Patients with epilepsy) | iVNS induced late PDR | - |
| Desbaumes Jodoin et al., 2015 * 10.1016/j.ijpsycho.2015.10.001 (Patients with epilepsy and depression) | iVNS induced PDR | - |
| Skora et al., 2024 * 10.1101/2023.09.20.558607 (healthy controls) | - | taVNS induced early PDR |
| D’Agostini et al., 2023 [103] 10.1016/j.cortex.2022.11.012 (Healthy individuals) | - | Increase in event-related pupil dilation with taVNS |
| Lloyd et al., 2023 * 10.1016/j.brs.2023.06.010 (Healthy individuals) | - | taVNS induced early PDR |
| Sharon et al., 2021 * 10.1523/JNEUROSCI.1361-20.2020 (Healthy individuals) | - | taVNS induced early PDR |
| Urbin et al., 2021 [104] 10.1016/j.brs.2021.06.002 (Healthy individuals) | - | taVNS induced early PDR |
| Villani et al., 2023 [105] 10.1016/j.psyneuen.2022.105719 (Healthy individuals) | - | Event-related taVNS decreased pupil dilation in response to target stimuli |
| Borges et al., 2021 * 10.1016/j.ijpsycho.2021.01.003 (Healthy individuals) | - | No effect on pupillary responses |
| Burger et al., 2020 * j.biopsycho.2020.107863 (Healthy individuals) | - | tVNS did not affect pupil dilation |
| Capone et al., 2021 * 10.1016/j.clinph.2021.05.014 (Healthy individuals) | - | taVNS induced pupil dilation under specific luminance and stimulation intensity |
| D’Agostini et al., 2021 * 10.1111/psyp.13885 (Healthy individuals) | - | taVNS did not increase pupil size |
| D’Agostini et al., 2022 * 10.1111/psyp.13984 (Healthy individuals) | - | taVNS did not impact event-related pupil dilation |
| Keute et al., 2019 * 10.1038/s41598-019-47961-4 (Healthy individuals) | - | No modulation of pupil size or event-related pupil response with taVNS |
| Warren et al., 2019 * 10.1016/j.brs.2018.12.224 (Healthy individuals) | - | Pupil size not affected by tVNS |
| Wienke et al., 2023 * 10.1523/JNEUROSCI.0452-23.2023 (Healthy individuals) | Increased pupil dilation with taVNS | |
| EEG | ||
| Sharon et al., 2021 * 10.1523/JNEUROSCI.1361-20.2020 (Healthy individuals) | - | Attenuation of occipital alpha with taVNS |
| Lloyd et al., 2023 * 10.1016/j.brs.2023.06.010 (Healthy individuals) | - | No attenuation of occipital alpha |
| Wienke et al., 2023 * 10.1523/JNEUROSCI.0452-23.2023 (Healthy individuals) | - | Increase in midfrontal theta with taVNS |
| Pan et al., 2024 * 10.1111/cns.14395 (Patients with epilepsy) | - | Decrease in midfrontal theta with taVNS |
| Li et al., 2023 [106] 10.1089/brain.2022.0011 (Patients with epilepsy) | Patients showed reductions in functional connectivity in theta and alpha bands | - |
| Neuhaus et al., 2007 [107] 10.1016/j.jad.2006.10.005 (Patients with depression) | P300 was significantly increased in responders | - |
| De Taeye et al., 2014 [108] 10.1007/s13311-014-0272-3 (Patients with epilepsy) | Increase of P300 amplitude in VNS responders | - |
| D’Agostini 2023 * 10.1016/j.biopsycho.2023.108646 (Healthy individuals) | - | taVNS did not increase P3b |
| Ventura-Bort 2018 * 10.3389/fnhum.2018.00202 (Healthy individuals) | - | Larger P3b amplitudes during tVNS |
| Warren 2019 * 10.1016/j.brs.2018.12.224 (Healthy individuals) | - | P3 amplitude not affected by tVNS |
| Fischer 2018 * 10.3758/s13415-018-0596-2 (Healthy individuals) | - | No effect of tVNS on P3 |
| Pihlaja 2020 * 10.3389/fnhum.2020.561780 (Healthy individuals) | - | No effect on P3 with tVNS |
| Gadeyne 2022 * 10.1016/j.clinph.2021.11.079 (Healthy individuals) | - | No differences in P3b amplitude or latency with tVNS |
| Response Inhibition | ||
| Schevernels et al., 2016 [109] 10.1016/j.yebeh.2016.09.014 (Patients with epilepsy) | iVNS induced inhibitory benefit | - |
| Zhu 2023 * 10.1101/2023.09.14.23295532 (Healthy individuals) | - | Improved No-Go response accuracy with taVNS |
| Beste et al., 2016 * 10.1016/j.brs.2016.07.004 (Healthy individuals) | - | Better response inhibition performance with taVNS |
| Koenig et al., 2019 [101] 10.1017/S0033291719003490 (Adolescents with depression) | - | Altered response inhibition in emotional Go/NoGo task |
| Beste et al., 2016 * [60] 10.1016/j.brs.2016.07.004 (Healthy individuals) | - | Improved response inhibition performance with taVNS |
| Van Bochove et al., 2016 [110] 10.1016/j.ijpsycho.2018.03.015 (Patients with epilepsy) | Improved ability to suppress distractor interference with VNS |
References
- Câmara, R.; Griessenauer, C.J. Chapter 27—Anatomy of the Vagus Nerve. In Nerves and Nerve Injuries; Tubbs, R.S., Rizk, E., Shoja, M.M., Loukas, M., Barbaro, N., Spinner, R.J., Eds.; Academic Press: San Diego, CA, USA, 2015; pp. 385–397. [Google Scholar] [CrossRef]
- Morris, G.L.; Gloss, D.; Buchhalter, J.; Mack, K.J.; Nickels, K.; Harden, C. Evidence-based guideline update: Vagus nerve stimulation for the treatment of epilepsy. Neurology 2013, 81, 1453–1459. [Google Scholar] [CrossRef]
- Cristancho, P.; Cristancho, M.A.; Baltuch, G.H.; Thase, M.E.; O’Reardon, J.P. Effectiveness and safety of vagus nerve stimulation for severe treatment-resistant major depression in clinical practice after FDA approval: Outcomes at 1 year. J. Clin. Psychiatry 2011, 72, 1376–1382. [Google Scholar] [CrossRef] [PubMed]
- Nesbitt, A.D.; Marin, J.C.A.; Tompkins, E.; Ruttledge, M.H.; Goadsby, P.J. Initial use of a novel noninvasive vagus nerve stimulator for cluster headache treatment. Neurology 2015, 84, 1249–1253. [Google Scholar] [CrossRef] [PubMed]
- Yuan, H.; Silberstein, S.D. Vagus Nerve and Vagus Nerve Stimulation, a Comprehensive Review: Part II. Headache J. Head Face Pain 2016, 56, 259–266. [Google Scholar] [CrossRef] [PubMed]
- Ludwig, M.; Wienke, C.; Betts, M.J.; Zaehle, T.; Hämmerer, D. Current challenges in reliably targeting the noradrenergic locus coeruleus using transcutaneous auricular vagus nerve stimulation (taVNS). Auton. Neurosci. 2021, 236, 102900. [Google Scholar] [CrossRef]
- Butt, M.F.; Albusoda, A.; Farmer, A.D.; Aziz, Q. The anatomical basis for transcutaneous auricular vagus nerve stimulation. J. Anat. 2020, 236, 588–611. [Google Scholar] [CrossRef]
- Peuker, E.T.; Filler, T.J. The nerve supply of the human auricle. Clin. Anat. 2002, 15, 35–37. [Google Scholar] [CrossRef]
- Aston-Jones, G.; Shipley, M.T.; Chouvet, G.; Ennis, M.; van Bockstaele, E.; Pieribone, V.; Shiekhattar, R.; Akaoka, H.; Drolet, G.; Astier, B.; et al. Chapter 4—Afferent regulation of locus coeruleus neurons: Anatomy, physiology and pharmacology. In Progress in Brain Research; Barnes, C.D., Pompeiano, O., Eds.; Elsevier: Amsterdam, The Netherlands, 1991; Volume 88, pp. 47–75. [Google Scholar]
- Aston-Jones, G.; Cohen, J.D. An Integrative Theory of Locus Coeruleus-Norepinephrine Function: Adaptive Gain and Optimal Performance. Annu. Rev. Neurosci. 2005, 28, 403–450. [Google Scholar] [CrossRef] [PubMed]
- Hulsey, D.R.; Riley, J.R.; Loerwald, K.W.; Rennaker, R.L., 2nd; Kilgard, M.P.; Hays, S.A. Parametric characterization of neural activity in the locus coeruleus in response to vagus nerve stimulation. Exp. Neurol. 2017, 289, 21–30. [Google Scholar] [CrossRef]
- Collins, L.; Boddington, L.; Steffan, P.J.; McCormick, D. Vagus nerve stimulation induces widespread cortical and behavioral activation. Curr. Biol. 2021, 31, 2088–2098.e3. [Google Scholar] [CrossRef]
- Badran, B.W.; Dowdle, L.T.; Mithoefer, O.J.; LaBate, N.T.; Coatsworth, J.; Brown, J.C.; DeVries, W.H.; Austelle, C.W.; McTeague, L.M.; George, M.S. Neurophysiologic effects of transcutaneous auricular vagus nerve stimulation (taVNS) via electrical stimulation of the tragus: A concurrent taVNS/fMRI study and review. Brain Stimul. 2018, 11, 492–500. [Google Scholar] [CrossRef]
- Frangos, E.; Ellrich, J.; Komisaruk, B.R. Non-invasive Access to the Vagus Nerve Central Projections via Electrical Stimulation of the External Ear: fMRI Evidence in Humans. Brain Stimul. 2015, 8, 624–636. [Google Scholar] [CrossRef]
- Yakunina, N.; Kim, S.S.; Nam, E.-C. Optimization of Transcutaneous Vagus Nerve Stimulation Using Functional MRI. Neuromodulation Technol. Neural Interface 2017, 20, 290–300. [Google Scholar] [CrossRef] [PubMed]
- Proctor, G.B. The physiology of salivary secretion. Periodontology 2000 2016, 70, 11–25. [Google Scholar] [CrossRef] [PubMed]
- Samuels, E.R.; Szabadi, E. Functional neuroanatomy of the noradrenergic locus coeruleus: Its roles in the regulation of arousal and autonomic function part I: Principles of functional organisation. Curr. Neuropharmacol. 2008, 6, 235–253. [Google Scholar] [CrossRef] [PubMed]
- Warren, C.M.; Tona, K.D.; Ouwerkerk, L.; van Paridon, J.; Poletiek, F.; van Steenbergen, H.; Bosch, J.A.; Nieuwenhuis, S. The neuromodulatory and hormonal effects of transcutaneous vagus nerve stimulation as evidenced by salivary alpha amylase, salivary cortisol, pupil diameter, and the P3 event-related potential. Brain Stimul. 2019, 12, 635–642. [Google Scholar] [CrossRef] [PubMed]
- Ventura-Bort, C.; Wirkner, J.; Genheimer, H.; Wendt, J.; Hamm, A.O.; Weymar, M. Effects of Transcutaneous Vagus Nerve Stimulation (tVNS) on the P300 and Alpha-Amylase Level: A Pilot Study. Front. Hum. Neurosci. 2018, 12, 202. [Google Scholar] [CrossRef]
- D’Agostini, M.; Burger, A.M.; Franssen, M.; Claes, N.; Weymar, M.; von Leupoldt, A.; Van Diest, I. Effects of transcutaneous auricular vagus nerve stimulation on reversal learning, tonic pupil size, salivary alpha-amylase, and cortisol. Psychophysiology 2021, 58, e13885. [Google Scholar] [CrossRef]
- D’Agostini, M.; Burger, A.M.; Jelinčić, V.; von Leupoldt, A.; Van Diest, I. Effects of transcutaneous auricular vagus nerve stimulation on P300 magnitudes and salivary alpha-amylase during an auditory oddball task. Biol. Psychol. 2023, 182, 108646. [Google Scholar] [CrossRef]
- Hill, S.A.; Taylor, M.J.; Harmer, C.J.; Cowen, P.J. Acute Reboxetine Administration Increases Plasma and Salivary Cortisol. J. Psychopharmacol. 2003, 17, 273–275. [Google Scholar] [CrossRef]
- Dunn, A.J.; Swiergiel, A.H.; Palamarchouk, V. Brain circuits involved in corticotropin-releasing factor-norepinephrine interactions during stress. Ann. N. Y. Acad. Sci. 2004, 1018, 25–34. [Google Scholar] [CrossRef]
- Warren, C.M.; van den Brink, R.L.; Nieuwenhuis, S.; Bosch, J.A. Norepinephrine transporter blocker atomoxetine increases salivary alpha amylase. Psychoneuroendocrinology 2017, 78, 233–236. [Google Scholar] [CrossRef]
- El-Sheikh, M.; Erath, S.A.; Buckhalt, J.A.; Granger, D.A.; Mize, J. Cortisol and Children’s Adjustment: The Moderating Role of Sympathetic Nervous System Activity. J. Abnorm. Child Psychol. 2008, 36, 601–611. [Google Scholar] [CrossRef] [PubMed]
- Ditzen, B.; Ehlert, U.; Nater, U.M. Associations between salivary alpha-amylase and catecholamines—A multilevel modeling approach. Biol. Psychol. 2014, 103, 15–18. [Google Scholar] [CrossRef]
- Joshi, S.; Li, Y.; Kalwani, R.M.; Gold, J.I. Relationships between Pupil Diameter and Neuronal Activity in the Locus Coeruleus, Colliculi, and Cingulate Cortex. Neuron 2016, 89, 221–234. [Google Scholar] [CrossRef] [PubMed]
- Reimer, J.; McGinley, M.J.; Liu, Y.; Rodenkirch, C.; Wang, Q.; McCormick, D.A.; Tolias, A.S. Pupil fluctuations track rapid changes in adrenergic and cholinergic activity in cortex. Nat. Commun. 2016, 7, 13289. [Google Scholar] [CrossRef]
- Hou, R.H.; Freeman, C.; Langley, R.W.; Szabadi, E.; Bradshaw, C.M. Does modafinil activate the locus coeruleus in man? Comparison of modafinil and clonidine on arousal and autonomic functions in human volunteers. Psychopharmacology 2005, 181, 537–549. [Google Scholar] [CrossRef] [PubMed]
- Elam, M.; Svensson, T.H.; Thorén, P. Locus coeruleus neurons and sympathetic nerves: Activation by cutaneous sensory afferents. Brain Res. 1986, 366, 254–261. [Google Scholar] [CrossRef] [PubMed]
- Bianca, R.; Komisaruk, B.R. Pupil dilatation in response to vagal afferent electrical stimulation is mediated by inhibition of parasympathetic outflow in the rat. Brain Res. 2007, 1177, 29–36. [Google Scholar] [CrossRef]
- McDougal, D.H.; Gamlin, P.D. Autonomic Control of the Eye. In Comprehensive Physiology; John Wiley & Sons: Hoboken, NJ, USA, 2015; pp. 439–473. [Google Scholar] [CrossRef]
- Akert, K.; Glicksman, M.A.; Lang, W.; Grob, P.; Huber, A. The Edinger-Westphal nucleus in the monkey. A Retrograde Tracer Study. Brain Res. 1980, 184, 491–498. [Google Scholar] [CrossRef]
- Breen, L.A.; Burde, R.M.; Loewy, A.D. Brainstem connections to the Edinger-Westphal nucleus of the cat: A retrograde tracer study. Brain Res. 1983, 261, 303–306. [Google Scholar] [CrossRef] [PubMed]
- Bremner, F. Pupil evaluation as a test for autonomic disorders. Clin. Auton. Res. 2009, 19, 88–101. [Google Scholar] [CrossRef]
- Mridha, Z.; de Gee, J.W.; Shi, Y.; Alkashgari, R.; Williams, J.; Suminski, A.; Ward, M.P.; Zhang, W.; McGinley, M.J. Graded recruitment of pupil-linked neuromodulation by parametric stimulation of the vagus nerve. Nat. Commun. 2021, 12, 1539. [Google Scholar] [CrossRef] [PubMed]
- Wienke, C.; Grueschow, M.; Haghikia, A.; Zaehle, T. Phasic, Event-Related Transcutaneous Auricular Vagus Nerve Stimulation Modifies Behavioral, Pupillary, and Low-Frequency Oscillatory Power Responses. J. Neurosci. 2023, 43, 6306–6319. [Google Scholar] [CrossRef] [PubMed]
- Sharon, O.; Fahoum, F.; Nir, Y. Transcutaneous Vagus Nerve Stimulation in Humans Induces Pupil Dilation and Attenuates Alpha Oscillations. J. Neurosci. 2021, 41, 320–330. [Google Scholar] [CrossRef] [PubMed]
- Lloyd, B.; Wurm, F.; de Kleijn, R.; Nieuwenhuis, S. Short-term transcutaneous vagus nerve stimulation increases pupil size but does not affect EEG alpha power: A replication of Sharon et al. (2021, Journal of Neuroscience). Brain Stimul. 2023, 16, 1001–1008. [Google Scholar] [CrossRef]
- Burger, A.M.; Van der Does, W.; Brosschot, J.F.; Verkuil, B. From ear to eye? No effect of transcutaneous vagus nerve stimulation on human pupil dilation: A report of three studies. Biol. Psychol. 2020, 152, 107863. [Google Scholar] [CrossRef]
- Keute, M.; Demirezen, M.; Graf, A.; Mueller, N.G.; Zaehle, T. No modulation of pupil size and event-related pupil response by transcutaneous auricular vagus nerve stimulation (taVNS). Sci. Rep. 2019, 9, 11452. [Google Scholar] [CrossRef]
- D’Agostini, M.; Burger, A.M.; Villca Ponce, G.; Claes, S.; von Leupoldt, A.; Van Diest, I. No evidence for a modulating effect of continuous transcutaneous auricular vagus nerve stimulation on markers of noradrenergic activity. Psychophysiology 2022, 59, e13984. [Google Scholar] [CrossRef]
- Yamaji, K.; Hirata, Y.; Usui, S. A method for monitoring Autonomous Nervous activity by pupillary Xash response. Syst. Comput. Jpn. 2000, 31, 22–31. [Google Scholar] [CrossRef]
- Keivanidou, A.; Fotiou, D.; Arnaoutoglou, C.; Arnaoutoglou, M.; Fotiou, F.; Karlovasitou, A. Evaluation of autonomic imbalance in patients with heart failure: A preliminary study of pupillomotor function. Cardiol. J. 2010, 17, 65–72. [Google Scholar]
- Desbeaumes Jodoin, V.; Lespérance, P.; Nguyen, D.K.; Fournier-Gosselin, M.P.; Richer, F. Effects of vagus nerve stimulation on pupillary function. Int. J. Psychophysiol. 2015, 98, 455–459. [Google Scholar] [CrossRef]
- Niedermeyer, E. The Normal EEG of the Waking Adult. In Electroencephalography: Basic Principles, Clinical Applications and Related Fields, 4th ed.; Niedermeyer, E., Lopes da Silva, F., Eds.; Williams and Wilkins: Philadelphia, PA, USA, 1999; pp. 149–173. [Google Scholar]
- Jensen, O.; Mazaheri, A. Shaping functional architecture by oscillatory alpha activity: Gating by inhibition. Front. Hum. Neurosci. 2010, 4, 186. [Google Scholar] [CrossRef] [PubMed]
- Dahl, M.J.; Mather, M.; Werkle-Bergner, M. Noradrenergic modulation of rhythmic neural activity shapes selective attention. Trends Cogn. Sci. 2022, 26, 38–52. [Google Scholar] [CrossRef]
- Cavanagh, J.F.; Frank, M.J. Frontal theta as a mechanism for cognitive control. Trends Cogn. Sci. 2014, 18, 414–421. [Google Scholar] [CrossRef]
- Pan, L.; Wang, J.; Wu, W.; Wang, Y.; Zhu, Y.; Song, Y. Transcutaneous auricular vagus nerve stimulation improves working memory in temporal lobe epilepsy: A randomized double-blind study. CNS Neurosci. Ther. 2024, 30, e14395. [Google Scholar] [CrossRef] [PubMed]
- Dolphin, H.; Dukelow, T.; Finucane, C.; Commins, S.; McElwaine, P.; Kennelly, S.P. “The Wandering Nerve Linking Heart and Mind”—The Complementary Role of Transcutaneous Vagus Nerve Stimulation in Modulating Neuro-Cardiovascular and Cognitive Performance. Front. Neurosci. 2022, 16, 897303. [Google Scholar] [CrossRef]
- Gianlorenco, A.C.L.; de Melo, P.S.; Marduy, A.; Kim, A.Y.; Kim, C.K.; Choi, H.; Song, J.-J.; Fregni, F. Electroencephalographic Patterns in taVNS: A Systematic Review. Biomedicines 2022, 10, 2208. [Google Scholar] [CrossRef] [PubMed]
- Gurtubay, I.G.; Perez-Rodriguez, D.R.; Fernandez, E.; Librero-Lopez, J.; Calvo, D.; Bermejo, P.; Pinin-Osorio, C.; Lopez, M. Immediate effects and duration of a short and single application of transcutaneous auricular vagus nerve stimulation on P300 event related potential. Front. Neurosci. 2023, 17, 1096865. [Google Scholar] [CrossRef]
- Fischer, R.; Ventura-Bort, C.; Hamm, A.; Weymar, M. Transcutaneous vagus nerve stimulation (tVNS) enhances conflict-triggered adjustment of cognitive control. Cogn. Affect. Behav. Neurosci. 2018, 18, 680–693. [Google Scholar] [CrossRef]
- Pihlaja, M.; Failla, L.; Peräkylä, J.; Hartikainen, K.M. Reduced Frontal Nogo-N2 with Uncompromised Response Inhibition During Transcutaneous Vagus Nerve Stimulation—More Efficient Cognitive Control? Front. Hum. Neurosci. 2020, 14, 561780. [Google Scholar] [CrossRef]
- Gadeyne, S.; Mertens, A.; Carrette, E.; Van den Bossche, F.; Boon, P.; Raedt, R.; Vonck, K. Transcutaneous auricular vagus nerve stimulation cannot modulate the P3b event-related potential in healthy volunteers. Clin. Neurophysiol. 2022, 135, 22–29. [Google Scholar] [CrossRef] [PubMed]
- Zhu, S.; Liu, Q.; Zhang, X.; Zhou, M.; Zhou, X.; Ding, F.; Zhang, R.; Becker, B.; Kendrick, K.M.; Zhao, W. Transcutaneous auricular vagus nerve stimulation enhanced emotional inhibitory control via increasing intrinsic prefrontal couplings. Int. J. Clin. Health Psychol. 2024, 24, 100462. [Google Scholar] [CrossRef]
- Ridgewell, C.; Heaton, K.J.; Hildebrandt, A.; Couse, J.; Leeder, T.; Neumeier, W.H. The effects of transcutaneous auricular vagal nerve stimulation on cognition in healthy individuals: A meta-analysis. Neuropsychology 2021, 35, 352–365. [Google Scholar] [CrossRef]
- Keute, M.; Barth, D.; Liebrand, M.; Heinze, H.-J.; Kraemer, U.; Zaehle, T. Effects of Transcutaneous Vagus Nerve Stimulation (tVNS) on Conflict-Related Behavioral Performance and Frontal Midline Theta Activity. J. Cogn. Enhanc. 2020, 4, 121–130. [Google Scholar] [CrossRef]
- Beste, C.; Steenbergen, L.; Sellaro, R.; Grigoriadou, S.; Zhang, R.; Chmielewski, W.; Stock, A.K.; Colzato, L. Effects of Concomitant Stimulation of the GABAergic and Norepinephrine System on Inhibitory Control—A Study Using Transcutaneous Vagus Nerve Stimulation. Brain Stimul. 2016, 9, 811–818. [Google Scholar] [CrossRef] [PubMed]
- Borges, U.; Pfannenstiel, M.; Tsukahara, J.; Laborde, S.; Klatt, S.; Raab, M. Transcutaneous vagus nerve stimulation via tragus or cymba conchae: Are its psychophysiological effects dependent on the stimulation area? Int. J. Psychophysiol. 2021, 161, 64–75. [Google Scholar] [CrossRef] [PubMed]
- Skora, L.; Marzecová, A.; Jocham, G. Tonic and phasic transcutaneous auricular Vagus Nerve Stimulation (taVNS) both evoke rapid and transient pupil dilation. Brain Stimul. 2023, 17, 233–244. [Google Scholar] [CrossRef]
- Faul, F.; Erdfelder, E.; Lang, A.-G.; Buchner, A. G*Power 3: A flexible statistical power analysis program for the social, behavioral, and biomedical sciences. Behav. Res. Methods 2007, 39, 175–191. [Google Scholar] [CrossRef]
- Rohleder, N.; Wolf, J.M.; Maldonado, E.F.; Kirschbaum, C. The psychosocial stress-induced increase in salivary alpha-amylase is independent of saliva flow rate. Psychophysiology 2006, 43, 645–652. [Google Scholar] [CrossRef]
- Bosch, J.A.; Veerman, E.C.; de Geus, E.J.; Proctor, G.B. α-Amylase as a reliable and convenient measure of sympathetic activity: Don’t start salivating just yet! Psychoneuroendocrinology 2011, 36, 449–453. [Google Scholar] [CrossRef] [PubMed]
- Strahler, J.; Skoluda, N.; Kappert, M.B.; Nater, U.M. Simultaneous measurement of salivary cortisol and alpha-amylase: Application and recommendations. Neurosci. Biobehav. Rev. 2017, 83, 657–677. [Google Scholar] [CrossRef] [PubMed]
- Kassner, M.; Patera, W.; Bulling, A. Pupil: An open source platform for pervasive eye tracking and mobile gaze-based interaction. In Proceedings of the 2014 ACM International Joint Conference on Pervasive and Ubiquitous Computing: Adjunct Publication, Seattle, WA, USA, 13–17 September 2014; Association for Computing Machinery: New York, NY, USA, 2014; pp. 1151–1160. [Google Scholar]
- Dierkes, K.; Kassner, M.; Bulling, A. A fast approach to refraction-aware eye-model fitting and gaze prediction. In Proceedings of the 11th ACM Symposium on Eye Tracking Research & Applications, Denver, CO, USA, 25–28 June 2019; Association for Computing Machinery: New York, NY, USA, 2019; p. 23. [Google Scholar]
- Kluyver, T.; Ragan-Kelley, B.; Perez, F.; Granger, B.; Bussonnier, M.; Frederic, J.; Kelley, K.; Hamrick, J.; Grout, J.; Corlay, S.; et al. Jupyter Notebooks—A Publishing Format for Reproducible Computational Workflows; IOS Press: Amsterdam, The Netherlands, 2016. [Google Scholar]
- Mathôt, S.; Vilotijević, A. Methods in cognitive pupillometry: Design, preprocessing, and statistical analysis. Behav. Res. Methods 2023, 55, 3055–3077. [Google Scholar] [CrossRef]
- Winn, M.B.; Wendt, D.; Koelewijn, T.; Kuchinsky, S.E. Best Practices and Advice for Using Pupillometry to Measure Listening Effort: An Introduction for Those Who Want to Get Started. Trends Hear. 2018, 22, 2331216518800869. [Google Scholar] [CrossRef] [PubMed]
- Kret, M.E.; Sjak-Shie, E.E. Preprocessing pupil size data: Guidelines and code. Behav. Res. Methods 2019, 51, 1336–1342. [Google Scholar] [CrossRef]
- Mathôt, S. A Simple Way to Reconstruct Pupil Size during Eye Blinks; FigShare: London, UK, 2013. [Google Scholar] [CrossRef]
- Martin, J.T.; Pinto, J.; Bulte, D.; Spitschan, M. PyPlr: A versatile, integrated system of hardware and software for researching the human pupillary light reflex. Behav. Res. Methods 2022, 54, 2720–2739. [Google Scholar] [CrossRef]
- Martin, J.T.; Spitschan, M. PyPlr, version 1.0.0; Zenodo: Boston, MA, USA, 2021. [Google Scholar] [CrossRef]
- Raybaut, P. Spyder—Documentation. 2009. Available online: https://pythonhosted.org/ (accessed on 23 February 2023).
- Gramfort, A.; Luessi, M.; Larson, E.; Engemann, D.A.; Strohmeier, D.; Brodbeck, C.; Goj, R.; Jas, M.; Brooks, T.; Parkkonen, L.; et al. MEG and EEG data analysis with MNE-Python. Front. Neurosci. 2013, 7, 267. [Google Scholar] [CrossRef]
- Larson, E.; Gramfort, A.; Engemann, D.A.; Leppakangas, J.; Brodbeck, C.; Jas, M.; Brooks, T.; Sassenhagen, J.; Luessi, M.; McCloy, D.; et al. MNE-Python, version 1.6.1; Zenodo: Boston, MA, USA, 2024.
- Somerville, L.H.; Bookheimer, S.Y.; Buckner, R.L.; Burgess, G.C.; Curtiss, S.W.; Dapretto, M.; Elam, J.S.; Gaffrey, M.S.; Harms, M.P.; Hodge, C.; et al. The Lifespan Human Connectome Project in Development: A large-scale study of brain connectivity development in 5–21 year olds. NeuroImage 2018, 183, 456–468. [Google Scholar] [CrossRef]
- de Leeuw, J.R. jsPsych: A JavaScript library for creating behavioral experiments in a Web browser. Behav. Res. Methods 2015, 47, 1–12. [Google Scholar] [CrossRef]
- Verbruggen, F.; Aron, A.R.; Band, G.P.; Beste, C.; Bissett, P.G.; Brockett, A.T.; Brown, J.W.; Chamberlain, S.R.; Chambers, C.D.; Colonius, H.; et al. A consensus guide to capturing the ability to inhibit actions and impulsive behaviors in the stop-signal task. eLife 2019, 8, e46323. [Google Scholar] [CrossRef]
- Cohen, J. Statistical Power Analysis for the Behavioral Sciences, 2nd ed.; Routledge: Oxfordshire, UK, 1988. [Google Scholar] [CrossRef]
- Team, R. RStudio: Integrated Development for R; RStudio: Boston, MA, USA, 2020. [Google Scholar]
- Bates, D.; Mächler, M.; Bolker, B.; Walker, S. Fitting Linear Mixed-Effects Models Using lme4. J. Stat. Softw. 2015, 67, 1–48. [Google Scholar] [CrossRef]
- Ali, N.; Nater, U.M. Salivary Alpha-Amylase as a Biomarker of Stress in Behavioral Medicine. Int. J. Behav. Med. 2020, 27, 337–342. [Google Scholar] [CrossRef] [PubMed]
- Capone, F.; Motolese, F.; Di Zazzo, A.; Antonini, M.; Magliozzi, A.; Rossi, M.; Marano, M.; Pilato, F.; Musumeci, G.; Coassin, M.; et al. The effects of transcutaneous auricular vagal nerve stimulation on pupil size. Clin. Neurophysiol. 2021, 132, 1859–1865. [Google Scholar] [CrossRef] [PubMed]
- Szabadi, E. Functional Organization of the Sympathetic Pathways Controlling the Pupil: Light-Inhibited and Light-Stimulated Pathways. Front. Neurol. 2018, 9, 1069. [Google Scholar] [CrossRef]
- von Wrede, R.; Bröhl, T.; Rings, T.; Pukropski, J.; Helmstaedter, C.; Lehnertz, K. Modifications of Functional Human Brain Networks by Transcutaneous Auricular Vagus Nerve Stimulation: Impact of Time of Day. Brain Sci. 2022, 12, 546. [Google Scholar] [CrossRef]
- Medithe, J.W.C.; Nelakuditi, U.R. Study on the Impact of Light on Human Physiology and Electroencephalogram. J. Biomim. Biomater. Biomed. Eng. 2016, 28, 36–43. [Google Scholar] [CrossRef]
- Gibbings, A.; Ray, L.B.; Berberian, N.; Nguyen, T.; Shahidi Zandi, A.; Owen, A.M.; Comeau, F.J.E.; Fogel, S.M. EEG and behavioural correlates of mild sleep deprivation and vigilance. Clin. Neurophysiol. 2021, 132, 45–55. [Google Scholar] [CrossRef]
- Ricci, L.; Croce, P.; Lanzone, J.; Boscarino, M.; Zappasodi, F.; Tombini, M.; Di Lazzaro, V.; Assenza, G. Transcutaneous Vagus Nerve Stimulation Modulates EEG Microstates and Delta Activity in Healthy Subjects. Brain Sci. 2020, 10, 668. [Google Scholar] [CrossRef]
- Konjusha, A.; Colzato, L.; Mückschel, M.; Beste, C. Auricular Transcutaneous Vagus Nerve Stimulation Diminishes Alpha-Band–Related Inhibitory Gating Processes During Conflict Monitoring in Frontal Cortices. Int. J. Neuropsychopharmacol. 2022, 25, 457–467. [Google Scholar] [CrossRef]
- Chen, Y.; Lu, X.; Hu, L. Transcutaneous Auricular Vagus Nerve Stimulation Facilitates Cortical Arousal and Alertness. Int. J. Environ. Res. Public Health 2023, 20, 1402. [Google Scholar] [CrossRef]
- Lewine, J.D.; Paulson, K.; Bangera, N.; Simon, B.J. Exploration of the Impact of Brief Noninvasive Vagal Nerve Stimulation on EEG and Event-Related Potentials. Neuromodulation Technol. Neural Interface 2019, 22, 564–572. [Google Scholar] [CrossRef]
- Helmers, S.L.; Begnaud, J.; Cowley, A.; Corwin, H.M.; Edwards, J.C.; Holder, D.L.; Kostov, H.; Larsson, P.G.; Levisohn, P.M.; De Menezes, M.S.; et al. Application of a computational model of vagus nerve stimulation. Acta Neurol. Scand. 2012, 126, 336–343. [Google Scholar] [CrossRef] [PubMed]
- Benedetto, A.; Lozano-Soldevilla, D.; VanRullen, R. Different responses of spontaneous and stimulus-related alpha activity to ambient luminance changes. Eur. J. Neurosci. 2018, 48, 2599–2608. [Google Scholar] [CrossRef] [PubMed]
- Farmer, A.D.; Strzelczyk, A.; Finisguerra, A.; Gourine, A.V.; Gharabaghi, A.; Hasan, A.; Burger, A.M.; Jaramillo, A.M.; Mertens, A.; Majid, A.; et al. International Consensus Based Review and Recommendations for Minimum Reporting Standards in Research on Transcutaneous Vagus Nerve Stimulation (Version 2020). Front. Hum. Neurosci. 2021, 14, 568051. [Google Scholar] [CrossRef] [PubMed]
- Mondal, B.; Choudhury, S.; Banerjee, R.; Roy, A.; Chatterjee, K.; Basu, P.; Singh, R.; Halder, S.; Shubham, S.; Baker, S.N.; et al. Effects of non-invasive vagus nerve stimulation on clinical symptoms and molecular biomarkers in Parkinson’s disease. Front. Aging Neurosci. 2024, 15, 1331575. [Google Scholar] [CrossRef] [PubMed]
- Doerr, J.M.; Juenemann, M.; Hakel, L.; Schmidt, L.; Menzler, K.; Krause, K.; Linka, L.; Skoluda, N.; Nater, U.M.; Knake, S. Effect of transcutaneous vagus nerve stimulation on stress-reactive neuroendocrine measures in a sample of persons with temporal lobe epilepsy. Epilepsia Open 2023, 8, 1013–1020. [Google Scholar] [CrossRef]
- Giraudier, M.; Ventura-Bort, C.; Weymar, M. Transcutaneous Vagus Nerve Stimulation (tVNS) Improves High-Confidence Recognition Memory but Not Emotional Word Processing. Front. Psychol. 2020, 11, 1276. [Google Scholar] [CrossRef]
- Koenig, J.; Parzer, P.; Haigis, N.; Liebemann, J.; Jung, T.; Resch, F.; Kaess, M. Effects of acute transcutaneous vagus nerve stimulation on emotion recognition in adolescent depression. Psychol. Med. 2021, 51, 511–520. [Google Scholar] [CrossRef]
- Vespa, S.; Stumpp, L.; Liberati, G.; Delbeke, J.; Nonclercq, A.; Mouraux, A.; El Tahry, R. Characterization of vagus nerve stimulation-induced pupillary responses in epileptic patients. Brain Stimul. 2022, 15, 1498–1507. [Google Scholar] [CrossRef]
- D'Agostini, M.; Burger, A.M.; Franssen, M.; Perkovic, A.; Claes, S.; von Leupoldt, A.; Murphy, P.R.; Van Diest, I. Short bursts of transcutaneous auricular vagus nerve stimulation enhance evoked pupil dilation as a function of stimulation parameters. Cortex 2023, 159, 233–253. [Google Scholar] [CrossRef]
- Urbin, M.A.; Lafe, C.W.; Simpson, T.W.; Wittenberg, G.F.; Chandrasekaran, B.; Weber, D.J. Electrical stimulation of the external ear acutely activates noradrenergic mechanisms in humans. Brain Stimul. 2021, 14, 990–1001. [Google Scholar] [CrossRef] [PubMed]
- Villani, V.; Finotti, G.; Di Lernia, D.; Tsakiris, M.; Azevedo, R.T. Event-related transcutaneous vagus nerve stimulation modulates behaviour and pupillary responses during an auditory oddball task. Psychoneuroendocrinology 2022, 140, 105719. [Google Scholar] [CrossRef] [PubMed]
- Li, Y.; Zhu, H.; Chen, Q.; Yang, L.; Chen, F.; Ma, H.; Xu, H.; Chen, K.; Bu, J.; Zhang, R. Immediate Effects of Vagal Nerve Stimulation in Drug-Resistant Epilepsy Revealed by Magnetoencephalographic Recordings. Brain Connect. 2023, 13, 51–59. [Google Scholar] [CrossRef] [PubMed]
- Neuhaus, A.H.; Luborzewski, A.; Rentzsch, J.; Brakemeier, E.L.; Opgen-Rhein, C.; Gallinat, J.; Bajbouj, M. P300 is enhanced in responders to vagus nerve stimulation for treatment of major depressive disorder. J. Affect. Disord. 2007, 100, 123–128. [Google Scholar] [CrossRef]
- De Taeye, L.; Vonck, K.; van Bochove, M.; Boon, P.; Van Roost, D.; Mollet, L.; Meurs, A.; De Herdt, V.; Carrette, E.; Dauwe, I.; et al. The P3 event-related potential is a biomarker for the efficacy of vagus nerve stimulation in patients with epilepsy. Neurotherapeutics 2014, 11, 612–622. [Google Scholar] [CrossRef] [PubMed]
- Schevernels, H.; van Bochove, M.E.; De Taeye, L.; Bombeke, K.; Vonck, K.; Van Roost, D.; De Herdt, V.; Santens, P.; Raedt, R.; Boehler, C.N. The effect of vagus nerve stimulation on response inhibition. Epilepsy Behav. 2016, 64, 171–179. [Google Scholar] [CrossRef]
- Van Bochove, M.E.; De Taeye, L.; Raedt, R.; Vonck, K.; Meurs, A.; Boon, P.; Dauwe, I.; Notebaert, W.; Verguts, T. Reduced distractor interference during vagus nerve stimulation. Int. J. Psychophysiol. 2018, 128, 93–99. [Google Scholar] [CrossRef]


| 3.4 s Real Stimulation (Baseline) | 3.4 s Real Stimulation | 3.4 s Sham Stimulation (Baseline) | 3.4 s Sham Stimulation | 30 s Real Stimulation (Baseline) | 30 s Real Stimulation | 30 s Sham Stimulation (Baseline) | 30 s Sham Stimulation | |
|---|---|---|---|---|---|---|---|---|
| sAA concentration (U/mL) | 130.43 (160.05) | 160.96 (142.26) | 90.95 (76.10) | 142.52 (91.31) | 95.46 (73.90) | 151.93 (125.30) | 98.43 (56.24) | 123.92 (112.17) |
| sAA secretion (U/min) | 20.00 (31.74) | 39.12 (55.30) | 21.37 (39.87) | 43.21 (50.95) | 25.38 (40.47) | 47.06 (67.35) | 24.96 (33.64) | 28.92 (45.24) |
| Cortisol concentration (nmol/L) | 4.03 (1.72) | 2.20 (0.78) | 4.17 (2.06) | 2.48 (1.14) | 4.10 (2.06) | 2.37 (1.08) | 4.40 (2.23) | 2.17 (1.13) |
Disclaimer/Publisher’s Note: The statements, opinions and data contained in all publications are solely those of the individual author(s) and contributor(s) and not of MDPI and/or the editor(s). MDPI and/or the editor(s) disclaim responsibility for any injury to people or property resulting from any ideas, methods, instructions or products referred to in the content. |
© 2024 by the authors. Licensee MDPI, Basel, Switzerland. This article is an open access article distributed under the terms and conditions of the Creative Commons Attribution (CC BY) license (https://creativecommons.org/licenses/by/4.0/).
Share and Cite
Bömmer, T.; Schmidt, L.M.; Meier, K.; Kricheldorff, J.; Stecher, H.; Herrmann, C.S.; Thiel, C.M.; Janitzky, K.; Witt, K. Impact of Stimulation Duration in taVNS—Exploring Multiple Physiological and Cognitive Outcomes. Brain Sci. 2024, 14, 875. https://doi.org/10.3390/brainsci14090875
Bömmer T, Schmidt LM, Meier K, Kricheldorff J, Stecher H, Herrmann CS, Thiel CM, Janitzky K, Witt K. Impact of Stimulation Duration in taVNS—Exploring Multiple Physiological and Cognitive Outcomes. Brain Sciences. 2024; 14(9):875. https://doi.org/10.3390/brainsci14090875
Chicago/Turabian StyleBömmer, Till, Luisa M. Schmidt, Katharina Meier, Julius Kricheldorff, Heiko Stecher, Christoph S. Herrmann, Christiane M. Thiel, Kathrin Janitzky, and Karsten Witt. 2024. "Impact of Stimulation Duration in taVNS—Exploring Multiple Physiological and Cognitive Outcomes" Brain Sciences 14, no. 9: 875. https://doi.org/10.3390/brainsci14090875
APA StyleBömmer, T., Schmidt, L. M., Meier, K., Kricheldorff, J., Stecher, H., Herrmann, C. S., Thiel, C. M., Janitzky, K., & Witt, K. (2024). Impact of Stimulation Duration in taVNS—Exploring Multiple Physiological and Cognitive Outcomes. Brain Sciences, 14(9), 875. https://doi.org/10.3390/brainsci14090875