
Oxidative Stress and Antioxidant Status in Adult Patients with Transfusion-Dependent Thalassemia: Correlation with Demographic, Laboratory, and Clinical Biomarkers

 ,
,  , , ,
, , ,  ,
,  ,
,  and
and 
Abstract
1. Introduction
2. Materials and Methods
2.1. Study Population
2.2. Biochemical Analysis
2.3. Magnetic Resonance Imaging
2.4. Diagnostic Criteria
2.5. Statistical Analysis
3. Results
3.1. Patient’s Characteristics
3.2. Correlation of Oxidative Stress-Related Biomarkers with Demographic, Clinical and Biochemical Parameters
3.3. Correlation of Oxidative Stress-Related Biomarkers with Cardiovascular Magnetic Resonance Parameters
3.4. Oxidative Status and Complications
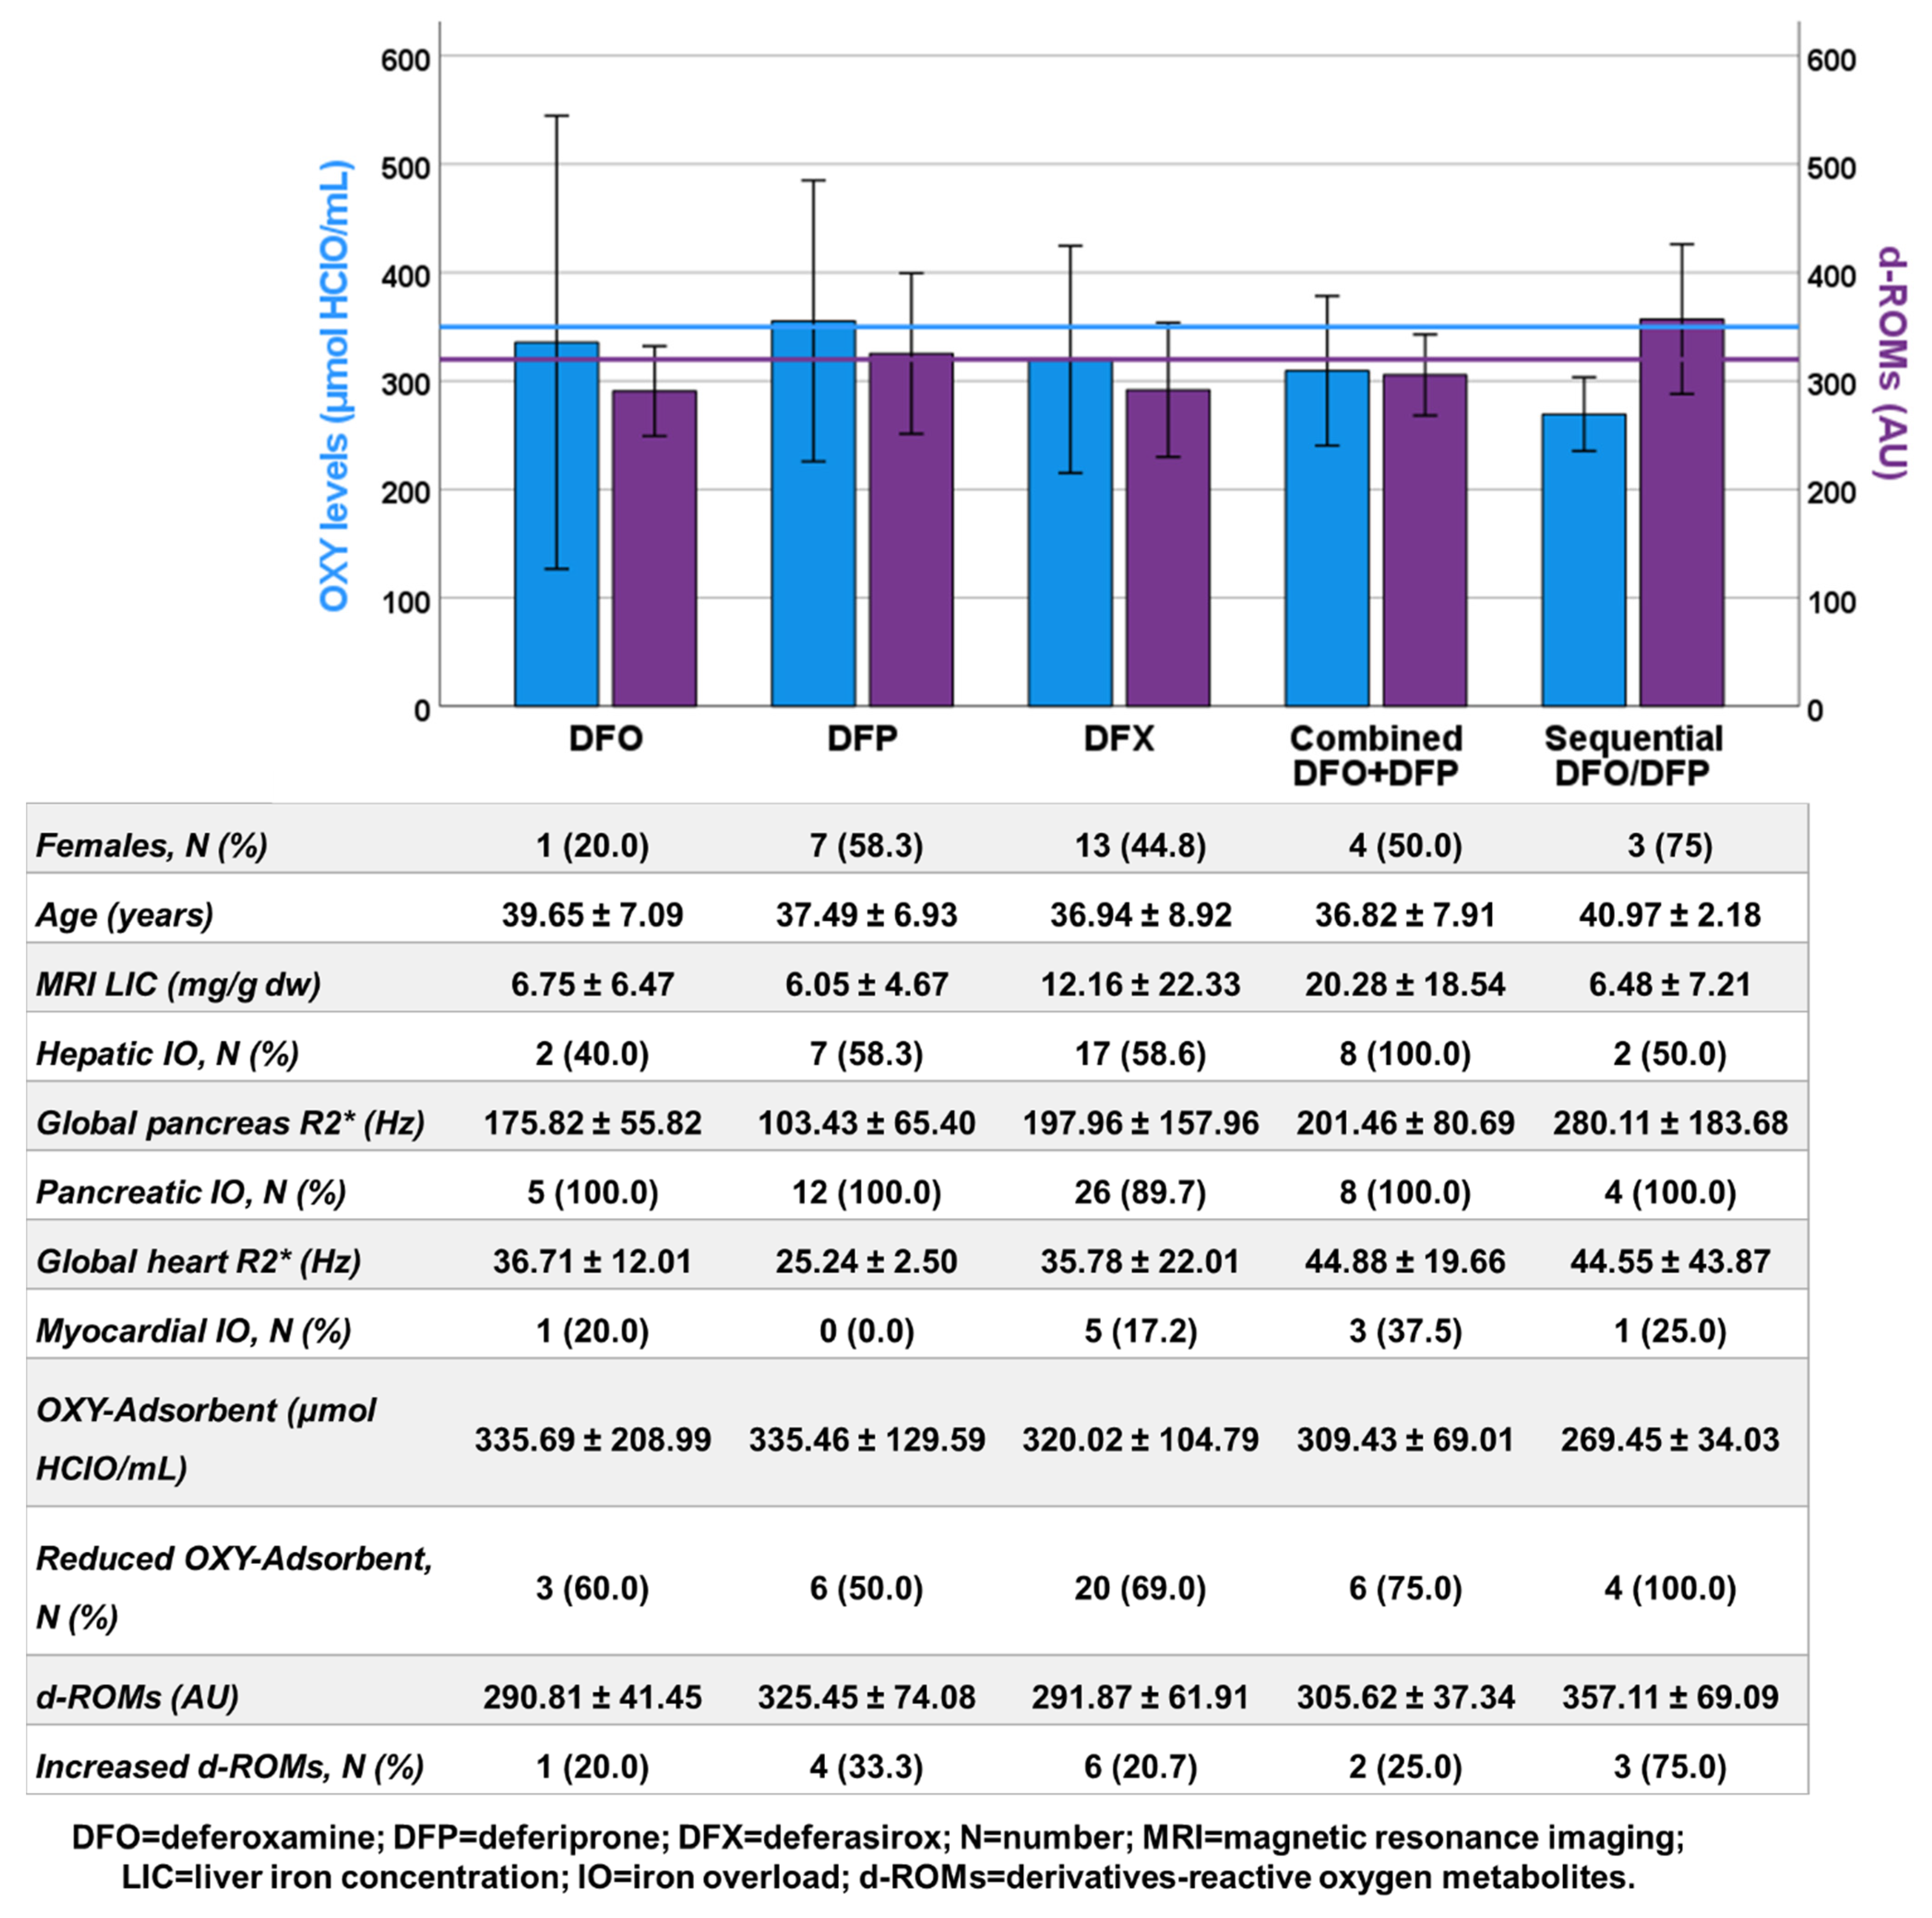
3.5. Oxidative Status and Chelation Therapy
4. Discussion
Limitations
5. Conclusions
Author Contributions
Funding
Institutional Review Board Statement
Informed Consent Statement
Data Availability Statement
Acknowledgments
Conflicts of Interest
References
- Langer, A.L. Beta-Thalassemia. In GeneReviews®; Adam, M.P., Feldman, J., Mirzaa, G.M., Pagon, R.A., Wallace, S.E., Bean, L.J.H., Gripp, K.W., Amemiya, A., Eds.; University of Washington: Seattle, WA, USA, 1993. [Google Scholar]
- Weatherall, D.J.; Clegg, J.B. The Thalassemia Syndromes; Blackwell Science: Oxford, UK, 2001. [Google Scholar]
- Muncie, H.L., Jr.; Campbell, J. Alpha and beta thalassemia. Am. Fam. Physician 2009, 80, 339–344. [Google Scholar] [PubMed]
- Galanello, R.; Origa, R. Beta-thalassemia. Orphanet J. Rare Dis. 2010, 5, 11. [Google Scholar] [CrossRef] [PubMed]
- Modell, B.; Darlison, M. Global epidemiology of haemoglobin disorders and derived service indicators. Bull. World Health Organ. 2008, 86, 480–487. [Google Scholar] [CrossRef] [PubMed]
- Angastiniotis, M.; Vives Corrons, J.L.; Soteriades, E.S.; Eleftheriou, A. The impact of migrations on the health services for rare diseases in Europe: The example of haemoglobin disorders. Sci. World J. 2013, 2013, 727905. [Google Scholar] [CrossRef] [PubMed]
- Kattamis, A.; Forni, G.L.; Aydinok, Y.; Viprakasit, V. Changing patterns in the epidemiology of β-thalassemia. Eur. J. Haematol. 2020, 105, 692–703. [Google Scholar] [CrossRef] [PubMed]
- Ali, S.; Mumtaz, S.; Shakir, H.A.; Khan, M.; Tahir, H.M.; Mumtaz, S.; Mughal, T.A.; Hassan, A.; Kazmi, S.A.R.; Sadia; et al. Current status of beta-thalassemia and its treatment strategies. Mol. Genet. Genom. Med. 2021, 9, e1788. [Google Scholar] [CrossRef] [PubMed]
- Lal, A.; Wong, T.; Keel, S.; Pagano, M.; Chung, J.; Kamdar, A.; Rao, L.; Ikeda, A.; Puthenveetil, G.; Shah, S.; et al. The transfusion management of beta thalassemia in the United States. Transfusion 2021, 61, 3027–3039. [Google Scholar] [CrossRef] [PubMed]
- Weatherall, D.J. The definition and epidemiology of non-transfusion-dependent thalassemia. Blood Rev. 2012, 26 (Suppl. S1), S3–S6. [Google Scholar] [CrossRef] [PubMed]
- Cappellini, M.D.; Cohen, A.; Porter, J.; Taher, A.; Viprakasit, V. Guidelines for the Management of Transfusion Dependent Thalassaemia (TDT) [Internet], 3rd ed.; Thalassaemia International Federation: Nicosia, Cyprus, 2014. [Google Scholar]
- Coates, T.D. Iron overload in transfusion-dependent patients. Hematol. Am. Soc. Hematol. Educ. Program 2019, 2019, 337–344. [Google Scholar] [CrossRef] [PubMed]
- Shah, F.T.; Sayani, F.; Trompeter, S.; Drasar, E.; Piga, A. Challenges of blood transfusions in β-thalassemia. Blood Rev. 2019, 37, 100588. [Google Scholar] [CrossRef] [PubMed]
- Porter, J.B. Optimizing iron chelation strategies in beta-thalassaemia major. Blood Rev. 2009, 23 (Suppl. S1), S3–S7. [Google Scholar] [CrossRef] [PubMed]
- Di Maggio, R.; Maggio, A. The new era of chelation treatments: Effectiveness and safety of 10 different regimens for controlling iron overloading in thalassaemia major. Br. J. Haematol. 2017, 178, 676–688. [Google Scholar] [CrossRef] [PubMed]
- Aydinok, Y. Iron Chelation Therapy as a Modality of Management. Hematol. Oncol. Clin. N. Am. 2018, 32, 261–275. [Google Scholar] [CrossRef] [PubMed]
- Bou-Fakhredin, R.; Motta, I.; Cappellini, M.D.; Taher, A.T. Clinical Complications and Their Management. Hematol. Oncol. Clin. N. Am. 2023, 37, 365–378. [Google Scholar] [CrossRef] [PubMed]
- Fibach, E.; Dana, M. Oxidative Stress in β-Thalassemia. Mol. Diagn. Ther. 2019, 23, 245–261. [Google Scholar] [CrossRef] [PubMed]
- Wood, J.C. Cardiac complications in thalassemia throughout the lifespan: Victories and challenges. Ann. N. Y. Acad. Sci. 2023, 1530, 64–73. [Google Scholar] [CrossRef]
- Vassalle, C.; Meloni, A.; Pistoia, L.; Pepe, A. Liver-Pancreas- Heart Triangle and HCV in Thalassemia: Expanding the Horizon through Biomarker Networks. Int. J. Hematol. Ther. 2017, 3, 1–6. [Google Scholar] [CrossRef]
- Borgna-Pignatti, C.; Gamberini, M.R. Complications of thalassemia major and their treatment. Expert Rev. Hematol. 2011, 4, 353–366. [Google Scholar] [CrossRef] [PubMed]
- Teawtrakul, N.; Jetsrisuparb, A.; Pongudom, S.; Sirijerachai, C.; Chansung, K.; Wanitpongpun, C.; Fucharoen, S. Epidemiologic study of major complications in adolescent and adult patients with thalassemia in Northeastern Thailand: The E-SAAN study phase I. Hematology 2018, 23, 55–60. [Google Scholar] [CrossRef] [PubMed]
- Udeze, C.; Evans, K.A.; Yang, Y.; Lillehaugen, T.; Manjelievskaia, J.; Mujumdar, U.; Li, N.; Andemariam, B. Economic and clinical burden of managing transfusion-dependent β-thalassemia in the United States. J. Med. Econ. 2023, 26, 924–932. [Google Scholar] [CrossRef] [PubMed]
- Farmakis, D.; Giakoumis, A.; Angastiniotis, M.; Eleftheriou, A. The changing epidemiology of the ageing thalassaemia populations: A position statement of the Thalassaemia International Federation. Eur. J. Haematol. 2020, 105, 16–23. [Google Scholar] [CrossRef] [PubMed]
- Meloni, A.; De Marchi, D.; Pistoia, L.; Grassedonio, E.; Peritore, G.; Preziosi, P.; Restaino, G.; Righi, R.; Riva, A.; Renne, S.; et al. Multicenter validation of the magnetic resonance T2* technique for quantification of pancreatic iron. Eur. Radiol. 2019, 29, 2246–2252. [Google Scholar] [CrossRef] [PubMed]
- Trotti, R.; Carratelli, M.; Barbieri, M.; Micieli, G.; Bosone, D.; Rondanelli, M.; Bo, P. Oxidative stress and a thrombophilic condition in alcoholics without severe liver disease. Haematologica 2001, 86, 85–91. [Google Scholar] [PubMed]
- Vassalle, C.; Masini, S.; Carpeggiani, C.; L’Abbate, A.; Boni, C.; Zucchelli, G.C. In vivo total antioxidant capacity: Comparison of two different analytical methods. Clin. Chem. Lab. Med. 2004, 42, 84–89. [Google Scholar] [CrossRef] [PubMed]
- Alberti, A.; Bolognini, L.; Macciantelli, D.; Caratelli, M. The radical cation of N,N-diethyl-para-phenylendiamine: A possible indicator of oxidative stress in biological samples. Res. Chem. Intermed. 2000, 26, 253–267. [Google Scholar] [CrossRef]
- Trotti, R.; Carratelli, M.; Barbieri, M. Performance and clinical application of a new, fast method for the detection of hydroperoxides in serum. Panminerva Med. 2002, 44, 37–40. [Google Scholar] [PubMed]
- Wood, J.C.; Enriquez, C.; Ghugre, N.; Tyzka, J.M.; Carson, S.; Nelson, M.D.; Coates, T.D. MRI R2 and R2* mapping accurately estimates hepatic iron concentration in transfusion-dependent thalassemia and sickle cell disease patients. Blood 2005, 106, 1460–1465. [Google Scholar] [CrossRef] [PubMed]
- Meloni, A.; De Marchi, D.; Positano, V.; Neri, M.G.; Mangione, M.; Keilberg, P.; Lendini, M.; Cirotto, C.; Pepe, A. Accurate estimate of pancreatic T2* values: How to deal with fat infiltration. Abdom Imaging 2015, 40, 3129–3136. [Google Scholar] [CrossRef] [PubMed]
- Cerqueira, M.D.; Weissman, N.J.; Dilsizian, V.; Jacobs, A.K.; Kaul, S.; Laskey, W.K.; Pennell, D.J.; Rumberger, J.A.; Ryan, T.; Verani, M.S. Standardized myocardial segmentation and nomenclature for tomographic imaging of the heart: A statement for healthcare professionals from the Cardiac Imaging Committee of the Council on Clinical Cardiology of the American Heart Association. Circulation 2002, 105, 539–542. [Google Scholar] [PubMed]
- Meloni, A.; Righi, R.; Missere, M.; Renne, S.; Schicchi, N.; Gamberini, M.R.; Cuccia, L.; Lisi, R.; Spasiano, A.; Roberti, M.G.; et al. Biventricular Reference Values by Body Surface Area, Age, and Gender in a Large Cohort of Well-Treated Thalassemia Major Patients Without Heart Damage Using a Multiparametric CMR Approach. J. Magn. Reason. Imaging 2021, 53, 61–70. [Google Scholar] [CrossRef] [PubMed]
- Pepe, A.; Meloni, A.; Borsellino, Z.; Cuccia, L.; Borgna-Pignatti, C.; Maggio, A.; Restaino, G.; Gagliardotto, F.; Caruso, V.; Spasiano, A.; et al. Myocardial fibrosis by late gadolinium enhancement cardiac magnetic resonance and hepatitis C virus infection in thalassemia major patients. J. Cardiovasc. Med. 2015, 16, 689–695. [Google Scholar] [CrossRef] [PubMed]
- Angelucci, E.; Brittenham, G.M.; McLaren, C.E.; Ripalti, M.; Baronciani, D.; Giardini, C.; Galimberti, M.; Polchi, P.; Lucarelli, G. Hepatic iron concentration and total body iron stores in thalassemia major. N. Engl. J. Med. 2000, 343, 327–331. [Google Scholar] [CrossRef]
- Restaino, G.; Meloni, A.; Positano, V.; Missere, M.; Rossi, G.; Calandriello, L.; Keilberg, P.; Mattioni, O.; Maggio, A.; Lombardi, M.; et al. Regional and global pancreatic T*(2) MRI for iron overload assessment in a large cohort of healthy subjects: Normal values and correlation with age and gender. Magn. Reason. Med. 2011, 65, 764–769. [Google Scholar] [CrossRef] [PubMed]
- Anderson, L.J.; Holden, S.; Davis, B.; Prescott, E.; Charrier, C.C.; Bunce, N.H.; Firmin, D.N.; Wonke, B.; Porter, J.; Walker, J.M.; et al. Cardiovascular T2-star (T2*) magnetic resonance for the early diagnosis of myocardial iron overload. Eur. Heart J. 2001, 22, 2171–2179. [Google Scholar] [CrossRef]
- De Sanctis, V.; Soliman, A.T.; Elsedfy, H.; Yaarubi, S.A.; Skordis, N.; Khater, D.; El Kholy, M.; Stoeva, I.; Fiscina, B.; Angastiniotis, M.; et al. The ICET-A Recommendations for the Diagnosis and Management of Disturbances of Glucose Homeostasis in Thalassemia Major Patients. Mediterr. J. Hematol. Infect. Dis. 2016, 8, e2016058. [Google Scholar] [CrossRef] [PubMed]
- Jessup, M.; Abraham, W.T.; Casey, D.E.; Feldman, A.M.; Francis, G.S.; Ganiats, T.G.; Konstam, M.A.; Mancini, D.M.; Rahko, P.S.; Silver, M.A.; et al. 2009 focused update: ACCF/AHA Guidelines for the Diagnosis and Management of Heart Failure in Adults: A report of the American College of Cardiology Foundation/American Heart Association Task Force on Practice Guidelines: Developed in collaboration with the International Society for Heart and Lung Transplantation. Circulation 2009, 119, 1977–2016. [Google Scholar]
- Buxton, A.E.; Calkins, H.; Callans, D.J.; DiMarco, J.P.; Fisher, J.D.; Greene, H.L.; Haines, D.E.; Hayes, D.L.; Heidenreich, P.A.; Miller, J.M.; et al. ACC/AHA/HRS 2006 key data elements and definitions for electrophysiological studies and procedures: A report of the American College of Cardiology/American Heart Association Task Force on Clinical Data Standards (ACC/AHA/HRS Writing Committee to Develop Data Standards on Electrophysiology). Circulation 2006, 114, 2534–2570. [Google Scholar] [PubMed]
- Allen, A.; Perera, S.; Mettananda, S.; Rodrigo, R.; Perera, L.; Darshana, T.; Moggach, F.; Jackson Crawford, A.; Heirene, L.; Fisher, C.; et al. Oxidative status in the β-thalassemia syndromes in Sri Lanka; A cross-sectional survey. Free Radic. Biol. Med. 2021, 166, 337–347. [Google Scholar] [CrossRef] [PubMed]
- Abd-Elmawla, M.A.; Rizk, S.M.; Youssry, I.; Shaheen, A.A. Impact of Genetic Polymorphism of methylenetetrahydrofolate reductase C677T on Development of Hyperhomocysteinemia and Related Oxidative Changes in Egyptian β-Thalassemia Major Patients. PLoS ONE 2016, 11, e0155070. [Google Scholar] [CrossRef] [PubMed]
- Nasseri, E.; Mohammadi, E.; Tamaddoni, A.; Qujeq, D.; Zayeri, F.; Zand, H. Benefits of Curcumin Supplementation on Antioxidant Status in β-Thalassemia Major Patients: A Double-Blind Randomized Controlled Clinical Trial. Ann. Nutr. Metab. 2017, 71, 136–144. [Google Scholar] [CrossRef] [PubMed]
- Darvishi-Khezri, H.; Salehifar, E.; Kosaryan, M.; Karami, H.; Alipour, A.; Shaki, F.; Aliasgharian, A. The impact of silymarin on antioxidant and oxidative status in patients with β-thalassemia major: A crossover, randomized controlled trial. Complement Ther. Med. 2017, 35, 25–32. [Google Scholar] [CrossRef]
- Keshk, W.A.; Hablas, N.M.; Esheba, N.E.S.; Abd Elsalam, S.A. Crosstalk between cytokine profile, redox, and iron status in β-Thalassemia: Relation to frequency/duration of blood transfusion. Pediatr. Hematol. Oncol. 2019, 36, 151–160. [Google Scholar] [CrossRef] [PubMed]
- Arman Bilir, Ö.; Kirkiz, S.; Fettah, A.; Ok Bozkaya, İ.; Kara, A.; Çakar, N.; Yaralı, N. Renal function and the oxidative status among children with thalassemia major and healthy controls: A cross-sectional study. Transfus. Apher. Sci. 2020, 59, 102746. [Google Scholar] [CrossRef] [PubMed]
- Eren, F.; Koca Yozgat, A.; Firat Oğuz, E.; Neşelioğlu, S.; Firat, R.; Gürlek Gökçebay, D.; Yarali, H.N.; Özbek, N.Y.; Erel, Ö. A New Perspective for Potential Organ Damage Due to Iron-Mediated Oxidation in Thalassemia Major Patients. J. Clin. Med. 2023, 12, 2422. [Google Scholar] [CrossRef] [PubMed]
- Manafikhi, H.; Drummen, G.; Palmery, M.; Peluso, I. Total Antioxidant Capacity in beta-thalassemia: A systematic review and meta-analysis of case-control studies. Crit. Rev. Oncol. Hematol. 2017, 110, 35–42. [Google Scholar] [CrossRef] [PubMed]
- Jansen, E.H.; Ruskovska, T. Comparative Analysis of Serum (Anti)oxidative Status Parameters in Healthy Persons. Int. J. Mol. Sci. 2013, 14, 6106–6115. [Google Scholar] [CrossRef] [PubMed]
- Vassalle, C.; Meloni, A.; Pistoia, L.; Gamberini, M.R.; Spasiano, A.; Gerardi, C.; Zuccarelli, A.; Casini, T.; Righi, R.; Missere, M.; et al. Relationship between uric acid levels and cardiometabolic findings in a large cohort of beta-thalassemia major patients. Biomark. Med. 2018, 12, 341–348. [Google Scholar] [CrossRef] [PubMed]
- Noetzli, L.J.; Papudesi, J.; Coates, T.D.; Wood, J.C. Pancreatic iron loading predicts cardiac iron loading in thalassemia major. Blood 2009, 114, 4021–4026. [Google Scholar] [CrossRef] [PubMed]
- Brewer, C.J.; Coates, T.D.; Wood, J.C. Spleen R2 and R2* in iron-overloaded patients with sickle cell disease and thalassemia major. J. Magn. Reason. Imaging 2009, 29, 357–364. [Google Scholar] [CrossRef] [PubMed]
- Noetzli, L.J.; Carson, S.M.; Nord, A.S.; Coates, T.D.; Wood, J.C. Longitudinal analysis of heart and liver iron in thalassemia major. Blood 2008, 112, 2973–2978. [Google Scholar] [CrossRef]
- ElAlfy, M.S.; Khalil Elsherif, N.H.; Ebeid, F.S.E.; Ismail, E.A.R.; Ahmed, K.A.; Darwish, Y.W.; Ibrahim, A.S.; Elghamry, I.R.F.; Shokrey, N.A.; Alajeil, D.N. Renal iron deposition by magnetic resonance imaging in pediatric beta-thalassemia major patients: Relation to renal biomarkers, total body iron and chelation therapy. Eur. J. Radiol. 2018, 103, 65–70. [Google Scholar] [CrossRef] [PubMed]
- Manara, R.; Ponticorvo, S.; Tartaglione, I.; Femina, G.; Elefante, A.; Russo, C.; Carafa, P.A.; Cirillo, M.; Casale, M.; Ciancio, A.; et al. Brain iron content in systemic iron overload: A beta-thalassemia quantitative MRI study. Neuroimage Clin. 2019, 24, 102058. [Google Scholar] [CrossRef] [PubMed]
- Borgna-Pignatti, C.; Rugolotto, S.; De Stefano, P.; Zhao, H.; Cappellini, M.D.; Del Vecchio, G.C.; Romeo, M.A.; Forni, G.L.; Gamberini, M.R.; Ghilardi, R.; et al. Survival and complications in patients with thalassemia major treated with transfusion and deferoxamine. Haematologica 2004, 89, 1187–1193. [Google Scholar] [PubMed]
- Vassalle, C.; Boni, C.; Di Cecco, P.; Ndreu, R.; Zucchelli, G.C. Automation and validation of a fast method for the assessment of in vivo oxidative stress levels. Clin. Chem. Lab. Med. 2006, 44, 1372–1375. [Google Scholar] [CrossRef] [PubMed]
- Vassalle, C.; Vigna, L.; Bianchi, S.; Maffei, S.; Novembrino, C.; De Giuseppe, R.; de Liso, F.; Vannucci, A.; Tirelli, S.; Maiavacca, R.; et al. A biomarker of oxidative stress as a nontraditional risk factor in obese subjects. Biomark. Med. 2013, 7, 633–639. [Google Scholar] [CrossRef] [PubMed]
- Kotani, K.; Tsuzaki, K.; Taniguchi, N.; Sakane, N. Correlation between reactive oxygen metabolites & atherosclerotic risk factors in patients with type 2 diabetes mellitus. Indian J. Med. Res. 2013, 137, 742–748. [Google Scholar] [PubMed]
- Ohara, M.; Fukui, T.; Ouchi, M.; Watanabe, K.; Suzuki, T.; Yamamoto, S.; Yamamoto, T.; Hayashi, T.; Oba, K.; Hirano, T. Relationship between daily and day-to-day glycemic variability and increased oxidative stress in type 2 diabetes. Diabetes Res. Clin. Pract. 2016, 122, 62–70. [Google Scholar] [CrossRef] [PubMed]
- Panagopoulou, V.; Deftereos, S.; Kossyvakis, C.; Raisakis, K.; Giannopoulos, G.; Bouras, G.; Pyrgakis, V.; Cleman, M.W. NTproBNP: An important biomarker in cardiac diseases. Curr. Top. Med. Chem. 2013, 13, 82–94. [Google Scholar] [CrossRef] [PubMed]
- Mueller, C.; McDonald, K.; de Boer, R.A.; Maisel, A.; Cleland, J.G.F.; Kozhuharov, N.; Coats, A.J.S.; Metra, M.; Mebazaa, A.; Ruschitzka, F.; et al. Heart Failure Association of the European Society of Cardiology practical guidance on the use of natriuretic peptide concentrations. Eur. J. Heart Fail. 2019, 21, 715–731. [Google Scholar] [CrossRef]
- Castiglione, V.; Aimo, A.; Vergaro, G.; Saccaro, L.; Passino, C.; Emdin, M. Biomarkers for the diagnosis and management of heart failure. Heart Fail. Rev. 2022, 27, 625–643. [Google Scholar] [CrossRef]
- Hirata, Y.; Yamamoto, E.; Tokitsu, T.; Kusaka, H.; Fujisue, K.; Kurokawa, H.; Sugamura, K.; Maeda, H.; Tsujita, K.; Yamamuro, M.; et al. Reactive oxidative metabolites are associated with the severity of heart failure and predict future cardiovascular events in heart failure with preserved left ventricular ejection fraction. Int. J. Cardiol. 2015, 179, 305–308. [Google Scholar] [CrossRef] [PubMed]
- Pigazzani, F.; Gorni, D.; Dyar, K.A.; Pedrelli, M.; Kennedy, G.; Costantino, G.; Bruno, A.; Mackenzie, I.; MacDonald, T.M.; Tietge, U.J.F.; et al. The Prognostic Value of Derivatives-Reactive Oxygen Metabolites (d-ROMs) for Cardiovascular Disease Events and Mortality: A Review. Antioxidants 2022, 11, 1541. [Google Scholar] [CrossRef] [PubMed]
- Ito, F.; Sono, Y.; Ito, T. Measurement and Clinical Significance of Lipid Peroxidation as a Biomarker of Oxidative Stress: Oxidative Stress in Diabetes, Atherosclerosis, and Chronic Inflammation. Antioxidants 2019, 8, 72. [Google Scholar] [CrossRef] [PubMed]


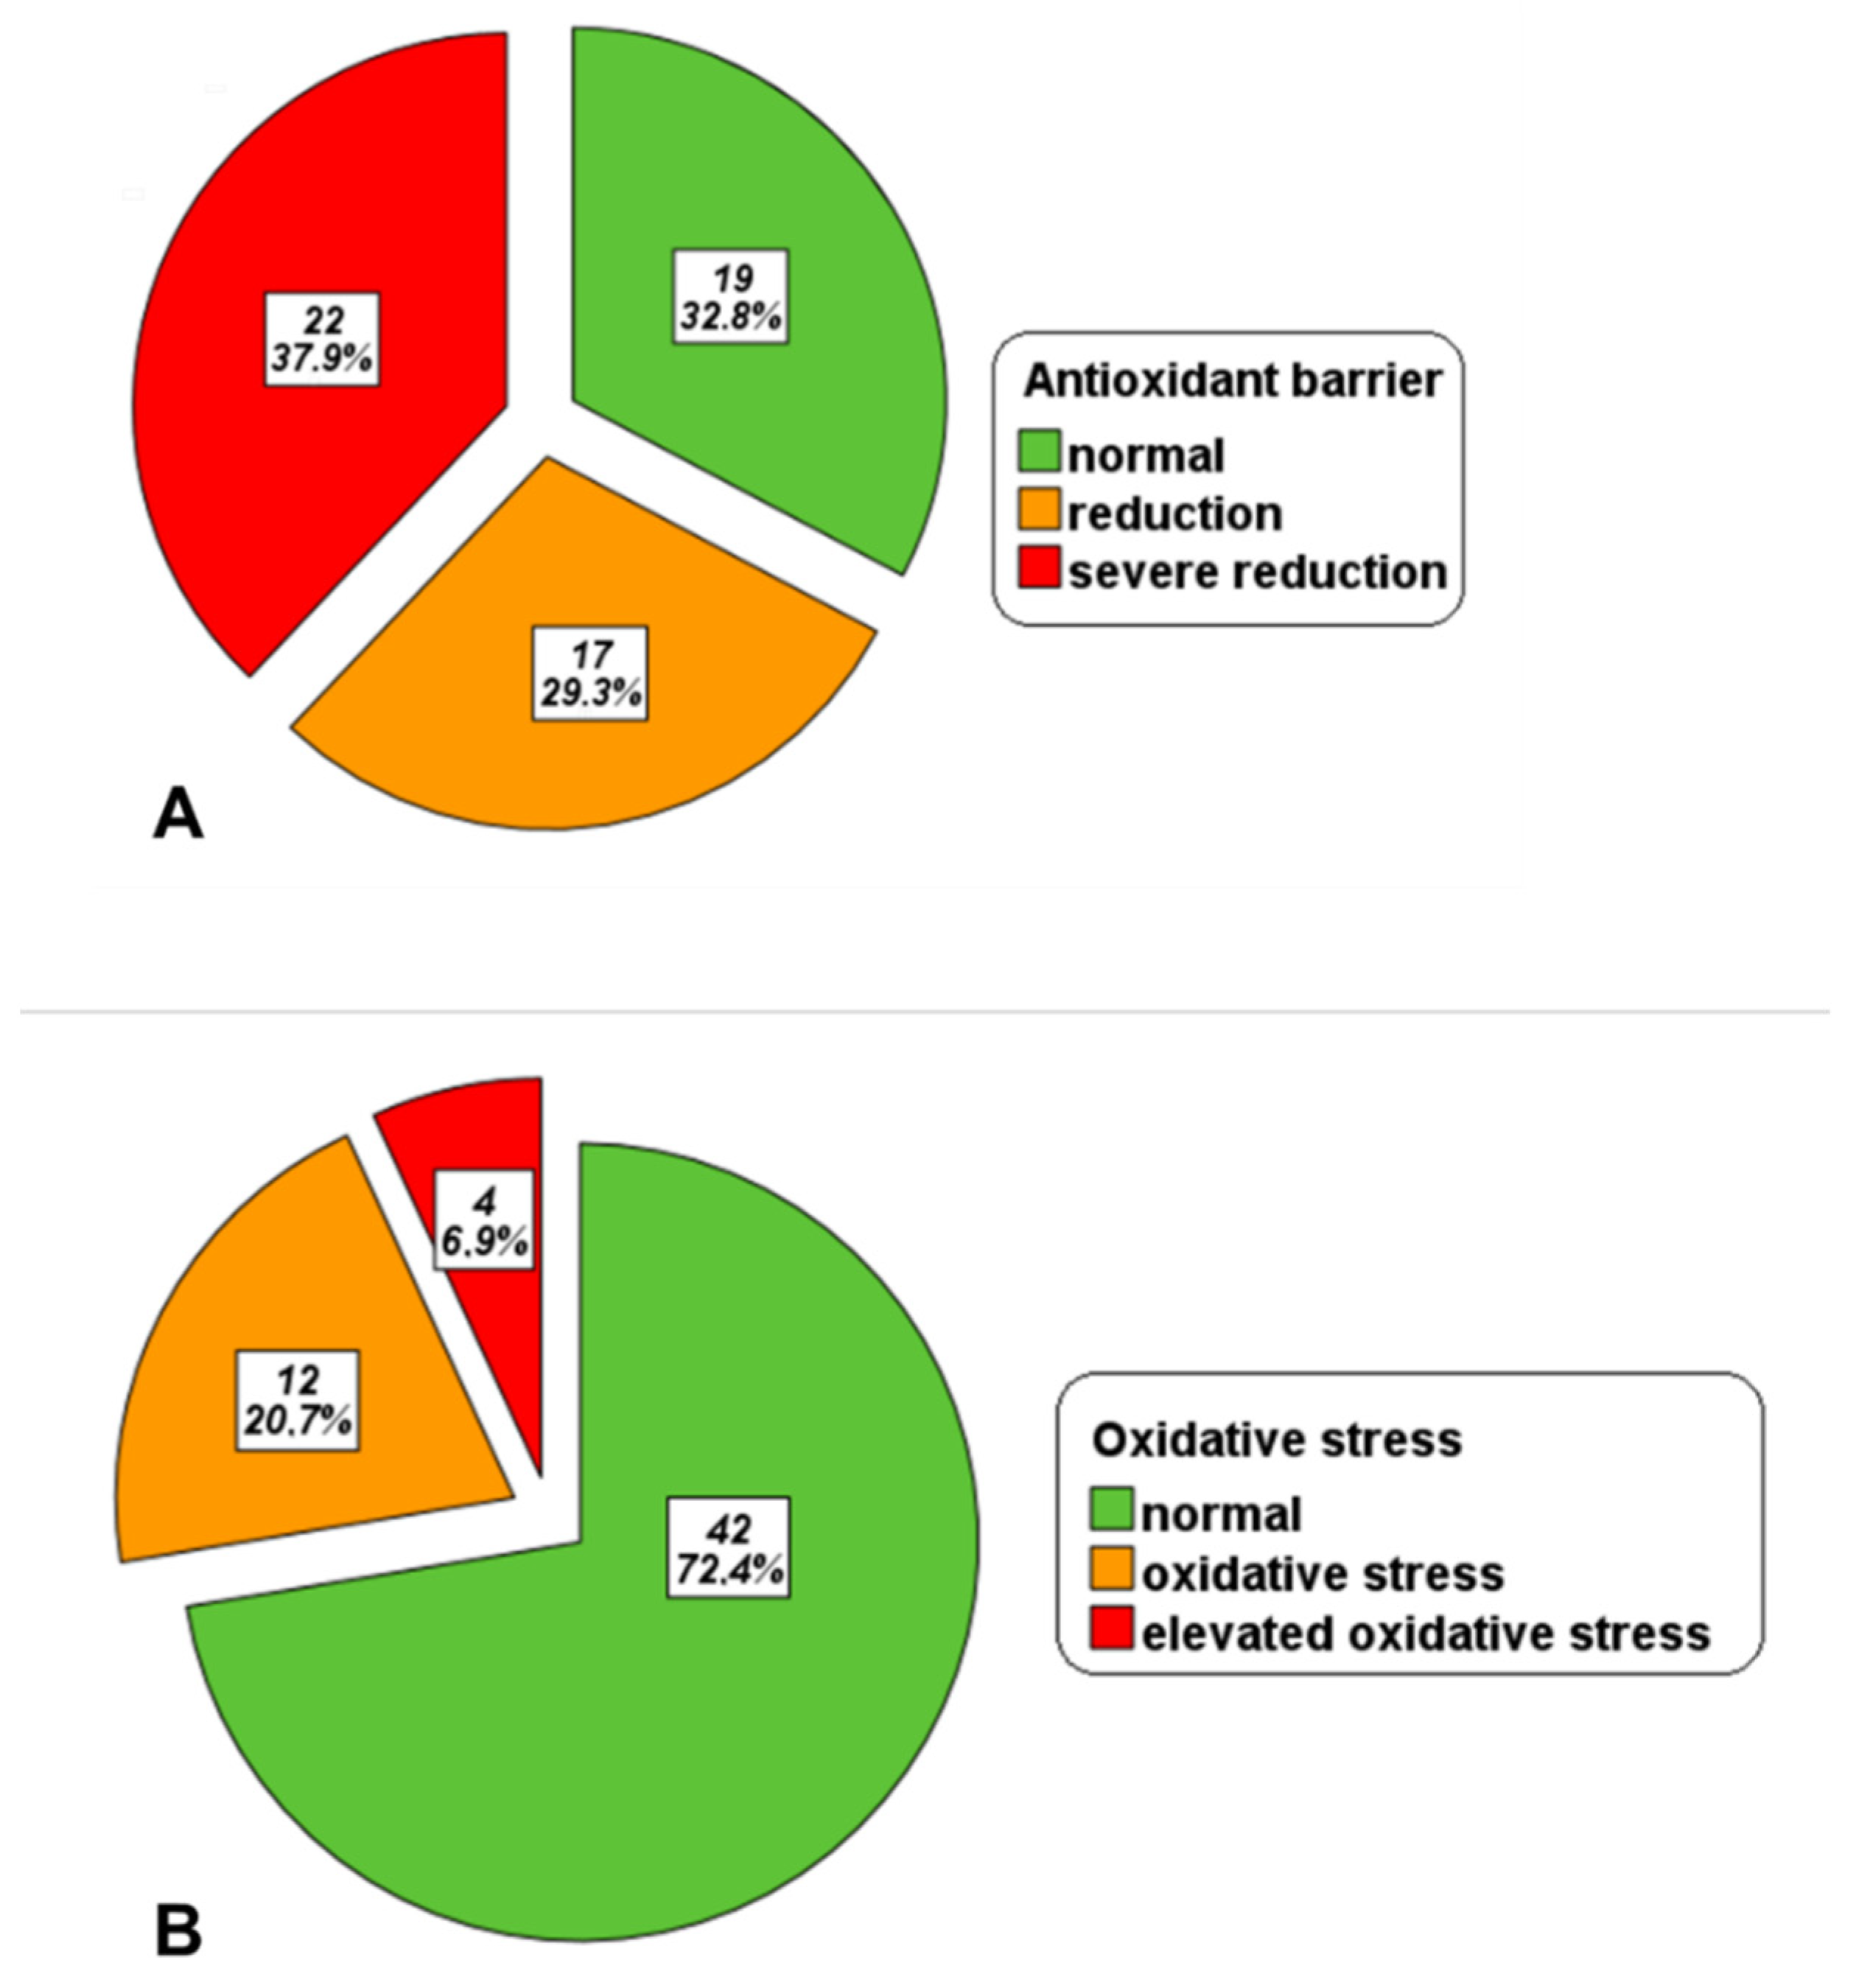
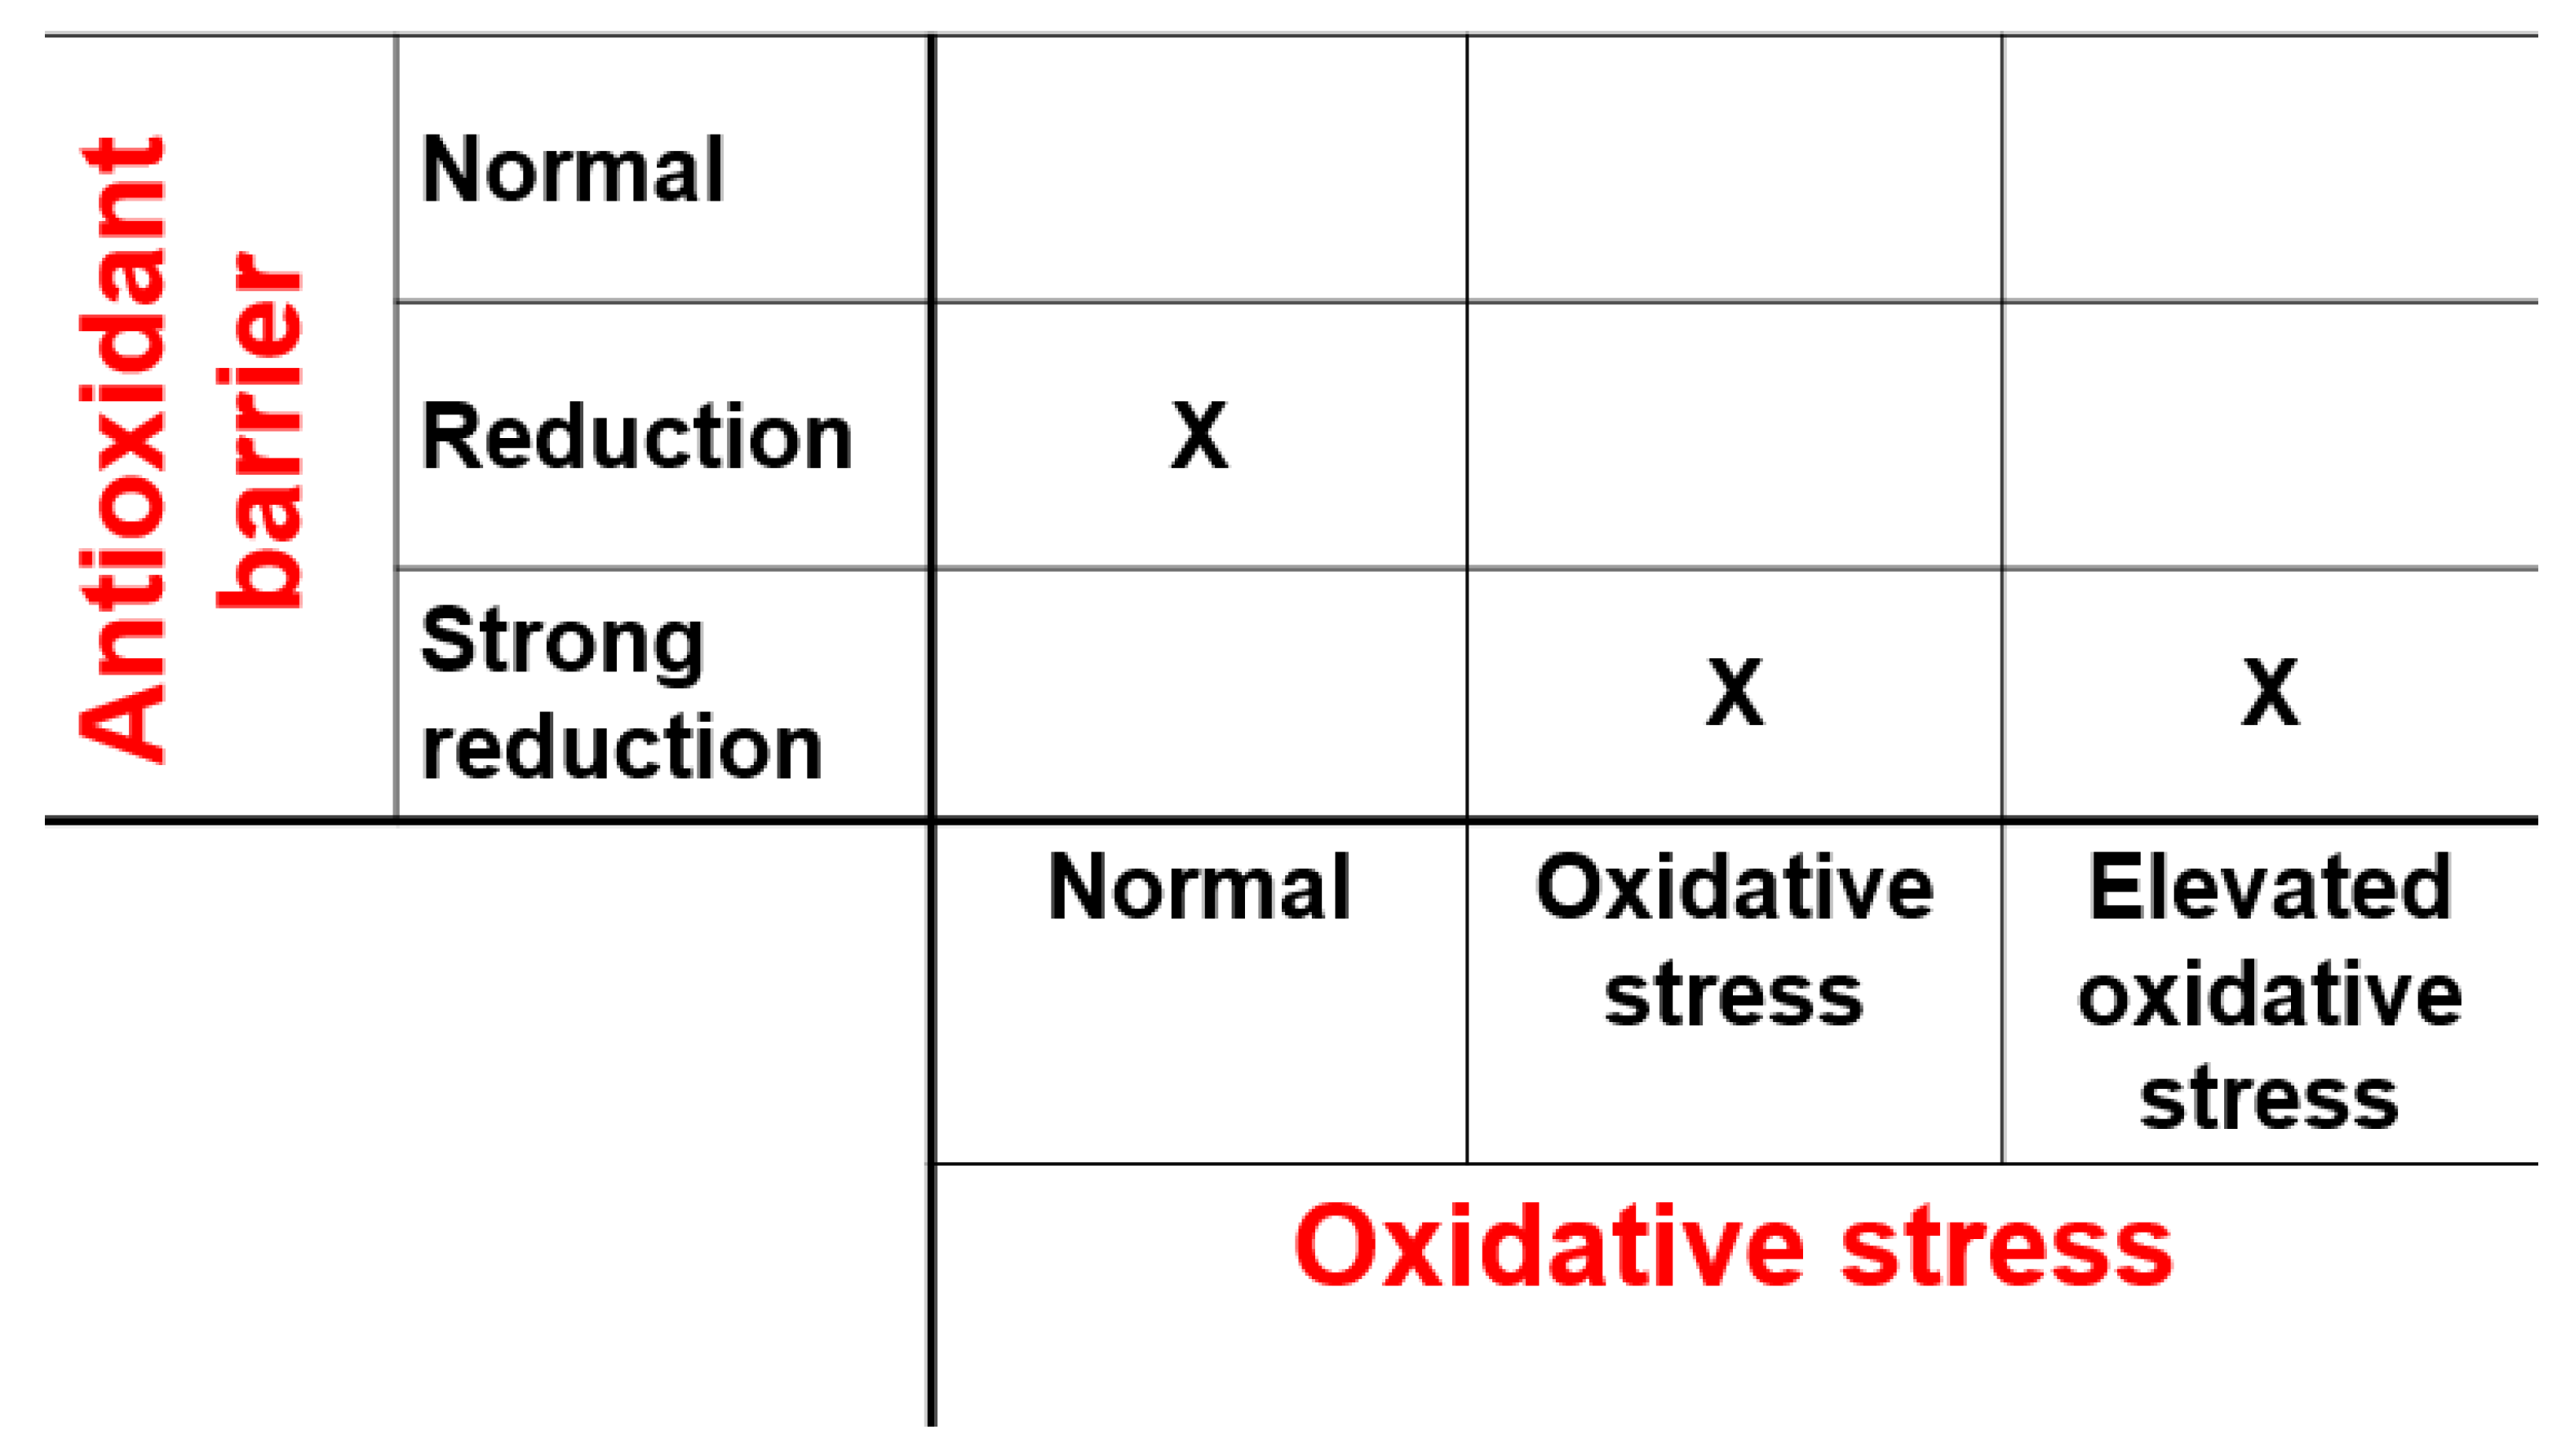
| OXY-Adsorbent Levels (μmol HClO/mL) | Antioxidant Barrier |
|---|---|
| >350 | Normal range |
| 280–349 | Reduction |
| <279 | Severe reduction |
| d-ROMs Levels (AU) | Oxidative Stress Levels |
| 250–320 | Normal range |
| 321–400 | Oxidative stress |
| >401 | Elevated oxidative stress |
| OXY-Adsorbent | d-ROMs | ||
|---|---|---|---|
| Categorical Variable | |||
| Frequency, N (%) | Difference of Oxidative Stress Parameter between Two Groups (Absent vs. Present) | ||
| Female sex | 28 (48.3) | 324.52 ± 110.99 vs. 322.93 ± 117.55 μmol HClO/mL (p = 0.958) | 293.21 ± 58.29 vs. 317.88 ± 64.75 AU (p = 0.125) |
| Splenectomy | 33 (56.9) | 335.35 ± 132.26 vs. 314.97 ± 97.56 μmol HClO/mL (p = 0.599) | 299.18 ± 47.56 vs. 309.62 ± 71.74 AU (p = 0.510) |
| Continuous Variables | |||
| Mean Value | Correlation (R, p-Value) with Oxidative Stress Parameter | ||
| Age (years) | 37.55 ± 7.83 years | R = 0.053, p = 0.693 | R = 0.343, p = 0.008 |
| Age at start of regular transfusions | 21.85 ± 14.71 months | R = 0.097, p = 0.510 | R = 0.184, p = 0.212 |
| Chelation starting age | 3.60 ± 2.45 years | R = 0.150, p = 0.270 | R = 0.139, p = 0.307 |
| Pre-transfusion hemoglobin | 9.59 ± 0.59 g/dL | R = 0.080, p = 0.556 | R = 0.138, p = 0.307 |
| Mean ferritin | 1313.17 ± 1562.05 ng/mL | R = −0.089, p = 0.510 | R = 0.041, p = 0.762 |
| ALT | 40.26 ± 34.79 U/L | R = 0.010, p = 0.942 | R = 0.182, p = 0.187 |
| AST | 36.21 ± 26.19 U/L | R = 0.074, p = 0.594 | R = 0.240, p = 0.078 |
| Total cholesterol | 116.90 ± 36.55 mg/dL | R = 0.158, p = 0.274 | R = 0.252, p = 0.077 |
| Triglycerides | 103.77 ± 43.68 mg/dL | R = 0.213, p = 0.141 | R = −0.077, p = 0.597 |
| HDL cholesterol | 40.79 ± 15.29 mg/dL | R = −0.104, p = 0.529 | R = 0.307, p = 0.057 |
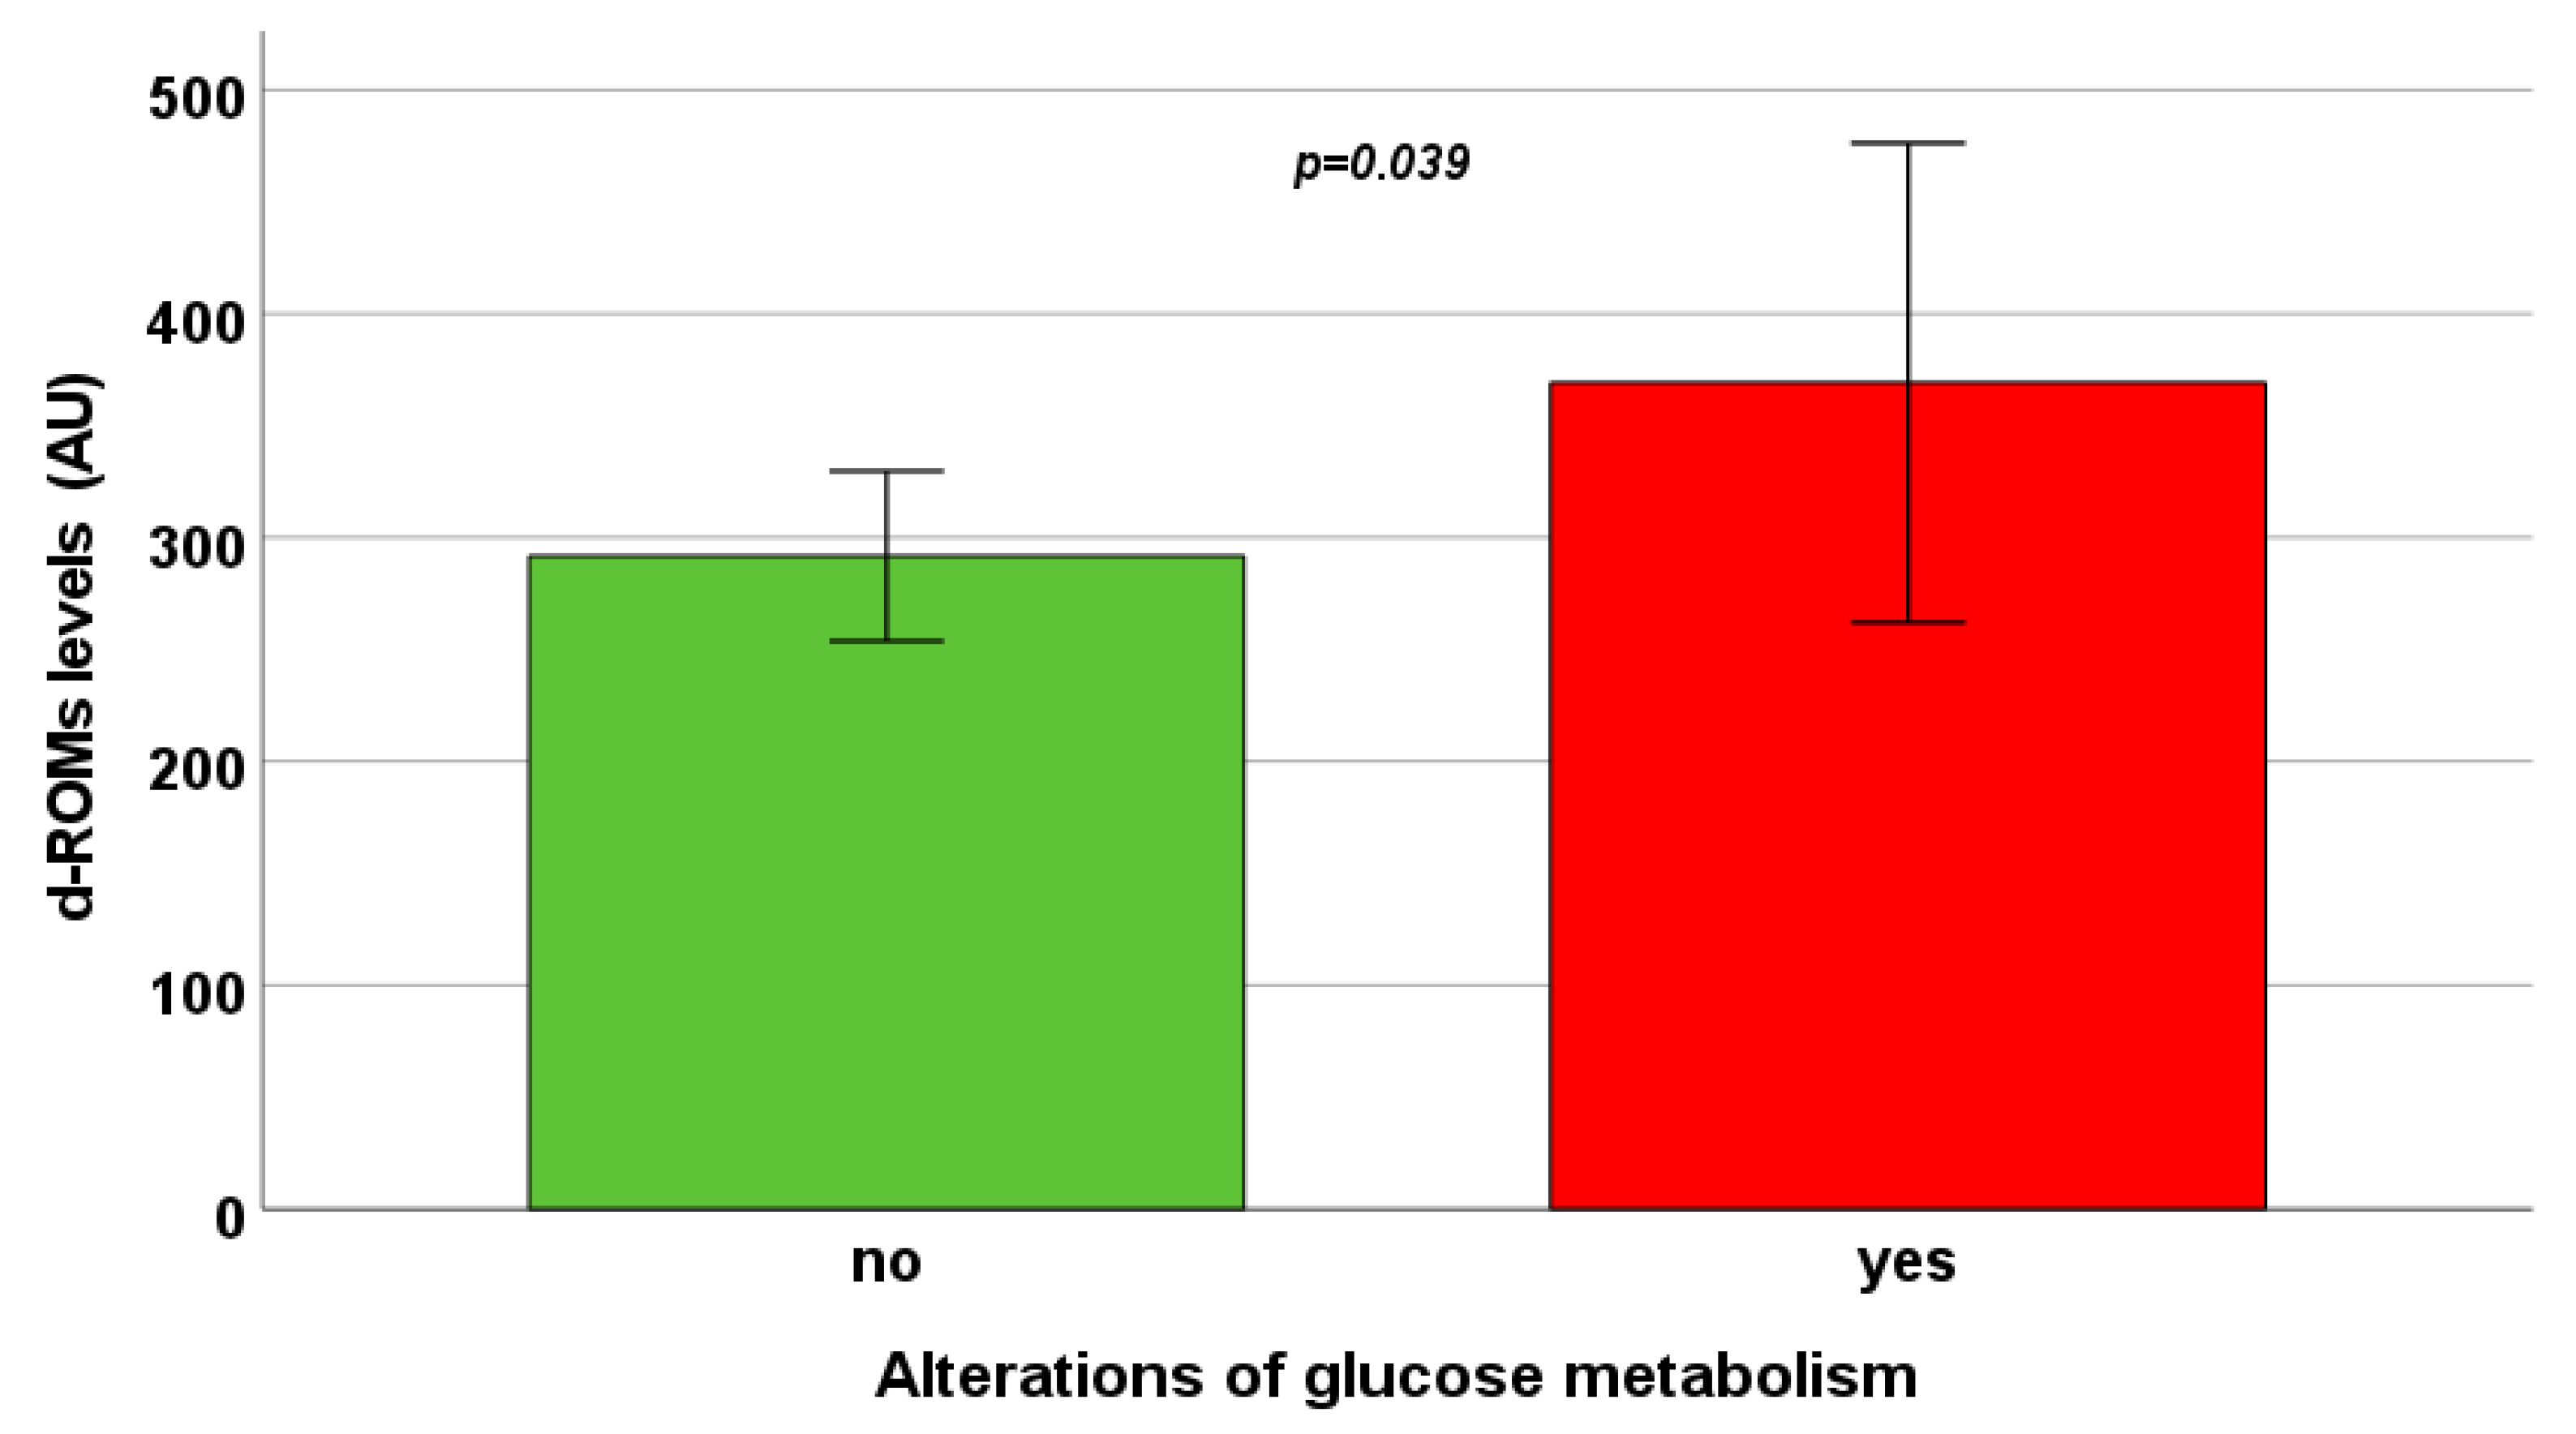
| Fasting glycemia | 94.42 ± 20.11 mg/dL | R = −0.185, p = 0.185 | R = 0.302, p = 0.028 |
| NT-proBNP | 138.56 ± 166.78 pg/mL | R = 0.046, p = 0.798 | R = 0.480, p = 0.004 |
| OXY-Adsorbent | d-ROMs | ||
|---|---|---|---|
| Categorical Variable | |||
| Frequency, N (%) | Difference of Oxidative Stress Parameter between Two Groups (Absent vs. Present) | ||
| LGE | 23/49 (46.9) | 345.10 ± 112.46 vs. 322.47 ± 125.61 μmol HClO/mL (p = 0.326) | 287.02 ± 37.03 vs. 314.66 ± 70.87 AU (p = 0.331) |
| Continuous Variables | |||
| Mean Value | Correlation (R, p-value) with Oxidative Stress Parameter | ||
| MRI LIC | 11.16 ± 17.83 mg/g dw | R = −0.001, p = 0.993 | R = 0.142, p = 0.288 |
| Global pancreas R2* | 182.64 ± 134.30 Hz | R = −0.124, p = 0.352 | R = 0.054, p = 0.689 |
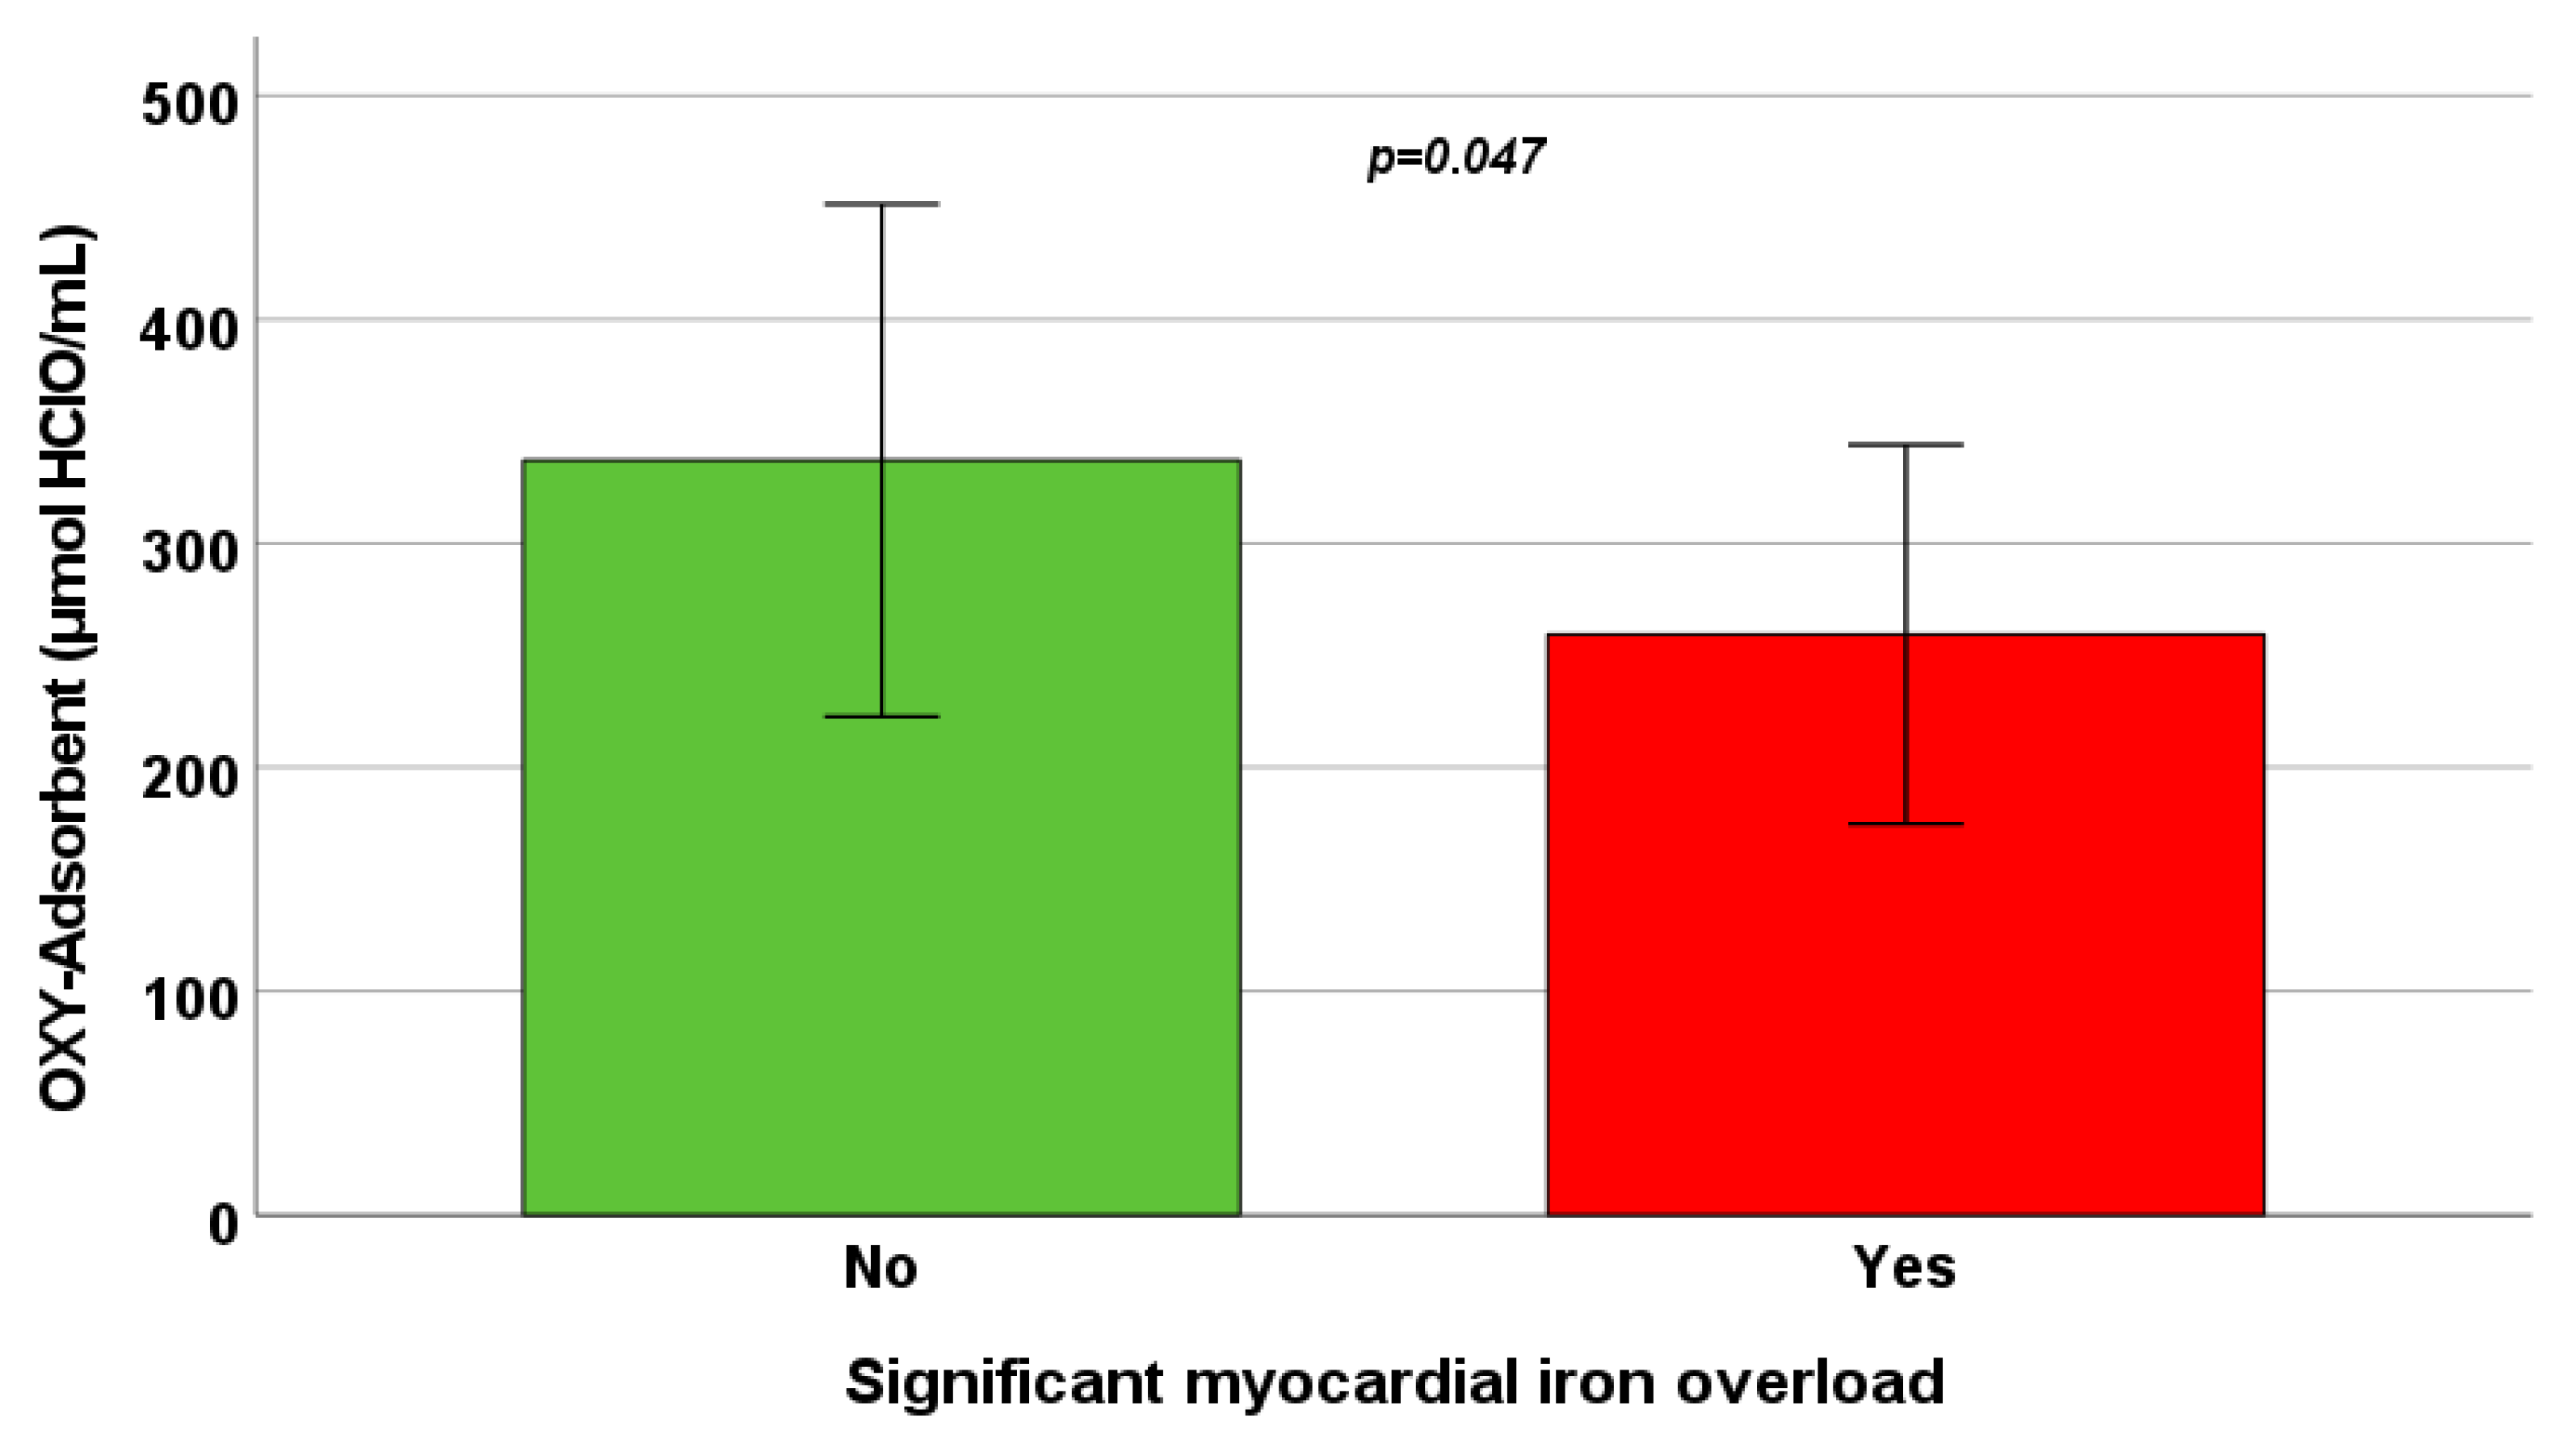
| Global heart R2* | 35.54 ± 20.94 Hz | R = −0.339, p = 0.009 | R = −0.039, p = 0.769 |
| Number of segments with R2* > 50 Hz | 2.88 ± 5.48 | R = −0.278, p = 0.034 | R = 0.075, p = 0.573 |
| LV end-diastolic volume index | 88.86 ± 20.09 mL/m2 | R = 0.074, p = 0.583 | R = −0.184, p = 0.170 |
| LV end-systolic volume index | 32.44 ± 10.36 mL/m2 | R = 0.044, p = 0.744 | R = −0.088, p = 0.517 |
| LV mass index | 63.51 ± 14.53 g/m2 | R = 0.010, p = 0.943 | R = −0.030, p = 0.826 |
| LV ejection fraction | 63.96 ± 6.26% | R = −0.035, p = 0.798 | R = −0.034, p = 0.800 |
| RV end-diastolic volume index | 89.33 ± 20.79 mL/m2 | R = 0.069, p = 0.610 | R = −0.225, p = 0.092 |
| RV end-systolic volume index | 34.51 ± 11.74 mL/m2 | R = 0.088, p = 0.517 | R = −0.195, p = 0.145 |
| RV ejection fraction | 61.05 ± 6.16% | R = −0.048, p = 0.723 | R = 0.210, p = 0.117 |
| Left atrial area index | 14.25 ± 3.27 cm2/m2 | R = −0.067, p = 0.631 | R = 0.208, p = 0.131 |
| Right atrial area index | 12.79 ± 1.92 cm2/m2 | R = 0.085, p = 0.541 | R = −0.146, p = 0.292 |
Disclaimer/Publisher’s Note: The statements, opinions and data contained in all publications are solely those of the individual author(s) and contributor(s) and not of MDPI and/or the editor(s). MDPI and/or the editor(s) disclaim responsibility for any injury to people or property resulting from any ideas, methods, instructions or products referred to in the content. |
© 2024 by the authors. Licensee MDPI, Basel, Switzerland. This article is an open access article distributed under the terms and conditions of the Creative Commons Attribution (CC BY) license (https://creativecommons.org/licenses/by/4.0/).
Share and Cite
Meloni, A.; Pistoia, L.; Spasiano, A.; Cossu, A.; Casini, T.; Massa, A.; Bagnato, S.; Putti, M.C.; Maffei, S.; Positano, V.; et al. Oxidative Stress and Antioxidant Status in Adult Patients with Transfusion-Dependent Thalassemia: Correlation with Demographic, Laboratory, and Clinical Biomarkers. Antioxidants 2024, 13, 446. https://doi.org/10.3390/antiox13040446
Meloni A, Pistoia L, Spasiano A, Cossu A, Casini T, Massa A, Bagnato S, Putti MC, Maffei S, Positano V, et al. Oxidative Stress and Antioxidant Status in Adult Patients with Transfusion-Dependent Thalassemia: Correlation with Demographic, Laboratory, and Clinical Biomarkers. Antioxidants. 2024; 13(4):446. https://doi.org/10.3390/antiox13040446
Chicago/Turabian StyleMeloni, Antonella, Laura Pistoia, Anna Spasiano, Antonella Cossu, Tommaso Casini, Antonella Massa, Sergio Bagnato, Maria Caterina Putti, Silvia Maffei, Vincenzo Positano, and et al. 2024. "Oxidative Stress and Antioxidant Status in Adult Patients with Transfusion-Dependent Thalassemia: Correlation with Demographic, Laboratory, and Clinical Biomarkers" Antioxidants 13, no. 4: 446. https://doi.org/10.3390/antiox13040446
APA StyleMeloni, A., Pistoia, L., Spasiano, A., Cossu, A., Casini, T., Massa, A., Bagnato, S., Putti, M. C., Maffei, S., Positano, V., Pepe, A., Cademartiri, F., & Vassalle, C. (2024). Oxidative Stress and Antioxidant Status in Adult Patients with Transfusion-Dependent Thalassemia: Correlation with Demographic, Laboratory, and Clinical Biomarkers. Antioxidants, 13(4), 446. https://doi.org/10.3390/antiox13040446