
Comparison of Predictive Factors of Flu Vaccine Uptake Pre- and Post-COVID-19 Using the NIS-Teen Survey
 , , and
Abstract
:1. Introduction
2. Materials and Methods
Code and Data Availability
3. Results
4. Discussion
5. Conclusions
Supplementary Materials
Author Contributions
Funding
Institutional Review Board Statement
Informed Consent Statement
Data Availability Statement
Acknowledgments
Conflicts of Interest
References
- Lemaitre, M.; Carrat, F. Comparative age distribution of influenza morbidity and mortality during seasonal influenza epidemics and the 2009 H1N1 pandemic. BMC Infect. Dis. 2010, 10, 162. [Google Scholar] [CrossRef] [PubMed]
- Mertz, D.; Kim, T.H.; Johnstone, J.; Lam, P.P.; Science, M.; Kuster, S.P.; Fadel, S.A.; Tran, D.; Fernandez, E.; Bhatnagar, N.; et al. Populations at risk for severe or complicated influenza illness: Systematic review and meta-analysis. BMJ 2013, 347, f5061. [Google Scholar] [CrossRef] [PubMed]
- Osterholm, M.T.; Kelley, N.S.; Sommer, A.; Belongia, E.A. Efficacy and effectiveness of influenza vaccines: A systematic review and meta-analysis. Lancet Infect. Dis. 2012, 12, 36–44. [Google Scholar] [CrossRef] [PubMed]
- Thompson, W.W.; Shay, D.K.; Weintraub, E.; Brammer, L.; Cox, N.; Anderson, L.J.; Fukuda, K. Mortality associated with influenza and respiratory syncytial virus in the United States. JAMA 2003, 289, 179–186. [Google Scholar] [CrossRef] [PubMed]
- CDC. Flu Vaccination Coverage, United States, 2018–2019 Influenza Season. Available online: https://www.cdc.gov/flu/fluvaxview/coverage-1819estimates.htm (accessed on 24 May 2024).
- Redd, D.S.; Jensen, J.L.; Bodily, R.J.; Lee, A.A.; Skyles, T.J.; Poole, B.D. Cautious Sexual Attitudes Diminish Intent to Vaccinate Children against HPV in Utah. Vaccines 2022, 10, 1382. [Google Scholar] [CrossRef] [PubMed]
- Pogue, K.; Altman, J.D.; Lee, A.A.; Miner, D.S.; Skyles, T.J.; Bodily, R.J.; Crook, T.B.; Nielson, B.U.; Hinton, K.; Busacker, L.; et al. Decrease in Overall Vaccine Hesitancy in College Students during the COVID-19 Pandemic. Vaccines 2023, 11, 1132. [Google Scholar] [CrossRef] [PubMed]
- Skyles, T.J.; Stevens, H.P.; Obray, A.M.; Jensen, J.L.; Miner, D.S.; Bodily, R.J.; Nielson, B.U.; Poole, B.D. Changes in Attitudes and Barriers to Seasonal Influenza Vaccination from 2007 to 2023. J. Community Health 2024, 49, 207–217. [Google Scholar] [CrossRef]
- Agarwal, R.; Dugas, M.; Ramaprasad, J.; Luo, J.; Li, G.; Gao, G.G. Socioeconomic privilege and political ideology are associated with racial disparity in COVID-19 vaccination. Proc. Natl. Acad. Sci. USA 2021, 118, e2107873118. [Google Scholar] [CrossRef]
- Lewnard, J.A.; Cobey, S. Immune History and Influenza Vaccine Effectiveness. Vaccines 2018, 6, 28. [Google Scholar] [CrossRef]
- Lewis, N.M.; Chung, J.R.; Uyeki, T.M.; Grohskopf, L.; Ferdinands, J.M.; Patel, M.M. Interpretation of Relative Efficacy and Effectiveness for Influenza Vaccines. Clin. Infect. Dis. 2022, 75, 170–175. [Google Scholar] [CrossRef]
- Loeb, M.; Russell, M.L.; Moss, L.; Fonseca, K.; Fox, J.; Earn, D.J.D.; Aoki, F.; Horsman, G.; Van Caeseele, P.; Chokani, K.; et al. Effect of Influenza Vaccination of Children on Infection Rates in Hutterite Communities: A Randomized Trial. JAMA 2010, 303, 943–950. [Google Scholar] [CrossRef] [PubMed]
- Rolfes, M.A.; Flannery, B.; Chung, J.R.; O’Halloran, A.; Garg, S.; Belongia, E.A.; Gaglani, M.; Zimmerman, R.K.; Jackson, M.L.; Monto, A.S.; et al. Effects of Influenza Vaccination in the United States during the 2017–2018 Influenza Season. Clin. Infect. Dis. 2019, 69, 1845–1853. [Google Scholar] [CrossRef] [PubMed]
- Vergara, R.J.D.; Sarmiento, P.J.D.; Lagman, J.D.N. Building public trust: A response to COVID-19 vaccine hesitancy predicament. J. Public Health 2021, 43, e291–e292. [Google Scholar] [CrossRef]
- Quinn, S.C.; Andrasik, M.P. Addressing Vaccine Hesitancy in BIPOC Communities—Toward Trustworthiness, Partnership, and Reciprocity. N. Engl. J. Med. 2021, 385, 97–100. [Google Scholar] [CrossRef] [PubMed]
- Patelarou, A.; Saliaj, A.; Galanis, P.; Pulomenaj, V.; Prifti, V.; Sopjani, I.; Mechili, E.A.; Laredo-Aguilera, J.A.; Kicaj, E.; Kalokairinou, A.; et al. Predictors of nurses’ intention to accept COVID-19 vaccination: A cross-sectional study in five European countries. J. Clin. Nurs. 2022, 31, 1258–1266. [Google Scholar] [CrossRef]
- Tran, N.; Cortright, L.; Buckman, C.; Tumin, D.; Syed, S. Association between asthma and influenza vaccine uptake among US adolescents: A retrospective survey study. J. Asthma 2022, 59, 1256–1262. [Google Scholar] [CrossRef]
- Beeninga, F.T.; Cortright, L.; Buckman, C.; Tumin, D.; Syed, S. Influence of measles-mumps-rubella vaccine series initiation and completion on influenza vaccination among adolescents. Int. J. Pediatr. Adolesc. Med. 2022, 9, 11–15. [Google Scholar] [CrossRef]
- Elam-Evans, L.D.; Hu, S.; Pingali, C.; Singleton, J.A.; Francis, R.; Skalland, B.; Wolter, K.; Yarbrough, M. National Immunization Survey-Teen. A Users Guide for the 2022 Public-Use Data File. Available online: https://www.cdc.gov/vaccines/imz-managers/nis/downloads/NIS-TEEN-PUF22-DUG.pdf (accessed on 24 May 2024).
- Leuchter, R.K.; Jackson, N.J.; Mafi, J.N.; Sarkisian, C.A. Association between Covid-19 Vaccination and Influenza Vaccination Rates. N. Engl. J. Med. 2022, 386, 2531–2532. [Google Scholar] [CrossRef]
- Stevens, H.P.; Olsen, J.; Kirkland, J.K.; Ess, D.H. Tolman Electronic Parameter Predictions from a Machine Learning Model Provide Insight into Phosphine Ligand Electronic Effects. Organometallics 2023, 43, 40–47. [Google Scholar] [CrossRef]
- Hancock, J.T.; Khoshgoftaar, T.M. Survey on categorical data for neural networks. J. Big Data 2020, 7, 28. [Google Scholar] [CrossRef]
- Hoving, T.; Wood, G. American Gothic: The Biography of Grant Wood’s American Masterpiece; Chamberlain Bros.: New York, NY, USA, 2005; 165p. [Google Scholar]
- Zhang, P.; Jia, Y.; Shang, Y. Research and application of XGBoost in imbalanced data. Int. J. Distrib. Sens. Netw. 2022, 18, 15501329221106935. [Google Scholar] [CrossRef]
- Fang, Z.G.; Yang, S.Q.; Lv, C.X.; An, S.Y.; Wu, W. Application of a data-driven XGBoost model for the prediction of COVID-19 in the USA: A time-series study. BMJ Open 2022, 12, e056685. [Google Scholar] [CrossRef]
- Zheng, J.; Li, J.; Zhang, Z.; Yu, Y.; Tan, J.; Liu, Y.; Gong, J.; Wang, T.; Wu, X.; Guo, Z. Clinical Data based XGBoost Algorithm for infection risk prediction of patients with decompensated cirrhosis: A 10-year (2012–2021) Multicenter Retrospective Case-control study. BMC Gastroenterol. 2023, 23, 310. [Google Scholar] [CrossRef] [PubMed]
- Chen, T.; Guestrin, C. Xgboost: A scalable tree boosting system. In Proceedings of the 22nd ACM SIGKDD International Conference on Knowledge Discovery and Data Mining, New York, NY, USA, 13–17 August 2016; pp. 785–794. [Google Scholar]
- Rand, C.M.; Shone, L.P.; Albertin, C.; Auinger, P.; Klein, J.D.; Szilagyi, P.G. National health care visit patterns of adolescents: Implications for delivery of new adolescent vaccines. Arch. Pediatr. Adolesc. Med. 2007, 161, 252–259. [Google Scholar] [CrossRef] [PubMed]
- Glass, L.M.; Glass, R.J. Social contact networks for the spread of pandemic influenza in children and teenagers. BMC Public Health 2008, 8, 61. [Google Scholar] [CrossRef]
- Wiemken, T.L.; Khan, F.; Puzniak, L.; Yang, W.; Simmering, J.; Polgreen, P.; Nguyen, J.L.; Jodar, L.; McLaughlin, J.M. Seasonal trends in COVID-19 cases, hospitalizations, and mortality in the United States and Europe. Sci. Rep. 2023, 13, 3886. [Google Scholar] [CrossRef]
- Ashby-Hughes, B.; Nickerson, N. Provider endorsement: The strongest cue in prompting high-risk adults to receive influenza and pneumococcal immunizations. Clin. Excell. Nurse Pract. 1999, 3, 97–104. [Google Scholar]
- Benedict, K.M.; Santibanez, T.A.; Black, C.L.; Ding, H.; Graitcer, S.B.; Bridges, C.B.; Kennedy, E.D. Recommendations and offers for adult influenza vaccination, 2011–2012 season, United States. Vaccine 2017, 35, 1353–1361. [Google Scholar] [CrossRef]
- Kahn, K.E.; Santibanez, T.A.; Zhai, Y.; Bridges, C.B. Association between provider recommendation and influenza vaccination status among children. Vaccine 2018, 36, 3486–3497. [Google Scholar] [CrossRef]
- Forshaw, J.; Gerver, S.M.; Gill, M.; Cooper, E.; Manikam, L.; Ward, H. The global effect of maternal education on complete childhood vaccination: A systematic review and meta-analysis. BMC Infect. Dis. 2017, 17, 801. [Google Scholar] [CrossRef]
- Freimuth, V.S.; Jamison, A.M.; An, J.; Hancock, G.R.; Quinn, S.C. Determinants of trust in the flu vaccine for African Americans and Whites. Soc. Sci. Med. 2017, 193, 70–79. [Google Scholar] [CrossRef]
- Chen, J.Y.; Fox, S.A.; Cantrell, C.H.; Stockdale, S.E.; Kagawa-Singer, M. Health disparities and prevention: Racial/ethnic barriers to flu vaccinations. J. Community Health 2007, 32, 5–20. [Google Scholar] [CrossRef] [PubMed]
- Quinn, S.C.; Jamison, A.M.; An, J.; Hancock, G.R.; Freimuth, V.S. Measuring vaccine hesitancy, confidence, trust and flu vaccine uptake: Results of a national survey of White and African American adults. Vaccine 2019, 37, 1168–1173. [Google Scholar] [CrossRef] [PubMed]
- Mourad, N.; Mourad, L.; Hammoudi Halat, D.; Farah, Z.; Hendaus, M.; El Sayed Trad, I.; El Akel, M.; Safwan, J.; Rahal, M.; Younes, S. Factors Affecting Influenza Vaccination Uptake and Attitudes among Lebanese University Students: The Impact of Vaccination Promotional Programs and COVID-19 Pandemic. Vaccines 2023, 11, 949. [Google Scholar] [CrossRef]
- Gatwood, J.; Ramachandran, S.; Shuvo, S.A.; Behal, M.; Hagemann, T.; Hohmeier, K.C.; Chiu, C.-Y. Social determinants of health and adult influenza vaccination: A nationwide claims analysis. J. Manag. Care Spec. Pharm. 2022, 28, 196–205. [Google Scholar] [CrossRef]


| Flu Vaccinations in Past Three Years (%) | |||||||
|---|---|---|---|---|---|---|---|
| Variable | Category | Number of Respondents | 0 | 1 | 2 | 3 | p-Value |
| Total Vaccines Received n = 34,793 | 26,029 | 5461 | 2618 | 685 | |||
| Asthma | Yes | 6802 | 74.3 | 16.33 | 7.37 | 2 | 0.4106 |
| No | 27,939 | 74.93 | 15.53 | 7.57 | 1.96 | ||
| Age of Teen | 13 | 7027 | 41.71 | 27.14 | 23.94 | 7.22 | <0.0001 |
| 14 | 7321 | 55.92 | 32.93 | 10.01 | 1.13 | ||
| 15 | 7051 | 85.52 | 12.48 | 1.49 | 0.51 | ||
| 16 | 6914 | 96.28 | 2.43 | 0.78 | 0.51 | ||
| 17 | 6480 | 97.48 | 1.47 | 0.68 | 0.37 | ||
| Poverty Status | <=USD 75 k | 9639 | 77.39 | 15.04 | 5.97 | 1.6 | <0.0001 |
| >USD 75 k | 19,644 | 72.78 | 16.16 | 8.82 | 2.24 | ||
| Below poverty | 4465 | 77.81 | 15.05 | 5.69 | 1.46 | ||
| Education of Mother | 12 years | 5084 | 78.48 | 14.36 | 5.59 | 1.57 | <0.0001 |
| College graduate | 18,834 | 72.25 | 16.56 | 8.85 | 2.35 | ||
| <12 years | 2064 | 76.89 | 15.16 | 6.49 | 1.45 | ||
| >12 years, non-college graduate | 8811 | 77.69 | 14.75 | 6.05 | 1.51 | ||
| Education of Teen | 6th–8th grade | 9518 | 45.43 | 27.67 | 21.23 | 5.66 | <0.0001 |
| 9th–12th grade | 24,766 | 85.72 | 11.31 | 2.39 | 0.58 | ||
| HS grad/GED Completed/enrolled in GED program | 322 | 98.76 | 1.24 | 0 | 0 | ||
| Not in school/other | 144 | 80.56 | 13.89 | 3.47 | 2.08 | ||
| Marital Status of Mother | Married | 23,957 | 73.49 | 16.02 | 8.3 | 2.2 | <0.0001 |
| Never married/previously Married | 10,836 | 77.74 | 15.7 | 7.52 | 1.97 | ||
| Language | English | 32,450 | 74.41 | 15.82 | 7.73 | 2.03 | <0.0001 |
| Other | 224 | 69.64 | 18.3 | 9.82 | 2.23 | ||
| Spanish | 2119 | 81.55 | 13.45 | 4.06 | 0.94 | ||
| Race/Ethnicity of Teen | Hispanic | 6608 | 77.07 | 15.63 | 5.75 | 1.54 | <0.0001 |
| Non-Hispanic, Black only | 3258 | 78.18 | 14.36 | 6.05 | 1.41 | ||
| Non-Hispanic Other + Multiple Race | 4223 | 73.72 | 16.5 | 7.86 | 1.92 | ||
| Non-Hispanic White only | 20,704 | 73.78 | 15.76 | 8.25 | 2.2 | ||
| Sex of Teen | Female | 16,433 | 74.52 | 15.83 | 7.63 | 2.01 | 0.6762 |
| Male | 18,360 | 75.07 | 15.57 | 7.43 | 1.93 | ||
| Number of Providers | 0–1 | 16,902 | 75.66 | 15.25 | 7.25 | 1.85 | <0.0001 |
| 2 | 10,833 | 74.19 | 15.99 | 7.82 | 2 | ||
| 3/3+ | 7058 | 73.73 | 16.32 | 7.74 | 2.21 | ||
| Provider reports immunizations to registry | All providers | 20,923 | 73.91 | 16.09 | 7.84 | 2.16 | <0.0001 |
| No providers | 1587 | 77.95 | 13.3 | 6.74 | 2.02 | ||
| Some, but possibly or definitely Not all providers | 5093 | 70.12 | 18.18 | 8.99 | 2.71 | ||
| Providers order vaccines from VFC? | All providers | 19,134 | 73.95 | 15.86 | 7.94 | 2.24 | <0.0001 |
| No providers | 2686 | 78.33 | 13.03 | 6.85 | 1.79 | ||
| Some, but possibly or definitely Not all providers | 5819 | 69.91 | 18.92 | 8.68 | 2.49 | ||
| State COVID vaccine quartile | 1 | 7367 | 76.96 | 15.41 | 6.49 | 1.14 | 0.0003 |
| 2 | 7975 | 74.94 | 15.21 | 6.57 | 1.28 | ||
| 3 | 9053 | 74.55 | 16 | 7.77 | 1.68 | ||
| 4 | 9379 | 72.97 | 17.1 | 8.02 | 1.91 | ||
| Mother’s Age Category | <=34 Years | 2105 | 67.27 | 21.71 | 8.55 | 2.47 | <0.0001 |
| >=45 Years | 17,920 | 77.53 | 14.05 | 6.82 | 1.6 | ||
| 35–44 Years | 14,768 | 72.58 | 16.83 | 8.23 | 2.35 | ||
| Insurance Status | Any medicaid | 10,401 | 76.98 | 15.3 | 6.14 | 1.58 | <0.0001 |
| Other insurance | 2573 | 74.58 | 15.93 | 7.77 | 1.71 | ||
| Private insurance only | 20,700 | 73.23 | 16.12 | 8.39 | 2.26 | ||
| Uninsured | 771 | 83.66 | 10.64 | 4.67 | 1.04 | ||
| Facility of Provider | All hospital | 3995 | 74.47 | 15.97 | 7.73 | 1.83 | <0.0001 |
| All private | 13,005 | 74.08 | 15.5 | 8.04 | 2.38 | ||
| All public | 3360 | 78.69 | 14.08 | 5.65 | 1.58 | ||
| All STD/school/teen clinics/other | 991 | 79.92 | 13.32 | 5.85 | 0.91 | ||
| Mixed | 7230 | 70.09 | 15.93 | 7.79 | 2.19 | ||
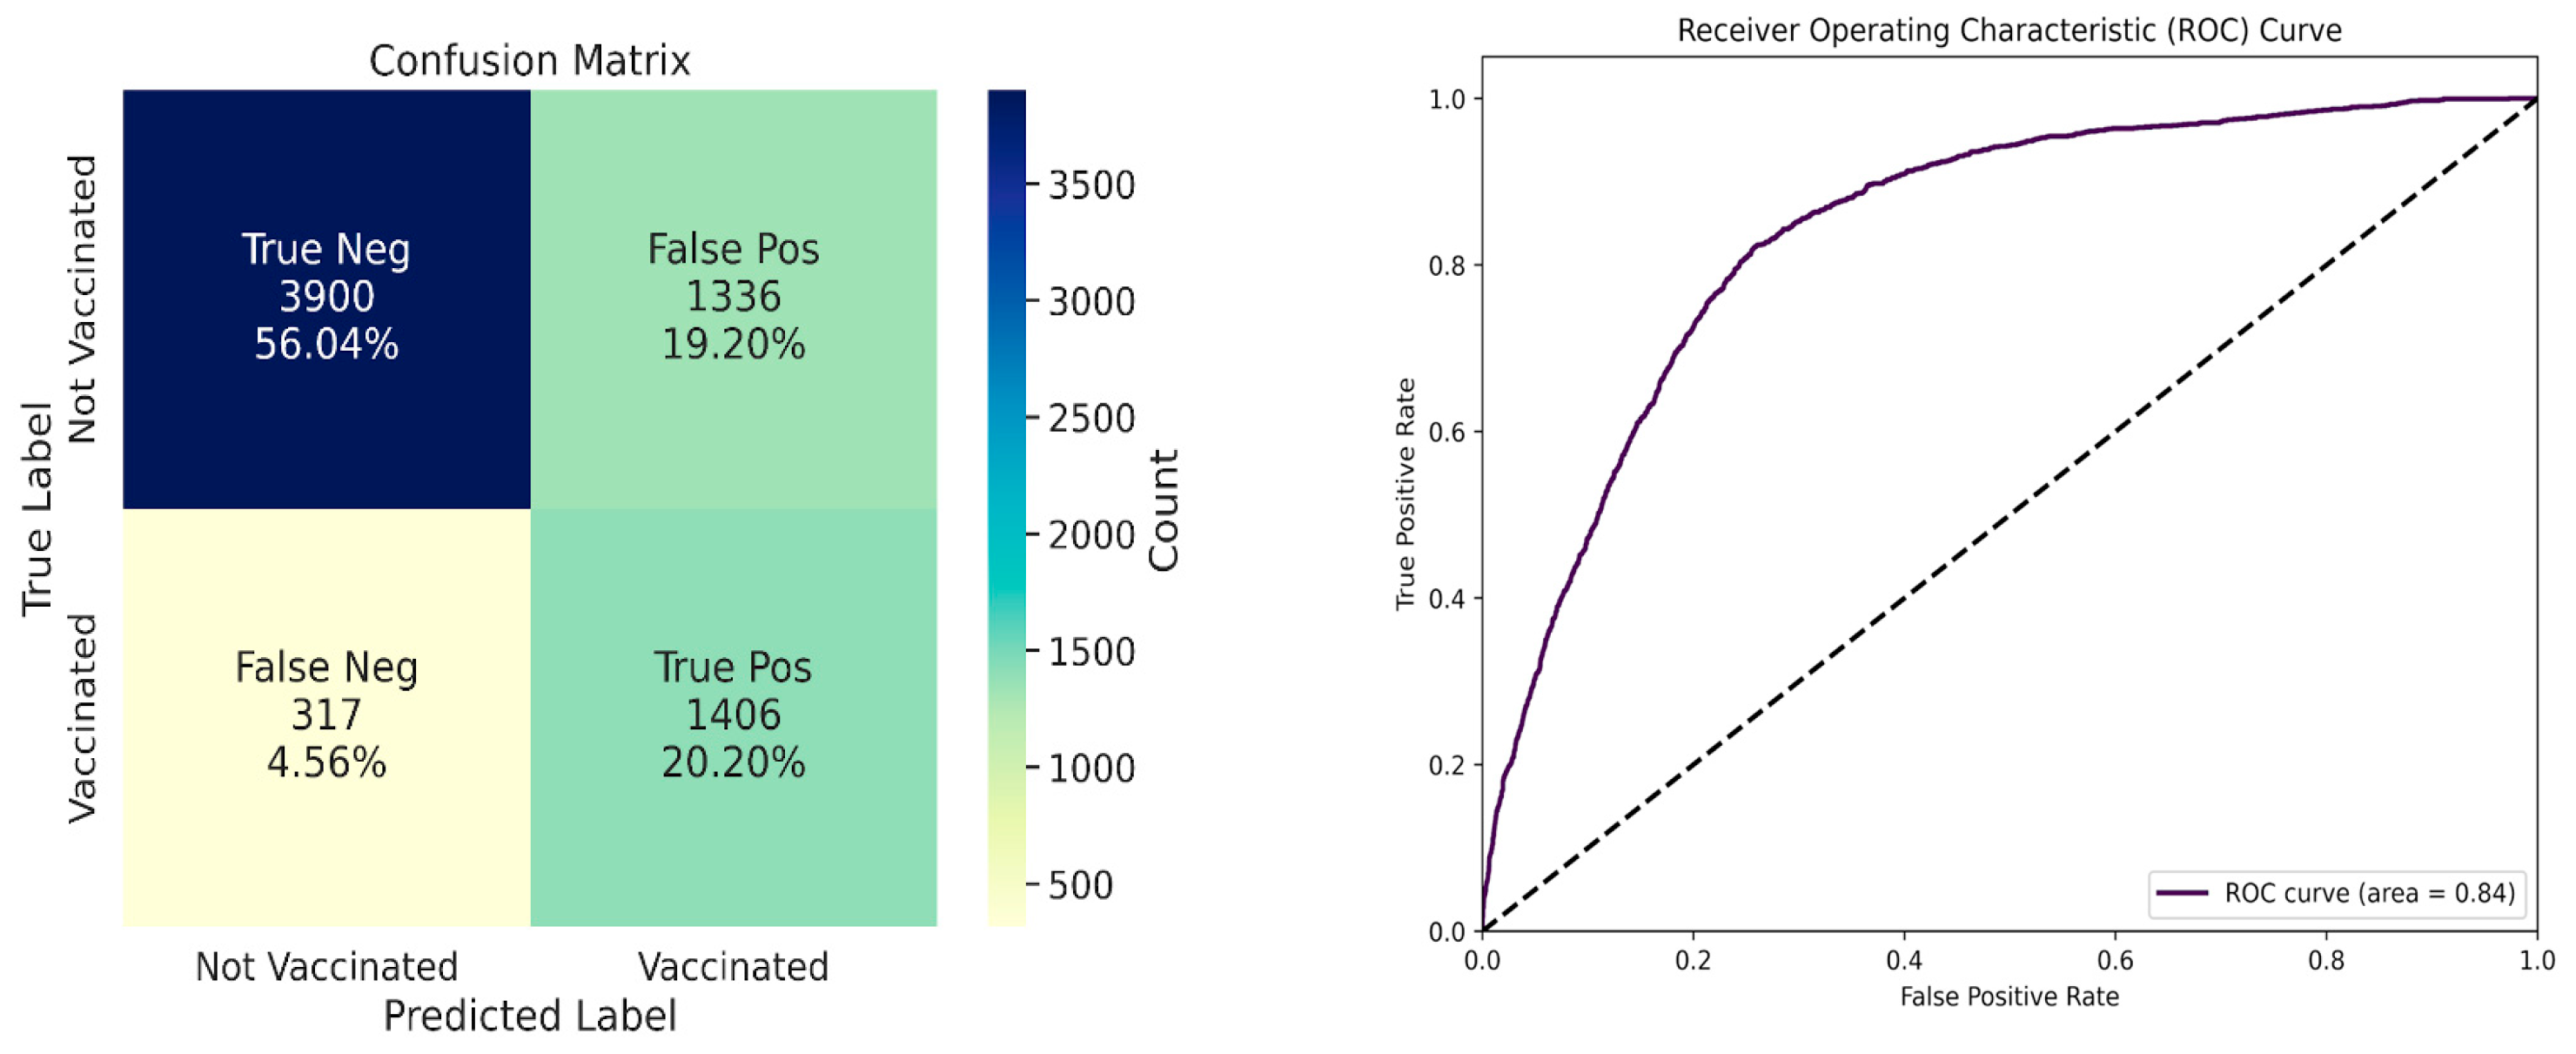
| Metrics | Value |
|---|---|
| Area Under ROC curve | 0.84 |
| Balanced Accuracy | 78.04% |
| Precision | 0.51 |
| Recall | 0.82 |
| F1 Score | 0.63 |
Disclaimer/Publisher’s Note: The statements, opinions and data contained in all publications are solely those of the individual author(s) and contributor(s) and not of MDPI and/or the editor(s). MDPI and/or the editor(s) disclaim responsibility for any injury to people or property resulting from any ideas, methods, instructions or products referred to in the content. |
© 2024 by the authors. Licensee MDPI, Basel, Switzerland. This article is an open access article distributed under the terms and conditions of the Creative Commons Attribution (CC BY) license (https://creativecommons.org/licenses/by/4.0/).
Share and Cite
Skyles, T.J.; Stevens, H.P.; Davis, S.C.; Obray, A.M.; Miner, D.S.; East, M.J.; Davis, T.; Hoelzer, H.; Piccolo, S.R.; Jensen, J.L.; et al. Comparison of Predictive Factors of Flu Vaccine Uptake Pre- and Post-COVID-19 Using the NIS-Teen Survey. Vaccines 2024, 12, 1164. https://doi.org/10.3390/vaccines12101164
Skyles TJ, Stevens HP, Davis SC, Obray AM, Miner DS, East MJ, Davis T, Hoelzer H, Piccolo SR, Jensen JL, et al. Comparison of Predictive Factors of Flu Vaccine Uptake Pre- and Post-COVID-19 Using the NIS-Teen Survey. Vaccines. 2024; 12(10):1164. https://doi.org/10.3390/vaccines12101164
Chicago/Turabian StyleSkyles, Ty J., Harlan P. Stevens, Spencer C. Davis, Acelan M. Obray, Dashiell S. Miner, Matthew J. East, Tyler Davis, Haley Hoelzer, Stephen R. Piccolo, Jamie L. Jensen, and et al. 2024. "Comparison of Predictive Factors of Flu Vaccine Uptake Pre- and Post-COVID-19 Using the NIS-Teen Survey" Vaccines 12, no. 10: 1164. https://doi.org/10.3390/vaccines12101164
APA StyleSkyles, T. J., Stevens, H. P., Davis, S. C., Obray, A. M., Miner, D. S., East, M. J., Davis, T., Hoelzer, H., Piccolo, S. R., Jensen, J. L., & Poole, B. D. (2024). Comparison of Predictive Factors of Flu Vaccine Uptake Pre- and Post-COVID-19 Using the NIS-Teen Survey. Vaccines, 12(10), 1164. https://doi.org/10.3390/vaccines12101164