Article

Designing a Characteristics Effectiveness Model for Internal Audit

1
Department of Accountancy, Faculty of Economics, Management and Accountancy, University of Malta, MSD 2080 Msida, Malta
2
Department of Insurance and Risk Management, Faculty of Economics, Management and Accountancy, University of Malta, MSD 2080 Msida, Malta
3
Faculty of Business, Management and Economics, University of Latvia, LV-1586 Riga, Latvia
4
Department of Economics, Faculty of Economics and Administrative Sciences, Ardahan University, 75000 Ardahan, Turkey
*
Author to whom correspondence should be addressed.
J. Risk Financial Manag. 2023, 16(2), 56; https://doi.org/10.3390/jrfm16020056
Submission received: 8 December 2022 / Revised: 26 December 2022 / Accepted: 10 January 2023 / Published: 17 January 2023
(This article belongs to the Special Issue Advances in Accounting, Auditing and Finance)

Abstract

:
Identifying factors/latent constructs deemed to influence internal audit effectiveness (IAE), through identifying variables used as measures of effectiveness and hypothesising which variables have a statistically significant relationship with IAE was the primary objective. Secondary objectives involved exploring the perceptions and viewpoints of internal auditing and providing general recommendations. To achieve the above objectives, questionnaires were remitted to internal auditors (IA) in various countries, receiving 402 final valid responses. Exploratory factor analysis (EFA) was carried out to identify new latent variables/constructs, with confirmatory factor analysis (CFA) in structural equation modelling (SEM) utilised to confirm these factors. The EFA process identified 7 latent factors, with 5 being confirmed through SEM. These factors, confirmed the positive influence of 8/16 hypotheses with 3/16 having partial confirmation, 4/16 not achieving any statistically significant evidence and 1/16 having negative influence. Risk Management, IA size, competency, management support, External Audit (EA) and Audit Committee (AC) cooperation, follow-up process, and control environment were all deemed to positively influence IA effectiveness. Independence, objectivity, and standard adherence achieved partial confirmation of their positive influence. Audit quality, Big Data, scope limitations and public/private organisations achieved no statistically significant results on their influence, while outsourcing was deemed to negatively influence effectiveness.

1. Introduction

Internal Audit (IA) is a dynamic function that has emerged over the years from a means of fraud detection and compliance to encompass all elements of organisational processes, aimed at obtaining a level of assurance as to the proper functioning of all entities within an organisation. With the added focus on risk management (RM), internal auditors now plan and establish internal control systems to enhance all processes, including organisational governance systems. Functional, effective IAing systems add value to institutions. In fact, Phornlaphatrachakorn’s (2020) study identified a positive relationship between internal audit effectiveness (IAE) and superior financial reporting, both of which positively contribute to organisational success. Cohen and Sayag (2010) had an interesting approach towards the definition of internal audit, describing that the aim is “to improve organisational efficiency and effectiveness through constructive criticism.” The modern definition of internal audit, appearing in most IA related literature is as follows:
“Internal auditing is an independent, objective assurance and consulting activity designed to add value and improve an organisation’s operations. It helps an organisation accomplish its objectives by bringing a systematic, disciplined approach to evaluate and improve the effectiveness of risk management, control, and governance processes.”
The rise of large corporate scandals and the disasters they left behind have induced a surge in the awareness of good corporate governance in recent years, emphasised through regulatory reforms such as the Sarbanes-Oxley Act in 2002. The internal audit function fits into this system as an integral piece of the ‘governance mosaic,’ providing assurance of internal controls, risk management and compliance (Soh and Martinov-Bennie 2011). This would tie back to the increased value-adding purpose of the function, with Arena and Azzone (2009) reiterating the previous points mentioned and further adding the benefits an IA team would provide to external auditors (EA) and the audit committee (AC).
There is a wealth of literature further detailing the relevance of the IA function. However, little exists on the characteristics, which make IA practices effective. Cohen and Sayag (2010) point out that IAE is “an important concept rarely examined in scientific literature.” Turetken et al. (2019) and Karagiorgos et al. (2011) explain that although we have a solid grasp of the importance of the IA process, there is still significant difficulty in measuring its effectiveness and assigning a metric as to the benefits it is creating, including its alignment with the organisation’s aims of sustainable, long-term success. The research emphasises the necessity for “accurate, realistic and simple indicators that would help organisations to measure the effectiveness of the IAs”.
The study is of noteworthy significance for IA teams, as the specific characteristics, which improve IA processes will be identified through a convergent, parallel mixed-methods approach, making use of the strengths of both to provide a comprehensive and all-rounded research (Creswell and Clark 2011). If the drivers of effective IA practices are identified and the unrelated factors are removed, modern IA teams may focus on the influential characteristics to improve their own unit, enhancing their service and further aligning with the entity’s goals of organisational success. The reasonable amount of previous literature provides evidence of the viability of the research; however, they all seem to be lacking in one form or another. Arena and Azzone (2009) explain that “unfortunately, there is still a lack of knowledge about the organisational dimensions a company should act on and how it should modify them in order to improve the ‘added value’ of IA.” It is for that reason that the Authors intends to use it as a foundation to build the new study on, adding onto their works and evaluating from a fresh perspective. In this case, self-completed surveys were deemed preferable to interviews, as they are easier to distribute and may provide a substantially higher response than physical/virtual interviews. Moreover, interviews provide mainly qualitative data, and the study aims for a mixed- methods approach which also gathers quantitative data, as there seems to be a lack of similar studies in the field.
There have been significant advancements regarding the IA function in the recent years, mainly the last two decades. In Malta, this was observed in Attard (2014), which research related to IA barriers, where the author performed a parallel study of Farrugia (2006). Semi-structured interviews were carried out on Maltese listed firms and it was noted that since 2006, IAing gained significant importance and the findings demonstrated that there has been an overall increase in IA effectiveness since then. These studies were however limited to just Maltese listed firms, of which only 11 were interviewed in 2014.
On the other hand, this may provide a reasonable baseline for several expectations for this study. In Kosovo, IA has its roots mainly dating back to 2000 in the public sector, where it was a centralised function aimed at auditing all public institutions in the country. Their principal target was to identify the possible misuse of public funds, ensuring they were “economically, effectively and efficiently used” (Rudhani et al. 2017).
The research undertaken involved developing various factors or metrics which would quantify IA’s effectiveness, and furthermore identifying characteristics of the IA process which would influence IAE. The aim of the Authors with this study is to determine factors that impact IA effectiveness and address specific objectives related to such. The two specific objectives are (1) to determine the factors that impact internal audit effectiveness based on the prior literature; and (2) to confirm these identified factors in the context of internal audit effectiveness.
This will be tackled by isolating the objective into more manageable goals, making it simpler to visualise and achieve. These would take the form of the following research questions:
Research Question 1: 
What are the factors/latent constructs deemed to influence internal audit effectiveness?
Following the theoretical framework proposed by Yin (2002) and Stake (1995) and scanning the literature above using the thematic approach as suggested by Braun and Clarke (2006), the following propositions as shown in Table 1 were determined and used as characteristics/latent constructs:
However, one must maintain an open mind to allow for any new variables that have not been identified through our literature review, and any newly underlying constructs which may be identified through literature or other preliminary analysis.
Research Question 2: 
What variable/s may be used as measures of effectiveness? (Dependent variable)
Research Question 3: 
Which variables/constructs have any statistically significant relationship with internal audit effectiveness?
The methodology section will elaborate on the objectives and how they are to be tackled in a structured approach.
The secondary objectives are the following:
  • To explore perceptions and viewpoints of IA professionals, departments and possibly individuals on IAE.
  • To provide general recommendations and suggestions based on the IAE findings in the research.
Figure 1 below provides an outline of the conceptual framework and structure of the statistical analysis to be carried out. As evidenced, the graphic is purposely divided into four distinct sections. First are the raw variables to be tested in the questionnaire, such as years of experience. These then form a latent construct, which is a grouping of variables forming a factor, a characteristic that exists but cannot be directly observed, only inferred through the other variables. These latent constructs are then analysed for any statistical relationship with the dependent variable, being IAE, which then has its own variables to be tested to quantify effectiveness, noted as the measures of effectiveness. The latent variables represent the hypotheses formed, comprising the effectiveness factors listed in the objectives. The variables, latent construct and measure are considered the influencing factors. The variables are the formative constructs, and the measures are the reflective constructs.

2. Literature’s Views on Effectiveness

The linguistic similarities explained obscure the discrepancies between ‘effectiveness’ and ‘efficiency’, creating a sense of ambiguity on their true separate meanings. Although the previous descriptions are acceptable, The IIA’s (2016) paper gave two straightforward definitions to dispel any confusion. The former is described as “the extent to which the set objectives are achieved,” whereas the latter as “the extent to which resources have to be deployed to achieve a certain objective” (Baldacchino et al. 2021a; Ta and Thanh 2022).
One may arrive at the conclusion now that in order to assess the extent to which these objectives are achieved, there must be an understanding of the set objectives. This is generally the ‘value-adding’ process of the function (Caruana et al. 2020; Muscat et al. 2021).
As the dependent variable, it is of paramount importance that there are characteristics or means with which effectiveness can be measured with confidence and at an acceptable level of accuracy. Cohen and Sayag (2010) provide two approaches towards analysing effectiveness. The first approach would be to identify if the IA function is in line with specific, universal IA standards. The second method would be more subjective, but considers management’s evaluations of the process, including measures such as the quality of the audit report, the timing of the audit, level of communication taking place and the amount and quality of planning and preparation (Baldacchino et al. 2021b; Mangion et al. 2021; Yeboah 2020).
Turetken et al. (2019) alleges that the limited amount of work in the realm of IA effectiveness resulted in there being few reliably tested factors. Furthermore, the primary focus of the influencing characteristics deviated the studies from outlining the actual metrics used to quantify IAE. Their research gathered a significant amount of literature and tabulated the different measures used, identifying the most common and dividing them between objective and subjective (perceived) measures. Although as explained before objective measures remove most bias, they are never straightforward indicators of IAE, unlike perceived effectiveness, which directly tackles the question at hand. IIA (2016) utilised the balanced scorecard approach, identifying further metrics through the process (Baldacchino et al. 2022; Mahdawi et al. 2018).
Arena and Azzone (2009) divided indicators into three categories: process, output, and outcome indicators. Process measurements evaluate the “quality of IA procedures, such as level of conformity with IIA standards or the ability to plan, execute, and report audit findings.” This category does, however, have a severe limitation: the presumption that IA actions are intrinsically effective. If timeliness is a process measure (see EM2 below), a faster IA function would logically imply increased effectiveness. This conclusion is only valid if the IA process is innately effective, which is why this flaw emphasises the significance of relying on all three types of metrics, which serve as pillars for determining IA effectiveness (Turetken et al. 2019; Abdullah and Mustafa 2020; Poltak et al. 2019).
Output metrics appear to address the need to “consider the evolving expectations of IA clients,” emphasising the significance of value-adding activities in the development of these indicators (Arena and Azzone 2009; Dittenhofer 2001). Finally, outcome measures evaluate the impact of IA process outputs, such as cost savings from implementing the internal auditor’s suggestions. Arena and Azzone (2009) and Turetken et al. (2019) provided the leading metrics, which may be used to measure IAE. These are summarized below in Table 2.

2.1. Objective Measures

  • EM1—Percentage of Audit Plan Achieved
Of the first set of measures, EM1 would essentially calculate the ratio of planned activities carried out by counting the number of activities that actually took place and divide it by the total activities set out in the initial plan. Soh and Martinov-Bennie (2011) referred to the Ernst & Young (2007) report which described this as a strong metric for measuring IAE, being used by 89% of organisations surveyed.
  • EM2—Timeliness of Completing Planned Activities
The former study’s findings concluded that the most commonly used measure of effectiveness relates to EM2, being the “efficiency of the IAF with regard to the annual IAF work plan, in terms of completion of planned audits and timely completion of the work plan.” (Soh and Martinov-Bennie 2011).
  • EM3—Recommendation Implementation Rate
Dittenhofer (2001) explains that IA effectiveness is truly evident when the IAor examines whether targets are achieved and confirms that no issues have arisen, or when the IAor discovers issues and recommends solutions to rectify the problems at hand. This process requires the collaboration of the whole organisation, from the IA team to management implementation. This means that in order to evaluate the outcome of these operations, there might be a significant time-lag between implementation to finally being able to evaluate its impact.
Instead, studies made use of EM3, being the ratio of audit recommendations that were actually agreed upon by management and finally implemented, against the recommendations proposed. Although this bypasses the time-lag issue regarding outcome measurement, there are several limitations present. The main concern is that it is not controlled solely by the IA team since it involves action from management on the auditee’s side, which could result in lower implementation rates even though the recommendations were all valid, and they may also create further delays in implementation (Bednarek 2018). The most common measurement technique was a Likert scale, with Erasmus and Coetzee’s (2018) study providing a scale from 1 to 5, the lowest being “never implemented the recommendation” while the highest being “always implemented all recommendations.” Bednarek (2018) assumes that the recommendation implementation rate should be at least 80%, therefore utilising a two-item scale, being a rate below 80% and one above 80%. Interestingly, Mizrahi and Ness-Weisman (2007) made use of an Analytical Hierarchy Process method which ranked the importance of the recommendations, assigning a specific weighting value to them to ensure that more critical recommendations are given their due importance and to penalise according to its cruciality if it were not implemented.
  • EM4—Time to Solve Findings
Bota-Avram and Stefanescu (2009) and Bota-Avram et al. (2010) illustrate the importance of considering the time taken to solve findings (EM4). The study provides metrics regarding the measurement, split between the findings solved in a certain time, those solved with delay and the those which remained unsolved.
  • EM5—Adherence to Policies and Plans
EM5 relates to the adherence to policies and plans. Onay (2021) and Dinh et al. (2021) both added this measure to their surveys, which was also mentioned in Ernst & Young’s (2007) report.

2.2. Perceived Measures

  • EM6—Perceived Effectiveness
The most commonly tested measure is perceived effectiveness (EM6). Alzeban and Gwilliam (2014) explain that measuring effectiveness is crucial in order to examine the influencing factors of IAE. Although this is a straightforward measure being that the question at hand is being directly tackled, this adds a significant element of bias and subjectivity to the findings. Badara and Saidin (2014) suggest enquiring if IAing increases the effectiveness of the governance and RM processes and also if the audit findings meet or are in line with the objectives set out at the planning stage. Van der Nest (2008) added three more metrics to the first two already mentioned, being the performance areas of financial reporting, internal control, and external audit.
  • EM7—Satisfaction Rate of IA Stakeholders
An important consideration in measuring IAE is evaluating the satisfaction rate of IA stakeholders (EM7), more specifically the factors which increase satisfaction/dissatisfaction. Erasmus and Coetzee (2018) make use of a 5-point likert scale measuring satisfaction, whereas Cohen and Sayag (2010) analysed the number of complaints received. For the former, the measure’s suitability has been subject to debate, with the controversiality arising since stakeholder’s interests and expectations may be varied and contradicting.
  • EM8—Perceived Added Value to the Organisation
Finally, EM8 identifies the perceived added value that the IA process provides to organisations. This measure perfectly aligns the objectives of IA as a whole, which is the value-adding service it provides to organisations. Several studies provide various survey questions that were utilised, mostly similar to those of EM6, however rather than assessing improved effectiveness, they are more focused on assessing the perceived improvements towards organisational performance and processes, adding value and general overall improvements to the organisation (Alzeban and Gwilliam 2014; Badara and Saidin 2014; D’Onza et al. 2015).

2.3. Factors Influencing Internal Audit Effectiveness

Table 3 details the factors deemed to influence IAE with the number of related studies analysed for each, which will be elaborated upon in the following sections.
  • EF1: Risk-Based Audit Approach
As the IA function has developed and innovated at an accelerated pace, there has been a shift from the conventional scope of monitoring and compliance of solely regulatory aspects towards a more risk-based approach, attempting to manage all the risks which encompass the organisation. This transition towards attempting to identify and improve upon all risks within an organisation would align with the organisations goals of improving performance, hence increasing effectiveness (Turetken et al. 2019; Arena and Azzone 2009). Erasmus and Coetzee (2018) portray the additional role IAors now handle, being the provision of consultancy services to improve processes and establish best practices through risk management techniques. Badara and Saidin (2013, 2014) found positive statistical significance with regard to this factor, with similar results obtained by Dejnaronk et al. (2016) and Arena and Azzone (2009) (however only partial confirmation). Joshi (2020) also confirmed this hypothesis and found that risk-based planning improved effectiveness. Dinh et al. (2021) and Grima et al. 2020 recommended a risk-based IA, with Onay’s (2021) study displaying similar results.
  • EF2: IA Department Size
It is rational to assume that more human capital, resources, and larger budgets would result in a more effective IA function. This was the case with Ahmad et al.’s (2012) study which explained that these are all essential in “carrying out their responsibilities successfully.” Logically, more human capital and increased overall time allocated towards the IA function would result in a more effective process. With a larger team, auditors could rotate amongst themselves, reducing the possibility of getting acquainted with the departments/auditees, which would be a hinderance to objectivity (Gul and Subramaniam 1994).
Therefore, a common testing criterion is the number of qualified employees in the team. Arena and Azzone (2009) tested this hypothesis and noted that the IA size on its own is irrelevant and does not observe any relationship with IAE. It instead requires context, by comparing it to the organisation’s total size. This means that when testing audit size, measuring the ratio of IA employees to total employees may be more appropriate. Since size is relative, a certain number of employees may seem significant within a small organisation but understaffed in a larger enterprise.
Alzeban and Gwilliam’s (2014) study found a strong positive relation, measuring IA size through the number of individuals employed within the Saudi public sector. Chang et al.’s (2019) found a negative relationship between IA size and the amount of internal control deficiencies reported, explaining that a stronger internal audit unit (IAU) would have a better internal control system, making it less likely to report compliance deficiencies. Attard (2014) explained that in the Maltese context, “The aspect of staffing adequacy, although also significantly improved, was still claimed to be the one least contributing to effectiveness in Maltese IAUs, as a number of them considered themselves as still being too small for their organisation.” An explanation for this could be that due to employee shortages in the field and the lack of large entities in Malta, it is more cost-effective to maintain a smaller in-house team and outsource the rest of the service to external providers.
  • EF3: IA Competency
Turetken et al. (2019) referred to the IIA’s (2017) exclamation that “the internal auditors must possess the knowledge, skills, and other competencies needed to perform their individual responsibilities,” while also that “the internal auditors must apply the care and skill expected of a reasonably prudent and competent internal auditor,” describing proficiency and professional care respectively. Turetken et al. (2019) also states that it is one of the most commonly occurring and utilised characteristics in all literature, as competency is logically deemed to be crucial in an effective IAU. Most studies make use of survey questions assessing number of years of experience in the specific field, CPE hours carried out, highest education levels, and similar factors. . Rudhani et al.’s (2017) study of the Kosovo public sector observed a positive relationship between competency and IAE, claiming it was rated very highly by respondents. Similar results were obtained by Dinh et al. (2021) in the steel enterprises in Vietnam, testing the staff’s capacity through IA knowledge, experience, and skills. They recommend providing CPE training to develop auditors’ expertise, allowing them to meet the needs of the modern, dynamic IA environments. Al-Twaijry et al. (2003) emphasise this factor’s vitality towards effective function, stating IAE will indeed decrease if sufficient competencies are not maintained, and that senior management will look past IA recommendations and ignore them if they do not believe they are coming from adequately competent personnel. Onay (2021) assessed competency through 5-point likert scale questions, assessing qualifications, relevant training, professional knowledge, certifications and more.
  • EF4: IA Independence
The IIA (2016) describes independence as the state where an IA department is not threatened by certain conditions, parties or other interference which may impair their ability to carry out responsibilities and tasks impartially. Briffa’s (2016) research on the Maltese scene reconfirmed the importance of independence in IA activities. The research also found that the IAor’s character is crucial in determining their independence. However, nowadays there are substantial checks and measures in place to ensure independence is always observed. The Kosovo study (Rudhani et al. 2017), Vietnam study (Dinh et al. 2021) and Turkish study (Onay 2021) all found a positive relationship between independence and IAE. Dinh et al. (2021) further explain that the AC involvement in the appointment or dismissal of the IA chief is key to maintaining and strengthening the IA independence. In fact, this aspect was incorporated in their survey questions, while they also asked whether the IAU has “direct and unlimited access,” whether they report directly to top management, have authorities to hire/fire, approve budgets/plans and if they are under the highest governance levels. Onay (2021) lists seven key questions similar to the above using a 5-point scale. Alzeban and Gwilliam (2014) explain that IA performance would not be at a satisfactory level without proper independence.
  • EF5: IA Objectivity
Dejnaronk et al. (2016) describes this notion as “an unbiased mental attitude that allows internal auditors to perform engagements in such a manner that they believe in their work product and that no quality compromises are made.” Erasmus and Coetzee (2018) argue on the high amount of subjectivity when measuring this factor, being that Likert scales are mostly used, meaning the individuals surveyed must rate their agreeableness towards the question, such as Dellai and Omri’s (2016) study. Objectivity ties strongly to EF4 independence, since it involves an unbiased mindset when performing IA activities, which means they may be merged together to form 1 latent construct. The latter study (Dellai and Omri 2016) used questions to assess whether IA staff is free from any interference when performing obligations, whether they assess work which they were previously responsible for, if they also perform non-IA functions (such as providing consultancy services), and if they have free access to all resources required.
  • EF6: Quality of Audit Work
EF6 refers to how closely procedures and activities align with specific standards or policies (Cohen and Sayag 2010). The IIA (2016) explains that there must be a quality assurance and improvement program encompassing all IA aspects. Tackie et al. (2016) refer to quality as the adherence to IA standards, however this would also overlap with EF7, being adherence to standards. Badara and Saidin’s (2014) study measures quality through term performance, while Tackie et al. (2016) sent questionnaires to stakeholders.
  • EF7: Adherence to Standards
Dejnaronk et al. (2016) measure this as the adherence to IIA standards, describing it as an influential factor. The IIA (2016) emphasise the need for internal auditors to comply with the respective standards relating to objectivity, proficiency, and professional care, while other literature mention ISO 19011:2016 standard as an audit guideline.
  • EF8: Outsourcing IA Work
An in-house audit team, which is internally employed by the organisation, outsourcing the full job to third-party professionals, or hybrid co-sourcing are the three options for the IA function. Although they have their own advantages and disadvantages, selecting the most appropriate choice is predominantly dependent on the characteristics of the entity. Generally, smaller organisations lack the financial resources to maintain a full-time audit team, and below a certain size it may not be necessary. Dellai and Omri (2016) highlight these points, explaining that in-house IAUs are more costly, especially due to the expenses incurred in hiring and training the team. However, these costs are reflected in the ability of the team to understand the business’s environment and latent risks deeply, unlike outsourced IAUs. Although outsourced IAUs might have more resources and expertise since they specialise in this field, they would not be as informed on the culture and business of the organisation. On the other hand, Dellai and Omri (2016) explain that outsourced IAUs tend to be more objective, since they are not so familiar and closely linked to the client, which is an important aspect to consider. This is emphasised in Briffa’s (2016) research, stating that external IAUs are not put under pressure from internal conflicts of interest that are apparent when one is employed by the organisation being audited. However, outsourcing brings rise to the risk of confidentiality breaches with sensitive information, as Briffa (2016) also explains that even though there are confidentiality agreements in place to prevent these situations, the risk is still present as these cases still arise. The former study made use of survey questions to understand this factor, while Soh and Martinov-Bennie (2011) interviewed stakeholders.
  • EF9: Use of Big Data and Analytics
Big Data is fast becoming an essential factor in the IA function. It is essentially split into five attributes, being the volume (large amount) of data, the velocity (speed) of data, variety of data sources, veracity (integrity) of information and value when turning the data into useful information (Joshi 2020). With the rapid modernisation of technology, auditors are capable of leveraging whole data sets at a substantial scale rather than testing samples, increasing completeness of the testing being carried out, reducing sampling risk. This would have a significant effect on the final comfort reported on the risks the organisation is faced with, by improving the sufficiency, reliability and relevance of the audit evidence obtained (Yoon et al. 2015). Kaya et al.’s (2018) research concluded that utilising Big Data Analytics increases IAE, enabling the auditor to identify anomalies by scanning thoroughly whole datasets, especially those which are well hidden in cases of fraud or collusion. Deloitte’s (2018) survey found that 66% of chief internal auditors make use of analytics for audit fieldwork, since they are able to increase their sample size to 100%. Joshi’s 2021 study found that in the Indian context, it is positively significant with IAE, further confirming the same results obtained from his 2020 study (Joshi 2020, 2021).
  • EF10: Limitation of Scope
ISO 19011:2011 (2011) describes this characteristic as the “extent and boundaries of an audit,” meaning the limitations provided to the IAU regarding the scope of their activity. Erasmus and Coetzee (2018) explain that a good level of scope limitations is no limitation whatsoever, meaning the IAU is allowed and given access to analyse and test every aspect of the organisation, wherever it sees fit. The same study made use of a 5-point Likert scale, with 1 referring to no scope limitation and 5 referring to extensive limitations.
  • EF11: IA Support from Management
No matter how independent an IAU is from the rest of the organisation, management must have belief in the abilities and recommendations of the unit in order to actually implement these changes (Alzeban and Gwilliam 2014). Without management support therefore, IA would not be able to function effectively. Al-Twaijry et al. (2003); Alzeban and Gwilliam (2014) and Onay (2021) made use of various questions to test this factor using a 5-point Likert scale, including asking whether senior management supports IA, if they are involved in the IA plan, if the IAU provides sufficient reports and documentation to management, if they believe management’s response is reasonable to these reports, if senior management communicates openly with the chief audit executive (CAE), if the IAU is large enough to carry out its duties correctly (if management provide them with enough resources) and if the IA department has a sufficient budget. Onay’s (2021) study goes above and beyond by stating that management support was deemed to be the primary factor influencing IAE, explaining that any other factor would theoretically still depend on management support.
  • EF12: Cooperation with External Audit
Various studies, including Badara and Saidin (2014) and Dal Mas and Barac (2018) mention how positive relationships between the internal and external auditors may influence IAE, through joint planning and information exchange. Alzeban and Gwilliam (2014) tested this factor, once again utilising a Likert scale to analyse whether external auditors are supportive, whether their attitude is positive towards IAors, whether they discuss plans, explain concerns, consult on the timing of their work which may overlap, meet on a regular basis, whether external auditors rely on IA work and share their working papers, and whether management coordinates the cooperation between the two teams.
  • EF13: Cooperation with Audit Committee
Arena and Azzone (2009) explain that the audit committee is made up of members from the Board of Directors and is generally established for monitoring purposes. Bednarek’s (2018) study found that effectiveness increases when the AC assists IA in “signalling significant risks and designating priorities for annual and strategic internal audit plans.”
  • EF14: IA Follow-up Process
The IA performance standard requires a formal follow-up process to be established, in order to evaluate and monitor the actions taken or not taken in relation to the findings and recommendations (IIA 2017). This is crucial in identifying if previous deficiencies have indeed been rectified or require more work to be carried out. It is also a beneficial test on management’s ability and willingness to implement the recommendations and controls to mitigate the risks identified, or if they took no action at all. Mihret and Yismaw (2007) discuss the benefits a follow-up process has towards effectiveness.
  • EF15: Control Environment
A positive environment which is open to criticism and aware of the need of certain tests and controls on governance structures within the organisation is critical in increasing effectiveness. This environment would refer to the ethical values, responsibilities, and governance structures of an organisation (COSO 2013). Turetken et al. (2019) also explains this as the “process for attracting, developing and retaining competent individuals, and the rigour around performance measures, incentives, and rewards to drive accountability and performance.” Most studies make use of COSO (2013) framework statements regarding the control environment, including ethical awareness, enterprise risk management and controls importance and management styles, including monitoring activities. Barisic and Tusek (2016) found a positive relation between a positive control environment and IAE.
  • EF16: Private vs. Public Organisations
The goals of IAing may vary between public and private sector organisations. This is because the general rule is for the latter, entities have the main goal of profit maximisation for their shareholders, whereas the former emphasises service improvement. Goodwin (2004) explains that public sector entities are governed by a “rigid framework” and extensive legislation, which are service- oriented, rather than focused on cost minimisation. She explains that there are therefore two different types of audits which may be undertaken for public sector entities, the first being financial related which would analyse the degree to which public resources are used towards achieving objectives, while the second analyses if they were used efficiently and effectively. This would imply that IA functions might be more sophisticated and have a “higher status” in public entities, while also being more common (Cohen and Sayag 2010). On the other hand, there is a counter argument that private organisations are subject to extensive pressure since they function in competitive environments and would therefore benefit substantially from the supervision and consult provided regarding internal controls. This would be an interesting characteristic to investigate, identifying if IA functions are more effective in public or private organisations.

3. Methodology

A differentiation must firstly be made between the terms ‘effective’ and ‘efficient’ as they commonly occur in many readings and may be misused. Arena and Azzone (2009) described the former as the “capacity to obtain results that are consistent with targets”, while Chambers explained it as “doing the right thing,” in comparison to the latter being “doing it well” (Chambers 1993 as cited in Turetken et al. 2019). Bednarek (2018) stated that although both are fundamental, efficiency is irrelevant if the IA process is ineffective, rendering it ‘useless’.
The first step of the research design in the preliminary stages involved developing the problem to be tackled. In the second stage, the objectives and research questions were formulated accordingly, in line with the problem in the previous step. The following step made use of the Preferred Reporting Items for Systematic Reviews and Meta-Analyses (PRISMA) method (Page et al. 2021).
This involved identifying databases and registers, scanning them for specific search strings to arrive at the best possible set of results with the most accurate articles. The following PRISMA flow diagram (Figure 2) was followed accordingly, in order to carry out the most comprehensive systematic review of all the literature possible.
After conducting pilot searches, it was clear that the most common strings of text evident among all titles were those of ‘effectiveness’ and ‘internal audit’. It was important to note that when developing the advanced search criteria within the Hydi platform, Google Scholar, Researchgate and Emerald Insight, both strings were required to be present in the title, in no specific order This decreased the likelihood of being presented with articles relating solely to internal audit or effectiveness in any other realm of research, while also providing titles not strictly written as “internal audit effectiveness,” but also ones such as “effectiveness of internal audit” marked. Hence, the following statement was used for electronic libraries:
(“effectiveness”) AND (“internal audit”).
Similar to Turetken et al. (2019), some studies made use of ‘quality’ and ‘effectiveness’ interchangeably, so the same search was carried out with the new string as follows:
(“quality”) AND (“internal audit”)
Utilising these search criteria and removing duplicates reduced the records identified significantly, from 4422 to 141 as portrayed in Figure 2. Further exclusion and inclusion criteria were then applied to these results, adapted also from Turetken et al. (2019). These were the following:
Inclusion Criteria:
(1)
Publications must be in the English language.
(2)
Research must be published after the year 2000.
(3)
Publications must relate to internal audit effectiveness and must include qualitative or quantitative metrics relating to factors influencing IA effectiveness.
Exclusion Criteria:
(1)
Publications analysing IA ‘efficiency’ rather than ‘effectiveness’.
(2)
Papers without bibliographic information, working papers and white papers.
(3)
Studies not specifically relating to internal audit effectiveness.
These measures reduced the results to 45, which were screened individually. From those publications, 7 were not retrieved as the study was not available for viewing and the publisher did not grant permission to view it or send a copy. The remaining 38 articles were reduced to the final 33 through more detailed scanning of the literature, removing 5 articles which were still deemed out of scope. Each of the final publications were then thoroughly analysed for their themes, hypotheses and the findings, specifically the causal relationship, if any, that was found between the tested factors and IAE.
The questionnaire is devised using a deductive, thematic approach as explained by Braun and Clarke (2006) and sent out to internal audit professionals, making use of structural equation modelling (SEM) to validate the framework. This would involve obtaining underlying variables for each construct to be tested, to reduce elements of error and increase reliability. However, this increases significantly in complexity when there are many different variables and factors which all have certain relationships with each other, which is why the use of SEM is so crucial in confirming the framework. A measurement framework is also required for IAE itself, as explained previously. This would involve assigning variables such as perceived audit effectiveness or recommendation implementation rates to measure IAE, in order to allow the analysis of the causal relationship between an increase in one hypothesis factor and its relationship with IAE. Various questions were subjective while others objective and without bias. For example, IA size is objective, whereas perceived competency is subjective in nature. In our methodology, we preferred co-variance SEM to variance-based SEM, since we were interested in the measure of the directional relationship between two random variables (covariance) and not the spread of a data set around its mean value (Variance-Based) (Fan et al. 2016).
In order to identify whether the factors being tested hold true to the research, hypotheses were formed as displayed in Table 4, relating directly to the factors mentioned previously.
It was decided that questionnaires would be utilised for this research in order to obtain standardised replies. The majority of questions are statements relating to the various IA factors, to which the respondent may select a reply following a 5-point Likert scale to provide their level of agreeance, ranging from “Strongly disagree” to “Strongly Agree.” This results in quantitative data ranges from 1–5, required for the specific analysis described above.
To achieve the mixed-methods approach, a qualitative element is necessary within the research. This was carried out through an open-ended field within the survey itself, allowing the respondents to provide further feedback, bring forward alternative ideas or explain their rationale. This all-encompassing mixed-methods format aims to reap both the benefits of the structured, quantitative data analysis formerly mentioned and the qualitative data gathering similar to that of an interview.
Table 5 outlines the structure of the survey developed, divided into 5 distinct areas. Section 1 provides a brief introduction on the study at hand, what the Authors’ aim to achieve, GDPR guidelines and other contact information as guidelines and standard procedure. In Section 2, the questions begin with the main demographics and general details such as gender, level of education and team size. Section 3 provides a table of statements allowing responses within 5 points as explained above. Table 3 lists each factor/hypothesis expected to be tested by that question. It is important to note that the EFA carried out on the findings may adjust or negate these factors and create its own latent constructs, having different assortments of questions linking to different factors or entirely new ones. Section 4 assesses the measures of IAE, which will be used to quantify effectiveness. The final section leaves an open-ended question for the qualitative portion, accepting any form of feedback.
EFA is used to determine whether the factor that forms the basis of the data is sufficient for a hypothesis and to determine the number of factors. EFA is often thought of as a theory-generating technique rather than testing theories (Stevens 2002). In this respect, EFA is used to test hypotheses rather than verifying the information produced (Stapleton 1997).
CFA is a theory-testing model rather than a theory-generating model (Henson and Roberts 2006; Stevens 2002). In confirmatory factor analysis, the researcher establishes a hypothesis before the analysis. This hypothesis or model states which variables are related to which dimensions and which dimensions are related to each other. Thus, the model is based on a theoretical or experimental basis (Stevens 2002). CFA is a very broad technique used in testing theories about latent variables and at a higher level (Tabachnick and Fidell 2014). CFA is used to determine whether there is a concordance between the factors determined in the exploratory factor analysis and the factors put forward theoretically. In other words, CFA tests whether there is compatibility between the variables that play a role in determining the theoretical factors and the original variables that make up the factors determined by exploratory factor analysis (Özdamar 2010; Brown 2015). In this context, CFA is used to evaluate the construct validity of the constructs obtained by EFA (Kline 2005; Stapleton 1997).
We applied the methodology used by Schmitt (2011), who applied CFA to the same data to confirm the structure obtained by first applying EFA. Although it seems reasonable to apply exploratory factor analysis first and test the model discovered with exploratory factor analysis with confirmatory factor analysis, in terms of achieving theoretical robustness, there are also discussions about how this process should be done. This controversial situation becomes especially evident in the process of developing a new test, when there is no empirical information about the dimensions of the test and what items constitute these dimensions. In such cases, although a structure is initially reached with EFA, it is an important question whether CFA can be applied when it comes to testing this structure.

4. Results

4.1. Data Gathered

A total of 402 final responses were gathered from circa 1500 requests to fill in the survey. The requests were at first administered using a non-probability purposive sampling technique directed towards the authors’ IA contacts found on LinkedIn, who were provided with an online link built on the Qualtrics XM application software. In turn, these contacts were asked to send the survey to their IA colleagues (i.e., Non-probability snowballing sampling). However, although the sampling method used was non-probability in a sense that focus was placed on IAs who were connected to the authors on LinkedIn, there was still some form of probability sampling since it was not known who the respondents were. All that was known is that they were IAs. Around 765 questionnaires were initiated, with the difference making up the responses, which remained unfinished for over a two-week period, resulting in the specific uniquely identifiable response becoming invalidated. From a geographical perspective, no limitations were placed on the location of the respondent or the jurisdiction within which they carry out their IA activities. This decision was taken in order to encompass opinions from all possible geographical backgrounds and to maximise possible responses, arriving at more accurate statistical analysis. This was possible through the sample size gathered, which may statistically cover any population size with a 95% confidence level and 5% margin of error, being that the threshold required would be 384 responses. Since as noted above we felt that there was an element of probability in our sample and we had no idea of the population, we used a sample size calculator to determine the optimal sample size. The 384 sample size figure was obtained using the formula: n = z2·[p*q]/d2), which is used to calculate the sample size of a qualitative variable in prevalence or cross-sectional studies of an unknown population size. Here, n is the sample size, P is the estimated proportion of the study variable or construct. Based on previous studies or pilot studies (50%), q = 1 − p (50%), and d is the margin of error (5%). ‘z’ is the Z-score or a standard normal deviate corresponding to 5% type 1 error (p < 0.05) it is 1.96. Therefore [1.962 × 0.50 (1 − 0.50)]/0.052 (Charan and Biswas 2013). Moreover, we were confident that we reached qualitative saturation with our sample since also following the suggested rule of thumb by Sekaran (2003), “Sample sizes larger than 30 and less than 500 are appropriate for most research” and “in multivariate research (including multiple regression analyses),the sample size should be several times (preferably between 4 and 10 times or more) as large as the number of variables in the study”.
For the exploratory factor analysis to be carried out, it is generally recommended to have 5–10 responses per question or an arbitrary amount such as 100 or 200 to arrive at successful analysis, although there are more complex methods to arrive at a specific sample size (Hair et al. 2010; Fabrigar et al. 1999). This research has gathered just over 10 responses per question (assuming 40 total questions from the statements). Although Child (2006) warned against collecting samples from many diverse populations for EFA, it should be noted that the factors being analysed are of a universal nature and any variance within the responses which are clearly influenced by location or jurisdiction is simply information which may further support the research’s endeavours.
As an explanatory example, an understaffed IA department should result in lower effectiveness regardless of the jurisdiction in which it operates. However, the finding that certain jurisdictions tend to operate with understaffed departments is certainly a fruitful secondary discovery.
The sample of valid responses came mainly from Europe (77%) with the largest portion from the United Kingdom (19%), then Malta (14%), Turkey (13), Italy (6%), Latvia (5%) and other EU countries (20%). 13% came from the United States, 3% from Asia, 3% from Australia and the rest from Africa. 66% of the respondents were male and 32% Female. Their experience varied with the largest portion having 0 to 5 years of experience (31%), 26% having 6 to 10 years of experience, 21% with 10 to 15 years of experience and the rest (22%) having 15 to 30+ years of experience. The level of education of respondents varied with the largest portion holding a master’s degree (72%), 22% holding a bachelor’s level and 6% holding a doctorate degree. Most worked in large companies with over 500 employees (65%), with the second-most common being medium-sized entities with 201–500 employees (15%) and the remaining employed with companies staffing 200 people or less.

4.2. Data Classification

As previously described, the questionnaire was split into four distinct sections, being the demographics, the statements to be tested, the measures of effectiveness and finally the qualitative comments section. For data analysis purposes and further reference, these will be classified according to the following Table 6 while maintaining the same numbering as Table 4.

4.3. Exploratory Factor Analysis

The data gathered was inputted into IBM® SPSS® version 26 to perform EFA, in order to reduce the variables tested (S1–S40) into latent factors. The Kaiser-Meyer-Olkin (KMO) test to measure sampling adequacy arrived at a value of 0.902 with a significance of 0.000 under Bartlett’s Test of Sphericity, with the former falling within the marvellous range (above 0.9), highlighting its validity for EFA to be carried out (Kaiser 1975). The latter rejects the null hypothesis that the correlation matrix is an identity matrix with the value being less than 0.05, proving that the variables are indeed related and prime candidates for EFA (Dodge 2008).
The procedure loaded 7 factors from 35 statements, omitting 5 from the 40 initial statements. The following statements in Table 7 list the excluded statements, discarded either due to explaining little variance, being explained by other variables, being loaded with little correlation onto too many factors (cross-loading), loaded onto no factors with significance or loaded onto factors with too few variables (one or two) resulting in their unreliability (Tabachnick and Fidell 2007).
Principal component analysis was the preferred method to reduce the statements into their latent components, carried out on the remaining 35 variables. From the 35 components which emerged, 7 were valid for selection meeting the criteria of having eigenvalues greater than Kaiser’s criterion of 1 and covering 60.15% of the variance. This threshold for factor retention is perhaps the most widely adopted, however often scrutinised for its oversimplification and tendency to retain more factors than are truly valid, often warranting the use of Horn’s (1965) Parallel Analysis or Cattell’s Scree plot graphical interpretation test (Fabrigar et al. 1999; Cattell and Vogelmann 1977). On the other hand, it is generally required that the factors must explain a minimum of 60% of the cumulative variance, slightly disregarding the arbitrary threshold of 1 eigenvalue (Hair et al. 2010). This is further emphasised through Hooper’s (2012) paper explaining that these stringent methods such as PA or Scree test might result in under-factoring, where the variables are reduced into too few factors, which she strongly advises against. It is deemed to be much safer to load more factors than needed, as under-factoring may result in common factors combining and “obfuscating the true factor structure,” (Hooper 2012). Therefore, although these methods may be omitted, the 60% threshold was met with factors containing eigenvalues greater than 1, as depicted in Table 8 below.
Figure 3 provides a Scree Plot depicting the eigenvalues of each factor accordingly. Although the Scree Test would aim to identify the ‘breaking point’ or ‘elbow’ as the cut-off for factor selection, it may be observed that the seven factors already chosen are suitable for loading.

4.4. Factor Rotation Results

Promax rotation with Kaiser normalisation was the preferred method alongside principal components analysis, displayed in Table 10. This form of oblique rotation allows for correlation between factors which is a more realistic solution than orthogonal rotations, however interpreting the results of an oblique rotation is often more complex and tedious. Although Hetzel (1996) states that where possible, an orthogonal solution should be utilised, Tabachnick and Fidell (2007) state that one should first request an oblique rotation and analyse the component correlation matrix for any values surpassing 0.32, which would warrant an oblique rotation to be held. This was indeed the case, where various components were observed to have correlation over the threshold mentioned, as evidenced in Table 9 below.
Thurstone (1947) proposed five criteria that make up a ‘simple structure,’ which according to Gorsuch (1983), would make the researcher indifferent to the choice of rotation as they would “lead to the same interpretations.”
Various researchers view these criteria strictly, while others such as Kline (2002) stating that the most crucial criteria are that each factor has a few variables with high loadings and the rest with zero or close to zero loadings. Kim and Mueller (1978) explained that as long as variables are placed into “theoretically meaningful subdimensions,” any popular rotation method will achieve the same results.
The constraints placed on the software were as follows:
(1)
Five variables were initially removed,
(2)
The dimensions were reduced to seven factors,
(3)
Principal Components Analysis extraction was selected,
(4)
Promax rotation was selected,
(5)
Factor loading was suppressed to >0.4, removing any loadings lower than 0.4 from the table for simpler analysis since they are not significant.
The Pattern Matrix outputted in the originally requested Promax rotation in Table 10 provides a clear indication that it undoubtedly follows a ‘simple structure,’ with all factors comprising of 3 or more variables each, no significant cross- loadings between factors and each variable having one significant loading on one factor, with zero-loading on the rest. This further confirms the choice of Promax rotation, where the correlation between components requires and oblique method while the simple structure should make us indifferent from other aspects, leaving no reason for necessitating orthogonal rotations.
Reliability tests were carried out on all factors to ensure the and consistency of the factors in relation to what was being measured. All factors surpassed the Cronbach’s Alpha threshold of >0.7 to ensure high reliability and consistency, aside from factor F7 described to have acceptable reliability most likely due to it consisting of the least variables, yet surpassing >0.5 threshold (Nunnally 1978). These were listed in Table 11 below, utilising the descriptors laid out by Taber (2018). Taber (2018) notes that, alpha values are to be described as excellent (0.93–0.94), strong (0.91–0.93), reliable (0.84–0.90), robust (0.81), fairly high (0.76–0.95), high (0.73–0.95), good (0.71–0.91), relatively high (0.70–0.77), slightly low (0.68), reasonable (0.67–0.87), adequate (0.64–0.85), moderate (0.61– 0.65), satisfactory (0.58–0.97), acceptable (0.45–0.98), sufficient (0.45–0.96), not satisfactory (0.4–0.55) and low (0.11). Tests are however, robust if any two or three items were removed from the test, the Cronbach alpha reliability would not drop below the acceptable value of 0.70. Then, a critical value of alpha of 0.70 offers evidence of the reliability/internal consistency of an instrument across different contexts, modes, and levels of representation.

4.5. New Factor Labelling

The new factors produced are available in Table 12, listing the variables in each component, the hypothesised factors covered and the new labelling for each. Interestingly, most variables were grouped similarly to what was hypothesised, with the exception that the 16 hypothesised factors were reduced to 7 (excluding the factors tested through the demographics such as IA size, insourced/co-sourced/outsourced and public/private organisations).
As anticipated, Independence and objectivity were grouped together due to the expectation of having very similar characteristics, while F4 contains the sole factor relating to Big Data and F5 for external audit cooperation, confirming the validity of their groupings as a singular latent variable. F1 covers cooperation with AC and the development of a follow-up process. F2 relates to the organisational environment providing appropriate resources with an emphasis on knowledge resources, while promoting good corporate governance and incentivising communication and positive performance. F3 groups the largest number of hypothesised components, covering mainly the support from management and external audit, with a risk-based approach. F6 relates to overall independence of the IA team and scope limitations, while the final factor F7 relates principally to the establishing of risk assessment and response measures, including adherence to ISO19011 which has recently added the risk measurements as part of the standard.

4.6. EFA Procedure on Effectiveness Measures

It was decided to perform EFA not only on the statements S1–S40, but also on the measures of effectiveness M1–M10 in order to group them into latent factors where possible and reduce any variables which explain little variance. The following matrix emerged, visible in Table 13, after placing the following constraints:
Variable M4 (“Audit findings are solved in a timely manner”) was removed due to no significant factor loadings.
Principal Components Analysis extraction was selected.
The dimensions were reduced to 2 factors, all with Eigenvalues over 1
Direct Oblimin (Oblique) rotation was selected with Kaiser normalisation
Factor loading was suppressed to >0.4, removing any loadings lower than 0.4 from the table for simpler analysis since they are not significant.
The Kaiser-Meyer-Olkin Measure of Sampling Adequacy produced a value of 0.798, surpassing the 0.7 validity threshold and interpreted as “middling” with at a significance of 0.000, accumulating a total explained variance of 1.723 from two components selected, each with eigenvalues over 1 (Kaiser 1975).
As expected, component 2 loaded up solely in questions relating to the hypothesised measure 10, confirming Perceived IA Effectiveness as a valid sole latent variable, therefore retaining the same label. The first component loaded the remaining measures into a singular factor, comprising objective measures, M8 relating to stakeholder satisfaction and M9 relating to added value. Although various statements still maintain a level of subjectivity within them, for the purposes of this study the more objective variables were labelled as “objective” in component 1. Despite M8 and M9 being listed under perceived measures, the specific survey questions were worded more closely with the objective measures in contrast with the Perceived IA Effectiveness questions, which involved substantial personal interpretation.
When performing reliability tests on both latent constructs, Component 1 achieved a Chronbach’s Alpha score of 0.759, interpreted as “relatively high” utilising the previous scales (Taber 2018). The second Component achieved an “acceptable” score of 0.557, confirming the validity of both factors.

4.7. SEM: Model Design and Development

IBM® SPSS® Amos version 21 was utilised as the SEM software of choice, allowing the model to be designed, developed, and calculated accordingly for further analysis. Due to the measures of effectiveness being divided into two latent constructs of their own, two separate models were developed to test the factors on the objective and perceived effectiveness components.
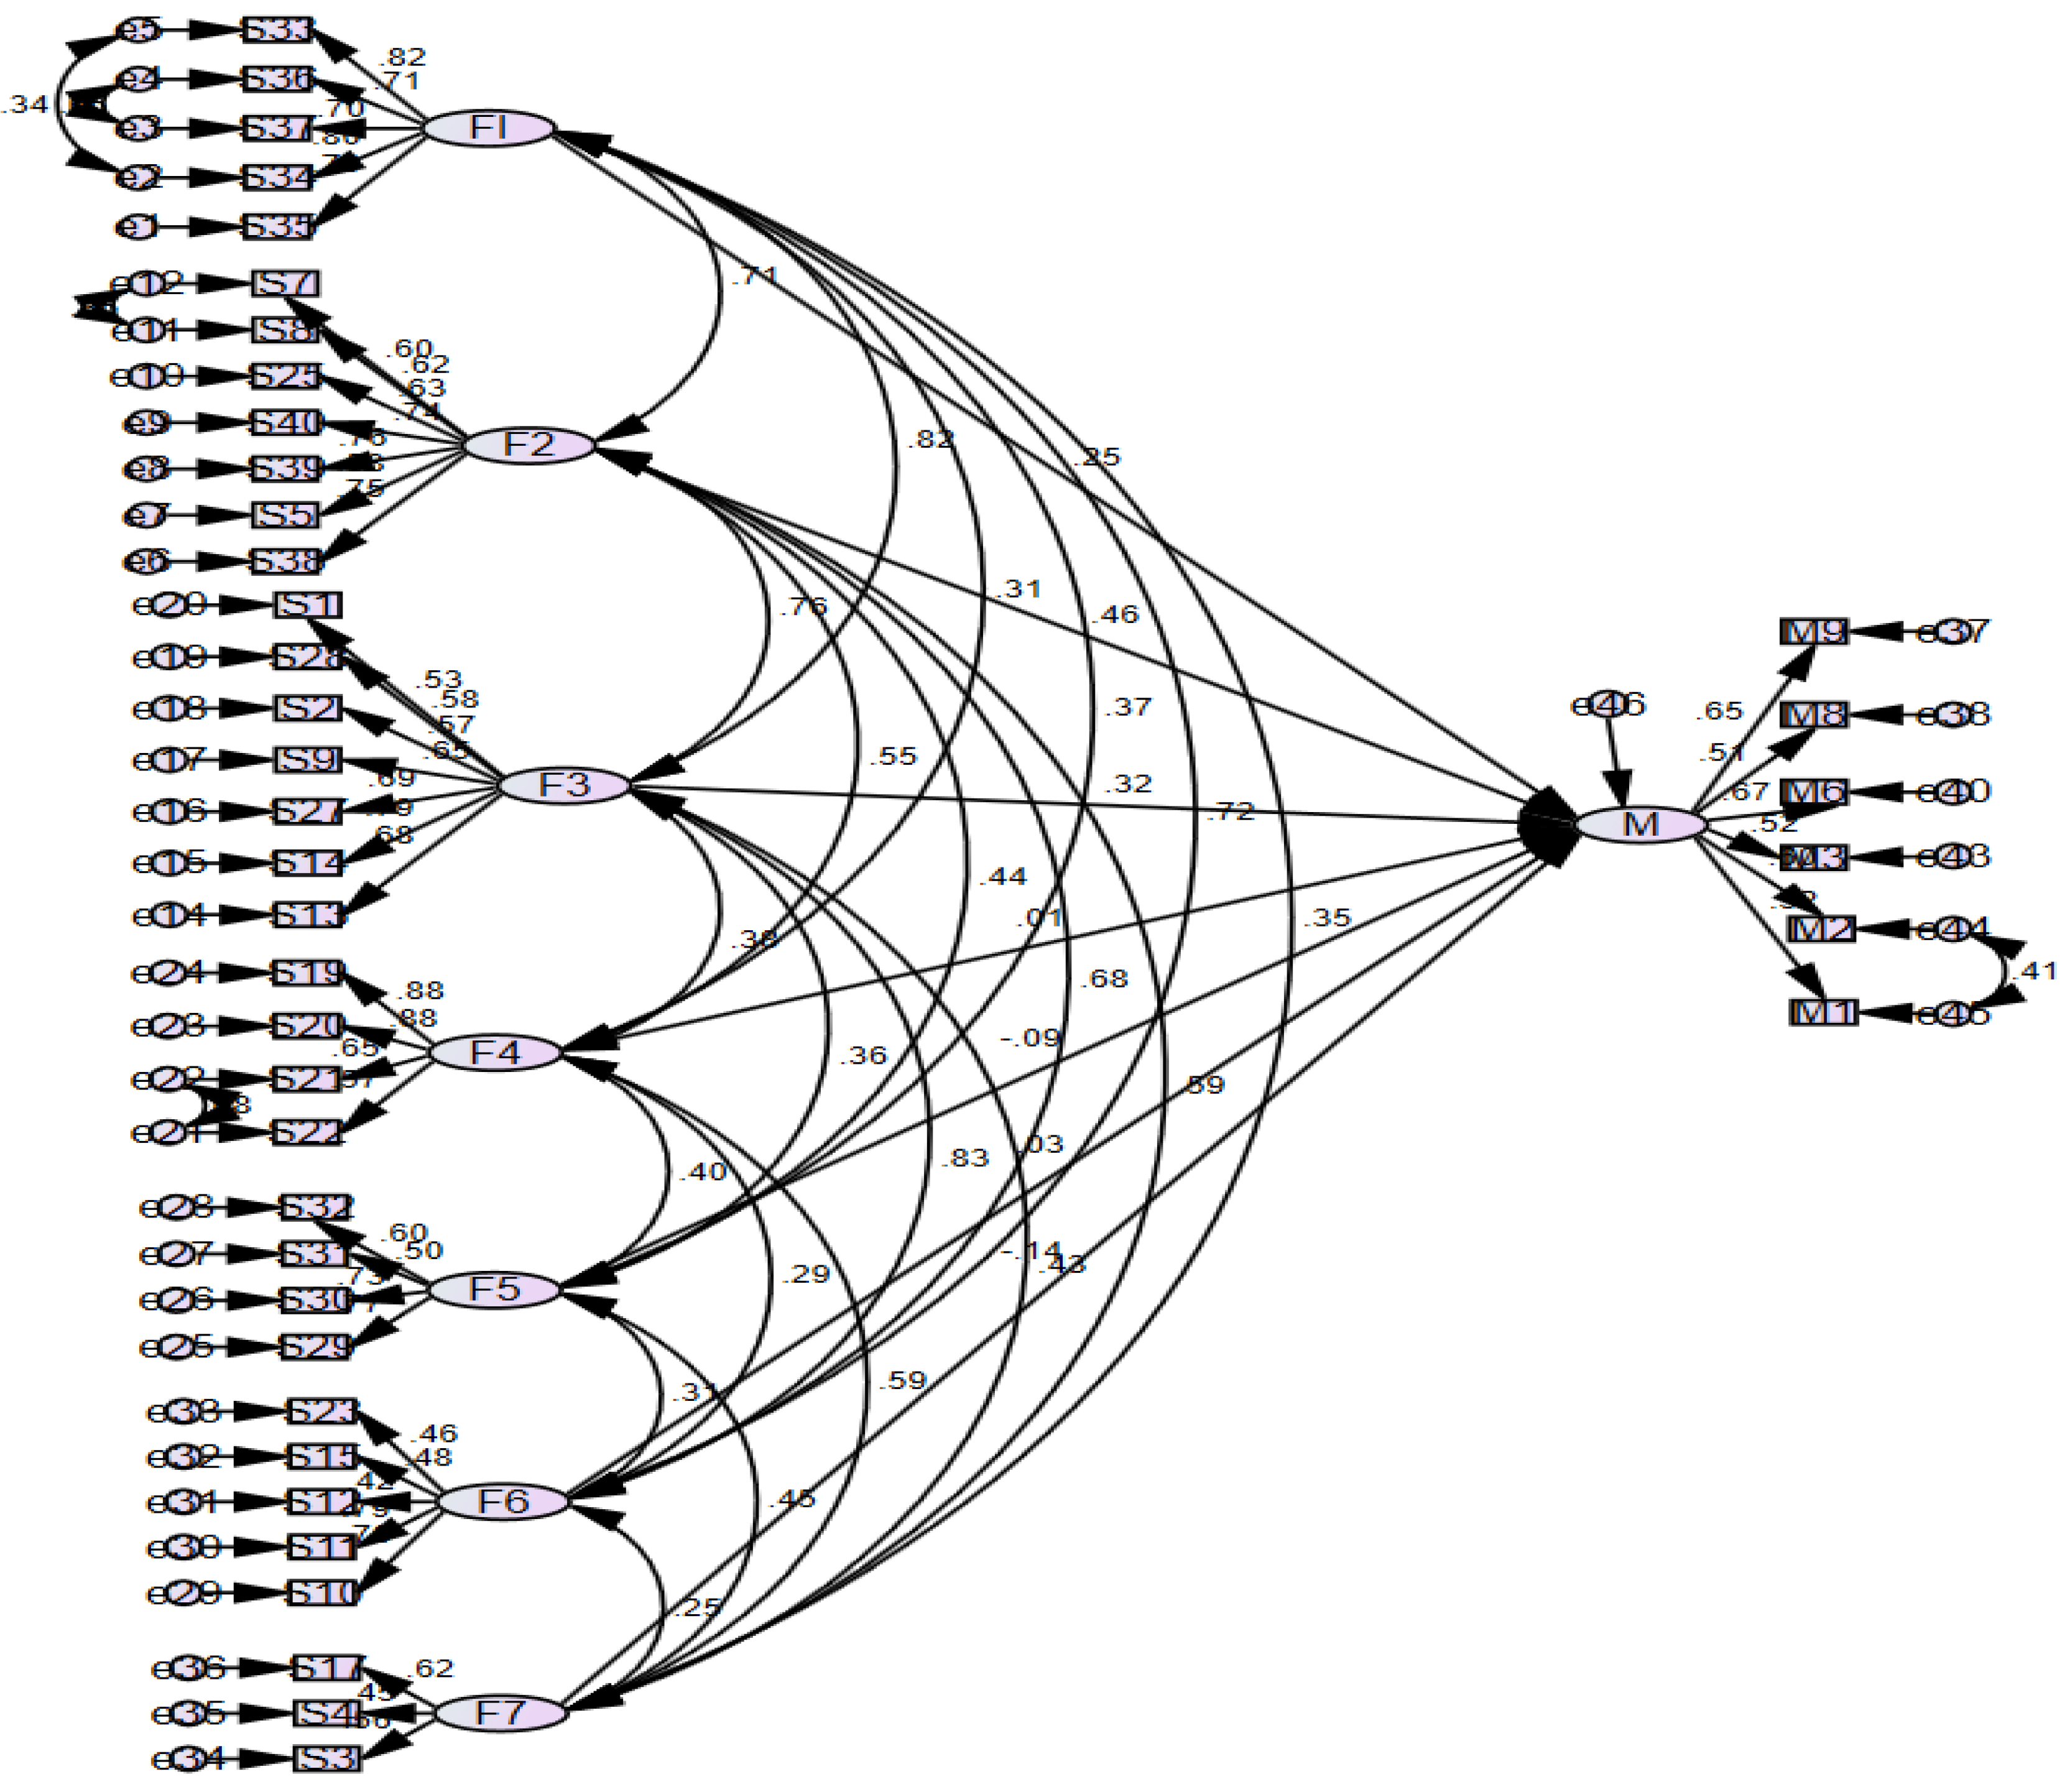
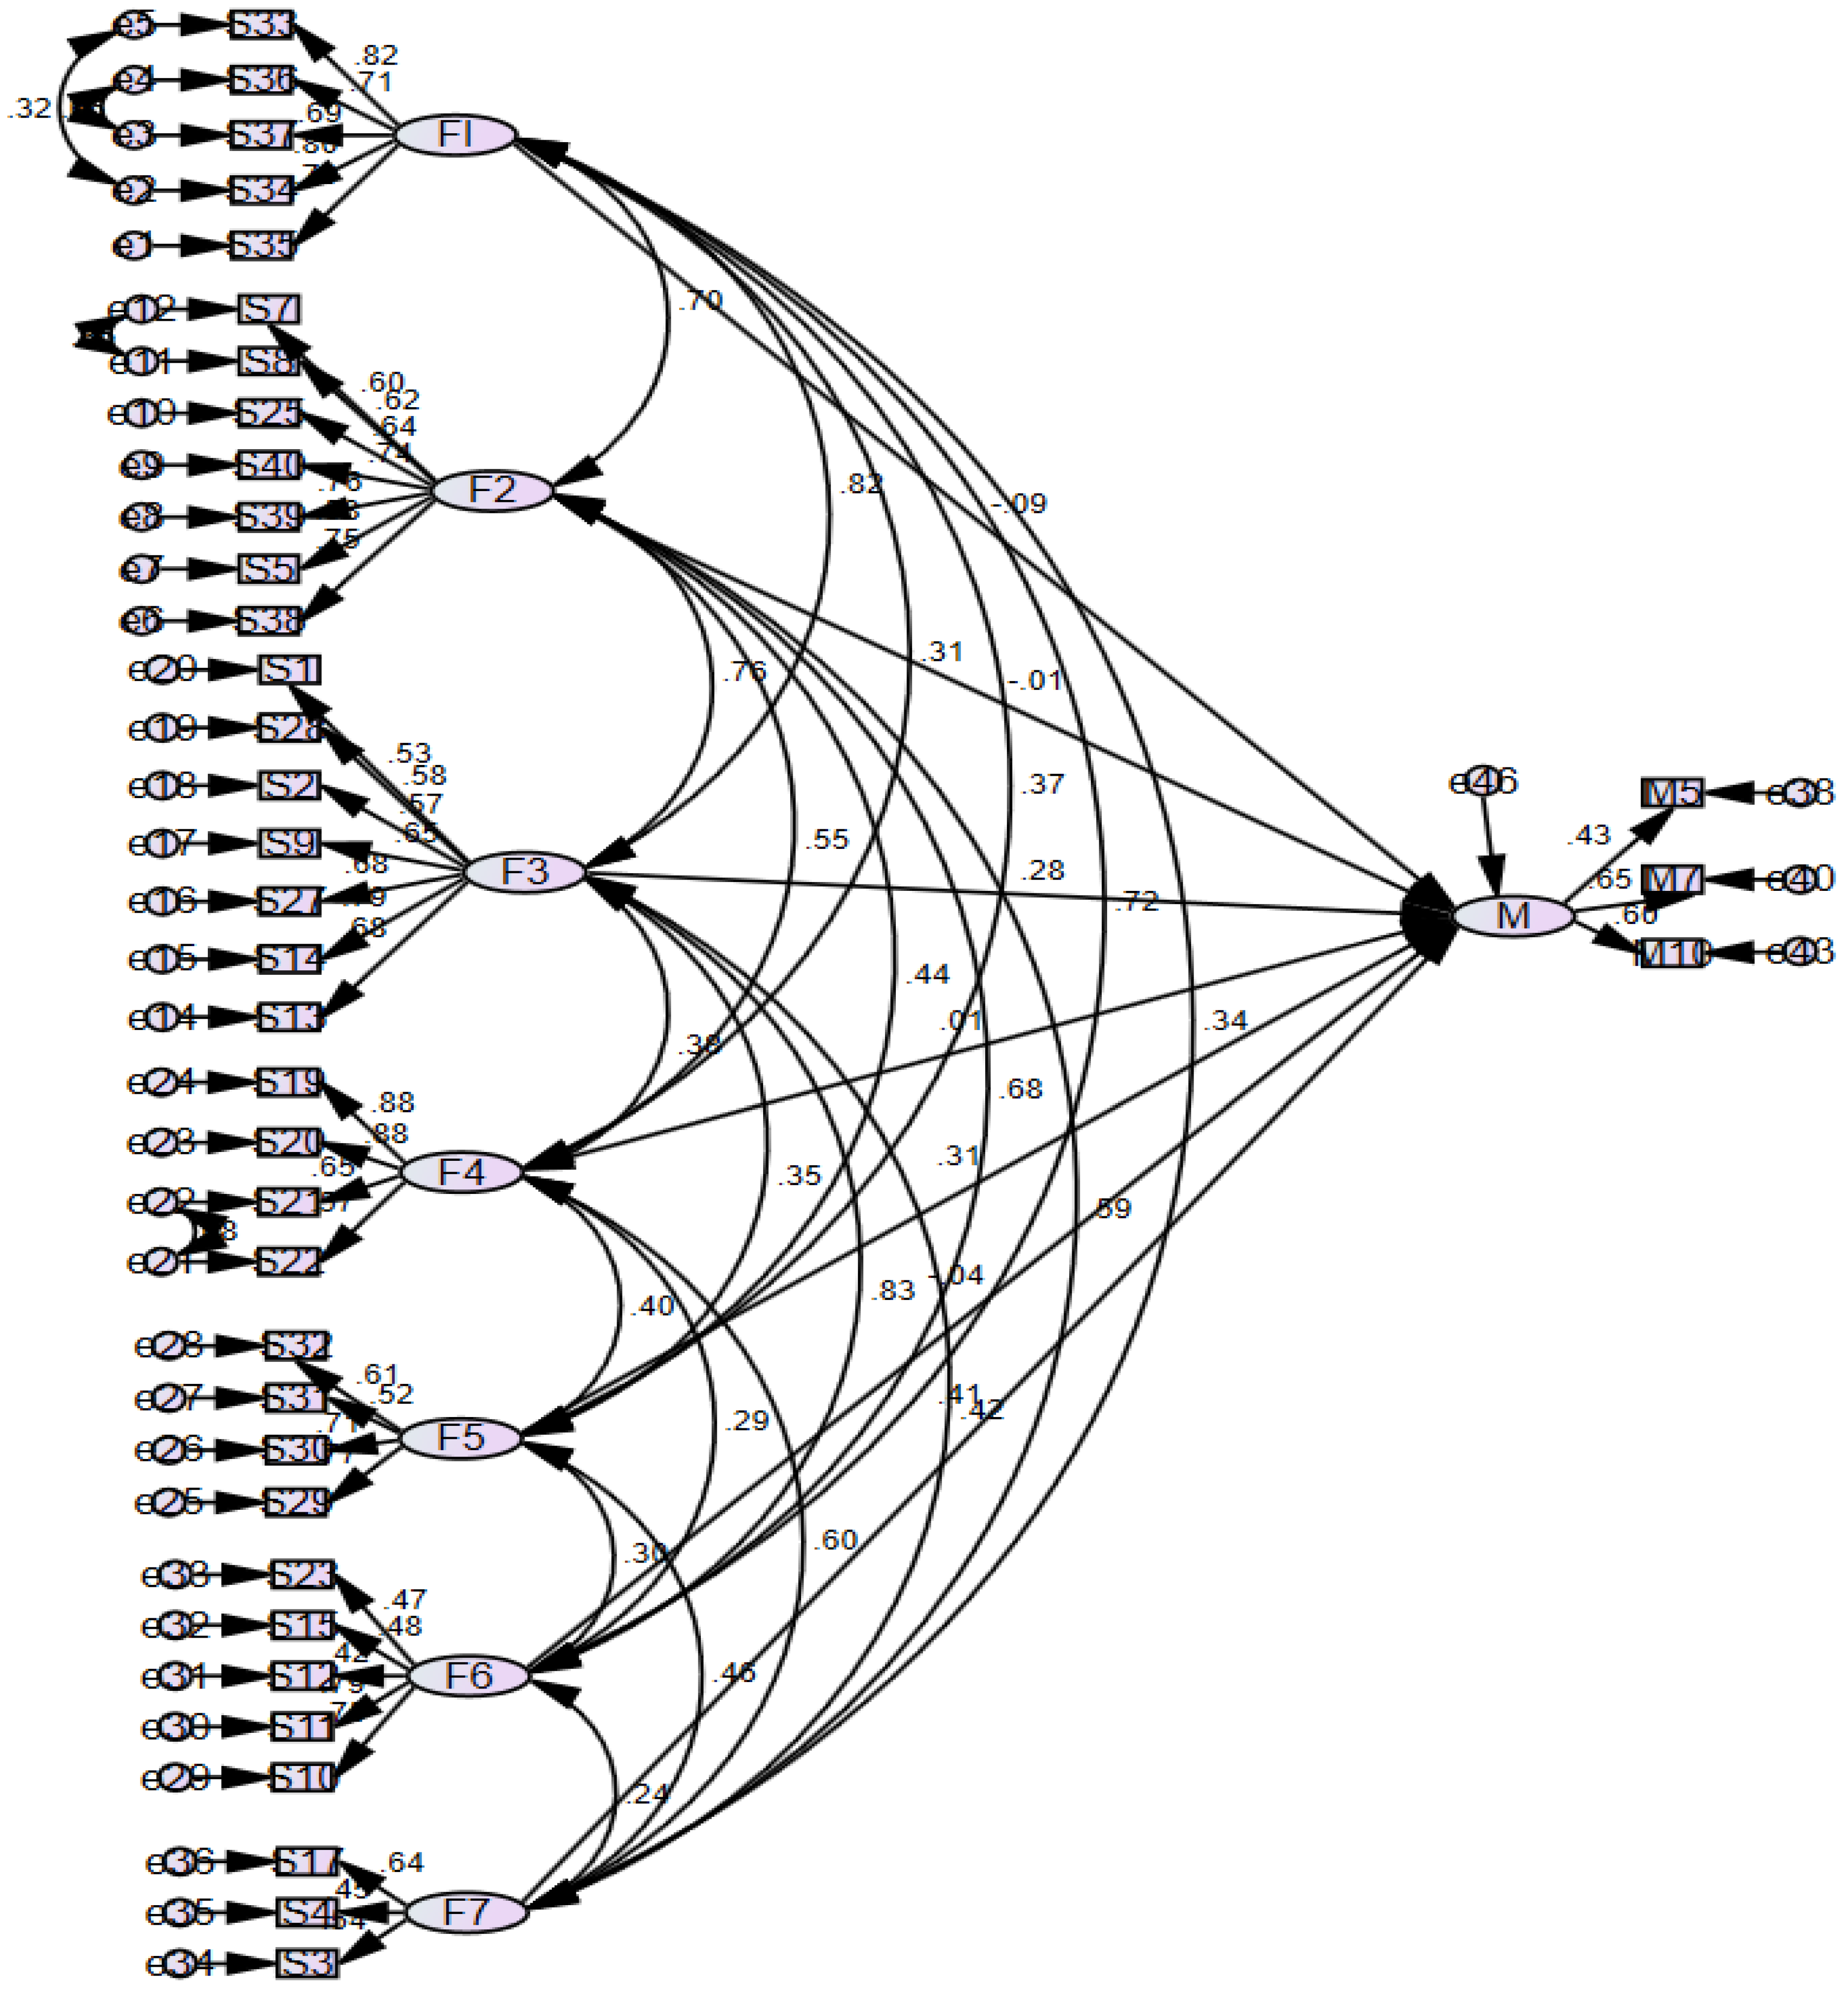
 Figure 4 and Figure 5 represent the two models, with each oval figure representing the unobserved variables or ‘factors’, the rectangular figures representing the 35 observed variables or statements and the circular figures representing the errors of measurement. All arrows represent the paths between variables, with each unobserved variable such us the factors being explained by their underlying observed variables, such as F1 being explained by S33–S37 which have their own errors of measurement terms respectively.
F1–F7 are then linked through single-headed arrow paths to M, the factor measuring effectiveness, made up of a different sets of measures for each model as explained previously. The components F1–F7 are also linked with each other with double-headed arrows representing the covariances allowed between each factor, maintaining consistency with the previous decision of utilising oblique rotation for EFA to allow for correlation between factors. Covariances were also drawn between error terms when the modification indices results deemed it ideal from the initial run-throughs of the model, ensuring the overall model fit is sufficient.

4.8. Structural Equation Model 1

Figure 4 below represents the first model developed, analysing the relationship of factors F1–F7 on ‘M’, comprising of the variables making up the “Objective IA Effectiveness and Added Value” component.
Univariate and multivariate tests were carried out in order to determine multivariate normality, using Mardia’s (1970) skewness and kurtosis coefficients (Refer to Appendix B for the assessment of normality). With 41 observed variables, the dataset was determined to provide the assumption of multivariate normality, since the value of 41*(41 + 2) = 1763 determined by the formula p*(p + 2) was greater than the calculated Mardia kurtosis value of 405.196 displayed at the bottom of the table in Appendix B.
After drawing and developing the structure, the maximum likelihood method was utilised in order to estimate the model parameters. The regression weights of the predictor variables and the regression coefficients were then checked to identify the significance of the independent variables as predictors of effectiveness. Estimates, standard errors, and critical ratios are subtracted in this calculation. The critical ratio was found by dividing the parameter estimate by the standard error, where a value greater than ±1.96 at 0.05 significance level are statistically significant (Khine 2013).
The most widely used and reliable Chi-square analysis returned a value of 1585.584 with 746 degrees of freedom (p = 0.000). The Chi-square/d.o.f value returned 2.125, further proving the compatibility and fit of the model. The RMSEA calculation returned a value of 0.053, remaining within the required 0–0.8 range while the SRMR value was 0.06, remaining within the 0–0.10 range.
Table 14 describes the estimates outputted by Amos® displaying the regression weights and other figures for each structural relationship:
The factors deemed to correlated with M significantly are highlighted in the table, being F1, F2 and F3. The “***” symbol in the p column indicates a significance value less than 0.001 as evidenced for F2, while F1 and F3 have p values lower than 0.05. The R2 value for the model was calculated as 0.77, meaning that 77% of the variance in M is explained by these factors. The remaining structural relationships are visible in the Appendix B.

4.9. Structural Equation Model 2

Figure 5 below represents the second model developed, analysing the relationship of factors F1–F7 on ‘M’, comprising of the variables making up the “Perceived IA Effectiveness” component.
The previous tests were repeated for the new variables respectively (Table 15), beginning with Mardia’s (1970) skewness and kurtosis coefficients. With 38 observed variables, the value of 38*(38 + 2) = 1520 was once again larger than the Mardia kurtosis value of 345.142.
The Chi-square analysis returned a value of 1429.091 with 633 degrees of freedom (p = 0.000), surpassing the minimum. The Chi-square/d.o.f value returned 2.258, further confirming the compatibility and fit of the model. The RMSEA calculation returned a value of 0.056, remaining within the required 0–0.8 range while the SRMR value was 0.0631, remaining within the 0–0.10 range.
Table 15 describes the estimates outputted by Amos®, displaying the regression weights and other figures for each structural relationship.
The factors deemed to correlated with M significantly are bold in the table, being F5 and F7. The “***” symbol in the p column indicates a significance value less than 0.001 as evidenced for F5, while F7 has a p value lower than 0.05. The R2 value for the model was calculated as 0.88, meaning that 88% of the variance in M is explained by these factors. The remaining structural relationships and variable descriptions are visible in the Appendix B.

4.10. Confirmed Factors

From the previous confirmatory factor analysis (CFA) procedure carried out as part of the structural equation modelling, 5 factors have emerged as significantly correlated, with F1–F3 identified from model 1 while F5 and F7 were identified from model 2. This would imply that for factors F4 and F6, inadequate statistical evidence towards their reliability as latent variables were obtained, resulting in them no longer being considered during the following stages of analysis. This is done as prudential effort to make use of solely factors confirmed through the CFA process in order to ensure statistical reliability and integrity of the constructs being formed and their relationships with effectiveness. Therefore, F4 relating to the use of Big Data and F6 relating to Independence and Scope will be disregarded and all further analyses will be carried out on the remaining 5 factors.

4.11. Linear Regression and Pearson Correlation Test

Although EFA was carried out on all the survey statements, the demographics variables D1–D7 were not within the scope of grouping into latent factors and hence not included within the respective measurements. However, it is essential to perform regression analysis to identify the causal relationships, if any, between these variables and effectiveness.
Three new variables were computed prior to carrying out the necessary calculations, visible in Table 16. These were ‘IA_Ratio’, being the demographics variable measuring the number of IAs in a team divided by the total number of employees in the team. This was carried out in order to analyse not only the relationship of IA team size or total organisation size with effectiveness, but the IA size in relation to the firm’s total capacity, as explained and hypothesised. The second variable calculated was labelled as ‘Confirmed Factors’, being the average of the five confirmed factors while the last variable is Measures, taking the average of the two factors comprising the measures of effectiveness.
The regression analysis carried out for the demographics against the dependent variable ‘Measures’ outputted the following coefficient results in Table 17, with 0.052 significance value in the ANOVA table, achieving reliability at the 90% confidence level.
As may be observed, no clear causal relationship is apparent between any variable and the dependent aside from the demographic relating to insourcing and outsourcing of the IA process, with a −9.4% standardised beta highlighting that insourcing a team will perform more effectively at a 0.1 level of significance. The process was then repeated with ‘Confirmed_Factors’ replacing ‘Measures’ as the dependent variable. This was done since the latter represents effectiveness, while the former is statistically proven to influence effectiveness. Therefore, any variable sustaining a causal relationship with ‘Confirmed_Factors’ should in turn also influence ‘Measures’ and ultimately impact effectiveness. This yielded similar results, with the exception being that ‘No. of IAors’ obtained a standardised beta value of 10.6% at 0.056 significance, indicating an increase in internal auditors is deemed to influence effectiveness. The regression test for ‘IA_Ratio’ was carried out separately due to it not being a categorical variable, wielding no statistically conclusive results.
Pearson Correlation was then carried out on all the demographics variables, ‘IA_Ratio’, ‘Confirmed_Factors’ and ‘Measures’. Table 18 lists the correlations of all the variables against ‘Confirmed_Factors’ and ‘Measures’.
As evidenced by the first three rows of results, no statistically significant outcomes were present to prove that gender, education, or experience correlate with effectiveness. On the other hand, 9.9% correlation was found between number of IAors and ‘Confirmed_Factors’, while 12.7% correlation was observed between number of employees and ‘Measures’, highlighting that larger IA teams and larger organisations tend to have more effective IA procedures, further proving the IA size hypothesis. The negative correlation observed for the type of IA team further corroborates with the previous findings that insourced teams tend to perform more effectively than their co-sourced or outsourced counterparts, while no evidence was found regarding public/private entities. The ‘IA_Ratio’ calculation yielded no significant results, while as expected ‘Confirmed_Factors’ were strongly associated with ‘Measures’ at 0.000 significance level with 64.2% Pearson correlation, seeing that these are made up of the five factors already confirmed through other statistical methods to influence effectiveness.

4.12. Confirmed Hypotheses

Table 19 depicts the original hypotheses laid out in the literature review chapter, alongside the study’s findings relating to each. All rows marked with a green tick ‘✓’ represent hypotheses where significant statistical evidence was found to confirm and substantiate the factor’s positive influence on internal audit effectiveness, while the red tick ‘✓’ represents the negative influence for H8, concluding from the previous findings that insourced entities are more effective. Yellow ticks ‘✓’ represent partially confirmed positive influence, describing factors where evidence was obtained but of limited nature. H5 for example comprised 2 statements from the original questionnaire, where one was grouped with confirmed factor F3, while the other with F6 which was disregarded due to not achieving statistical significance. Similar results occurred with H4 relating to independence, resulting in their partial confirmation. The remaining hypotheses found no evidence of their influence towards effectiveness either due to the specific statements being removed in the EFA phase, or due to them forming factors F4 or F6 which were ruled out or due to any statistical evidence of their influence being not significant enough to conclude with reasonable reliability.

5. Discussion of Findings

Similar to the literature, hypothesis H1 (Risk-Based Audit Approach), maintained a positive influence on effectiveness. For H1 relating to risk-based audit approaches, these loaded onto factors F3 and F7, both being factors confirmed to influence effectiveness through the SEM process. As opposed to the initial literature, these interestingly did not group into one latent variable but were separated into statements relating to the incorporation of risk management and risk assessments within the IA process in F3, while S3 and S4 focus more on Risk based frameworks and policies to be adhered with, including risk response. This confirms the recent shift of the IA process to one which now incorporates a risk-based approach as discussed by Arena and Azzone (2009), Erasmus and Coetzee (2018) and Dinh et al. (2021) among others, with the added concept that RM should not only be implemented and risk assessments carried out, but popular RM frameworks should be adhered to accordingly to provide a stronger process overall.
The evidence relating to H2 (IA Size) also concurs with the literature discussed that more internal auditors do increase effectiveness accordingly. This was discernible when carrying out the regression analysis between the number of IAors and the confirmed factors, where it was concluded that an increase in the audit team size does create an increase in the confirmed factors, which invariably indirectly impacts on effectiveness. This result was expected, as a logical conclusion would be that more human resources would allow for more IA activities and higher quality work to be carried out, impacting IAE accordingly as outlined by Alzeban and Gwilliam (2014) and Ahmad et al. (2012). Although it is also logical to assume Arena and Azzone’s (2009) argument to be true, stating that the number of ‘IA- Ratio’ should take into consideration the total number of employees, the ‘IA_Ratio’ variable was unable to statistically agree with this statement, arriving at no conclusion. However, larger IAUs and firms in general tend to have more effective IA processes, as observed in the Pearson correlation carried out (Refer to Table 15). It is interesting to note however that roughly 20% of organisations with over 500 employees still employ 3 internal auditors or less, highlighting Attard’s (2014) statement that Maltese organisations are still understaffed when it comes to IA and this finding indicates that this is also a worldwide phenomenon.
H3 (IA Competence) yielded interesting results, hypothesising competency as another plausibly crucial factor influencing effectiveness. Although the study confirmed this factor as positively impacting effectiveness by loading up the specific statements onto F2, the demographic variables relating to the respondent’s own level of education and experience yielded no statistically significant results. This means that there may have been a level of bias when it came to responding to this area, as it is surely reasonable to assume that more competent individuals will result in more effective IA processes as outlined by Turetken et al. (2019); Rudhani et al. (2017) and the IIA (2017) itself.
Although it would be nonsensical to assume that competency plays no role in increasing effectiveness, perhaps the outcome of this study was not purely a chance occurrence, but in fact yielded results suggesting that IAUs should not over-rely on measuring competency solely through years of experience or level of education, emphasising quality of experience and competency over quantity.
In fact, there has also been a shift away from traditional education institutions, such as the common pathway of obtaining a CPA qualification through Universities or the ACCA equivalent prior to entering the IA environment. Although an accounting qualification would undoubtably assist an internal auditor in their work, it is controversial as to whether a 5-year route including an undergraduate and postgraduate degree in accountancy is necessary, especially since it disincentivises many students from venturing into internal audit owing to the lengthy requirements of formal education. In fact, whereas this model is as explained above resulting in most respondents having a master’s degree, the USA and UK have an almost even distribution between those with bachelor’s and master’s degrees. This further points to a decreased need to run postgraduate programs for qualifying in IA. This would instead be compensated with more highly focused training relating specifically to IA and to its related tasks such as data security, audit system training and technology rather than having a broad scope learning through tertiary education.
Although most variables were loaded onto F6, which was not statistically confirmed through SEM, two statements relating specifically to the independence from management loaded onto F3, warranting solely partial confirmation of H4 (IA Independence) with the results obtained by Briffa (2016), Onay (2021), Dinh et al. (2021) and Alzeban and Gwilliam (2014). Upon reflection, the loading onto separate factors indicates that independence is a multi-faceted concept which needs to be regarded from both angles, that as having no limitations or access restrictions which may impair judgements, while also being independent from management by reporting operationally to the audit committee and being able to report on both the lowest and highest levels of management within the organisation. That being said, S10–S12, which loaded onto unconfirmed F6 correlated with effectiveness (‘Measures’) at the 0.000 significance level, highlighting the possible positive influence of such statements.
Similar to Independence, H5 (IA Objectivity) statements split between F6 and F3, warrant partial confirmation. It is clear, as anticipated in the literature review that significant overlap would be present between objectivity and independence, since the statements gathered from the survey may also be used to describe independence, with the confirmed statement discussing the importance of an unbiased mental attitude when carrying out activities, similar to Dejnaronk et al. (2016) study. Although S15 was loaded onto F6, 23.9% correlation was observed with effectiveness at the 0.000 significance level, highlighting that, although partially confirmed, objectivity should still be taken into consideration. F7 (IA Independence and Scope) had the majority of statements relating to independence being loaded alongside a statement for objectivity and scope. The findings substantiate the idea that independence should be viewed from two different aspects, being independence from management (as explained in F3) and independence arising from unimpaired influence and unrestricted access placed on the IAU at all levels of the organisation, allowing them to carry out their duties effectively. This may suggest that unrestricted and unlimited access is not entirely necessary and that although generally not recommended, it is not imperative for IAs never to carry out any form of managerial functions. The singular statement relating to scope was also loaded onto this factor, possibly implying that it may be unreasonable to apply absolutely no boundaries or limits to an IA.
No statistical evidence was found regarding H6 (audit quality), as the sole statement testing this factor was removed entirely from the analysis during the EFA process, thus resulting in no impact on effectiveness being observed. The question relating to the creation and upkeep of a quality assurance and improvement program garnered a mean response of around 4, thus indicating overall respondent agreement, and 34% correlation with effectiveness, thus highlighting possible positive influence. The broad definition of quality creates a level of ambiguity which brought considerable overlap with other factors, as it is generally considered that higher quality audits are more effective, with the reverse also holding true. As discussed above ‘quality’ and ‘effectiveness’ are sometimes even interchanged, resulting in a lack of clarity when it comes to investigating this factor alone because all other factors would be deemed to affect quality too. For these reasons, no statistical confirmation was possible against the claims of Cohen and Sayag (2010) or Badara and Saidin’s (2014) among others, signifying that rather than hypothesising “IA Quality” it may be more suitable to assess IA quality assurance programs instead.
The partial confirmation of H7 (Adherence to Standards), in line with Dejnaronk et al. (2016), was attributable to the fact that from the two statements relating to this factor, S18 was removed in the EFA process. S18 had a mean value of 4.58, indicating strong compliance with standards, and 49% correlation with ‘Measures’. S17 related solely to ISO19011 audit standard, which was loaded onto the confirmed F7. Although it is reasonable to assume that standard adherence positively influences effectiveness (with the added indicators that S18 correlates with effectiveness), it was deemed prudent to conclude with partial confirmation, as only one statement for the original hypothesis was fully tested.
The literature put forward by Dellai and Omri (2016) and Briffa (2016) posed a mixed viewpoint regarding H8 (Insourcing/Co-sourcing/Outsourcing), highlighting the benefits and drawbacks of both insourcing and outsourcing and ultimately ending with inconclusive results. The results of this study concluded a negative impact of outsourcing, with the evidence indicating insourced entities prove to be more effective. This is likely in line with the previous authors’ explanations that insourced teams are solely focused on the single entity, gaining a deeper understanding of its risks, environment, and circumstantial affairs. However, this hypothesis is not entirely straightforward, as there are surely legitimate reasons to outsource the process, including for small organisations, which cannot afford the resources required to hire and train an IA team, or perhaps specifically skilled IA professionals are necessary who form part of an external team. Therefore, although insourcing the IA process was deemed to increase effectiveness, specific circumstances may require co-sourcing or outsourcing respectively.
No statistical confirmation was obtained for H9 (Use of Big Data), as although all questions loaded as expected onto a singular factor, it was not deemed statistically significant in either of the two SEM processes. Therefore, the claims portrayed by Joshi (2020, 2021), Yoon et al. (2015) Kaya et al. (2018) and Deloitte (2018) could not be corroborated as no statistical conclusions were arrived at. It is interesting to note however that there was 32.4% correlation between factor F4 relating exclusively to this hypothesis and effectiveness (‘Measures’), possibly indicating positive influence of Big Data Analytics. F4 (Use of Big Data) also loaded one hypothesis entirely onto the newly created factor, therefore relating solely to the use of Big Data and analytical techniques. Although the use of whole datasets for analysis rather than samples should in theory reduce any possibility of sampling risk and the extra efforts required to obtain a correct sample, the findings do not validate these claims with significance, possibly indicating that the IA process is still a while away from making these procedures common practise or perhaps there is not yet the knowledge and understanding of the benefits of analytical techniques. This may also be an indication that in practice, the use of Big Data is not yet viable or feasible, either due to the computing power required, or the datasets still being too large to process entirely. This method may also not yet be widely accepted by IAs possibly due to more mature auditors being reluctant to change and sceptical on the practicability and skills required to carry out the procedure effectively, who would rather work with tried and tested mechanisms.
No statistical evidence was obtained for H10 (Limitation if scope) due to the singular statement loading onto factor F6 which was not confirmed in the SEM process. Although the findings from Erasmus and Coetzee (2018) and the ISO 19011:2011 (2011) standard plausibly argue that no scope limitations should be placed, this study could not conclude similar results. However, 21.2% correlation at 0.000 significance with effectiveness was observed, once again possibly highlighting the validity of the literature.
A positive influence was concluded for H11 (Management Support) after 2/4 statements relating to support from management were loaded onto separate confirmed factors F2 and F3. The other two statements were ruled out in the EFA process despite both correlating at the 0.00 level of significance with effectiveness, with 46.1% and 30.6% for S24 and S26 respectively. Interestingly, S25 loaded onto F2 alongside competency and control environment. This may be explained since the question was not directly related to management support, but rather that IA has the resources required (assumably from management, resulting in their support) to fulfil its tasks. This resulted in F2 comprising of statements relating to various types of resources required for internal audits, being knowledge, management/and environmental resources. S27 was loaded onto F3 relating to communication with CAE, overlapping with independence and objectivity since open lines of communication would allow IAors to work independently and with increased objectivity. It is for these reasons that management support clearly assists IA effectiveness from multiple perspectives, thus confirming that it positively influences effectiveness, in line with the findings of Al-Twaijry et al. (2003); Alzeban and Gwilliam (2014) and Onay (2021).
A clear positive Influence was observed for H12 (Cooperation with External Audit), with S28 relating to attitude and communication with EA loading onto confirmed F3 and the remaining statements S29–S32 loading exclusively onto F5, once again creating a singular factor for cooperation with external audit. The factor confirmation through the SEM process leaves no doubt as to the positive impact of external audit cooperation with IAE. This validates the claims made by Alzeban and Gwilliam (2014), arguing that the sharing of work papers, joint planning, and information exchange between the two teams may prove a positive influence on effectiveness. Regular meetings and discussions may result in less overlap of work between the two, resulting in reduced time and resource wastage in both IA and EA.
All statements relating to H13 (Cooperation with the Audit Committee) loaded onto confirmed F1, corroborating with Bednarek’s (2018) study proving that cooperation with the Audit Committee does indeed positively influence effectiveness. This would generally entail regular meetings between IA and AC, cooperation and assistance with risk signaling by the AC allowing constructive and strategic plans to be put in place in order to tackle these risks. F1 (Audit Follow-up and Audit Committee Cooperation) loaded up statements S33–S37 with a regression weight of 25.3% at 0.05 significance, relating to the two hypothesized factors being the follow-up process of an audit (H14) and cooperation with the audit committee (H13). It should be noted that since the questions for these followed each other in the survey, there may have been an element of influence or bias within the replies, resulting in the answers relating to follow-up process possibly being subconsciously prejudiced and assimilated with the previous questions measuring AC cooperation. This may have resulted in similar replies on the degree of agreement despite the distinctness of the statements, which may have indirectly contributed to the loading of both constructs onto a singular factor. However, this phenomenon was not evident in any other factor, possibly indicating this event as coincidental. The amalgamation of the two factors may highlight the importance of their overlapping qualities, being the risk identification and constant monitoring. Just as audit committees should “signal significant risks” to prioritise IA activities for strategic IA plans, the follow-up process is crucial in also identifying unrectified deficiencies and risks which require amending (Bednarek 2018). These reasons create a strong argument for the joining of these factors into one, clearly emphasising the true significance of both processes and the ultimate intention being risk identification and recommendation implementation through these two distinct methods.
The amalgamation of the two factors may highlight the importance of their overlapping qualities, being the risk identification and constant monitoring. Just as audit committees should “signal significant risks” to prioritise IA activities for strategic IA plans, the follow-up process is crucial in also identifying unrectified deficiencies and risks which require amending (Bednarek 2018; Ahmed et al. 2022) These reasons create a strong argument for the joining of these factors into one, clearly emphasising the true significance of both processes and the ultimate intention being risk identification and recommendation implementation through these two distinct methods (Salmasi et al. 2022; Zybin and Bielozorova 2021).
F5 (Cooperation with External Audit) loaded a singular hypothesis precisely as anticipated, affirming the positive influence on effectiveness that cooperation with EA may have, as explained by the literature and the findings.F7 (Adherence to Audit, Risk Assessment and Response Frameworks) gathered three statements from two hypothesised factors, with the common characteristic being namely the adherence to standards/frameworks/policies/guidelines or any publicly available or privately created procedures. Public models and guidelines from reputable institutions such as the IIA or ISO standards provide extensively detailed guidance from industry professionals on all aspects pertaining to the IA profession. When complied with, the standards ensure that the IA process is functioning to an exceptional level, validated by the findings. It is not always simple to carry out IA activities without the instructions or direction from these standards, which provide a very solid foundation for each IA team to build upon, including methods, concepts, and other key aspects to look out for. Among the statements tested, control risk self-assessment (CRSA) techniques and ISO 19011 were mentioned due to their significance in the IA sphere.
Both statements relating to a follow-up process (H14) were loaded onto confirmed F1 alongside the statements relating to H13, once again in agreeance with Mihret and Yismaw (2007) and the IIA’s (2017) standard requirements. The research concludes that this method of evaluating the actions taken (or not) in order to rectify the audit findings and implement the recommendations does indeed positively influence effectiveness, highlighting the importance of a follow-up process being in place and utilised.
The findings substantiate the claims made by Barisic and Tusek (2016) and Turetken et al. (2019), emphasising the relevance of working within an environment which promotes prospective thinking, accountability, creativity and rewards positive efforts and actions accordingly (H15). All statements loaded onto confirmed F2, highlighting the concept of the organisational environment as a key player in increasing effectiveness, resulting in its positive influence. F2 (Organisational Environment and Knowledge Resources) loaded statements from three hypothesised factors with the largest standardised regression weighting of 46% in SEM model 1 at 0.000 significance level, highlighting its strength as a factor. Although the statements tested were diverse in nature, the overlapping characteristics observed were the various resources and the environment required by an IA unit to increase effectiveness. Interestingly, this factor did not relate directly to monetary resources or number of employees, but instead to the knowledge resources and competency of personnel, having the professional know-how, right training and skills in all aspects including audit, taxation, IT/data security and other modern technologies. Furthermore, the idea of viewing the organisational environment as a resource in itself which may encourage and increase effectiveness is a compelling concept, highlighting corporate culture as a resource which may be exploited to the company’s advantage, utilising the elements discussed in H15.
No statistical evidence was obtained to prove either argument put forward in H16 (Private vs. Public Organisation), as clearly there are inherent advantages and disadvantages to both organisational forms. It is reasonable to assume that as Goodwin (2004) and Cohen and Sayag (2010) explained, the rigid legislation and scrutiny imposed on public entities may result in higher performing IAUs. The counterargument would likely be valid that private entities are heavily pressured into functioning effectively due to the large competition the private sector poses. The authors’ arguments may also hold true, that public entities may focus more on service delivery rather than cost minimisation, while private entities would focus on the latter and overall profit maximisation, seeing that they are for-profit unlike their public counterparts. Therefore, no conclusion could be achieved as to whether either organisational form is more effective than the other.
From the 402 total responses, 61 filled in the text field with 38 providing suitable material other than words of appreciation or well-wishing. The first issue was regarding the statements relating to Big Data and Analytics. Several respondents commented on the fact that the use of Big Data and analytical techniques are separate, non-homogenous functions which should not be amalgamated, possibly resulting in its decreased relevance and subsequent non-confirmation as a significant factor. Although the former does involve analytical techniques, the latter may be performed for other functions that do not involve Big Data and are likely more frequently used and simpler to carry out. Another respondent agreed on their importance but adds that the organisation’s data must be completely digitised, accurate and complete, which is not always the case.
Several respondents displayed stark disagreement at the idea of allowing full access to systems and data, explaining the extensive risks involved in doing so, especially in entities which deal with highly sensitive information such as health data. However, they should be allowed to access the data through permissions from the correct personnel or legal written consent, depending on specific requirements. This is in contrast with statements such as S10, “direct and unlimited access […] can freely audit all sections without any ad hoc permissions being necessary,” stressing the important distinction that needs to be made. This may explain why the independence statements loaded onto two factors, with the specific statements relating to access restrictions loading onto the unconfirmed factor F6 due to non-agreement.
Another crucial point explains that development of controls should never be carried out by IA despite being highly qualified to do so, as it would severely hinder independence and objectivity. One respondent in particular highlighted that even though IA should only provide recommendations, a management action plan (MAP) must be produced by the auditee which is approved by IA and published, allowing IA to provide their input at all stages. For this organisation, 100% of the MAP must be implemented with all the agreed-upon changes, with senior management facing the risk of losing their jobs if not carried out accordingly. Although this approach may seem severe, it allows the executives to ensure that management do not ignore IA and give them the consideration needed. Generally, the risk management team is tasked with control development.
One respondent described the idea of setting targets relating to number/severity of findings as controversial, which may even impede independence or effectiveness. When management is already aware of certain control issues, it should not wait for IA to diagnose the problem separately and propose corrective action, rather management should personally ‘own’ the issue and seek remedy. Another fact pointed out which related to independence was the approval of budgets, that is that the IA should not be allowed to approve its own budgets, as it is no exception to any other organisational unit. Instead, they suggested questioning whether the IAU achieved an approved budget which met the IA objectives.
Various respondents illustrated the leading purposes of IA being assurance, insight, fraud and waste prevention, all through focusing on operational rather than financial risks, with one respondent explaining that assessing financial statement accuracy is an ancillary objective, although that is generally carried out by external auditors. An individual explained that the mere existence of IA greatly improves internal controls and governance, with the level of maturity assisting its ability to carry out functions accordingly.
Lack of competency seems a common point of distress among respondents, explaining the significance of finding and employing individuals with the appropriate competencies, in line with the findings and F2. One respondent explained that the IA process is outsourced at times when the Group Internal Auditor deems that there are insufficient competencies with the in-house team. Another explained the lack of expertise in fields such as compliance, tax, RM, GDPR and others, highlighting the need for IAs with sufficient knowledge in various fields in order to maintain an agile and responsive IAU. Two respondents from the UK and Malta expressed their trouble attracting and hiring quality IA, explaining that reliance is then placed on junior auditors who significantly lack the skills and experience required, thus resulting in an adverse impact on audit quality. This is an alarming statement, given that the UK is generally viewed as one of the more advanced societies in IA. This highlights the increased need not only for IAs, but sufficiently trained individuals. This is also substantiated by a Turkish respondent’s advice that specific IA training/courses should be carried out at university level with emphasis on hands-on learning provided, rather than providing broad-scope teaching and relying on fresh graduates learning as they enter employment. One respondent claimed the IIA has no presence in Malta and very few Maltese have obtained the Certified Internal Auditor (CIA) qualification, which is deemed crucial for any internal auditor.
Independence was topic commonly brought up, with a Turkish respondent explaining that, if independence is breached, IA will be unable to provide transparent data not only to management but even to external audit. It was also noted that independence may be thwarted when risks are highlighted to clients/management and they respond defensively/threateningly and in disagreement with IA’s findings and recommendations, thus impeding the value-adding process. Another explained that some key audit directors involved in IA projects impair the process significantly due to their inability to operate independently. However, one pointed out that there must be a degree of flexibility where the IA does not distance itself too much from management, creating an “us and them” culture, yet at the same time functioning as a “critical friend” who has the same goals of improving organisational systems yet still willing to act “critically” and scrutinise where necessary. This was supported by another statement that the provision of management advisory services by the IAU is increasingly becoming a core contributor to IAE and the value-adding process.
Various respondents emphasised the relevance of AC support to ensure focus on risk and governance, while another maintained that IA is only effective when the CAE, who reports to the AC, is capable of successfully understanding and assessing audit risks. Several respondents described the importance of communication and exchanges between internal and external auditors. However, they highlighted that the objectives of each type of auditor were different, and the methodologies utilised were therefore also different.

6. Concluding Remarks

The study concluded by identifying 5 factors deemed to influence IAE, confirming the positive influence of factors such as competency, risk management, team size, management support, EA and AC cooperation, open control environment and follow-up process. On the other hand, independence, objectivity, and adherence to standards only achieved partial confirmation towards their positive influence. Albeit disputable, Insourcing IA departments was deemed more effective, while no statistical significance was obtained for audit quality, Big Data leveraging, scope limitations and public/private organisations. The 5 confirmed factors are listed in Table 20.
The new latent factors provided thought-provoking outlooks on various aspects of the IA processes, which are not immediately distinguishable. F1′s main theme related to risk identification and recommendation implementation through the two processes, while F2 emphasised the various resources necessary for any IA process. F3 relates mainly to communication resulting in independence and RM procedures, with F5 retaining the hypothesised description of cooperation with EA. The final factor F7 gathers the idea of adherence to any standard/policy or framework relating to all aspects encompassing the IA profession.
These findings are interesting especially for recruiters of IA and IAC members, for educators and trainers of IA and for prospective IAors who seem to have these characteristics and wish to pursue an IA carrier. However, with time and the many disruptors the effective IA characteristics may be modified and therefore a further study could re-perform a CFA on a new dataset maybe collected at a different date and from different regions. This would reconfirm or otherwise the model reliability and validity.

Author Contributions

Conceptualization, S.G. (Steven Grima) and S.G. (Simon Grima); methodology, S.G. (Steven Grima); M.K. and S.G. (Simon Grima); software, S.G. (Steven Grima) and S.G. (Simon Grima); validation, S.G. (Steven Grima) and S.G. (Simon Grima) and P.J.B.; formal analysis, S.G. (Steven Grima); M.K. and S.G. (Simon Grima); investigation, S.G. (Steven Grima); M.K. and S.G. (Simon Grima); resources, S.G. (Steven Grima) and S.G. (Simon Grima); data curation, S.G. (Steven Grima) and S.G. (Simon Grima); writing—original draft preparation, S.G. (Steven Grima); M.K. and S.G. (Simon Grima); writing—review and editing, S.G. (Steven Grima), S.G. (Simon Grima), P.J.B., N.T. and L.E.; visualization, S.G. (Steven Grima), S.G. (Simon Grima), P.J.B., N.T. and L.E.; supervision, S.G. (Steven Grima), S.G. (Simon Grima), P.J.B., N.T. and L.E.; project administration, S.G. (Steven Grima), S.G. (Simon Grima), P.J.B., N.T. and L.E. All authors have read and agreed to the published version of the manuscript.

Funding

This research received no external funding.

Data Availability Statement

All data is provided in the paper.

Acknowledgments

This paper is, in the main, based on a thesis by Steven Grima in partial fulfilment of the MA Accountancy at the University of Malta (2023). All Authors have consented.

Conflicts of Interest

The Authors declare no conflict of interest.

Appendix A

Table A1 outlines the statements presented in the survey, with references to the literature supporting each question.
Table A1. Questionnaire Statements.
#StatementLiterature
S1IA aims to incorporate risk management into the IA approach, aligning with organisational goals and thus improving overall performance and effectiveness.Onay (2021)
S2Our Internal Auditors frequently carry out risk assessment activities as part of their work.Onay (2021)
S3Our IA unit has adopted CRSA techniques.Arena and Azzone (2009)
S4IA determines whether the organisation’s risk responses match the risk appetite.Onay (2021)
S5The professional knowledge and qualifications of internal auditors is at a level allowing them to fulfil their responsibilities in the best way.Onay (2021)
S6Internal auditors attend educational seminars for continuous training and CPE activities.Onay (2021); Turetken et al. (2019)
S7The internal audit function has the right mix of competencies in areas of expertise including data security, taxation, audit software and new business technologies.Dinh et al. (2021); Onay (2021)
S8Internal auditors have relevant training and experience which enables them to audit all systems of the organisation.Onay (2021)
S9Internal auditors can submit their reports relating both to the lowest and to the highest level of senior management within the organisation.Onay (2021)
S10Internal auditors have direct and unlimited access to perform their duties within all levels of the organisation and can freely audit all sections without any ad hoc permissions being necessary with respect to any documentation and/or employees.IIA (2016)
S11The IAU is not impaired in carrying out impartially his responsibilities and tasks by any restrictive conditions, parties, or other type of interference.IIA (2016)
S12IA has the authority to hire or dismiss his own employees and approve his budgets/plans.Dinh et al. (2021)
S13The IAU reports administratively to management and operationally to the audit committee and/or the board of directors. Grima et al. (2020)
S14The IAU maintains an unbiased mental attitude that allows internal auditors to carry out their duties without any compromises.Dejnaronk et al. (2016)
S15IA staff does not perform any managerial/executive functions within the entity.Dellai and Omri (2016)
S16The IAU maintains and updates a quality assurance and improvement program.IIA (2016)
S17The IA team has adopted ISO 19011 standard as a guideline.Dejnaronk et al. (2016)
S18The IA team complies with specific standards including objectivity, proficiency, and professional care.IIA (2016)
S19The IA team leverages Big Data and analytics for audit projects.Joshi (2020)
S20Whole data sets are processed using Big Data and analytical techniques in order to reduce sampling risk.Joshi (2020)
S21The use of Big Data and analytical techniques improve the sufficiency, reliability and relevance of audit evidence obtained, thus increasing the overall comfort on the reported risks of the organisation.Yoon et al. (2015)
S22Big Data andamp; Analytics allow the IA to identify specific anomalies through scanning whole datasets thoroughly.Kaya et al. (2018)
S23There are no limits to the extent and boundaries (scope) of an internal audit.Erasmus and Coetzee (2018)
S24Senior management fully supports IA to fulfil its tasks.Onay (2021)
S25IA has the resources required for its audit-related tasks.Onay (2021)
S26Management is involved in the IA plan.Al-Twaijry et al. (2003)
S27Senior management has open communications with the Chief Audit Executive.Onay (2021)
S28External Auditors attitudes towards IA are supportive and mostly positive in nature.Alzeban and Gwilliam (2014)
S29External audit interacts regularly with internal audit, discussing plans, concerns, and consulting on the timing of work to avoid IA overlap.Alzeban and Gwilliam (2014)
S30External auditors rely on IA work.Alzeban and Gwilliam (2014)
S31Management coordinates the cooperation between internal and external audit.Alzeban and Gwilliam (2014)
S32External auditors and internal auditors mutually share their working papers.Alzeban and Gwilliam (2014)
S33IA frequently meets with the audit committee.Arena and Azzone (2009)
S34IA cooperates with the audit committee and supplies any requested information.Bednarek (2018)
S35The audit committee assists IA in signalling significant risks and designating priorities for annual and strategic internal audit plans.Arena and Azzone (2009)
S36A formal and structured follow-up process is established for each IA exercise.IIA (2016)
S37The follow-up process is utilised, maintained, and regularly updated.IIA (2016)
S38The organisational environment encourages open communication and criticism.COSO (2013)
S39The organisation maintains strong ethical values, responsibilities, and CG structures.COSO (2013)
S40The organisational environment promotes accountability and performance by attracting, developing, rewarding, and retaining competent individuals.Turetken et al. (2019)
Source: Refer to literature in table.
Table A2 presents the questions and statements relating to the measures of effectiveness, essentially measuring the dependent variable, split between percentage questions (M1 and M2) and regular statements (M3–M10).
Table A2. Questionnaire Measures of Effectiveness.
#Percentage/StatementLiterature
M1Percentage of IA activities carried out against planned activities.Turetken et al. (2019)
M2Percentage of recommendations which were implemented. Higher weighting may be placed on more important recommendations.Turetken et al. (2019)
M3Planned Activities and reporting are completed in a timely manner.Turetken et al. (2019)
M4Audit findings are solved in a timely manner.Turetken et al. (2019)
M5IA develops controls to improve the effectiveness of the risk management and governance processes.Turetken et al. (2019)
M6Audit findings are in line with the objectives set out at the planning stage.Badara and Saidin (2014)
M7IA includes the improvement to the financial reporting, internal control, and external audit processes.Van der Nest (2008)
M8The organisation does not receive a significant number of complaints from stakeholders.Cohen and Sayag (2010)
M9IA ensures adding value to the business and improving organisational performance.Onay (2021)
M10IA includes evaluating the accuracy and reliability of financial reports.Onay (2021)
Source: Refer to literature in table.
Table A3 outlines the demographic questions presented to the IA professionals responding to the survey.
Table A3. Questionnaire Demographics.
D1.Gender
D2Mark the highest level of education achieved by yourself
D3Mark the total years of experience you have worked in the internal audit profession
D4Mark the number of internal auditors in your unit/team
D5Mark the total number of employees in your firm/organisation
D6The internal audit function is in-sourced/outsourced/co-sourced
D7The organisation is a public/private entity
Source: Author’s compilation.

Appendix B

Appendix B provides the detailed results of the SEM analysis carried out for both models explained previously in the main body.
Table A4. Assessment of Normality for Model 1.
VariableMinMaxSkewC.R.KurtosisC.R.
M11.0005.000−1.336−10.9341.3105.362
M21.0005.000−0.979−8.0170.4761.948
M31.0005.000−1.121−9.1751.0584.331
M61.0005.000−1.284−10.5141.8517.576
M81.0005.000−0.571−4.677−0.271−1.109
M91.0005.000−1.610−13.1763.08012.605
S171.0005.000−0.112−0.920−1.044−4.273
S41.0005.000−0.883−7.2310.1530.627
S31.0005.000−0.706−5.778−0.264−1.079
S231.0005.000−0.899−7.360−0.296−1.212
S151.0005.000−1.560−12.7681.4495.929
S121.0005.000−0.470−3.848−1.058−4.332
S111.0005.000−1.389−11.3661.3005.320
S101.0005.000−1.276−10.4420.6742.757
S321.0005.0000.0830.675−1.159−4.745
S311.0005.000−0.207−1.695−0.904−3.698
S301.0005.000−0.515−4.219−0.555−2.271
S291.0005.000−0.416−3.409−0.774−3.169
S191.0005.000−0.538−4.401−0.616−2.519
S201.0005.000−0.380−3.112−0.908−3.718
S211.0005.000−0.769−6.291−0.096−0.391
S221.0005.000−0.900−7.3670.1960.803
S11.0005.000−2.293−18.7675.78423.670
S281.0005.000−0.758−6.2070.0650.266
S21.0005.000−1.615−13.2232.2689.281
S91.0005.000−1.969−16.1183.58214.660
S271.0005.000−1.841−15.0673.33713.659
S141.0005.000−1.954−15.9903.83915.713
S131.0005.000−1.938−15.8653.04812.473
S71.0005.000−0.882−7.2200.1190.489
S81.0005.000−1.082−8.8580.6742.758
S251.0005.000−0.822−6.7290.0390.158
S401.0005.000−0.984−8.0550.3181.301
S391.0005.000−1.292−10.5791.5106.179
S51.0005.000−1.372−11.2291.6586.786
S381.0005.000−1.047−8.5710.9343.823
S331.0005.000−1.446−11.8391.5906.507
S361.0005.000−1.602−13.1132.0618.434
S371.0005.000−1.599−13.0872.2519.213
S341.0005.000−1.635−13.3832.1248.694
S351.0005.000−1.046−8.5630.5792.369
Multivariate 405.19668.408
Table A5. Regression Weights Model 1.
Structural RelationshipsUnstandardized Regression Weights (β0)Standardized Regression Weights (β1)S.E.C.R.pR2
M<---F40.0060.0080.0540.1170.9070.77
M<---F7−0.113−0.1430.078−1.4450.148
M<---F30.2310.3240.1092.1190.034
M<---F60.0150.0250.070.2160.829
M<---F5−0.054−0.0920.035−1.5620.118
M<---FI0.1810.2530.0762.3680.018
M<---F20.320.460.0784.084***
S35<---FI10.696
S34<---FI1.0510.7960.07613.832***
S37<---FI0.9180.7010.07312.606***
S36<---FI0.9780.7130.07612.803***
S33<---FI1.1830.8180.08314.202***
S38<---F210.75
S5<---F20.7680.5820.06811.307***
S39<---F20.9540.7570.06414.962***
S40<---F21.1110.7370.07614.53***
S25<---F20.9010.6320.07312.35***
S8<---F20.860.620.07112.077***
S7<---F20.8640.6010.07411.669***
S13<---F310.676
S14<---F31.0190.7890.07313.922***
S27<---F30.8970.6870.07312.338***
S9<---F30.8650.650.07411.75***
S2<---F30.790.5750.07510.493***
S28<---F30.7930.5790.07510.564***
S1<---F30.6150.5270.0649.675***
S22<---F410.567
S21<---F41.1580.6490.06617.442***
S20<---F41.8140.8820.15311.854***
S19<---F41.7310.8830.14611.858***
S29<---F510.77
S30<---F51.0040.7270.08511.859***
S31<---F50.7330.5050.0838.827***
S32<---F50.8950.5980.08710.325***
S10<---F610.757
S11<---F60.9440.7940.06414.769***
S12<---F60.6640.4170.0857.773***
S15<---F60.5910.4750.0678.87***
S23<---F60.6660.4650.0778.675***
S3<---F710.556
S4<---F70.7730.4540.1236.284***
S17<---F71.2430.6220.1687.417***
M9<---M10.65
M8<---M0.9420.5070.1088.761***
M6<---M1.1320.670.10211.082***
M3<---M0.9750.5170.1098.91***
M2<---M1.2170.6040.1210.169***
M1<---M1.0870.5220.1218.95***
Table A6. Assessment of Normality for Model 2.
VariableMinMaxSkewC.R.KurtosisC.R.
M101.0005.000−0.793−6.491−0.145−0.595
M71.0005.000−1.020−8.3520.7262.971
M51.0005.000−0.873−7.142−0.373−1.527
S171.0005.000−0.112−0.920−1.044−4.273
S41.0005.000−0.883−7.2310.1530.627
S31.0005.000−0.706−5.778−0.264−1.079
S231.0005.000−0.899−7.360−0.296−1.212
S151.0005.000−1.560−12.7681.4495.929
S121.0005.000−0.470−3.848−1.058−4.332
S111.0005.000−1.389−11.3661.3005.320
S101.0005.000−1.276−10.4420.6742.757
S321.0005.0000.0830.675−1.159−4.745
S311.0005.000−0.207−1.695−0.904−3.698
S301.0005.000−0.515−4.219−0.555−2.271
S291.0005.000−0.416−3.409−0.774−3.169
S191.0005.000−0.538−4.401−0.616−2.519
S201.0005.000−0.380−3.112−0.908−3.718
S211.0005.000−0.769−6.291−0.096−0.391
S221.0005.000−0.900−7.3670.1960.803
S11.0005.000−2.293−18.7675.78423.670
S281.0005.000−0.758−6.2070.0650.266
S21.0005.000−1.615−13.2232.2689.281
S91.0005.000−1.969−16.1183.58214.660
S271.0005.000−1.841−15.0673.33713.659
S141.0005.000−1.954−15.9903.83915.713
S131.0005.000−1.938−15.8653.04812.473
S71.0005.000−0.882−7.2200.1190.489
S81.0005.000−1.082−8.8580.6742.758
S251.0005.000−0.822−6.7290.0390.158
S401.0005.000−0.984−8.0550.3181.301
S391.0005.000−1.292−10.5791.5106.179
S51.0005.000−1.372−11.2291.6586.786
S381.0005.000−1.047−8.5710.9343.823
S331.0005.000−1.446−11.8391.5906.507
S361.0005.000−1.602−13.1132.0618.434
S371.0005.000−1.599−13.0872.2519.213
S341.0005.000−1.635−13.3832.1248.694
S351.0005.000−1.046−8.5630.5792.369
Multivariate 345.14262.754
Table A7. Regression Weights Model 2.
Structural RelationshipsUnstandardized Regression Weights (β0)Standardized Regression Weights (β1)S.E.C.R.pR2
M<---F40.0100.0110.0850.1200.9040.88
M<---F70.3640.4120.1392.6240.009
M<---F30.2140.2760.1671.2800.201
M<---F6−0.029−0.0440.109−0.2620.793
M<---F50.2000.3100.0603.317***
M<---FI−0.070−0.0900.113−0.6150.539
M<---F2−0.005−0.0060.115−0.0410.967
S35<---FI1.0000.701
S34<---FI1.0540.8030.07613.930***
S37<---FI0.8980.6900.07212.485***
S36<---FI0.9620.7050.07512.743***
S33<---FI1.1820.8230.08314.257***
S38<---F21.0000.750
S5<---F20.7590.5750.06811.128***
S39<---F20.9530.7560.06414.865***
S40<---F21.1170.7410.07714.561***
S25<---F20.9050.6350.07312.357***
S8<---F20.8570.6180.07111.987***
S7<---F20.8630.6000.07411.613***
S13<---F31.0000.682
S14<---F31.0070.7870.07213.979***
S27<---F30.8850.6830.07212.341***
S9<---F30.8580.6500.07311.801***
S2<---F30.7830.5740.07410.525***
S28<---F30.7910.5820.07410.654***
S1<---F30.6090.5260.0639.694***
S22<---F41.0000.566
S21<---F41.1570.6480.06617.429***
S20<---F41.8210.8840.15411.853***
S19<---F41.7280.8810.14611.846***
S29<---F51.0000.767
S30<---F50.9890.7130.08311.851***
S31<---F50.7540.5170.0839.057***
S32<---F50.9160.6100.08710.546***
S10<---F61.0000.753
S11<---F60.9490.7940.06514.641***
S12<---F60.6700.4190.0867.778***
S15<---F60.5960.4770.0678.872***
S23<---F60.6770.4700.0778.742***
S3<---F71.0000.539
S4<---F70.7850.4480.1256.280***
S17<---F71.3120.6370.1737.598***
M5<---M1.0000.430
M10<---M1.2190.5990.1956.257***
M7<---M1.0820.6490.1706.373***

References

  1. Abdullah, Ahmed Yahya, and Aree Saeed Mustafa. 2020. Factors Impact on Internal Audit Effectiveness: The Case of Duhok University in Kurdistan-Iraq. International Business and Accounting Research Journal 4: 89–94. [Google Scholar] [CrossRef]
  2. Ahmad, Nasibah Halimah, Radiah Othman, Rohana OthMan, and Kamaruzaman Jusoff. 2012. The effectiveness o Internal Audit in Malaysian Public Sector. Journal of Modern Accounting and Auditing 5: 52. [Google Scholar]
  3. Ahmed, Fee Faysal, Tonmoy Adhikary, Tania Sultana, Sheikh Sadia Arny, Faria Tabassum Nishi, Partho Bosu, and Samiran Mondal. 2022. Prevalence and Associated Risk Factors of ‘Psychological, Financial and Career Effect’ Among Bangladeshi Undergraduate Students in the COVID-19 Pandemic Situation. International Journal of Mathematical Sciences and Computing (IJMSC) 8: 15–29. [Google Scholar] [CrossRef]
  4. Al-Twaijry, Abdulrahman A. M., John A. Brierley, and David R. Gwilliam. 2003. The development of internal audit in Saudi Arabia: An institutional theory perspective. Critical Perspectives on Accounting 14: 507–31. [Google Scholar] [CrossRef]
  5. Alzeban, Abdulaziz, and David Gwilliam. 2014. Factors affecting the internal audit effectiveness: A survey of the Saudi public sector. Journal of International Accounting, Auditing & Taxation 23: 74–86. [Google Scholar]
  6. Arena, Marika, and Giovanni Azzone. 2009. Identifying Organizational Drivers of Internal Audit Effectiveness. International Journal of Auditing 13: 43–60. [Google Scholar] [CrossRef]
  7. Attard, Maria. 2014. Internal Audit Effectiveness and Its Barriers in Maltese Public Limited Companies: An Assessment. Master’s thesis, University of Malta, Msida, Malta. [Google Scholar]
  8. Badara, Mu’azu Saidu, and Siti Zabedah Saidin. 2013. The Journey so far on Internal Audit Effectiveness: A Calling for Expansion. International Journal of Academic Research in Accounting, Finance and Management Sciences 3: 340–51. [Google Scholar] [CrossRef] [PubMed] [Green Version]
  9. Badara, Mu’azu Saidu, and Siti Zabedah Saidin. 2014. Empirical Evidence of Antecedents of Internal Audit Effectiveness from Nigerian Perspective. Middle-East Journal of Scientific Research 19: 460–71. [Google Scholar]
  10. Baldacchino, Peter J., Amy Camillerii, Anna Magrin, and Simon Grima. 2022. Effectiveness of Mergers and Acquisitions in Maltese Listed Companies: Financial Performance, Market Reactions and Shareholder Value. Journal of Accounting, Finance and Auditing Studies 8: 141–60. [Google Scholar] [CrossRef]
  11. Baldacchino, Peter J., Louanna Fiteni, Francis Bugeja, and Simon Grima. 2021a. The Evolution of Internal Auditing at a Central Bank: The Maltese Experience. European Research Studies 24: 628–54. [Google Scholar]
  12. Baldacchino, Peter J., Norbert Tabone, Enrica Maria Debono, and Simon Grima. 2021b. Audit Committees in Maltese Listed Companies and Their Perceived Effectiveness: An Assessment. European Research Studies Journal 24: 22–51. [Google Scholar]
  13. Barisic, Ivana, and Boris Tusek. 2016. The Importance of the Supportive Control Environment for Internal Audit Effectiveness—The Case of Croatian Companies. Economic Research-Ekonomska Istraživanja 29: 1021–37. [Google Scholar] [CrossRef] [Green Version]
  14. Bednarek, Piotr. 2018. Factors Affecting the Internal Audit Effectiveness: A Survey of the Polish Private and Public Sectors. In Efficiency in Business and Economics. Cham: Springer, pp. 1–16. [Google Scholar]
  15. Bota-Avram, Cristina, and Cristina Alexandrina Stefanescu. 2009. Measuring and Assessment of Internal Audit Effectiveness. Annals of Faculty of Economics 3: 784–90. [Google Scholar]
  16. Bota-Avram, Cristina, Ioan Popa, and Cristina Alexandrina Stefanescu. 2010. Methods of Measuring the Performance of Internal Audit. The Annals of the “Stefan Cel Mare” University of Suceava 10: 137–46. [Google Scholar]
  17. Braun, Virginia, and Victoria Clarke. 2006. Using thematic analysis in psychology. Qualitative Research in Psychology 3: 77–101. [Google Scholar] [CrossRef] [Green Version]
  18. Briffa, Chantel. 2016. The Independence of the Internal Auditor in Maltese Companies. Master’s thesis, University of Malta, Msida, Malta. [Google Scholar]
  19. Brown, Timothy A. 2015. Confirmatory Factor Analysis for Applied Research, 2nd ed. New York: Guilford Press. [Google Scholar]
  20. Caruana, Yanika, Simon Grima, Yannis Thalassinos, and Peter J. Baldacchino. 2020. The Effectiveness of Forensic Auditors In the Insurance Process. European Research Studies Journal 23: 68–92. [Google Scholar]
  21. Cattell, Raymond B., and Stephanie Vogelmann. 1977. A Comprehensive Trial of the Scree and KG Criteria for Determining the Number of Factors. Multivariate Behavioral Research 12: 289. [Google Scholar] [CrossRef]
  22. Chambers, Andrew D. 1993. Effective Internal Audits: How to Plan and Implement. London: Financial Times/Pitman Publishing. [Google Scholar]
  23. Chang, Yu-Tzu, Han-Chung Chen, Rainbow K. Cheng, and Wuchun Chi. 2019. The Impact of Internal Audit Attributes on the Effectiveness of Internal Control over Operations and Compliance. Journal of Contemporary Accounting and Economics 15: 1–19. [Google Scholar] [CrossRef]
  24. Charan, Jaykaran, and Tamoghna Biswas. 2013. How to Calculate Sample Size for Different Study Designs in Medical Research? Indian Journal of Psychological Medicine 35: 121–126. [Google Scholar] [CrossRef] [Green Version]
  25. Child, Dennis. 2006. The Essentials of Factor Analysis, 3rd ed. New York: Continuum. [Google Scholar]
  26. Cohen, Aaron, and Gabriel Sayag. 2010. The Effectiveness of Internal Auditing: An Empirical Examination of its Determinants in Israeli Organisations. Australian Accounting Review 20: 296–307. [Google Scholar] [CrossRef]
  27. COSO. 2013. Internal Control—Integrated Framework. Committee of Sponsoring Organizations of the Treadway Commission. Available online: https://www.coso.org/Shared%20Documents/CROWE-COSO-Internal-Control-Integrated-Framework.pdf (accessed on 5 December 2022).
  28. Creswell, John W., and Vicki L. Plano Clark. 2011. Designing and Conducting Mixed Methods Research. Thousand Oaks: SAGE Publications, Inc. [Google Scholar]
  29. D’Onza, Giuseppe, Georges M. Selim, Rob Melville, and Marco Allegrini. 2015. A Study on Internal Auditor Perceptions of the 27 Function Ability to Add Value. International Journal of Auditing 19: 182–94. [Google Scholar] [CrossRef]
  30. Dal Mas, Luciano Oreste, and Karin Barac. 2018. The Influence of the Chief Audit Executive’s Leadership Style on Factors related to Internal Audit Effectiveness. Managerial Auditing Journal 33: 807–35. [Google Scholar] [CrossRef]
  31. Dejnaronk, Jantipa, Harold T. Little, Bahaudin G. Mujtaba, and Robert James McClelland. 2016. Factors Influencing the Effectiveness of the Internal Audit Function in Thailand. Journal of Business and Policy Research 11: 80–93. [Google Scholar] [CrossRef]
  32. Dellai, Hella, and Mohamed Ali Brahim Omri. 2016. Factors Affecting the Internal Audit Effectiveness in Tunisian Organizations. Research Journal of Finance and Accounting 7: 2222–847. [Google Scholar]
  33. Deloitte. 2018. The Innovation Imperative: Forging Internal Audit’s Path to Greater Impact and Influence. New York: Deloitte. [Google Scholar]
  34. Dinh, Hung, Duc Cuong Pham, and Tuan Thi Nguyen. 2021. Factors affecting the internal audit effectiveness of steel enterprises in Vietnam. The Journal of Asian Finance, Economics, and Business 8: 271–83. [Google Scholar]
  35. Dittenhofer, Mort. 2001. Internal audit effectiveness: An expansion of present methods. Managerial Auditing Journal 16: 443–50. [Google Scholar]
  36. Dodge, Yadolah. 2008. The Concise Encyclopedia of Statistics. Berlin: Springer. ISBN 978-0-387-32833-1. Available online: https://www.stewartschultz.com/statistics/books/The%20Concise%20Encyclopedia%20of%20Statistics.pdf (accessed on 5 December 2022).
  37. Erasmus, Lourens J., and Philna Coetzee. 2018. Drivers of Stakeholders’ View of Internal Audit Effectiveness: Management versus Audit Committee. Managerial Auditing Journal 33: 90–114. [Google Scholar] [CrossRef]
  38. Ernst & Young. 2007. Global Internal Audit Survey. London: Ernst & Young. [Google Scholar]
  39. Fabrigar, Leandre R., Duane T. Wegener, Robert C. MacCallum, and Erin J. Strahan. 1999. Evaluating the use of exploratory factor analysis in psychological research. Psychological Methods 4: 272–99. [Google Scholar] [CrossRef]
  40. Fan, Yi, Jiquan Chen, Gabriela Shirkey, Ranjeet John, Susie R. Wu, Hogeun Park, and Changliang Shao. 2016. Applications of structural equation modeling (SEM) in ecological studies: An updated review. Ecological Processes 5: 1–12. [Google Scholar] [CrossRef] [Green Version]
  41. Farrugia, Veronica. 2006. The effectiveness of the Internal Audit function in Maltese public limited companies: An Assessment. Unpublished Bachelor of Accountancy (Hons.) dissertation, University of Malta, Msida, Malta. [Google Scholar]
  42. Goodwin, Jenny. 2004. A Comparison of Internal Audit in the Private and Public Sectors. Managerial Auditing Journal 19: 640–50. [Google Scholar] [CrossRef]
  43. Gorsuch, Richard L. 1983. Factor Analysis, 2nd ed. Hillsdale: Lawrence Erlbaum Associates. [Google Scholar]
  44. Grima, Simon, Peter J. Baldacchino, Jeremy Mercieca Abela, and Jonathan V. Spiteri. 2020. The Implications of Derisking: The Case of Malta, a Small EU State. Journal of Risk and Financial Management 13: 216. [Google Scholar] [CrossRef]
  45. Gul, Ferdinand A., and Nava Subramaniam. 1994. Audit committee, gifts and discounts, familiarity as factors affecting internal auditors’ professional objectivity. The Review of Business Studies 3: 88–99. [Google Scholar]
  46. Hair, Joseph F., William C. Black, Barry J. Babin, and Rolph E. Anderson. 2010. Multivariate Data Analysis, 7th ed. Upper Saddle River: Pearson Prentice Hall. [Google Scholar]
  47. Henson, Robin K., and J. Kyle Roberts. 2006. Exploratory factor analysis in published research: Common errors and some comment on improved practice. Educational and Psychological Measurement 66: 393–416. [Google Scholar] [CrossRef] [Green Version]
  48. Hetzel, R. D. 1996. A primer on factor analysis with comments on patterns of practice and reporting. In Advances in Social Science Methodology. Edited by Bruce Thompson. Greenwich: JAI, vol. 4, pp. 175–206. [Google Scholar]
  49. Hooper, Daire. 2012. Exploratory Factor Analysis. In Approaches to Quantitative Research—Theory and Its Practical Application: A Guide to Dissertation Students. Edited by H. Chen. Cork: Oak Tree Press. [Google Scholar]
  50. Horn, John L. 1965. A Rationale and Test for the Number of Factors in Factor Analysis. Psychometrika 30: 179–83. [Google Scholar] [CrossRef]
  51. IIA. 2016. Measuring the Effectiveness of the Internal Audit Function. Lake Mary: IIA. [Google Scholar]
  52. IIA. 2017. International Standards for the Professional Practice of Internal Auditing. Institute of Internal Auditors (IIA) Report. Lake Mary: IIA. [Google Scholar]
  53. ISO 19011:2011. 2011, Guidelines for Auditing Management Systems. Geneva: ISO, vol. 2011.
  54. Joshi, Prem Lal. 2020. Determinants Affecting Internal Audit Effectiveness. Emerging Markets Journal 10: 10–17. [Google Scholar] [CrossRef]
  55. Joshi, Prem Lal. 2021. Which factors affect the internal audit effectiveness in India? Indian Journal of Commerce and Management Studies 12: 1–13. [Google Scholar] [CrossRef]
  56. Kaiser, Henry Felix. 1975. An index of factorial simplicity. Psychometrika 39: 31–36. [Google Scholar] [CrossRef]
  57. Karagiorgos, Theofanis, George Drogalas, and Nikolaos Giovanis. 2011. Evaluation of the Effectiveness of Internal Audit in Greek 28 Hotel Business. International Journal of Economic Sciences and Applied Research 4: 19–34. [Google Scholar]
  58. Kaya, Idil, Destan Halit Akbulut, and Koray Ozoner. 2018. Big data analytics in internal audit. PressAcademia Procedia 7: 260–62. [Google Scholar] [CrossRef]
  59. Khine, Myint. 2013. Application of Structural Equation Modeling in Educational Research and Practice. Rotterdam: SensePublishers. [Google Scholar]
  60. Kim, Jae-On, and Charles W. Mueller. 1978. Introduction to Factor Analysis: What It Is and How to Do It. Beverly Hills: Sage. [Google Scholar]
  61. Kline, Paul. 2002. An Easy Guide to Factor Analysis. London: Routledge. [Google Scholar]
  62. Kline, Rex B. 2005. Principle and Practice of Structural Equation Modelling. New York: The Guilford Press. [Google Scholar]
  63. Korstanje, Joos. 2021. Structural Equation Modeling. Available online: https://towardsdatascience.com/structural-equation-modeling-dca298798f4d (accessed on 5 December 2022).
  64. Mahdawi, Saleh M. S., Abdullah Mohammed Ahmed Ayedh, and Khairil Faizal Bin Khairi. 2018. Effectiveness of Internal Audit. International Journal of Science and Research (IJSR) 7: 1797–803. Available online: https://www.ijsr.net/get_abstract.php?paper_id=ART20179790 (accessed on 5 December 2022).
  65. Mangion, Chantal, Norbert Tabone, Peter J. Baldacchino, and Simon Grima. 2021. Audit Quality and Resilience beyond the Role Stress Model: A Maltese Perspective. International Journal of Finance, Insurance and Risk Management 11: 37–56. [Google Scholar]
  66. Mardia, Kantilal Vardichand. 1970. Measures of Multivariate Skewness and Kurtosis with Applications. Biometrika 57: 519–30. [Google Scholar] [CrossRef]
  67. Mihret, Dessalegn Getie, and Aderajew Wondim Yismaw. 2007. Internal Audit Effectiveness: An Ethiopian Public Sector Case Study. Managerial Auditing Journal 22: 470–84. [Google Scholar] [CrossRef] [Green Version]
  68. Mizrahi, Shlomo, and Idit Ness-Weisman. 2007. Evaluating the Effectiveness of Auditing in Local Municipalities using Analytic Hierarchy Process (AHP): A General Model and the Israeli Example. International Journal of Auditing 11: 187–210. [Google Scholar] [CrossRef]
  69. Muscat, Shannon, Konrad Farrugia, Peter J. Baldacchino, Norbert Tabone, and Simon Grima. 2021. Perception of Unqualified Statutory Audit Reports: The Case in Malta. International Business and Accounting Research 5: 34–50. [Google Scholar]
  70. Nunnally, Jum C. 1978. Psychometric Theory, 2nd ed. New York: McGraw-Hill. [Google Scholar]
  71. Onay, Ahmet. 2021. Factors Affecting the Internal Audit Effectiveness: A Research of the Turkish Private Sector Organizations. Ege Academic Review 21: 1–15. [Google Scholar] [CrossRef]
  72. Özdamar, Kazim. 2010. Paket programları ile istatistiksel veri analizi 2. Ankara: Kaan Kitabevi. [Google Scholar]
  73. Page, Matthew J., Joanne E. McKenzie, Patrick M. Bossuyt, Isabelle Boutron, Tammy C. Hoffmann, Cynthia D. Mulrow, Larissa Shamseer, Jennifer M. Tetzlaff, Elie A. Akl, Sue E. Brennan, and et al. 2021. The PRISMA 2020 statement: An updated guideline for reporting systematic reviews. Systematic Reviews 10: 89. [Google Scholar] [CrossRef]
  74. Phornlaphatrachakorn, Kornchai. 2020. Audit Committee Effectiveness, Internal Audit Quality, Financial Reporting Quality, and Organizational Success: An Empirical Investigation of Thai Listed Firms. International Journal of Business 25: 343–66. [Google Scholar]
  75. Poltak, Hendra, Made Sudarma, and Lilik Purwanti. 2019. The Determinants of the Effectiveness of Internal Audits with Management Support as the Moderating Variable. International Journal of Multicultural and Multireligious Understanding 6: 33. [Google Scholar] [CrossRef] [Green Version]
  76. Rudhani, Leonora Haliti, Nexhmie Berisha Vokshi, and Shqipdona Hashani. 2017. Factors Contributing to the Effectiveness of Internal Audit: Case Study of Internal Audit in the Public Sector in Kosovo. Journal of Accounting, Finance and Auditing Studies 3: 91–108. [Google Scholar]
  77. Salmasi, Farzin, Mohammad Taghi Salmasi, and Apaydin Halit. 2022. Mathematical Based Implicit and Explicit Finite Difference Techniques for Solving the Ground Water Flow Equations Using Spreadsheets. International Journal of Mathematical Sciences and Computing(IJMSC) 8: 1–14. [Google Scholar] [CrossRef]
  78. Schmitt, Thomas A. 2011. Current methodological considerations in exploratory and confirmatory factor analysis. Journal of Psychoeducational Assessment 29: 304–21. [Google Scholar] [CrossRef] [Green Version]
  79. Sekaran, Uma. 2003. Research Methods for Business: A Skill Building Approach. New York: John Wiley & Sons. [Google Scholar]
  80. Soh, Dominic S. B., and Nonna Martinov-Bennie. 2011. The Internal Audit Function: Perceptions of Internal Audit Roles, Effectiveness and Evaluation. Managerial Auditing Journal 26: 605–22. [Google Scholar] [CrossRef]
  81. Stake, Robert E. 1995. The Art of Case Study Research. Thousand Oaks: SAGE Publications. [Google Scholar]
  82. Stapleton, Connie. D. 1997. Basic Concepts and procedures of Confirmatory Factor Analysis. Austin: Annual Meeting of the Southwest Educational Research Association. [Google Scholar]
  83. Stevens, James P. 2002. Applied Multivariate Statistics for the Social Sciences. Mahwah: Lawrance Erlbaum Association, Inc. [Google Scholar]
  84. Ta, Thu Trang, and Thanh Nga Doan. 2022. Factors Affecting Internal Audit Effectiveness: Empirical Evidence from Vietnam. International Journal of Financial Studies 10: 37. [Google Scholar] [CrossRef]
  85. Tabachnick, Barbara G., and Linda S. Fidell. 2007. Using Multivariate Statistics, 5th ed. Upper Saddle River: Pearson Allyn & Bacon. [Google Scholar]
  86. Tabachnick, Barbara G., and Linda S. Fidell. 2014. Using Multivariate Statistics. Harlow: Pearson Education Limited. [Google Scholar]
  87. Taber, Keith S. 2018. The Use of Cronbach’s Alpha When Developing and Reporting Research Instruments in Science Education. Research in Science Education 48: 1273–96. [Google Scholar] [CrossRef] [Green Version]
  88. Tackie, George, Edward Marfo-Yiadom, and Sampson Oduro Achina. 2016. Determinants of Internal Audit Effectiveness in Decentralized Local Government Administrative Systems. International Journal of Business and Management 11: 184–95. [Google Scholar] [CrossRef] [Green Version]
  89. Thurstone, Louis Leon. 1947. Multiple Factor Analysis: A Development and Expansion of Vectors of the Mind. Chicago: University of Chicago. [Google Scholar]
  90. Turetken, Oktay, Stevens Jethefer, and Baris Ozkan. 2019. Internal audit effectiveness: Operationalization and influencing factors. Managerial Auditing Journal 35: 238–71. [Google Scholar] [CrossRef] [Green Version]
  91. Van der Nest, D. P. 2008. The perceived effectiveness of audit committees in the South African public service. Meditari Accountancy Research 16: 175–88. [Google Scholar] [CrossRef]
  92. Yeboah, Edward. 2020. Critical Literature Review on Internal Audit Effectiveness. Open Journal of Business and Management 8: 1977–87. [Google Scholar] [CrossRef]
  93. Yin, Robert K. 2002. Case Study Research: Design and Methods. Thousand Oaks: SAGE Publications. [Google Scholar]
  94. Yoon, Kyunghee, Lucas Hoogduin, and Li Zhang. 2015. Big data as complementary audit evidence. Accounting Horizons 29: 431–38. [Google Scholar] [CrossRef]
  95. Zybin, Serhii, and Yana Bielozorova. 2021. Risk-based Decision-making System for Information Processing Systems. International Journal of Information Technology and Computer Science(IJITCS) 13: 1–18. [Google Scholar] [CrossRef]
Figure 1. Framework. Source: Authors’ compilation adapted from (Korstanje 2021).
Jrfm 16 00056 g001
Figure 2. The PRISMA Flow Diagram. Source: Authors’ Compilation.
Jrfm 16 00056 g002
Figure 3. Scree Plot. Source: Authors’ computation outputted from SPSS software version 26.
Jrfm 16 00056 g003
Figure 4. Structural Equation Model 1. Source: Authors’ computation outputted from SPSS Amos software version 21.
Jrfm 16 00056 g004
Figure 5. Structural Equation Model 2. Source: Authors’ computation outputted from SPSS Amos software version 21.
Jrfm 16 00056 g005
Table 1. Effectiveness Factors.
Supply Side
EF1Risk-Based Audit Approach
EF2IA Size
EF3IA Competency
EF4IA Independence
EF5IA Objectivity
EF6Quality of Audit Work
EF7Adherence to Standards
EF8Outsourcing IA Work
EF9Use of Big Data
EF10Limitation of Scope
Demand Side
EF11IA Support from Management
EF12Cooperation with External Audit
EF13Cooperation with Audit Committee
EF14IA Follow-up Process
EF15Control Environment
EF16Private vs. Public Organisations
Source: Authors’ compilation adapted from Turetken et al. (2019).
Table 2. Effectiveness Measures.
NoMeasure DescriptionTypeNo. of Studies
Objective Measures
EM1Percentage of audit plan achievedProcess4
EM2Timeliness of completing planned activitiesProcess2
EM3Recommendation Implementation RateOutput7
EM4Time to solve findingsOutput2
EM5Adherence to policies and plansProcess3
Perceived Measures
EM6Perceived IA effectivenessOutput9
EM7Stakeholder’s satisfactionOutput3
EM8Perceived added value to the organisationOutcome5
Source: Authors’ compilation from literature sources listed in Appendix A.
Table 3. Studies on Effectiveness Factors.
Factor DescriptionNo. of Studies
Supply Side
EF1Risk-Based Audit Approach8
EF2IA Size6
EF3IA Competency6
EF4IA Independence6
EF5IA Objectivity3
EF6Quality of Audit Work4
EF7Adherence to Standards2
EF8Outsourcing IA Work3
EF9Use of Big Data5
EF10Limitation of Scope2
Demand Side
EF11IA Support from Management3
EF12Cooperation with External Audit2
EF13Cooperation with Audit Committee2
EF14IA Follow-up Process2
EF15Control Environment3
EF16Private vs. Public Organisations2
Source: Authors’ compilation from literature sources listed in Appendix A.
Table 4. Hypotheses Schedule.
HypothesisFactorDescription
H1EF1Incorporating a risk-based audit approach increases IA effectiveness
H2EF2A larger IA team increases IA effectiveness
H3EF3Competency increases IA effectiveness
H4EF4Independence increases IA effectiveness
H5EF5Objectivity increases IA effectiveness
H6EF6Higher quality audit work increases IA effectiveness
H7EF7Stronger adherence to standards increases IA effectiveness
H8EF8Outsourcing IA work increases IA effectiveness
H9EF9Leveraging Big Data increases IA effectiveness
H10EF10No scope limitation increases IA effectiveness
H11EF11Management support increases IA effectiveness
H12EF12Cooperation with external audit increases IA effectiveness
H13EF13Cooperation with the audit committee increases IA effectiveness
H14EF14Establishing an IA follow-up process increases IA effectiveness
H15EF15A positive and open control environment increases IA effectiveness
H16EF16Private organisations have more effective IAUs than public organisations
Source: Authors’ Compilation.
Table 5. Questionnaire Structure.
QuestionsHypotheses/Measures Analysed
Section 1: Introduction
Section 2: Demographics
Question 1
  • General demographics
Questions 2–3
  • H3—Competency/general demographics
Questions 4–5
  • H2—Size
Question 6
  • H8—Insourced/outsourced
Question 7
  • H16—Public/private entity
Section 3: Factors
Questions 1–4
  • H1—Risk-based audit approach
Questions 5–8
  • H3—Competency
Questions 9–13
  • H4—Independence
Questions 14–15
  • H5—Objectivity
Question 16
  • H6—Quality of audit work
Questions 17–18
  • H7—Adherence to standards
Questions 19–22
  • H9—Use of Big Data
Question 23
  • H10—Limitation of scope
Questions 24–27
  • H11—Support from management
Questions 28–32
  • H12—Cooperation with external audit
Questions >33–35
  • H13—Cooperation with audit committee
Questions 36–37
  • H14—Follow-up process
Questions 38–40
  • H15—Control environment
Section 4: Effectiveness Measures
Question 1
  • EM1—Percentage of audit plan achieved
Question 3
  • EM2—Timeliness of completing and reporting planned activities
Question 2
  • EM3—Recommendation implementation rate
Question 4
  • EM4—Time to solve findings
Question 6
  • EM5—Adherence to policies and plans
Questions 5, 7, 10
  • EM6—Perceived IA effectiveness
Question 8
  • EM7—Stakeholder’s satisfaction
Question 9
  • EM8—Perceived added value to the organisation
Section 5: Comments
Open-ended question
  • Any relevant information
Source: Authors’ compilation. Refer to Appendix A for literature sources.
Table 6. Question Labelling.
SectionQuestionsReference
DemographicsD1–D7Appendix A Table A3
StatementsS1–S40Appendix A Table A1
Measures of EffectivenessM1–M10Appendix A Table A2
CommentsQ1
Source: Authors’ compilation.
Table 7. Omitted Statements.
Question No.Statement
S6Internal auditors attend educational seminars for continuous training and CPE activities.
S16The IAU maintains and updates a quality assurance and improvement program.
S18The IA team complies with specific standards including objectivity, proficiency, and professional care.
S24Senior management fully supports IA to fulfil its tasks.
S26Management is involved in the IA plan.
Source: Authors’ compilation.
Table 8. Initial Eigenvalues.
ComponentTotal% of VarianceCumulative %
110.77930.79630.796
23.0168.61639.412
31.9885.67945.092
41.5884.53649.627
51.3293.79853.426
61.2893.68457.110
71.0643.04060.150
Extraction Method: Principal Component Analysis. When components are correlated, sums of squared loadings cannot be added to obtain a total variance. Source: Authors’ computation outputted from SPSS software version 26.
Table 9. Component Correlation Matrix.
Component1234567
11.0000.5220.5350.2820.2470.5330.193
20.5221.0000.3730.4300.3260.4000.366
30.5350.3731.0000.1140.1170.5230.105
40.2820.4300.1141.0000.2930.2230.311
50.2470.3260.1170.2931.0000.1950.248
60.5330.4000.5230.2230.1951.0000.066
70.1930.3660.1050.3110.2480.0661.000
Source: Authors’ computation outputted from SPSS software version 26.
Table 10. Pattern Matrix a.
Components
F1F2F3F4F5F6F7
S330.822
S360.815
S370.794
S340.778
S350.644
S7 0.833
S8 0.797
S25 0.657
S40 0.606
S39 0.545
S5 0.517
S38 0.469
S1 0.720
S28 0.605
S2 0.535
S9 0.534
S27 0.500
S14 0.499
S13 0.495
S21 0.947
S22 0.924
S19 0.693
S20 0.665
S30 0.809
S32 0.764
S29 0.759
S31 0.575
S12 0.817
S23 0.671
S10 0.569
S15 0.531
S11 0.514
S3 0.860
S4 0.619
S17 0.461
Extraction Method: Principal Component Analysis. Rotation Method: Promax with Kaiser Normalization a. Source: Authors’ computation outputted from SPSS software.
Table 11. Reliability Tests.
FactorMeanStandard DeviationCronbach’s AlphaInterpretation
F14.25920.807060.876Reliable
F23.98650.743860.854Reliable
F34.33900.672340.830Robust
F43.62940.979240.866Reliable
F53.24690.918170.743Relatively High
F63.98510.802350.706Relatively High
F73.44360.873390.558Acceptable
Source: Authors’ computation outputted from SPSS software.
Table 12. New factor labelling.
New FactorsVariablesOld Hypothesis CoveredNew Factor Name
F1S33–S35
S36–S37
Cooperation with Audit Committee
Follow-up Process
Audit Follow-up and AC Cooperation
F2S5, S7, S8, S25,
S38–S40
Competency Management Support Control EnvironmentOrganisational Environment and Knowledge Resources
F3S1, S2, S9, S13, S14, S27, S28Risk-Based Approach Independence Objectivity Management Support
Cooperation with External Audit
Risk Management, Communication and Independence from Management and External Audit
F4S19–S22Use of Big DataUse of Big Data
F5S29–S32Cooperation with External AuditCooperation with External Audit
F6S10–S12, S15, S23Independence Objectivity Limitation of ScopeIA Independence and Scope
F7S3, S4, S17Risk-Based Approach Adherence to StandardsAdherence to Audit, Risk Assessment and Response
Frameworks
Source: Author’s computation.
Table 13. Pattern Matrix a.
Components
12Factor Labelling
M20.860 Objective IA Effectiveness and Added Value
M10.853
M60.530
M80.513
M90.456
M30.415
M10 0.773Perceived IA Effectiveness
M7 0.724
M5 0.602
Extraction Method: Principal Component Analysis. Rotation Method: Oblimin with Kaiser Normalization. a Rotation converged in 13 iterations. Source: Author’s computation outputted from SPSS software.
Table 14. Factor Regression 1.
Structural RelationshipsUnstandardized Regression Weights (β0)Standardized Regression Weights (β1)S.E.C.R.pR2
M<---F40.0060.0080.0540.1170.9070.77
M<---F7−0.113−0.1430.078−1.4450.148
M<---F30.2310.3240.1092.1190.034
M<---F60.0150.0250.070.2160.829
M<---F5−0.054−0.0920.035−1.5620.118
M<---F10.1810.2530.0762.3680.018
M<---F20.320.460.0784.084***
Source: Authors’ computation outputted from SPSS Amos software version 21.
Table 15. Factor Regression 2.
Structural RelationshipsUnstandardized Regression Weights (β0)Standardized Regression Weights (β1)S.E.C.R.pR2
M <--- F40.0100.0110.0850.1200.9040.88
M<---F70.3640.4120.1392.6240.009
M <--- F30.2140.2760.1671.2800.201
M <--- F6−0.029−0.0440.109−0.2620.793
M<---F50.2000.3100.0603.317***
M <--- F1−0.070−0.0900.113−0.6150.539
M <--- F2−0.005−0.0060.115−0.0410.967
Source: Authors’ computation outputted from SPSS Amos software version 21.
Table 16. New Variables.
New VariableCalculationMeanStandard Deviation
IA_Ratio(IAors/Employees)0.57520.31923
Confirmed_Factors(F1 + F2 + F3 + F5 + F7)/53.85500.57779
Measures(M_Perceived + M_Objective)/24.02460.58514
Source: Authors’ compilation.
Table 17. Regression Coefficient a.
Unstandardized CoefficientsStandardized CoefficientstSig.
Model BStd. ErrorBeta
1(Constant)4.0720.254 16.0020.000
Gender0.0220.0490.0220.4480.655
Education−0.0660.041−0.081−1.6030.110
Experience0.0090.0230.0200.3990.690
No. of IAors0.0150.0260.0320.5890.556
No. of Employees0.0430.0270.0901.5860.113
Insourced/Outsourced/Co-Sourced−0.0940.051−0.094−1.8330.068
Public/Private Entity0.0290.0510.0290.5730.567
a Dependent Variable: Measures. Source: Authors’ computation outputted from SPSS Amos software.
Table 18. Correlations.
Confirmed_FactorsMeasures
GenderPearson Correlation−0.0280.019
Sig. (2-tailed)0.5790.704
EducationPearson Correlation−0.063−0.096
Sig. (2-tailed)0.2100.054
ExperiencePearson Correlation0.0310.012
Sig. (2-tailed)0.5380.814
No. of IAorsPearson Correlation0.099 *0.085
Sig. (2-tailed)0.0480.090
No. of EmployeesPearson Correlation0.0250.127 *
Sig. (2-tailed)0.6210.011
Insourced/Co-Sourced/OutsourcedPearson Correlation−0.085−0.122 *
Sig. (2-tailed)0.0900.015
Public/Private EntityPearson Correlation0.0280.019
Sig. (2-tailed)0.5740.702
IA_RatioPearson Correlation0.050−0.032
Sig. (2-tailed)0.3150.518
Confirmed_FactorsPearson Correlation10.642 **
Sig. (2-tailed) 0.000
MeasuresPearson Correlation0.642 **1
Sig. (2-tailed)0.000
* Correlation is significant at the 0.05 level (2-tailed). ** Correlation is significant at the 0.01 level (2-tailed). Source: Authors’ computation outputted from SPSS Amos software.
Table 19. Confirmed Hypotheses.
HypothesisOriginal DescriptionResearch Findings
H1Incorporating a risk-based audit approach increases IA effectivenessPositive Influence
H2A larger IA team increases IA effectivenessPositive Influence
H3Competency increases IA effectivenessPositive Influence
H4Independence increases IA effectivenessPartially Confirmed
Positive Influence
H5Objectivity increases IA effectivenessPartially Confirmed
Positive Influence
H6Higher quality audit work increases IA effectivenessNo Statistical Influence
H7Stronger adherence to standards increases IA effectivenessPartially Confirmed
Positive Influence
H8Outsourcing IA work increases IA effectivenessNegative Influence
H9Leveraging Big Data increases IA effectivenessNo Statistical Influence
H10No scope limitations increases IA effectivenessNo Statistical Influence
H11Management support increases IA effectivenessPositive Influence
H12Cooperation with external audit increases IA effectivenessPositive Influence
H13Cooperation with the audit committee increases IA effectivenessPositive Influence
H14Establishing an IA follow-up process increasesIA effectivenessPositive Influence
H15A positive and open control environment increases IA effectivenessPositive Influence
H16Private organisations have more effective IAUs than public organisationsNo Statistical Influence
Source: Authors’ compilation.
Table 20. Confirmed Factors.
FactorDescription
F1Audit Follow-up & Audit Committee Cooperation
F2Organisational Environment & Knowledge Resources
F3Risk Management, Communication & Independence from Management & External Audit
F5Cooperation with External Audit
F7Adherence to Audit, Risk Assessment & Response Frameworks
Source: Authors’ compilation.
Disclaimer/Publisher’s Note: The statements, opinions and data contained in all publications are solely those of the individual author(s) and contributor(s) and not of MDPI and/or the editor(s). MDPI and/or the editor(s) disclaim responsibility for any injury to people or property resulting from any ideas, methods, instructions or products referred to in the content.

