
High Cerebrospinal Fluid CX3CL1 Levels in Alzheimer’s Disease Patients but Not in Non-Alzheimer’s Disease Dementia

 ,
, 
 ,
, 
 and
and
Abstract
:1. Introduction
2. Materials and Methods
2.1. Selection of Patients and Groups
2.2. Evaluation of Aβ 1–40, Aβ 1–4, Tau-Total and Tau-Phosphorylated Using Chemiluminescence Enzyme Immunoassay (CLEIA) in Selected Groups
2.3. CX3CL1 Evaluation Using Enzyme Linked Immunosorbent Assay (ELISA) in CSF Patients
2.4. Statistical Analyses
3. Results
3.1. Patient Classification into Groups
3.2. CX3CL1 Expression in the Different Patient Groups
3.3. Statistical Evaluation According to Mann–Whitney Test
4. Discussion
5. Limitations
6. Conclusions
Supplementary Materials
Author Contributions
Funding
Institutional Review Board Statement
Conflicts of Interest
References
- World Health Organization. Risk Reduction of Cognitive Decline and Dementia: WHO Guidelines; World Health Organization: Geneva, Switzerland, 2019; ISBN 978-92-4-155054-3.
- Leng, F.; Edison, P. Neuroinflammation and microglial activation in Alzheimer disease: Where do we go from here? Nat. Rev. Neurol. 2021, 17, 157–172. [Google Scholar] [CrossRef] [PubMed]
- Herrup, K. The case of rejecting the amyloid cascade hypothesis. Nat. Neurosci. 2015, 18, 794–799. [Google Scholar] [CrossRef] [PubMed]
- Heneka, M.T.; Carson, M.J.; El Khoury, J.; Landreth, G.E.; Brosseron, F.; Feinstein, D.L.; Jacobs, A.H.; Wyss-Coray, T.; Vitorica, J.; Ransohoff, R.M.; et al. Neuroinflammation in Alzheimer’s disease. Lancet Neurol. 2015, 14, 388–405. [Google Scholar] [CrossRef]
- Hoogland, I.C.; Houbolt, C.; van Westerloo, D.J.; van Gool, W.A.; van de Beek, D. Systemic inflammation and microglial activation: Systematic review of animal experiments. J. Neuroinflammation 2015, 12, 114. [Google Scholar] [CrossRef]
- Ransohoff, R.M. How neuroinflammation contributes to neurodegeneration. Science 2016, 353, 777–783. [Google Scholar] [CrossRef]
- Finneran, D.J.; Nash, K.R. Neuroinflammation and fractalkinesignaling in Alzheimer’s disease. J. Neuroinflammation 2019, 16, 30. [Google Scholar] [CrossRef]
- Edison, P.; Donat, C.K.; Sastre, M. In vivo Imaging of Glial Activation in Alzheimer’s Disease. Front. Neurol. 2018, 9, 625. [Google Scholar] [CrossRef]
- Malpetti, M.; Passamonti, L.; Jones, P.S.; Street, D.; Rittman, T.; Fryer, T.D.; Hong, Y.T.; Rodriguez, P.V.; Bevan-Jones, W.R.; Aigbirhio, F.I.; et al. Neuroinflammation predicts disease progression in progressive supranuclear palsy. J. Neurol. Neurosurg. Psychiatry 2021, 92, 769–775. [Google Scholar] [CrossRef]
- Alster, P.; Krzyżanowska, E.; Koziorowski, D.; Szlufik, S.; Różański, D.; Noskowska, J.; Mianowicz, J.; Michno, A.; Królicki, L.; Friedman, A. Difficulties in the diagnosis of four repeats (4R) tauopathic parkinsonian syndromes. Neurol. Neurochirurgia Polska 2018, 52, 459–464. [Google Scholar] [CrossRef]
- Alster, P.; Madetko, N.; Friedman, A. Neutrophil-to-lymphocyte ratio (NLR) at boundaries of Progressive Supranuclear Palsy Syndrome (PSPS) and Corticobasal Syndrome (CBS). Pol. J. Neurol. Neurosurg. 2021, 55, 97–101. [Google Scholar] [CrossRef]
- Sheridan, G.K.; Murphy, K.J. Neuron-glia crosstalk in health and disease: Fractalkine and CX3CR1 take centre stage. Open Biol. 2013, 3, 130181. [Google Scholar] [CrossRef]
- Hoshiko, M.; Arnoux, I.; Avignone, E.; Yamamoto, N.; Audinat, E. Deficiency of the microglial receptor CX3CR1 impairs postnatal functional development of thalamocortical synapses in the barrel cortex. J. Neurosci. 2012, 32, 15106–15111. [Google Scholar] [CrossRef]
- Luo, P.; Chu, S.F.; Zhang, Z.; Xia, C.Y.; Chen, N.H. Fractalkine/CX3CR1 is involved in the cross-talk between neuron and glia in neurological diseases. Brain Res. Bull. 2019, 146, 12–21. [Google Scholar] [CrossRef]
- Szepesi, Z.; Manouchehrian, O.; Bachiller, S.; Deierborg, T. Bidirectional Microglia-Neuron Communication in Health and Disease. Front. Cell Neurosci. 2018, 12, 323. [Google Scholar] [CrossRef] [PubMed]
- Chen, P.; Zhao, W.; Guo, Y.; Xu, J.; Yin, M. CX3CL1/CX3CR1 in Alzheimer’s Disease: A Target for Neuroprotection. BioMed Res. Int. 2016, 2016, 8090918. [Google Scholar] [CrossRef] [PubMed]
- Williams, J.L.; Holman, D.W.; Klein, R.S. Chemokines in the balance: Maintenance of homeostasis and protection at CNS barriers. Front. Cell Neurosci. 2014, 8, 154. [Google Scholar] [CrossRef] [PubMed]
- Bachstetter, A.D.; Morganti, J.M.; Jernberg, J.; Schlunk, A.; Mitchell, S.H.; Brewster, K.W.; Hudson, C.E.; Cole, M.J.; Harrison, J.K.; Bickford, P.C.; et al. Fractalkine and CX3CR1 regulate hippocampal neurogenesis in adult and aged rats. Neurobiol. Aging 2011, 32, 2030–2044. [Google Scholar] [CrossRef] [PubMed]
- Pawelec, P.; Ziemka-Nalecz, M.; Sypecka, J.; Zalewska, T. The Impact of the CX3CL1/CX3CR1 Axis in Neurological Disorders. Cells 2020, 9, 2277. [Google Scholar] [CrossRef]
- Albert, M.S.; DeKosky, S.T.; Dickson, D.; Dubois, B.; Feldman, H.H.; Fox, N.C.; Gamst, A.; Holtzman, D.M.; Jagust, W.J.; Petersen, R.C.; et al. The diagnosis of mild cognitive impairment due to Alzheimer’s disease: Recommendations from the National Institute on Aging—Alzheimer’s Association workgroups on diagnostic guidelines for Alzheimer’s disease. Alzheimer′s Dementia 2011, 7, 270–279. [Google Scholar] [CrossRef]
- McKhann, G.M.; Knopman, D.S.; Chertkow, H.; Hyman, B.T.; Jack, C.R., Jr.; Kawas, C.H.; Klunk, W.E.; Koroshetz, W.J.; Manly, J.J.; Mayeux, R.; et al. The diagnosis of dementia due to Alzheimer’s disease: Recommendations from the National Institute on Aging—Alzheimer’s Association workgroups on diagnostic guidelines for Alzheimer’s disease. Alzheimer’s Dementia 2011, 7, 263–269. [Google Scholar] [CrossRef] [Green Version]
- Jack, C.R., Jr.; Bennett, D.A.; Blennow, K.; Carrillo, M.C.; Dunn, B.; Haeberlein, S.B.; Holtzman, D.M.; Jagust, W.; Jessen, F.; Karlawish, J.; et al. NIA-AA Research Framework: Toward a biological definitionof Alzheimer’s disease. Alzheimer’s Dementia 2018, 14, 535–562. [Google Scholar] [CrossRef]
- Agnello, L.; Piccoli, T.; Vidali, M.; Cuffaro, L.; Lo Sasso, B.; Iacolino, G.; Giglio, V.R.; Lupo, F.; Alongi, P.; Bivona, G.; et al. Diagnostic accuracy of cerebrospinal fluid biomarkers measured by chemiluminescent enzyme immunoassay for Alzheimer disease diagnosis. Scand. J. Clin. Lab. Investig. 2020, 80, 313–317. [Google Scholar] [CrossRef]
- Nordengen, K.; Kirsebom, B.E.; Henjum, K.; Selnes, P.; Gísladóttir, B.; Wettergreen, M.; Torsetnes, S.B.; Grøntvedt, G.R.; Aarsland, D.; Nilsson, L.N.; et al. Glial activation and inflammation along the Alzheimer’s disease continuum. J. Neuroinflammation 2019, 21, 46. [Google Scholar] [CrossRef]
- Kulczyńska-Przybik, A.; Słowik, A.; Mroczko, P.; Borawski, B.; Groblewska, M.; Borawska, R.; Mroczko, B. Cerebrospinal Fluid and Blood CX3CL1 as a Potential Biomarker in Early Diagnosis and Prognosis of Dementia. Curr. Alzheimer Res. 2020, 17, 709–721. [Google Scholar] [CrossRef]
- Peters van Ton, A.M.; Verbeek, M.M.; Alkema, W.; Pickkers, P.; Abdo, W.F. Downregulation of synapse-associated protein expression and loss of homeostatic microglial control in cerebrospinal fluid of infectious patients with delirium and patients with Alzheimer’s disease. Brain Behav. Immun. 2020, 89, 656–667. [Google Scholar] [CrossRef]
- Perea, J.R.; Lleó, A.; Alcolea, D.; Fortea, J.; Ávila, J.; Bolós, M. Decreased CX3CL1 Levels in the Cerebrospinal Fluid of Patients with Alzheimer’s Disease. Front. Neurosci. 2018, 12, 609. [Google Scholar] [CrossRef]
- Guedes, J.R.; Lao, T.; Cardoso, A.L.; El Khoury, J. Roles of Microglial and Monocyte Chemokines and Their Receptors in Regulating Alzheimer’s Disease-Associated Amyloid-β and Tau Pathologies. Front. Neurol. 2018, 9, 549. [Google Scholar] [CrossRef] [Green Version]


| Variable | Patients Tot (n = 46) | Group A (n = 28) | Group B (n = 18) | σ2 * |
|---|---|---|---|---|
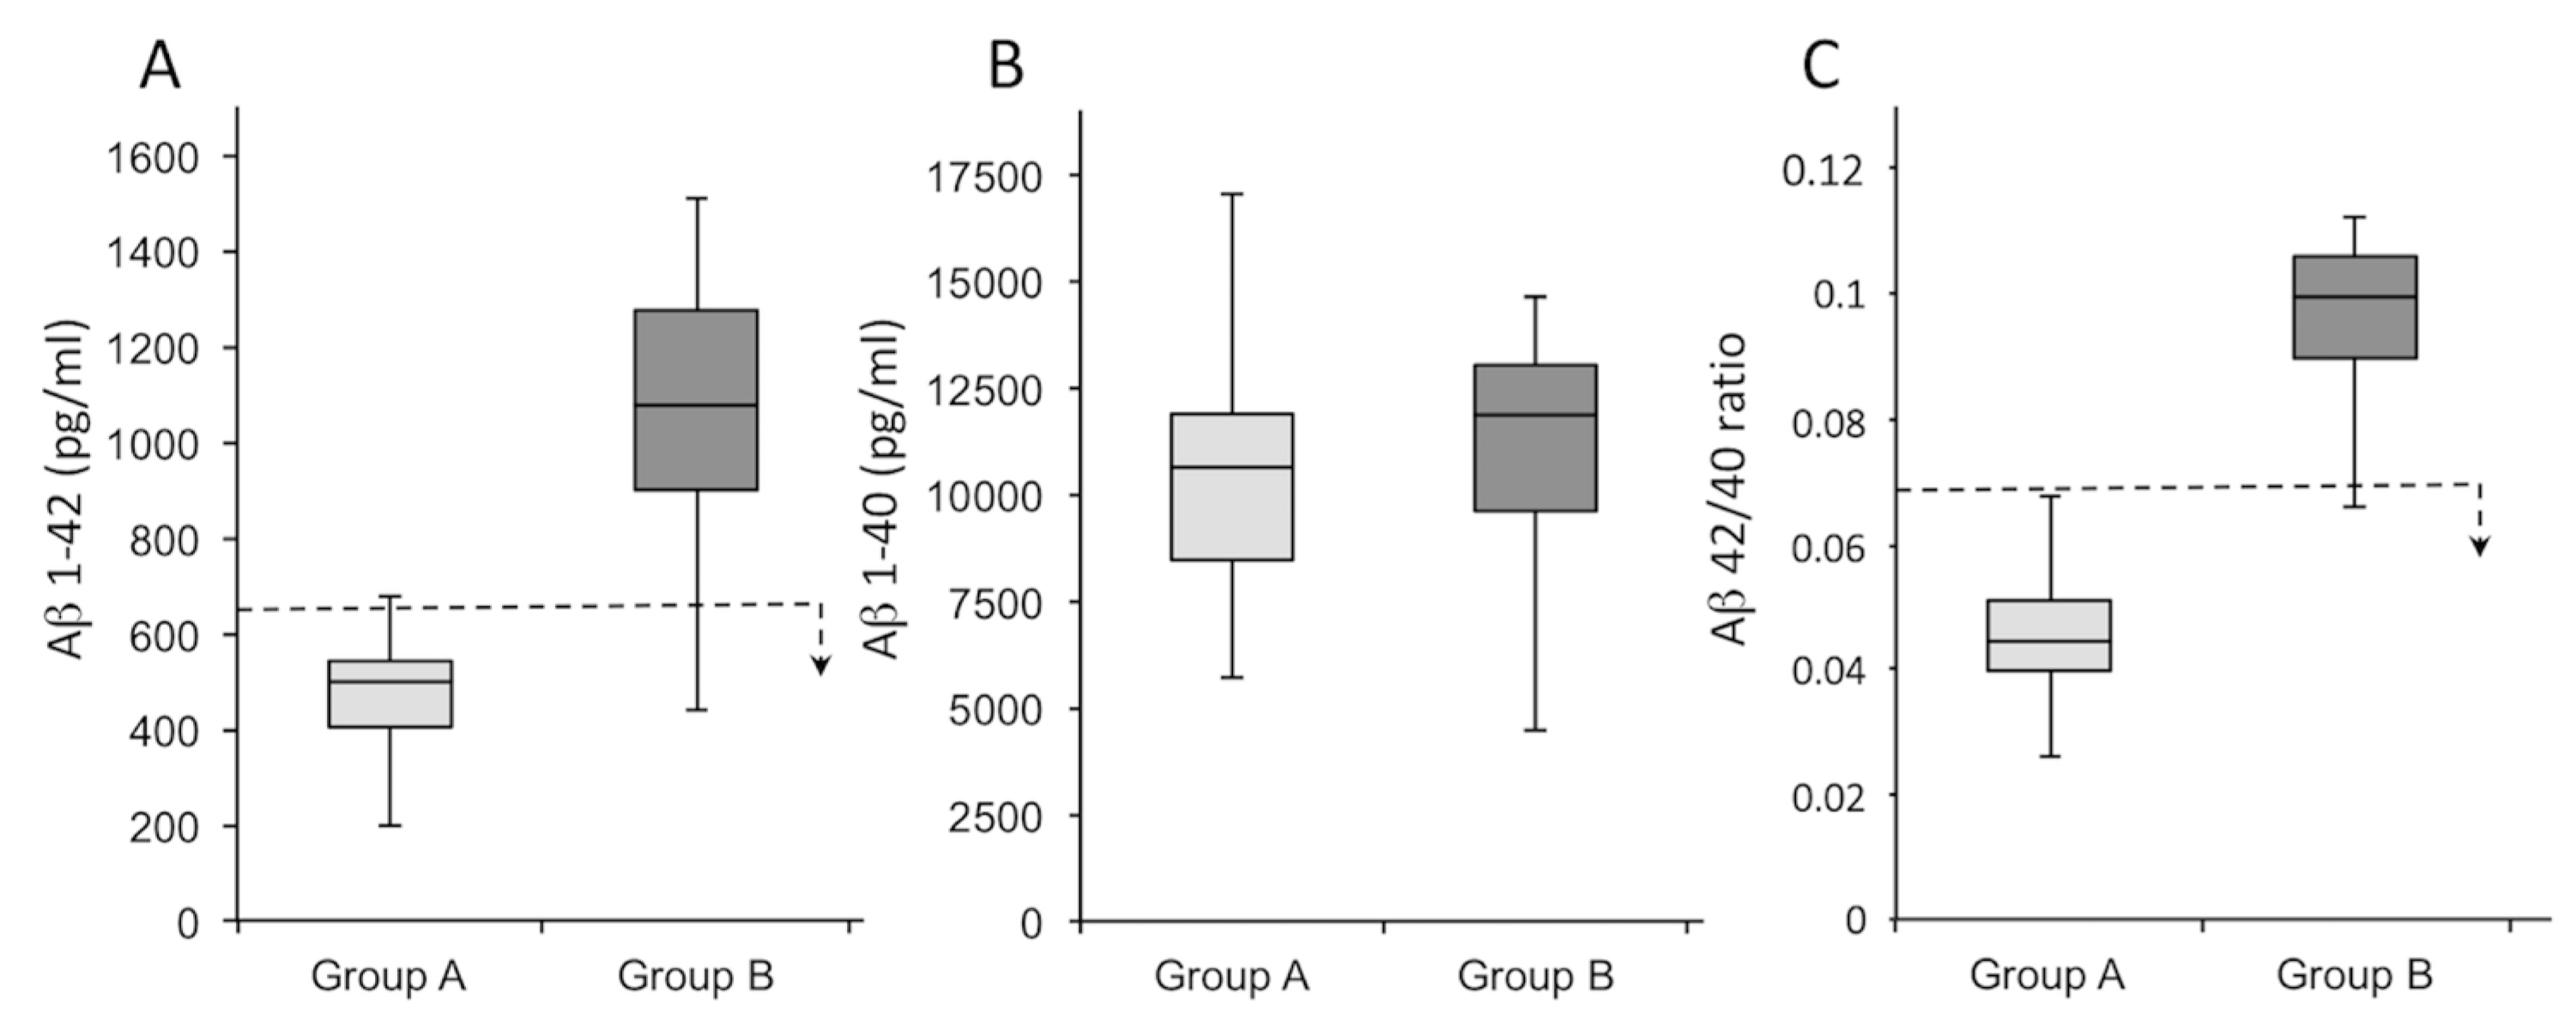
| Aβ 1–42 (pg/mL) | 707 (190–1512) | 479 (190–676) | 1063 (440–1512) | 0.78 |
| Aβ 1–40 (pg/mL) | 10,877 (4407–19,441) | 11,840 (7184–19,441) | 11,086 (4407–14,490) | 0.05 |
| Aβ 42/40 ratio | 0.07 (0.03–0.011) | 0.04 (0.03–0.06) | 0.10 (0.07–0.11) | 0.03 |
| Variable | Patients Tot (n = 46) | Group A (n = 28) | Group B (n = 18) | σ2 * |
|---|---|---|---|---|
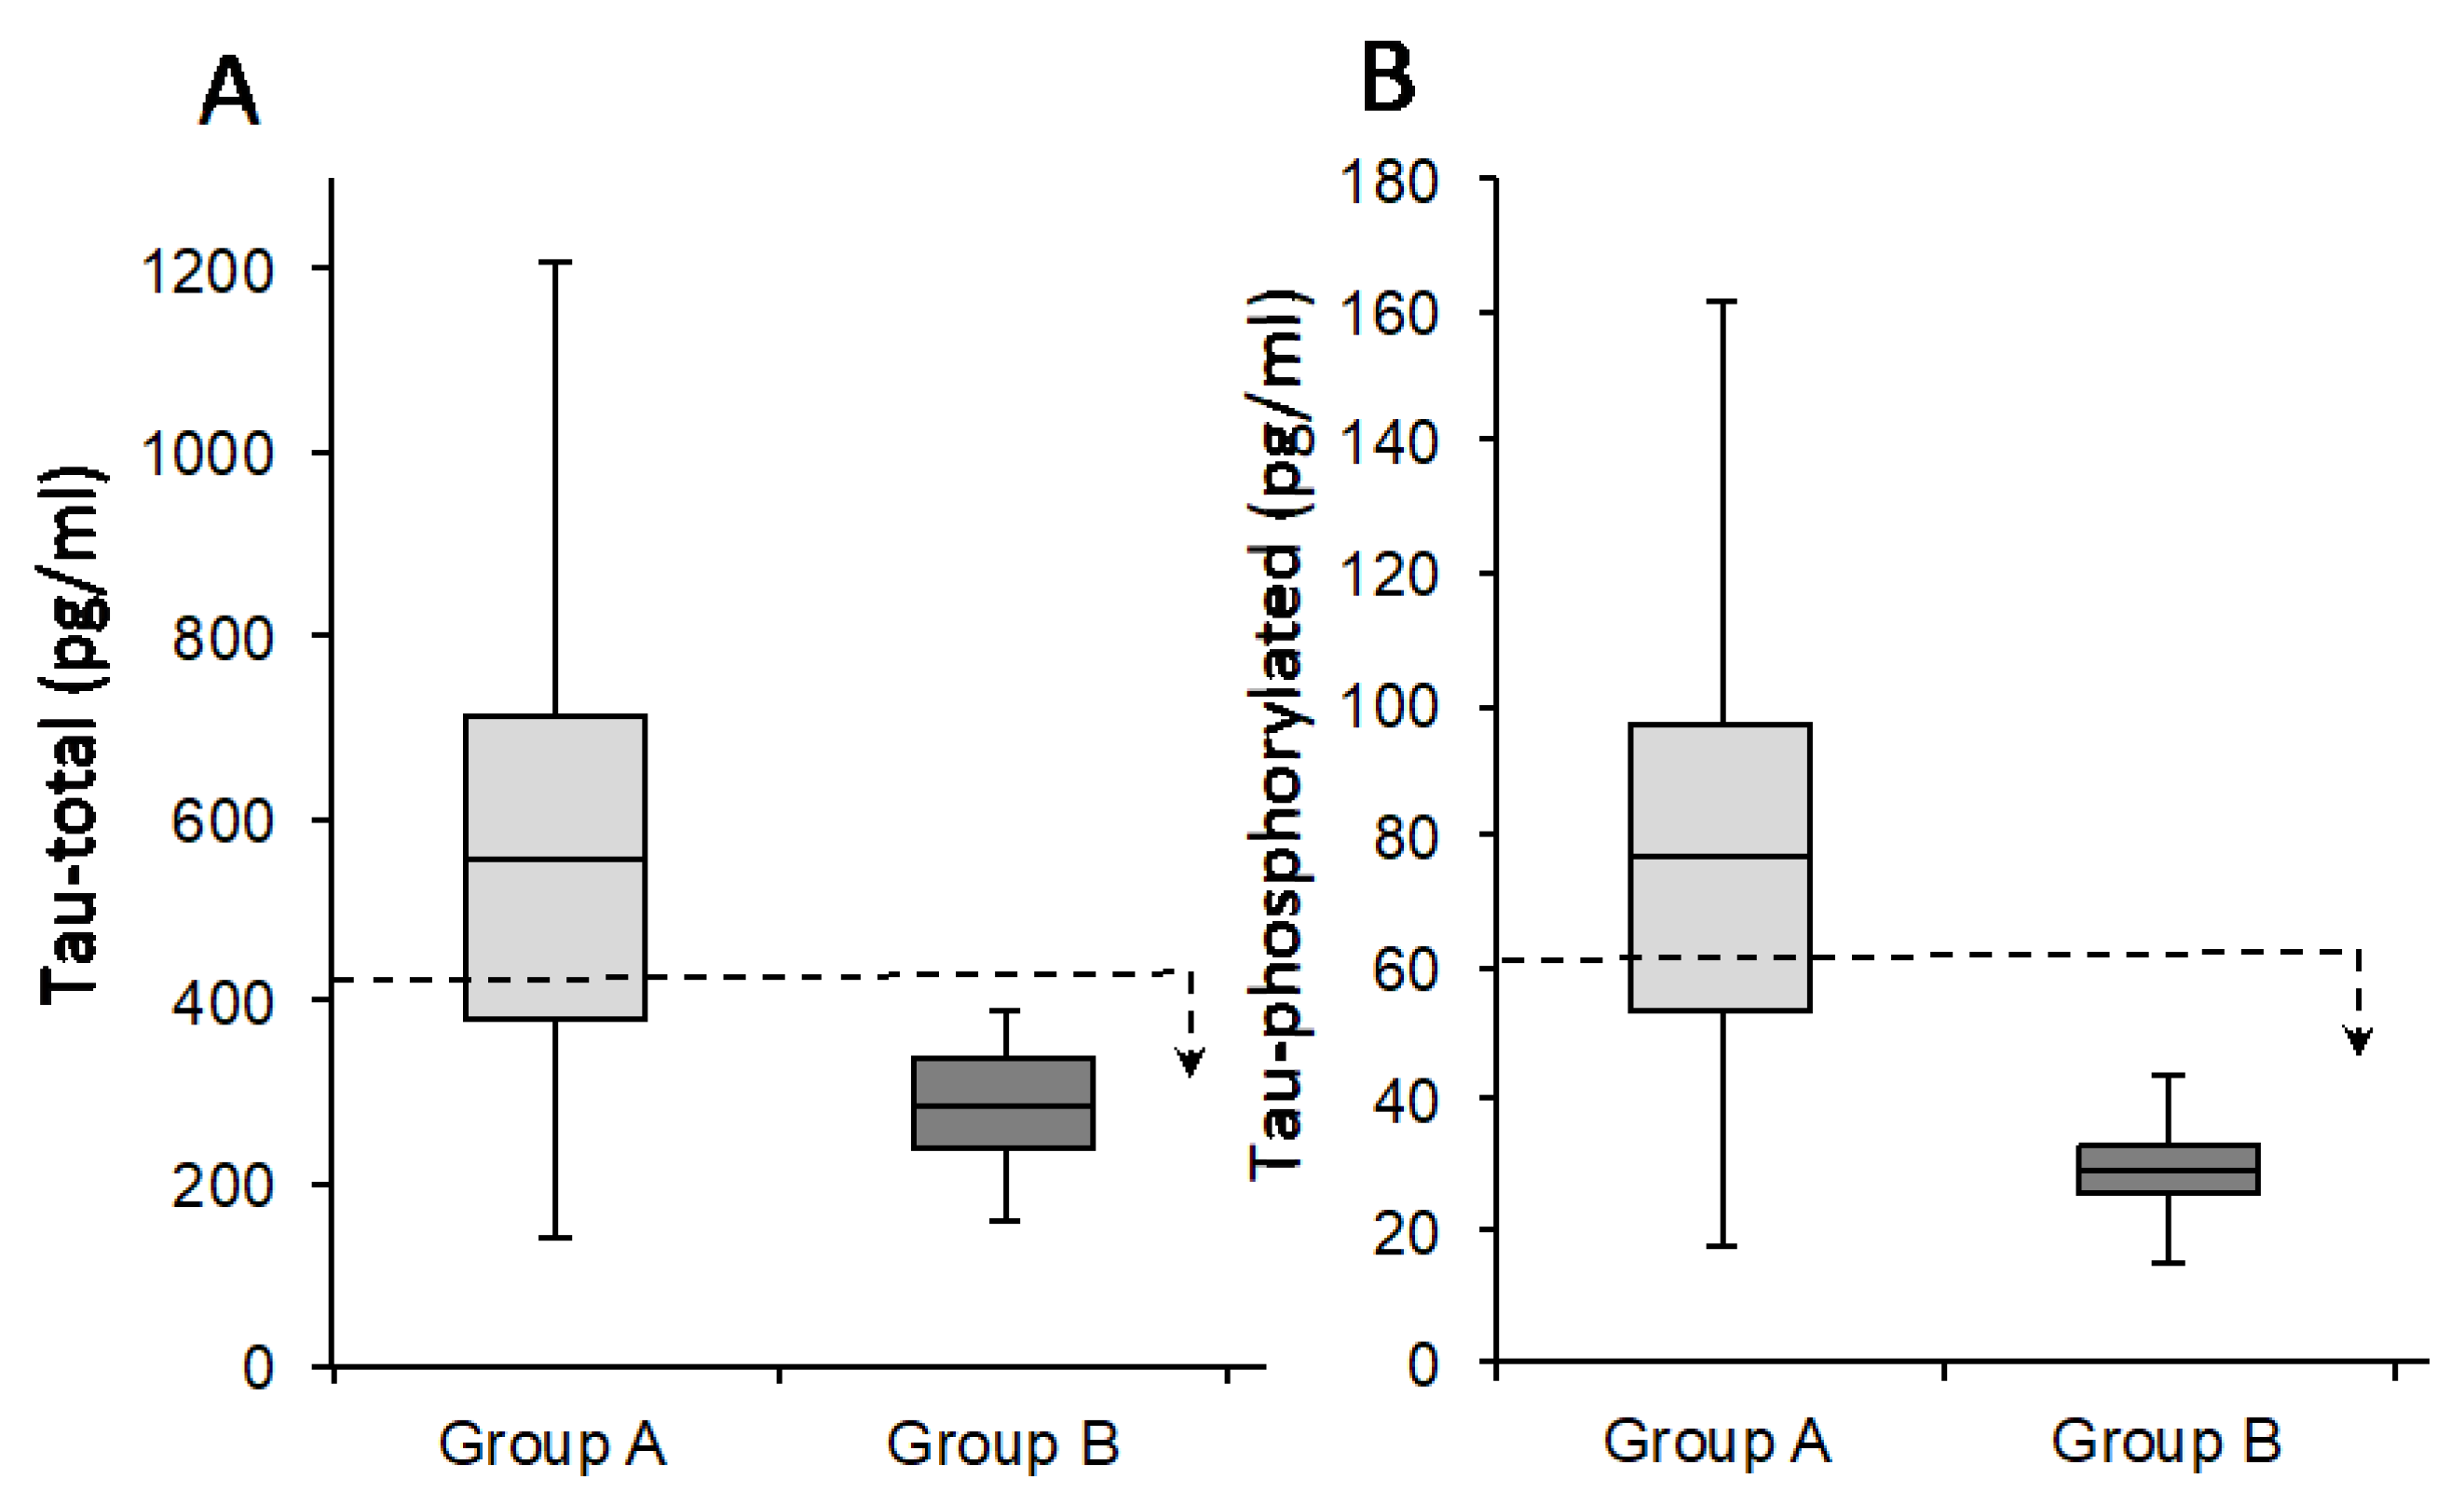
| Tau-total | 470 (140–1561) | 770 (477–1561) | 278 (173–390) | 0.45 |
| Tau-phossphorilated (181) | 63 (11–232) | 111 (64–232) | 29 (11–43) | 0.71 |
| Variable | Patients Tot (n = 46) | Group A’ (n = 16) | Group A” (n = 12) | Group B (n = 18) | σ2 * |
|---|---|---|---|---|---|
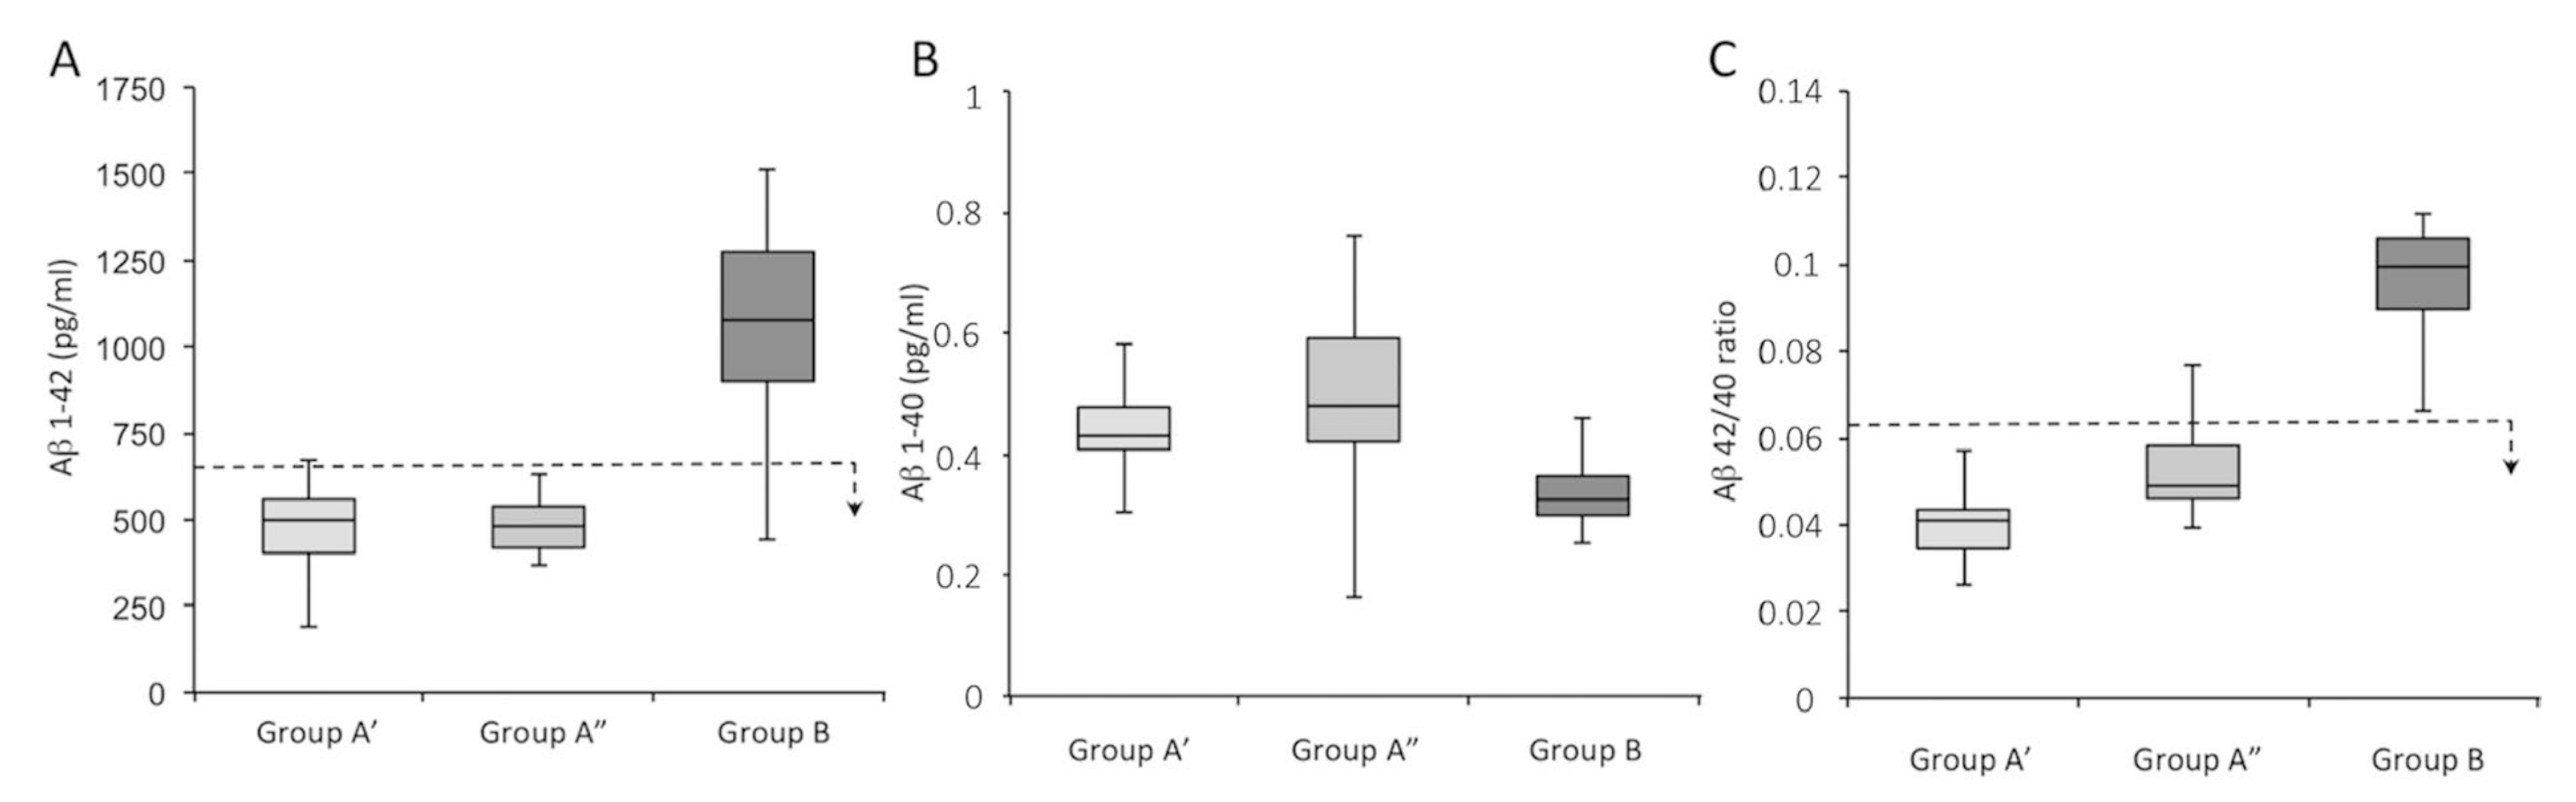
| Aβ 1–42 (pg/mL) | 707 (190–1512) | 479 (190–676) | 480 (378–630) | 1063 (440–1512) | 0.56 |
| Aβ 1–40 (pg/mL) | 10,877 (4407–19,441) | 11,840 (7184–19,441) | 9279 (5698–11,716) | 11,086 (4407–14,490) | 0.29 |
| Aβ 42/40 ratio | 0.07 (0.03–0.011) | 0.04 (0.03–0.06) | 0.05 (0.04–0.09) | 0.10 (0.07–0.11) | 0.52 |
| Variable | Patients Tot (n = 46) | Group A’ (n = 16) | Group A” (n = 12) | Group B (n = 18) | σ2 * |
|---|---|---|---|---|---|
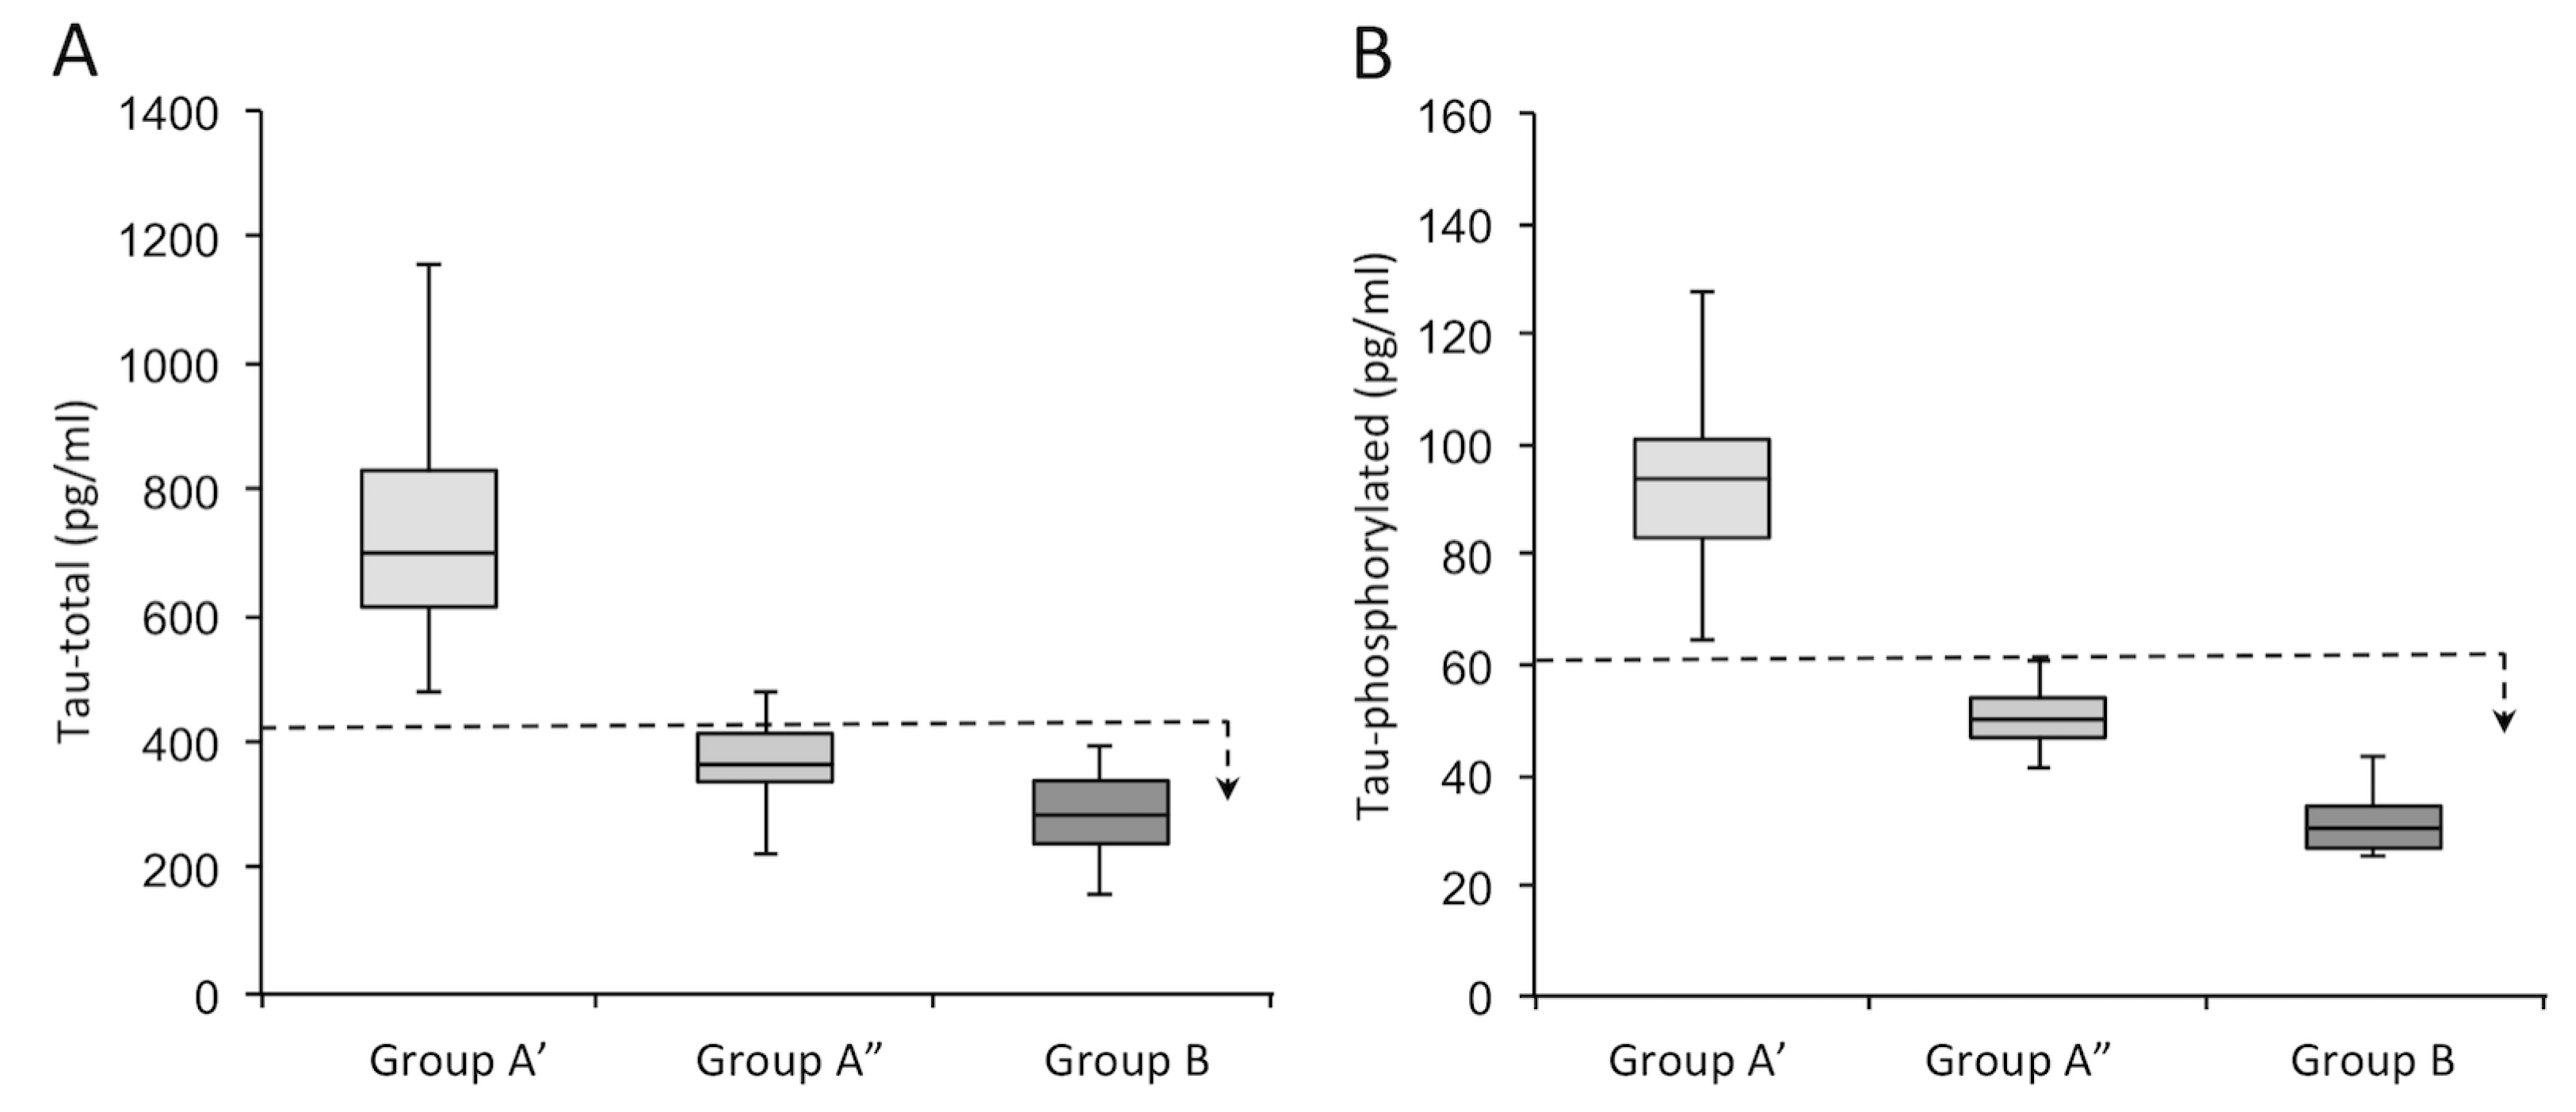
| Tau-total | 470 (140–1561) | 770 (477–1561) | 359 (140–473) | 278 (173–390) | 0.67 |
| Tau-phosphorilated (181) | 63 (11–232) | 111 (64–232) | 50 (18–63) | 29 (11–43) | 0.60 |
| Variable | Patients Tot (n = 46) | Group A’ (n = 16) | Group A” (n = 12) | Group B (n = 18) | σ2 * |
|---|---|---|---|---|---|
| CX3CL1 | 0.43 (0.25–0.76) ± 0.15 | 0.47 (0.28–0.75) ± 0.03 | 0.50 (0.13–0.76) ± 0.03 | 0.35 (0.25–0.74) ± 0.04 | 0.46 |
| Variable | Patients Tot (n = 46) | Group A (n = 28) | Group B (n = 18) | σ2 * |
|---|---|---|---|---|
| CX3CL1 | 0.43 (0.25–0.76) ± 0.15 | 0.47 (0.28–0.75) ± 0.03 | 0.35 (0.25–0.74) ± 0.04 | 0.01 |
| Group A | Group A’ | Group A” | Group B | ||
|---|---|---|---|---|---|
| Aβ 1–42 | Median value | 508.50 | 573.98 | 477.33 | 1064.5 |
| Median value GroupB/Median group value | 2.09 | 1.87 | 2.23 | ||
| p-value | 4.09 × 10⁻⁹ | 3.0 × 10⁻⁵ | 2.24 × 10⁻⁴ | ||
| *H0 | RH0 | RH0 | RH0 | ||
| Aβ 1 = −40 | Median value | 13,539 | 14,319 | 9611.8 | 11,669 |
| Median value GroupB/Median group value | 0.86 | 0.81 | 1.21 | ||
| p-value | 5.26 × 10⁻² | 4.60 × 10⁻¹ | 2.23 × 10⁻¹ | ||
| *H0 | NRH0 | NRH0 | NRH0 | ||
| Aβ 42/40 ratio | Median value | 0.0364 | 0.0408 | 0.0532 | 0.0909 |
| Median value GroupB/Median group value | 2.49 | 2.23 | 1.71 | ||
| p-value | 4.88 × 10⁻² | 1.84 × 10⁻² | 2.39 × 10⁻² | ||
| *H0 | RH0 | RH0 | RH0 | ||
| Tau-total | Median value | 893.48 | 752.2 | 313.59 | 312.66 |
| Median value GroupB/Median group value | 0.35 | 0.42 | 0.99 | ||
| p-value | 1.05 × 10⁻⁵ | 1.24 × 10⁻⁹ | 5.6 × 10⁻³ | ||
| *H0 | RH0 | RH0 | RH0 | ||
| Tau- phosphorilated | Median value | 125.64 | 94.373 | 48.674 | 32.879 |
| Median value GroupB/Median group value | 0.26 | 0.34 | 0.67 | ||
| p-value | 2.23 × 10⁻⁶ | 2.26 × 10⁻⁹ | 2.19 × 10⁻⁶ | ||
| *H0 | RH0 | RH0 | RHO | ||
| CX3CL1 | Median value | 0.4789 | 0.5568 | 0.4326 | 0.3195 |
| Median value GroupB/Median group value | 0.67 | 0.57 | 0.74 | ||
| p-value | 1.05 × 10⁻² | 3.75 × 10⁻² | 6.75 × 10⁻¹ | ||
| *H0 | RH0 | RH0 | NRH0 |
Publisher’s Note: MDPI stays neutral with regard to jurisdictional claims in published maps and institutional affiliations. |
© 2022 by the authors. Licensee MDPI, Basel, Switzerland. This article is an open access article distributed under the terms and conditions of the Creative Commons Attribution (CC BY) license (https://creativecommons.org/licenses/by/4.0/).
Share and Cite
Bivona, G.; Iemmolo, M.; Piccoli, T.; Agnello, L.; Lo Sasso, B.; Ciaccio, M.; Ghersi, G. High Cerebrospinal Fluid CX3CL1 Levels in Alzheimer’s Disease Patients but Not in Non-Alzheimer’s Disease Dementia. J. Clin. Med. 2022, 11, 5498. https://doi.org/10.3390/jcm11195498
Bivona G, Iemmolo M, Piccoli T, Agnello L, Lo Sasso B, Ciaccio M, Ghersi G. High Cerebrospinal Fluid CX3CL1 Levels in Alzheimer’s Disease Patients but Not in Non-Alzheimer’s Disease Dementia. Journal of Clinical Medicine. 2022; 11(19):5498. https://doi.org/10.3390/jcm11195498
Chicago/Turabian StyleBivona, Giulia, Matilda Iemmolo, Tommaso Piccoli, Luisa Agnello, Bruna Lo Sasso, Marcello Ciaccio, and Giulio Ghersi. 2022. "High Cerebrospinal Fluid CX3CL1 Levels in Alzheimer’s Disease Patients but Not in Non-Alzheimer’s Disease Dementia" Journal of Clinical Medicine 11, no. 19: 5498. https://doi.org/10.3390/jcm11195498
APA StyleBivona, G., Iemmolo, M., Piccoli, T., Agnello, L., Lo Sasso, B., Ciaccio, M., & Ghersi, G. (2022). High Cerebrospinal Fluid CX3CL1 Levels in Alzheimer’s Disease Patients but Not in Non-Alzheimer’s Disease Dementia. Journal of Clinical Medicine, 11(19), 5498. https://doi.org/10.3390/jcm11195498