Article

The Value of Hemoglobin Glycation Index–Diabetes Mellitus System in Evaluating and Predicting Incident Stroke in the Chinese Population

Department of Cardiology, The First Hospital of China Medical University, 155 Nanjing North Street, Heping District, Shenyang 110001, China
*
Author to whom correspondence should be addressed.
J. Clin. Med. 2022, 11(19), 5814; https://doi.org/10.3390/jcm11195814
Submission received: 19 August 2022 / Revised: 21 September 2022 / Accepted: 27 September 2022 / Published: 30 September 2022
(This article belongs to the Special Issue Clinical Research and Management of Diabetes Complications)

Abstract

:
We aimed to clarify the effect of the hemoglobin glycation index (HGI)–diabetes mellitus (DM) system in evaluating the risk of incident stroke. We followed up on 2934 subjects in rural regions of Northeast China, established Cox proportional hazards models to evaluate the effects of the HGI–DM system in describing stroke risk, and further conducted a discrimination analysis to confirm the improvement in HGI based on the traditional stroke risk model. After a median of 4.23 years of follow-up, 79 subjects developed stroke or related death. DM-high HGI condition significantly elevated the risk of incident stroke (hazard ratio (HR): 2.655, 95% confidence interval (CI): 1.251–5.636). In addition, higher HGI levels elevated the risk of stroke, even if the patients did not have DM (HR: 1.701, 95% CI: 1.136–2.792), but DM failed to bring an extra risk of incident stroke to patients with lower HGI levels (HR: 1.138, 95% CI: 0.337–3.847). The discrimination analysis indicated that the integrated discrimination index (IDI) of the HGI model was 0.012 (95% CI: 0.007–0.015) and that the net reclassification index (NRI) was 0.036 (95% CI: 0.0198–0.0522). These results indicated HGI was associated with the onset of stroke, and high HGI indicated an aggravated trend in glycemic status and increased risk of incident stroke. The HGI–DM system enabled us to identify the different glucose statuses of patients, to conduct suitable treatment strategies, as well as to improve the predictability of incident stroke based on the traditional model.

1. Introduction

Stroke is an acute cerebrovascular disease that is characterized by high morbidity, mortality, and disability [1,2,3,4]. In recent decades, the incidence of stroke has increased by 70.0%, stroke-related deaths have increased by 43.0% worldwide, and more than 6 million patients die from stroke each year [5]. Recently, stroke has become the leading cause of death and disability and was recognized as the disease with the highest disability-adjusted life-years lost in China [6], especially in Northeast China’s rural regions, where stroke is the leading disease burden [2,7,8]. Furthermore, with the gradual increase in the prevalence and decreased onset age of stroke, risk factors have become more multifaceted and complicated, and the traditional risk model is no longer suitable for evaluating the risk of stroke [9]. Thus, it is necessary to conduct a novel systematic stratification and comprehensive risk assessment to identify the potential populations with a high risk of stroke so that we can provide different and individualized preventive measures for different risk subgroups and thus reduce the disease burden.
Diabetes mellitus (DM) is recognized as a classical risk factor for stroke. Some studies have observed that patients with DM have a 2–4 times higher stroke risk than non-DM patients [10,11], and even impaired serum glucose status can increase the risk of stroke [12]. However, the current diagnostic criteria of DM are mainly based on fasting blood glucose (FPG) levels, but the use of DM alone as a method of serum glucose status evaluation has some limitations [13,14], as it can only reflect the serum glucose status of individuals in the short term and has a poor ability to predict long-term adverse outcomes [15]. Glycated hemoglobin (HbA1c) is a product of hemoglobin glycosylation that can reflect long-term serum glucose alterations in patients, has recently received increased attention, and has already been used in guidelines for serum glucose management [16]. However, HbA1c also has some limitations, such as individual differences, in which HbA1c can be easily affected by other diseases and physical status alterations [17,18]. Hence, HbA1c is not effective for evaluating serum glucose independently.
On this basis, the concept of HGI was proposed, which described the gap between the predicted HbA1c and actual measured HbA1c [19], and this parameter can effectively reduce the individual differences in HbA1c and indirectly reflect the trend of glycosylation when evaluating the glycemic status of patients [20]. Several studies have found a potential relationship between HGI levels and incident risk or prognosis of stroke in diabetic patients [21,22], suggesting that HGI might be able to optimize serum glucose evaluation for populations with high stroke risk. DM represents the patient’s glycemic status, while HGI represents the patient’s glycosylation tendency, which can further evaluate the patient’s prognosis and predict disease progression based on the present glycemic status, so we hypothesized that the DM-HGI system could also play a positive role in the disease risk evaluation process. However, no study has yet combined the DM and HGI together to evaluate patients’ glycemic status and the process or prognosis of other chronic diseases.
The present study was based on a prospective cohort of a rural population in Northeast China and combined HGI and DM for the first time to evaluate the effect of the HGI–DM system in predicting and identifying potential patients with a high risk of incident stroke and provided evidence for the theory that patients with different glycemic statuses should receive different interventions and prevention strategies. The results of the present study might provide support for the comprehensive evaluation of serum glycemic status in combination with HGI levels as a novel and effective method to identify and classify the population with stroke risk at an early stage. This can enable practitioners to carry out suitable and timely management and prevention strategies for different populations according to their different risk characteristics.

2. Methods

2.1. Study Population

The present study is based on The Northeast China Rural Cardiovascular Health Study (NCRCHS) to further reveal the correlation between HGI and incident stroke. We conducted the baseline study from July 2012 to August 2013, and we conducted the follow-up study on these participants in 2017; the protocol details were described in previous research [23,24], and they are summarized in Figure 1. Additionally, the inclusion and exclusion criteria were as follows: inclusion criteria: (i) aged ≥ 35 years; (ii) permanent residents of the regions; (iii) can sign an informed consent form on their own. Exclusion criteria: (i) pregnancy; (ii) cancer; (iii) mental disorders; (iv) expected survival time of less than 5 years. At baseline, we recruited a total of 11,956 natural residents (age ≥ 35 years) from rural regions in three counties in Northeast China. In 2017, we invited all these participants to attend the follow-up study, and 10,700 participants consented and were qualified for our follow-up study. In the present study, we excluded 6858 participants who lacked related information or missed the follow-up and further excluded 908 participants who were suffering or had suffered from a stroke at baseline; eventually, we obtained a target population of 2934 for the present study.

2.2. Ethics Approval and Informed Consent

The Ethics Committee of China Medical University approved our project and the following research based on the present project in 2012 (Shenyang, China, ethical approval project identification code: AF-SOP-07-1, 0-01), and all procedures met Declaration of Helsinki Standards. Furthermore, every participant received and signed a paper version informed consent after clarifying relevant information in terms of the study objectives, benefits, medical procedures, confidentiality, agreement on personal information, and agreement on the publication of the present study and subsequent research.

2.3. Data Collection and Lifestyle Risk Factors

The data collection for this study was based on outpatient face-to-face interviews and paper version standard questionnaires conducted by a team of cardiologists. The study population received and signed a paper version informed consent form after clarifying relevant information and the study objectives, benefits, medical procedures, and confidentiality agreement on personal information. Information such as age and gender were obtained from a standard questionnaire in a face-to-face interview. All participants were asked whether they had a history of cardiovascular diseases (CVD) and were currently smoking or drinking.

2.4. Anthropometrics, Biochemical Parameters, and Blood Pressure Measurements

All participants were told to fast for at least 12 h in advance and collected blood samples the next morning. The blood samples were added to vacutainer tubes containing anticoagulants and obtained plasma by centrifuging. FPG, triglyceride (TG), plasma total cholesterol (TC), low-density lipoprotein cholesterol (LDL-C), high-density lipoprotein cholesterol (HDL-C), and HbA1c were obtained by Enzymatic analysis on an Olympus AU640 automated analyzer (Olympus, Kobe, Japan). We calibrated all laboratory equipment and conducted repeat measurements on these samples three times using the blind method to obtain the average of the results for subsequent analysis. Measurements of height and weight required participants to wear light clothes, remove shoes, and maintain a standing position. The measurement results were accurate to 0.1 kg and 0.1 cm, respectively. The measurement of blood pressure was according to the American Heart Association protocol [25]. Subjects were asked to rest for at least 10 min in a quiet room in a seated position, then use an automated electronic sphygmomanometer (HEM-741C; Omron, Tokyo, Japan) to measure blood pressure on the bare upper arm three times with a 5 min interval between measurements. We took the average of three blood pressure measurements and used them for all subsequent analyses.

2.5. Definition

According to 7th Joint National Committee (JNC7), we defined hypertension as the following conditions: systolic blood pressure (SBP) ≥ 140 mmHg and (or) diastolic blood pressure (DBP) ≥ 90 mmHg, or reported use of a medication for hypertension [26]. Diabetes was defined as a fasting plasma glucose (FPG) ≥ 7.0 mmol/L or a previous diagnosis of diabetes [27]. The body mass index (BMI) was calculated according to the following formula: BMI = Weight(kg)/Height2(m2). The estimated glomerular filtration rate (eGFR) was calculated using the Chronic Kidney Disease Epidemiology Collaboration equation [28]. The linear relationship between HbA1c and FPG was estimated from the linear regression analysis of the study subjects’ data and the predicted HbA1c = 0.433 × FPG + 2.809. Additionally, HGI was calculated as the difference between the actual and theoretical level of HbA1c; the detailed formula was the following: HGI = measured HbA1c-predicted HbA1c [20,29]. In addition, we divided HGI into two levels, HGI < 0 and HGI ≥ 0.

2.6. Judgment and Definition of Clinical Outcomes

The median follow-up period was 4.23 years. In the present study, the outcome event was defined as a new onset of stroke during the follow-up period. For all participants reporting possible diagnoses, all available clinical-information-related materials were collected and independently adjudicated by the Endpoint Assessment Committee. The materials included medical records and imaging examinations. According to the WHO Multinational Monitoring of Trends and Determinants of Cardiovascular Disease (MONICA) criteria [30], stroke was defined as signs of rapidly developing focal or global disturbance of cerebral function that lasts for longer than 24 h (unless the patient undergoes surgery or dies). In addition, transient ischemic attacks and chronic cerebrovascular disease were excluded.

2.7. Statistical Analysis

Overall, the data were normally distributed; thus, the continuous variables were described in the format of the mean value (M) and standard deviation (SD), and categorical variables were described by frequency and percentage. As appropriate, differences between categories were evaluated using the one-way analysis of variance (ANOVA) test (for continuous variables) or the χ2 test (for categorical variables). Meanwhile, we established the Cox proportional hazards models to calculate hazard ratios (HRs) and 95% confidence intervals (CIs) to evaluate the relationship between the risk of incident stroke and different glucose statuses. We drew Kaplan–Meier curves to exhibit the tendency of cumulative hazard, which was stratified by the DM-HGI system, and conducted a log-rank test to compare the differences. We drew restricted cubic spline (RCS) curves and conducted a linear test to evaluate the correlation between the HGI level and the risk of incident stroke, further describing the effect of HGI in evaluating the risk of stroke according to the HR trends in the curve. To further evaluate the potential of HGI to improve the identification of incident stroke with traditional clinical risk factors, we calculated the integrated discrimination index (IDI) and net reclassification index (NRI). The Kaplan–Meier curves and relevant analysis were performed using “survminer packages” and “survival packages”, the RCS analysis was conducted using “rms packages”, and re-stratification analysis was performed using “survIDINRI packages” and “survival packages” of R software (version 4.0.5, http://www.R-project.org, accessed on 23 April 2022. The R Foundation). Statistical analyses were performed using SPSS software version 22.0 (IBM Corp., Armonk, NY, USA); p < 0.05 under the two-tailed condition was considered statistically significant.

2.8. Independent Data Access and Analysis

The corresponding author Xingang Zhang and co-author Yingxian Sun have full access to all the data in the study and take responsibility for their integrity and the data analysis. All co-authors read and approved the final manuscript. Moreover, all co-authors and participants gave their consent for publication of this article.

2.9. Materials and Data Availability

We can provide the raw data of the present study after evaluation and permission from the subject principals. For matters on the availability of raw data, please contact Professor Xingang Zhang ([email protected]) and Professor Yingxian Sun ([email protected]).

3. Results

3.1. Baseline Characteristics of the Study

Table 1 summarizes the characteristics of participants at baseline. The current analysis enrolled 2934 participants with a mean age of 55.5 ± 10.0 years, and 45.6% of participants were male. DM was present in 10.7%, and around 58.3% (n = 183) also had high HGI levels. In total, DM patients had higher BMI, blood pressure, FPG and HbA1c, TC, TG, and LDL; had lower eGFR and HDL; and were more likely to suffer from CVD or hypertension. However, we noticed that the population characteristics of the low-HGI group were close to those of the high-HGI population. Based on these significant differences, we recognized these risk factors as independent variables to build the multivariate Cox proportional hazards model to further clarify or eliminate the impact of these factors on the association between HGI and incident stroke.

3.2. The Incidence and Cumulative Hazard of Onset Stroke Based on the HGI–DM System

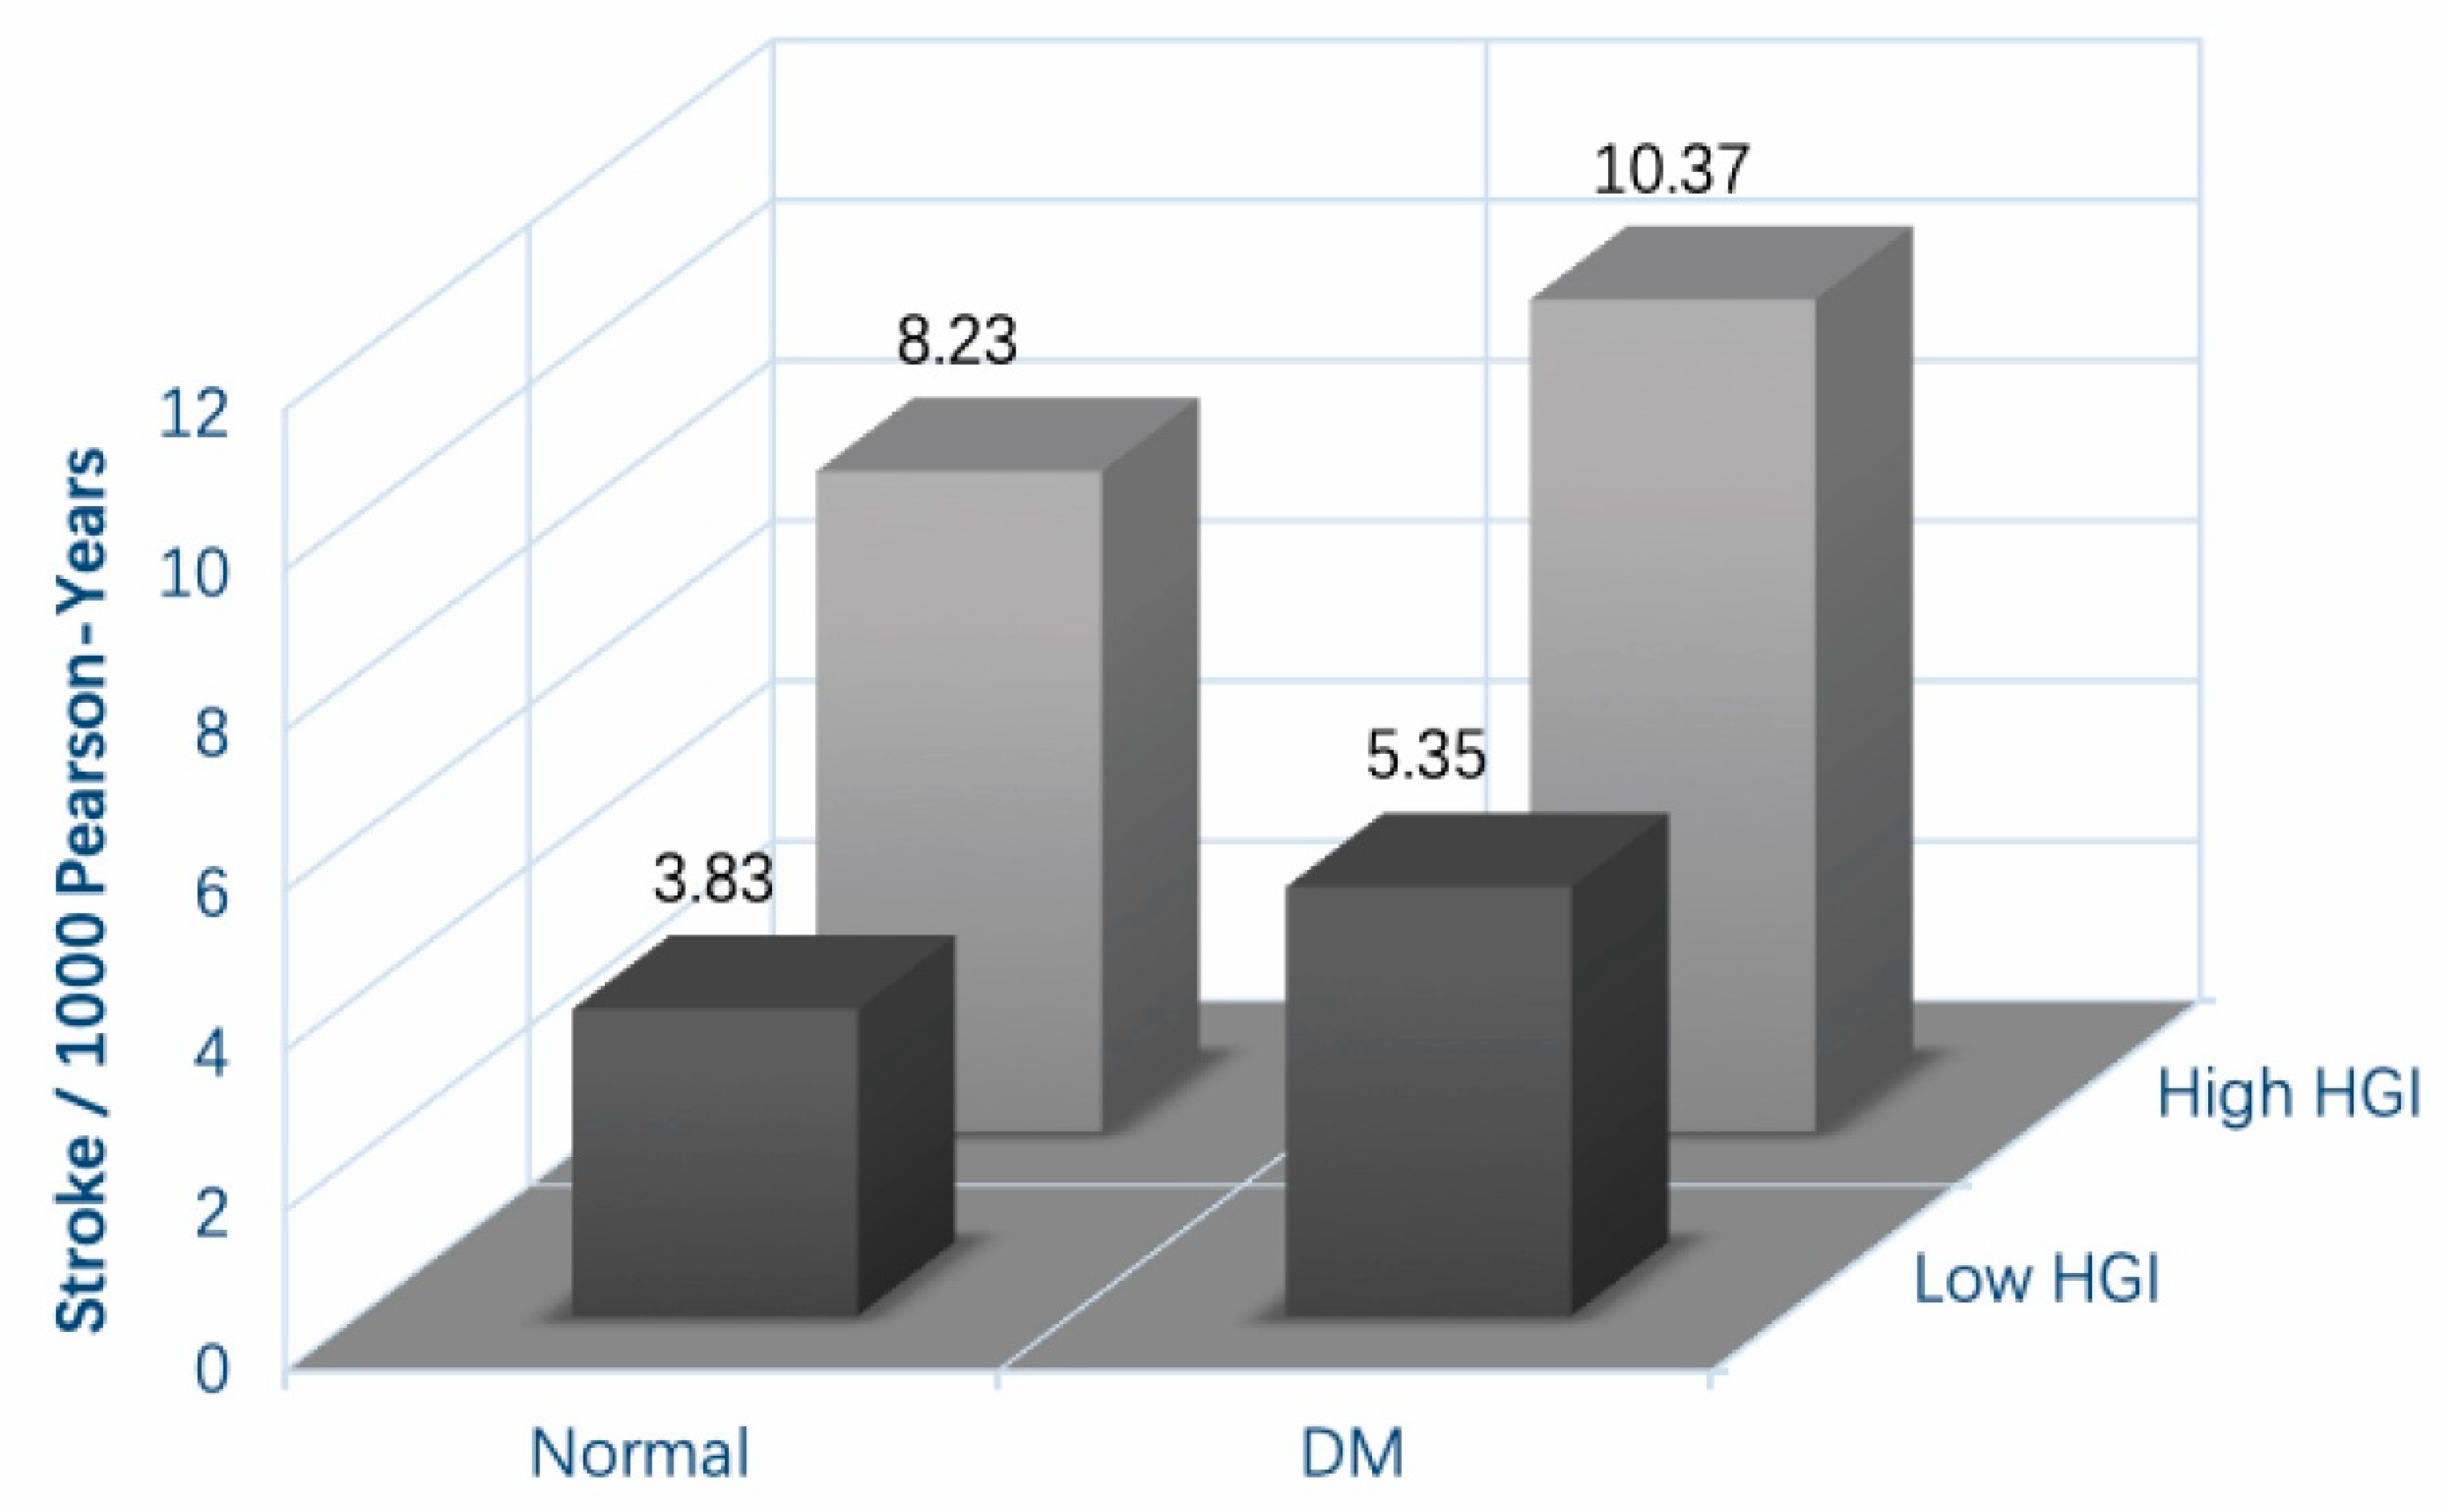
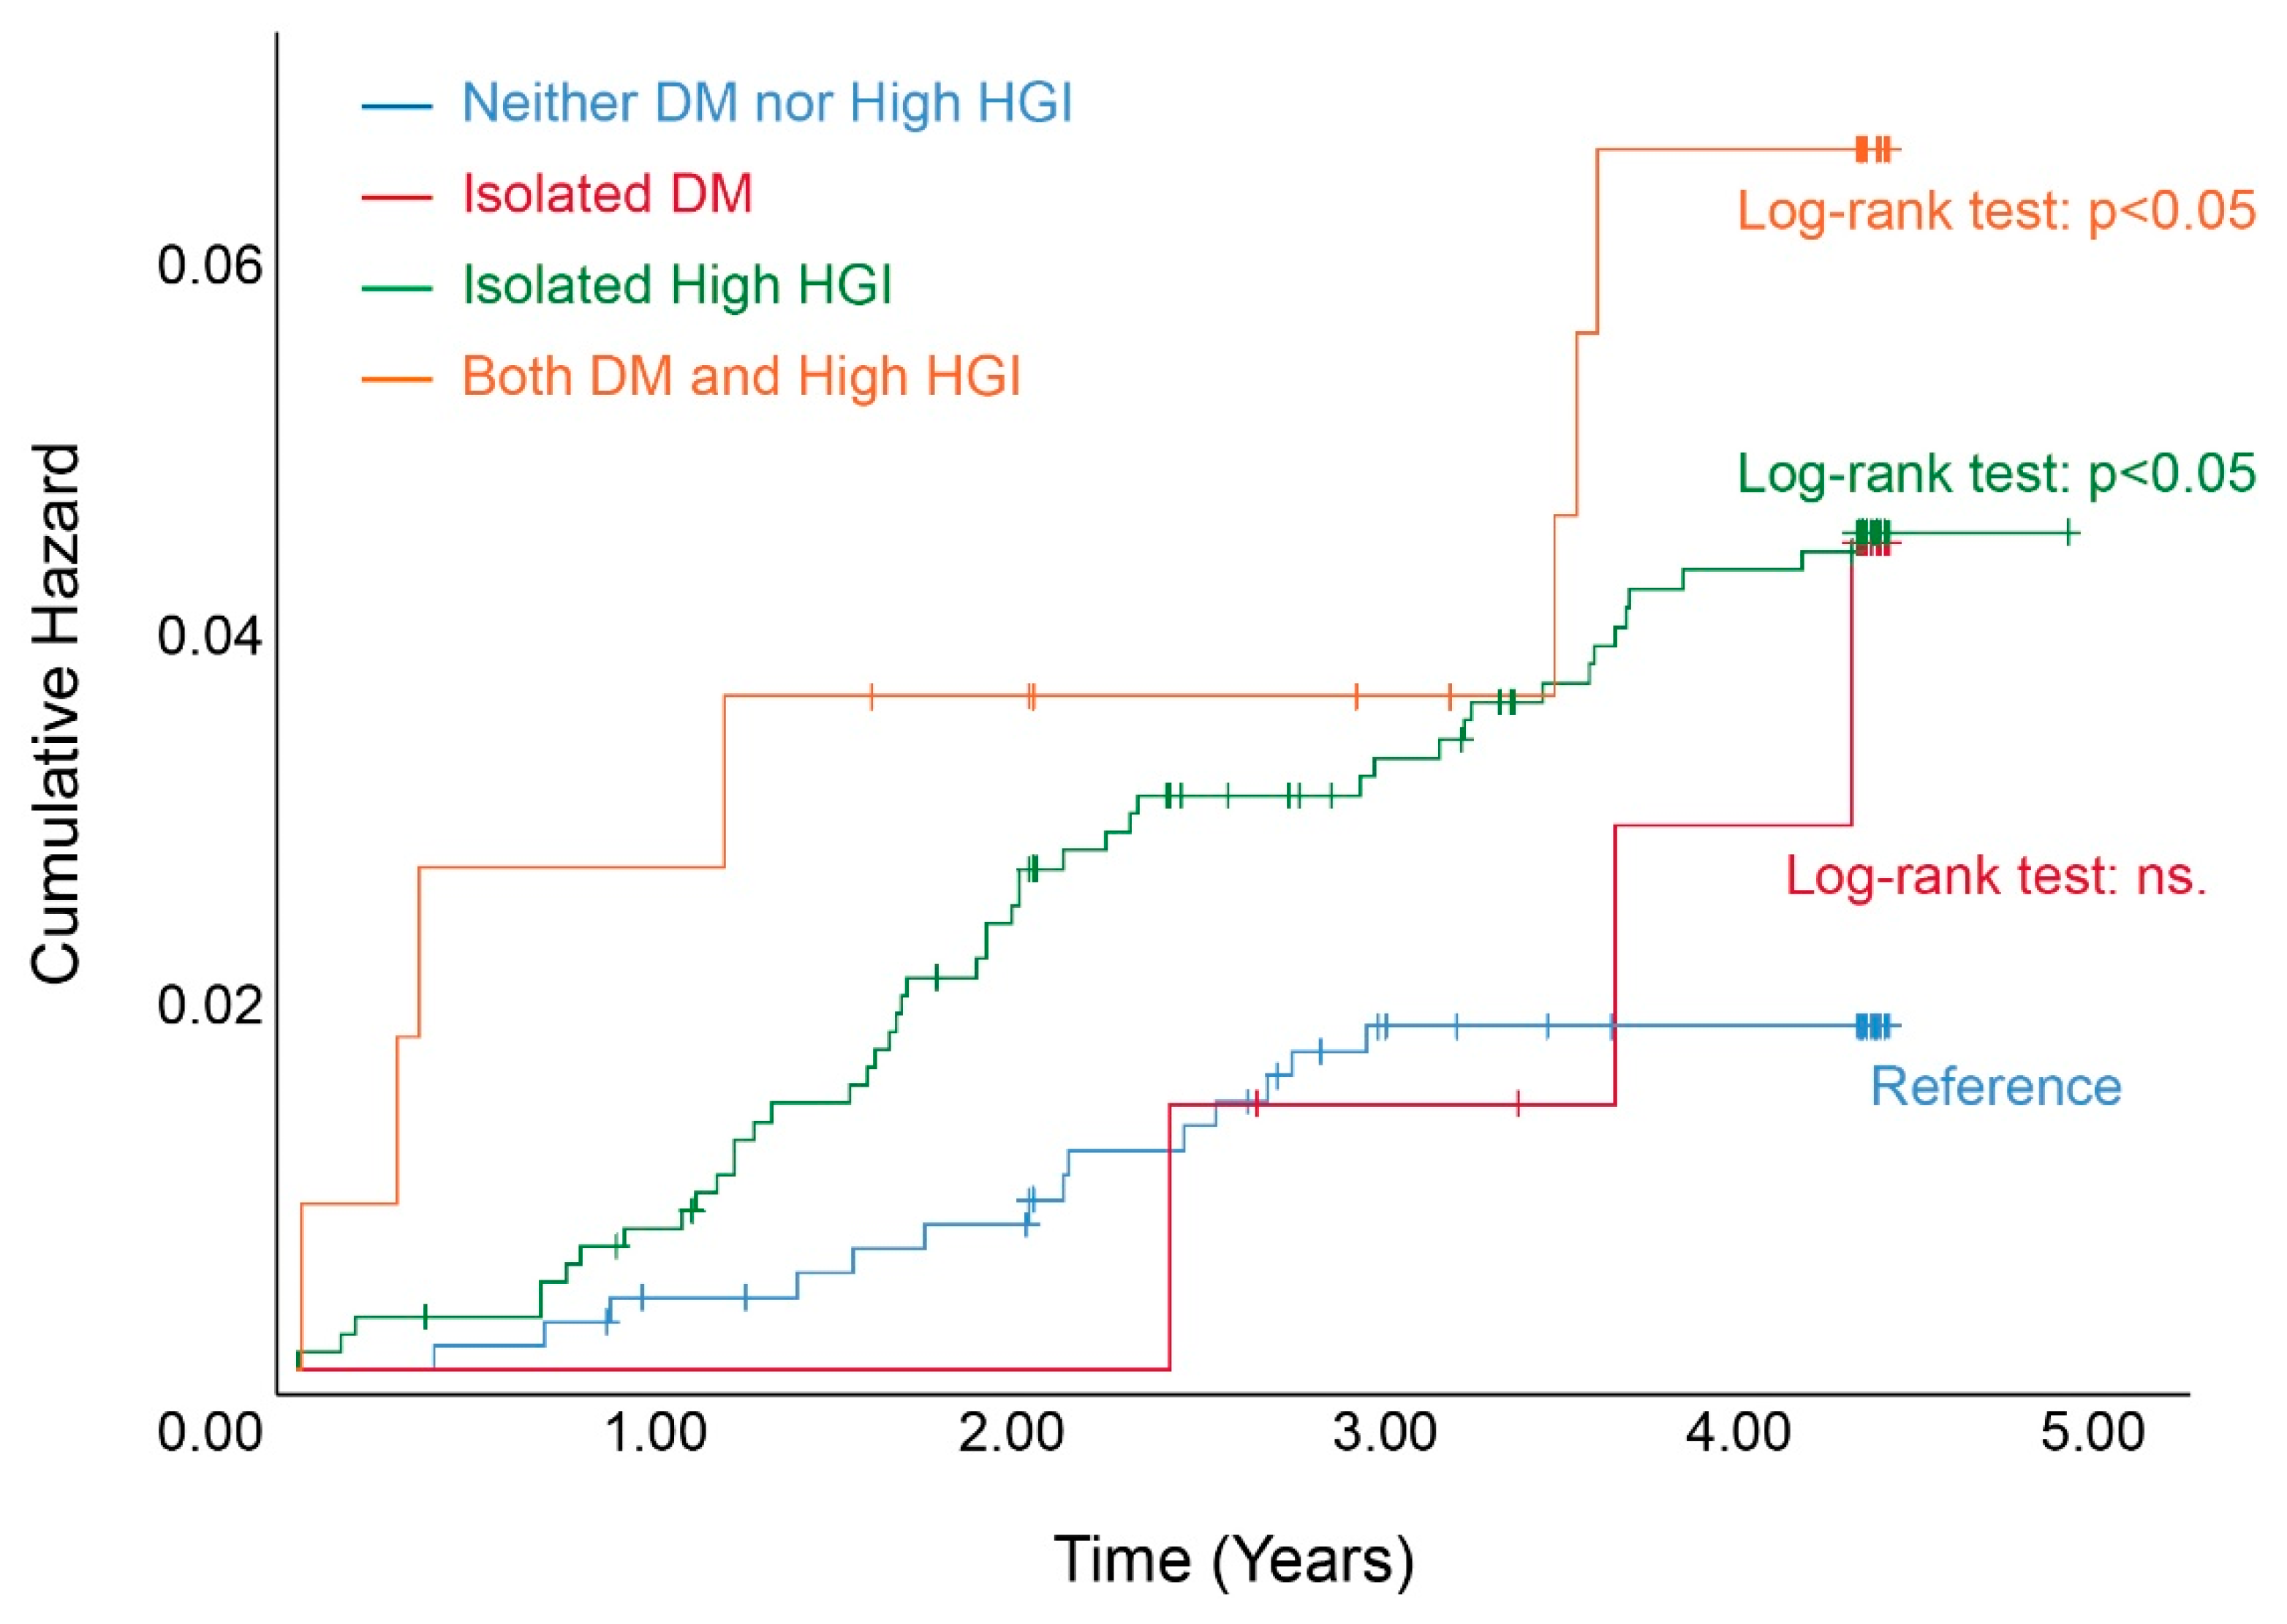
In the 4.23 years of the follow-up period, 79 participants (2.7%) developed stroke events (crude incidence rate: 6.30 incident stroke events per 1000 person-years, the median time of incident stroke: 1.92 years, 5–95% duration of incident stroke: 0.16–4.19 years). In detail, among those 79 participants, 21 subjects were in non-DM and low-HGI subgroups (21/1276), 3 subjects were in isolated DM subgroups (3/131), 47 were in isolated high-HGI subgroups (47/1344), and 8 subjects were in both DM and high-HGI subgroups (8/183). As shown in Figure 2, the highest incidence of stroke took place in the population with both DM and high HGI, with 10.37 incident strokes per 1000 person-years. Additionally, the population without either DM or high HGI had the lowest crude incidence (crude incident rate: 3.83 incident strokes per 1000 person-years). In addition, the crude incidence of stroke among the isolated high-HGI participants was slightly higher than the isolated DM participants (8.23 incident strokes and 5.35 incident strokes per 1000 person-years, respectively). In addition, we also drew Kaplan–Meier curves to exhibit the tendency of cumulative hazard and further compared different DM-HGI statuses using the log-rank test (Figure 3). We noticed that compared with the subjects who had neither DM nor high HGI, isolated DM patients did not present a higher stroke risk. However, two high-HGI subgroups both had a higher cumulative hazard of stroke than the reference group. Specifically, the isolated high-HGI subgroup still presented an elevated risk of stroke, although they did not suffer from DM. Additionally, patients with both DM and high HGI had the highest hazard of incident stroke.

3.3. High HGI Can Elevate the Risk of Incident Stroke and Promote Adverse Outcomes

Table 2 summarizes the association between the risk of incident stroke events and HGI levels, which was analyzed by Cox proportional hazard models. The risk-factor variables of the Cox proportional hazards model include age, gender, current smoking and drinking, hypertension, eGFR, TC, TG, HDL-C, LDL-C, and HGI or DM-HGI status. Every SD increment of HGI could bring an additional 27.9% risk of incident stroke (HR: 1.279, 95% CI: 1.063–1.539, p < 0.05). Meanwhile, the high-HGI group had a 1.78-fold greater risk of incident stroke than low-HGI group participants (HR: 1.780, 95% CI: 1.120–2.830, p < 0.05).
After further combining DM status and HGI levels, the participants were divided into four subgroups as follows: non-DM and low-HGI population (reference group), DM patients with low HGI, high HGI without DM, and concomitant DM and high HGI. As shown in Table 3 (also adjusted by the risk-factor variables mentioned before), among the low-HGI population, DM did not bring a significantly increased risk of incident stroke than the normal population. However, isolated high HGI levels increased the risk of incident stroke events by 70.1% compared to the participants in non-DM and low-HGI groups (HR: 1.701, 95% CI: 1.136–2.792, p < 0.05). Concomitant DM and high HGI increased the risk of incident stroke the most, with a 1.655-fold greater risk (HR: 2.655, 95% CI: 1.251–5.636, p < 0.05).

3.4. High HGI Trend Increases the Risk of Incident Stroke Regardless of DM

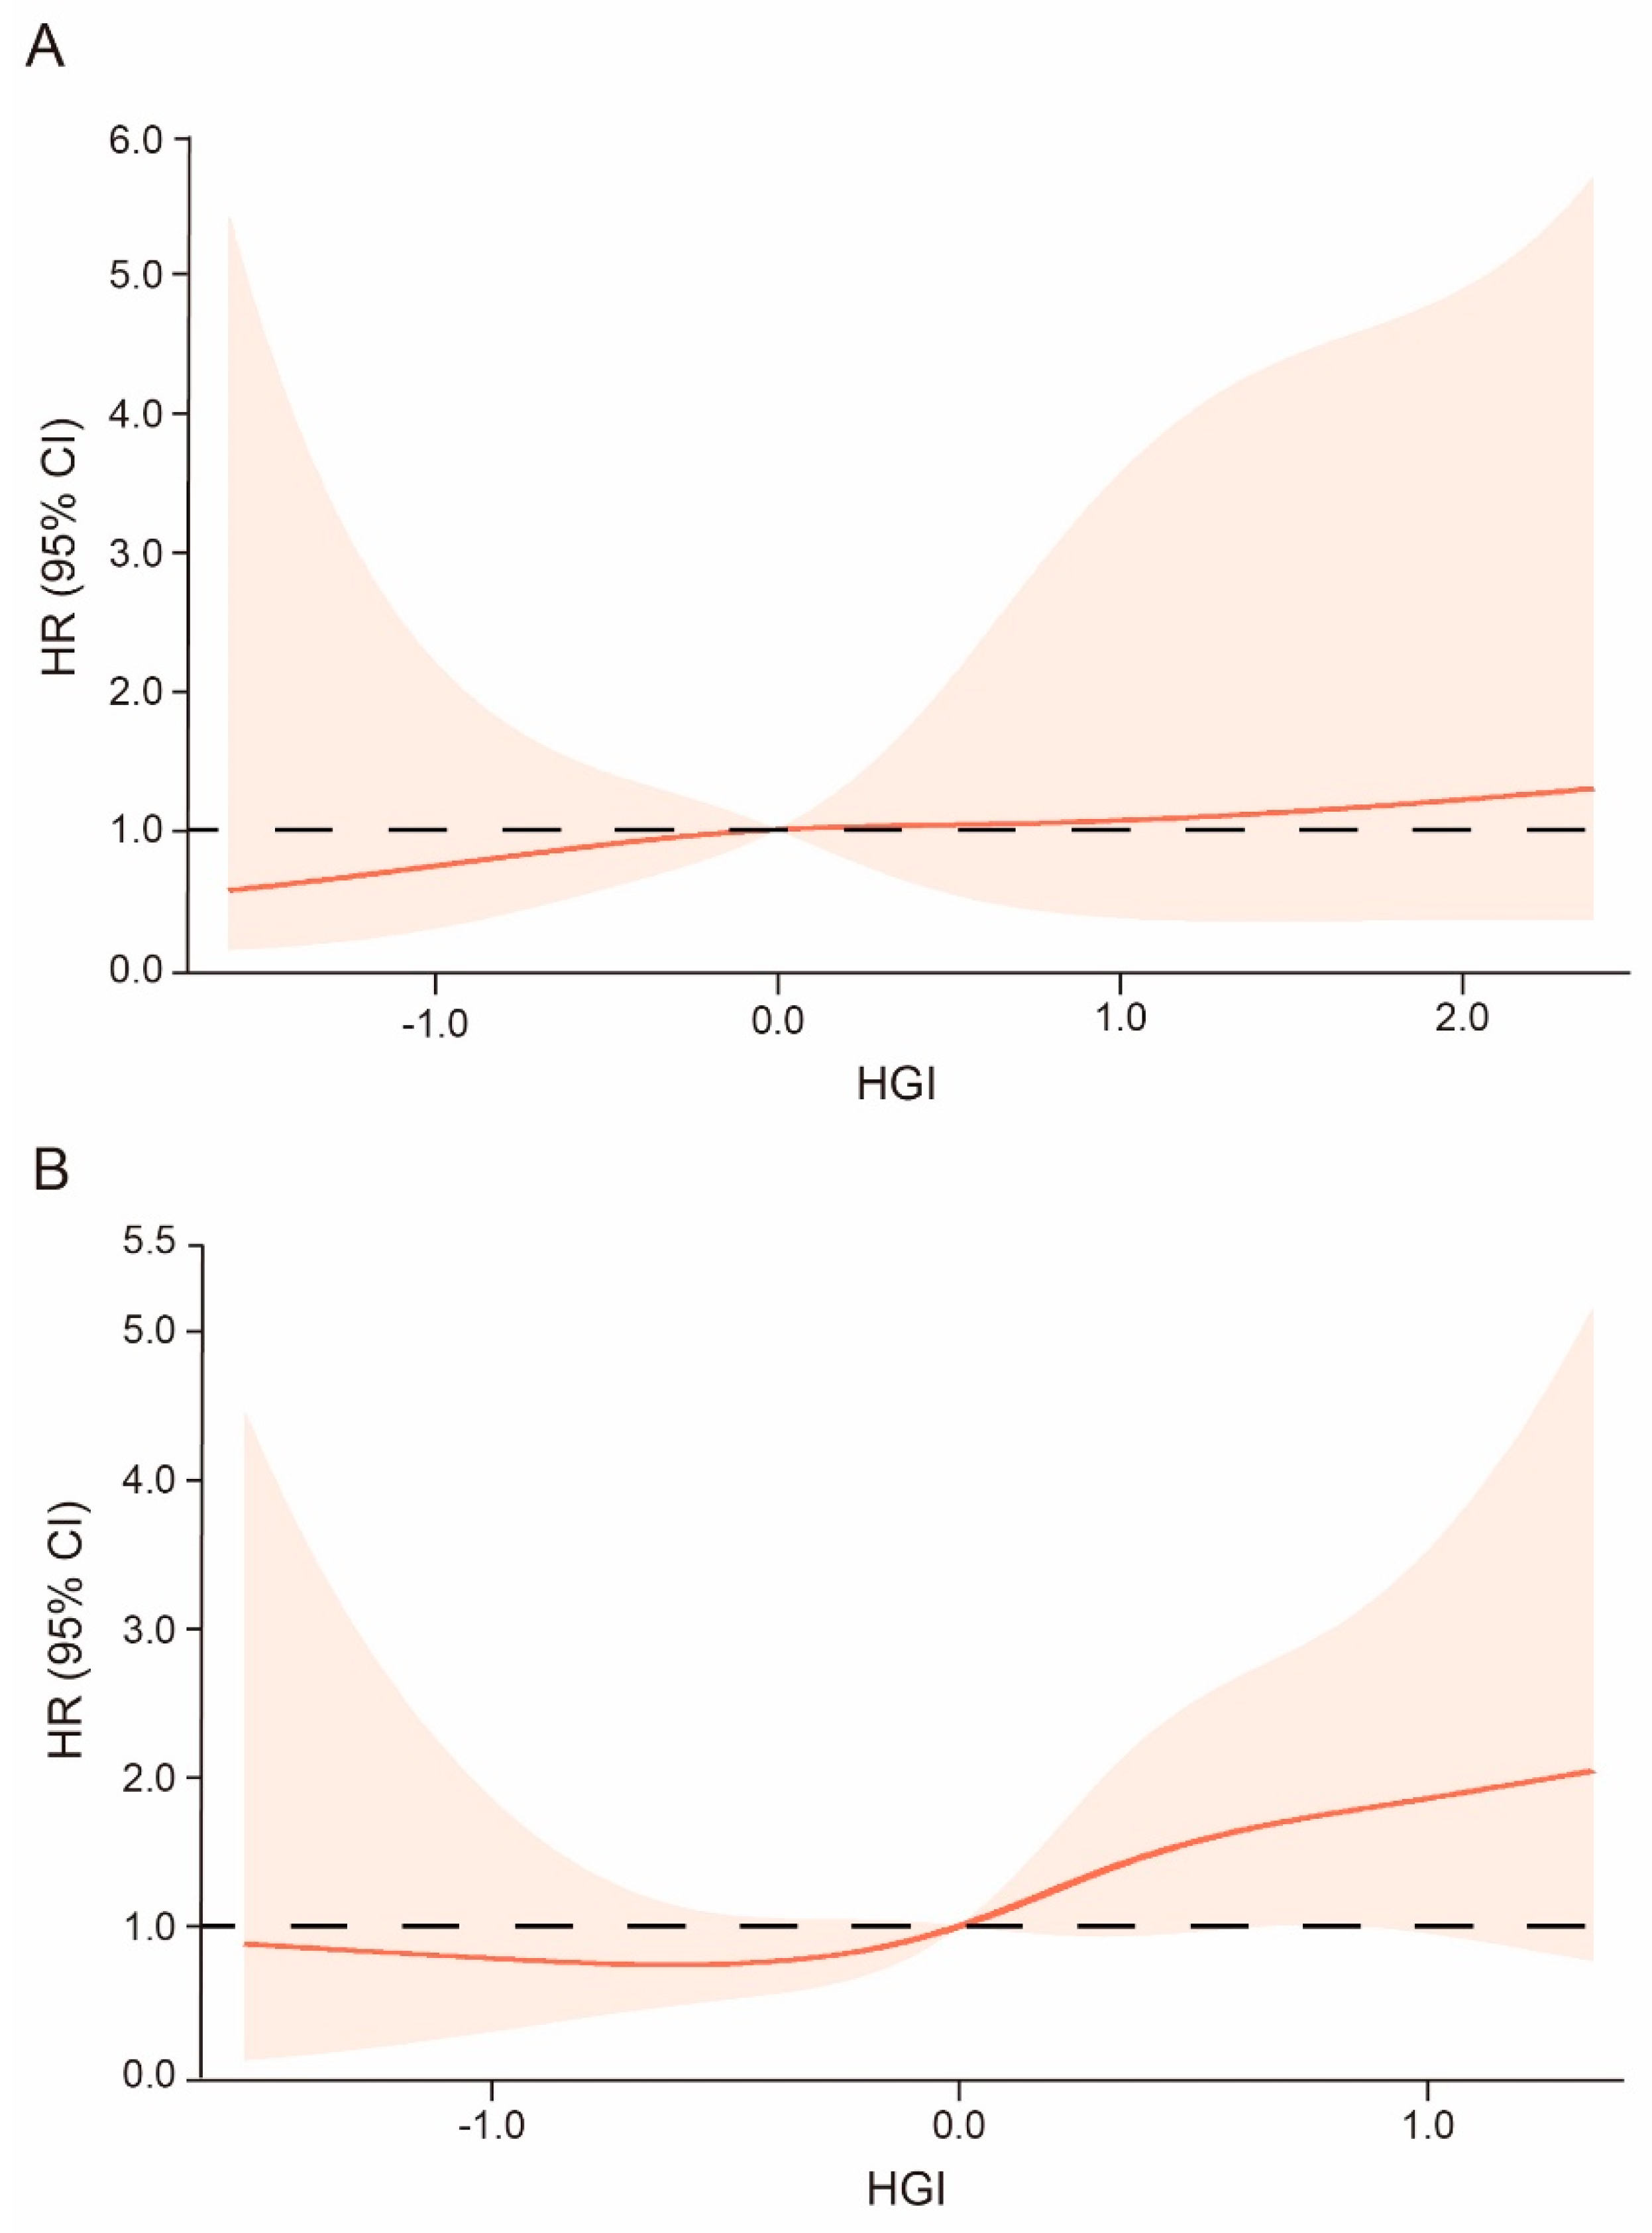
To further confirm the effect of the HGI–DM system in evaluating the risk of incident stroke, we divided participants into two subgroups, normal subjects (n = 2620) and DM subjects (n = 314), and further drew the RCS curve in each subgroup (Figure 3). We observed that the HGI indeed had a linear correlation with incident stroke risk in both subgroups, where the risk of incident stroke was increased gradually with elevated HGI levels; a low HGI level (HGI < 0) could reduce stroke risk; and high HGI (≥0), which represented a trend towards excessive glycosylation, could increase the risk of incident stroke. In addition, the RCS curve also revealed that high HGI (≥0) indeed had a weak but significant effect in increasing stroke risk, even in non-DM participants (Figure 4A), confirming the results we previously mentioned wherein isolated high HGI levels could still increase the risk of incident stroke by 70.1%, even if the subjects were non-DM patients.

3.5. HGI Can Improve the Predictive Effect of the Traditional Model for Stroke

Table 4 shows the discrimination analysis used to evaluate whether HGI could improve the risk stratification of incident stroke events. As we expected, we found a significant category-free IDI (0.012, 95% CI: 0.007–0.015, p < 0.001) and NRI (0.036, 95% CI: 0.0198–0.0522, p < 0.001) after adding HGI to the conventional model (including age, gender, current smoking and drinking, BMI, hypertension, DM, TG, TC, HDL, and LDL).

4. Discussion

We followed up on the rural population in Northeast China for 4.23 years, trying to reveal the epidemiological feature and alteration trends of CVD and related risk factors. The present study combined HGI and DM together for the first time to evaluate the glucose status based on DM alone and confirmed the complementary value of the HGI–DM system for the prediction of incident stroke in the general rural population. We revealed that HGI was an independent risk factor for incident stroke and not redundant based on DM. Our results have shown that the risk of incident stroke was not significantly increased in the population with low HGI, regardless of whether they were suffering from DM. On the contrary, in the subjects with high HGI, regardless of whether they had DM, the risk of incident stroke was still elevated significantly. These results revealed that excessive glycosylation might promote the incidence of stroke. In addition, we also found that HGI could significantly improve the predictability of incident stroke based on traditional models. Our study confirmed the capacity of the DM-HGI system in evaluating and predicting the risk of incident stroke and prompted us to believe that the glycosylation trend represented by the HGI might be a determinant of the risk of incident stroke, so it is effective and necessary to classify and manage high-risk individuals according to the HGI level based on DM and provide different management strategies. For patients with isolated DM (who have DM but without a high HGI level), we need to keep the current treatment and management strategies while actively monitoring their HGI levels and glycosylation trends. Meanwhile, we should track and follow up on patients with high HGI who might already have abnormal glycation, as the aggravated trend in glycosylation status can increase the risk of incident stroke. Tracking will help us promptly treat these patients with care and prevention. The DM-HGI system enabled us to conduct different treatment strategies for patients with different glycemic statuses, reducing incident stroke events at various levels.
DM was recognized as an important risk factor for stroke, so it was essential to comprehensively evaluate glycemic status and screen the high-risk crowds [31,32]. Current studies have mostly used FPG or random serum glucose levels to diagnose DM, but these can only reflect the short-term glucose level of individuals, so they have a poor predictive effect on long-term adverse events [15]. HbA1c is the product of hemoglobin glycosylation, which reflects the long-term serum glucose level. It is considered a gold standard for evaluating glycemic control status in DM patients and is used to predict the risk of DM and related complications [33]. However, some studies observed individual differences in the glycosylation process of hemoglobin, and some patients within the same FPG level could have different HbA1c degrees, with this difference potentially existing over time [17,18,34,35]. HGI reflects the degree of variation of HbA1c and represents the glycosylation trend of hemoglobin in the human body, which can quantify the degree of glycosylation and eliminate the individual differences of HbA1c [20]. Multiple studies have confirmed that HGI is suitable for evaluating the incident risk and outcomes prognosis of various chronic diseases [36,37], especially for DM-related complications, and could act as a predictive indicator of intensive hypoglycemic-strategy-related adverse reactions [29,38,39,40], which we also observed and obtained a similar conclusion for in Table 2. In addition, our studies observed that DM patients with high HGI (HGI > 0) had a significantly increased risk of stroke, the maximum incident risk could even reach 5.636-fold, and this conclusion was also supported by previous studies [22,35]. A randomized controlled trial of T2DM patients revealed that high HGI was associated with the risk of major adverse cardiovascular events [41]. A cohort study of DM and CVD found that a higher HGI level could bring a 1.94-fold increased risk of incident stroke [42]. In addition, a study indicated that DM patients with high HGI have a higher risk of stroke recurrence and a poor prognosis of stroke [22].
After combining DM status and HGI levels, two subgroups showed unexpected results, which might improve the management strategy in clinical treatment. Firstly, we observed that high HGI could elevate the risk of incident stroke, although the subjects did not have DM (HR: 1.701, 95% CI: 1.136–2.792, p: 0.036). HGI was the gap between the actual and theoretical level of HbA1c; it seemed to reflect the glucose metabolism reserve or islet function reserve in the human body [43]. The subjects who had normal or slightly elevated FPG levels should not have such high HGI levels, but they indeed had a higher HGI level, which suggested that excessive glycosylation was activated, and glucose metabolism disorder might already be active or further aggravated. In addition, our results indicated that HGI seemed more sensitive than FPG alone in describing the risk of incident stroke. A follow-up study showed that people with abnormal glucose levels had an increased risk of CVD when their HGI levels were increased, even in prediabetics, whose FPG was increased slightly and defined as impaired glucose status. In addition, they also observed that the risk of stroke was elevated from 2.31-fold to 3.40-fold compared to the reference, with a gradual increase in HGI levels [21]. This conclusion is similar to our study, which suggested that HGI could effectively reflect the health status of vascular metabolism, and we believe HGI might be better for evaluating the risk of CVD than DM (as exhibited in Table 3). Additionally, this hypothesis was confirmed in another subgroup of our study, in which we did not observe a significant difference in incident stroke risk among the low-HGI subjects regardless of whether they had DM, meaning that under the condition of low HGI, DM failed to bring an extra risk of incident stroke, and we also observed this tendency in the cumulative hazard or incidence of onset stroke (Figure 2 and Figure 3). This conclusion was supported by the Action to Control Cardiovascular Risk in Diabetes (ACCORD) trial. The ACCORD study included 10,251 T2DM patients who were given standard treatment or intensive hypoglycemic treatment, respectively. After 3.5 years of follow-up, there was a significant improvement in the prognosis of patients with low HGI and medium HGI, but there was no significant improvement in the prognosis of patients with high HGI, even if they were given intensive hypoglycemic strategy, and high HGI could bring higher total mortality or a greater risk for hypoglycemia [44]. Both our study and the ACCORD study revealed that lower HGI levels could improve the outcome events and benefit patients with a risk of stroke regardless of whether they were DM patients.
The present study has some strengths. First, our research conducted a population-based prospective cohort study with many participants in northeastern rural regions of China, which gave our conclusions and the causative association between HGI level and the risk of incident stroke a higher degree of evidence. Additionally, the present study used the DM-HGI system to first predict the risk of incident stroke; we found that this combination could divide the population into different glucose metabolic statuses to optimize the clinical treatment and enable us to conduct different management strategies. Lastly, our study, for the first time, incorporated HGI into the traditional risk model and conducted a re-stratification analysis to evaluate the improved ability to predict incident stroke, obtaining a positive effect, which is shown in Table 4. This enabled us to optimize the stroke risk prediction model and conduct relevant treatment in time. However, we also had some limitations. First, our variable information did not cover all aspects; for example, we did not collect drug consumption information and AF information for our regression model, which was defined as a crucial risk factor. Secondly, the present study excluded 6858 subjects who lacked relevant data, such as Hb1Ac and stroke status, in the follow-up period. Although we used the Kolmogorov–Smirnov test to confirm that the data were normally distributed and the present study population remained broadly representative, these exclusions might have led to selection bias, and we will perform a larger-scale cohort study to improve and confirm the present conclusion. Moreover, the outcome events of our study combined incident stroke and stroke-related death, weakening the predictive value of HGI for nonfatal stroke or relevant death events. Lastly, the HGI was calculated by a regression formula, which might not be suitable for other natural populations, so our conclusion still needs a multiple-center and large-scale study to confirm the results.

5. Conclusions

In summary, we confirmed the complementary value of the HGI–DM system for predicting incident stroke in the general rural population. Our results provided a novel insight into managing the high-risk crowds of stroke. The patients with low HGI suggested that total glucose metabolism was stable, and these patients should further keep this homeostasis. Patients with high HGI but without DM should receive more attention regarding their glucose metabolic status because they might already have abnormal glycation. Lastly, we found that HGI could effectively improve the identification of incident stroke based on the traditional risk model, in which HGI had potential applications in risk stratification and the identification of individuals at high risk for poor outcomes.

Author Contributions

Conceptualization, X.Z.; Project Administration, Y.S. and X.Z.; Methodology, X.G., Y.Z., Z.L., H.Y., S.Y. and P.W.; Data Curation, Y.S., X.Z. and X.G.; Writing—Original Draft Preparation, P.W. and Q.L.; Writing—Review and Editing, Y.S., X.Z., X.G., S.Y. and P.W. All authors have read and agreed to the published version of the manuscript.

Funding

This research was supported by the following funding: The National Key Research and Development Program from the Ministry of Science and Technology of China (project grant #2016YFC1301305); The National Key Research and Development Program from the Ministry of Science and Technology of China (project grant #2012BAJ18B00, sub-project grant #2012BAJ18B08); The National Key Research and Development Program from the Ministry of Science and Technology of China (project grant #2018YFC1312400, sub-project grant #2018YFC1312403); and The Science and Technology Program of Liaoning Province, China (grant #2020JH1/10300002).

Institutional Review Board Statement

This study was conducted according to the guidelines of the Declaration of Helsinki and approved by the Ethics Committee of China Medical University (Shenyang, China, ethical approved project identification code: AF-SOP-07-1, 0-01).

Informed Consent Statement

Written informed consent was obtained from the patients to publish this paper.

Data Availability Statement

We can provide the raw data of the present study after evaluation and permission from the subject principals. For matters on the availability of raw data, please contact Professor Xingang Zhang ([email protected]) and Professor Yingxian Sun ([email protected]).

Acknowledgments

We would like to thank the cardiologists and staff of CDCs of Fuxin City, Panjin City, and Liaoyang City in Liaoning Province, who worked hard to ensure the reliability and accuracy of data.

Conflicts of Interest

The authors declare no conflict of interest.

References

  1. Mansfield, A.; Inness, E.L.; McIlroy, W.E. Stroke. Handb. Clin. Neurol. 2018, 159, 205–228. [Google Scholar] [CrossRef] [PubMed]
  2. Wang, W.; Jiang, B.; Sun, H.; Ru, X.; Sun, D.; Wang, L.; Wang, L.; Jiang, Y.; Li, Y.; Wang, Y.; et al. Prevalence, Incidence, and Mortality of Stroke in China: Results from a Nationwide Population-Based Survey of 480 687 Adults. Circulation 2017, 135, 759–771. [Google Scholar] [CrossRef] [PubMed]
  3. Kyu, H.H.; Abate, D.; Abate, K.H.; Abay, S.M.; Abbafati, C.; Abbasi, N.; Abbastabar, H.; Abd-Allah, F.; Abdela, J.; Abdelalim, A.; et al. Global, regional, and national disability-adjusted life-years (DALYs) for 359 diseases and injuries and healthy life expectancy (HALE) for 195 countries and territories, 1990–2017: A systematic analysis for the Global Burden of Disease Study 2017. Lancet 2018, 392, 1859–1922. [Google Scholar] [CrossRef]
  4. Krishnamurthi, R.V.; Ikeda, T.; Feigin, V.L. Global, Regional and Country-Specific Burden of Ischaemic Stroke, Intracerebral Haemorrhage and Subarachnoid Haemorrhage: A Systematic Analysis of the Global Burden of Disease Study 2017. Neuroepidemiology 2020, 54, 171–179. [Google Scholar] [CrossRef] [PubMed]
  5. Roth, G.A.; Abate, D.; Abate, K.H.; Abay, S.M.; Abbafati, C.; Abbasi, N.; Abbastabar, H.; Abd-Allah, F.; Abdela, J.; Abdelalim, A.; et al. Global, regional, and national age-sex-specific mortality for 282 causes of death in 195 countries and territories, 1980–2017: A systematic analysis for the Global Burden of Disease Study 2017. Lancet 2018, 392, 1736–1788. [Google Scholar] [CrossRef]
  6. Wu, S.; Wu, B.; Liu, M.; Chen, Z.; Wang, W.; Anderson, C.S.; Sandercock, P.; Wang, Y.; Huang, Y.; Cui, L.; et al. Stroke in China: Advances and challenges in epidemiology, prevention, and management. Lancet Neurol. 2019, 18, 394–405. [Google Scholar] [CrossRef]
  7. Xia, X.; Yue, W.; Chao, B.; Li, M.; Cao, L.; Wang, L.; Shen, Y.; Li, X. Prevalence and risk factors of stroke in the elderly in Northern China: Data from the National Stroke Screening Survey. J. Neurol. 2019, 266, 1449–1458. [Google Scholar] [CrossRef]
  8. Wang, C.; Li, J.; Zhao, X.; Wang, Y.; Wu, D.; Wang, Y. Stroke care development in Mainland China: Past, present and future. Int. J. Stroke 2008, 3, 288–289. [Google Scholar] [CrossRef]
  9. Feigin, V.L.; Stark, B.A.; Johnson, C.O.; Roth, G.A.; Bisignano, C.; Abady, G.G.; Abbasifard, M.; Abbasi-Kangevari, M.; Abd-Allah, F.; Abedi, V.; et al. Global, regional, and national burden of stroke and its risk factors, 1990–2019: A systematic analysis for the Global Burden of Disease Study 2019. Lancet Neurol. 2021, 20, 795–820. [Google Scholar] [CrossRef]
  10. Peters, S.A.; Huxley, R.R.; Woodward, M. Diabetes as a risk factor for stroke in women compared with men: A systematic review and meta-analysis of 64 cohorts, including 775,385 individuals and 12,539 strokes. Lancet 2014, 383, 1973–1980. [Google Scholar] [CrossRef]
  11. Sarwar, N.; Gao, P.; Seshasai, S.R.; Gobin, R.; Kaptoge, S.; di Angelantonio, E.; Ingelsson, E.; Lawlor, D.A.; Selvin, E.; Stampfer, M.; et al. Diabetes mellitus, fasting blood glucose concentration, and risk of vascular disease: A collaborative meta-analysis of 102 prospective studies. Lancet 2010, 375, 2215–2222. [Google Scholar] [CrossRef] [PubMed]
  12. Lee, M.; Saver, J.L.; Hong, K.S.; Song, S.; Chang, K.H.; Ovbiagele, B. Effect of pre-diabetes on future risk of stroke: Meta-analysis. BMJ 2012, 344, e3564. [Google Scholar] [CrossRef] [PubMed]
  13. American Diabetes Association. Standards of medical care in diabetes—2010. Diabetes Care 2010, 33 (Suppl. 1), S11–S61. [Google Scholar] [CrossRef] [PubMed]
  14. Alberti, K.G.; Zimmet, P.Z. Definition, diagnosis and classification of diabetes mellitus and its complications. Part 1: Diagnosis and classification of diabetes mellitus provisional report of a WHO consultation. Diabet. Med. 1998, 15, 539–553. [Google Scholar] [CrossRef]
  15. Zhang, X.; Yang, Z.; Zhang, M.; Zhu, Y.; Zhao, Z.; Huang, Z.; Li, C.; Zhou, M.; Farmer, A.J.; Tang, J.; et al. Independent effects of 2hPG, FPG and HbA1c on cardiovascular risk: Analysis of a nationally representative sample from China. Diabetes Res. Clin. Pract. 2021, 173, 108672. [Google Scholar] [CrossRef]
  16. Weykamp, C. HbA1c: A review of analytical and clinical aspects. Ann. Lab. Med. 2013, 33, 393–400. [Google Scholar] [CrossRef]
  17. American Diabetes Association. Classification and Diagnosis of Diabetes: Standards of Medical Care in Diabetes—2021. Diabetes Care 2021, 44, S15–S33. [Google Scholar] [CrossRef]
  18. Lin, L.; Wang, A.; He, Y.; Wang, W.; Gao, Z.; Tang, X.; Yan, L.; Wan, Q.; Luo, Z.; Qin, G.; et al. Effects of the hemoglobin glycation index on hyperglycemia diagnosis: Results from the REACTION study. Diabetes Res. Clin. Pract. 2021, 180, 109039. [Google Scholar] [CrossRef]
  19. Cohen, R.M.; Snieder, H.; Lindsell, C.J.; Beyan, H.; Hawa, M.I.; Blinko, S.; Edwards, R.; Spector, T.D.; Leslie, R.D. Evidence for independent heritability of the glycation gap (glycosylation gap) fraction of HbA1c in nondiabetic twins. Diabetes Care 2006, 29, 1739–1743. [Google Scholar] [CrossRef]
  20. Hempe, J.M.; Gomez, R.; McCarter, R.J., Jr.; Chalew, S.A. High and low hemoglobin glycation phenotypes in type 1 diabetes: A challenge for interpretation of glycemic control. J. Diabetes Complicat. 2002, 16, 313–320. [Google Scholar] [CrossRef]
  21. Ahn, C.H.; Min, S.H.; Lee, D.H.; Oh, T.J.; Kim, K.M.; Moon, J.H.; Choi, S.H.; Park, K.S.; Jang, H.C.; Ha, J.; et al. Hemoglobin Glycation Index Is Associated with Cardiovascular Diseases in People with Impaired Glucose Metabolism. J. Clin. Endocrinol. Metab. 2017, 102, 2905–2913. [Google Scholar] [CrossRef] [PubMed]
  22. Pan, Y.; Jing, J.; Wang, Y.; Liu, L.; Wang, Y.; He, Y. Association of hemoglobin glycation index with outcomes of acute ischemic stroke in type 2 diabetic patients. Neurol. Res. 2018, 40, 573–580. [Google Scholar] [CrossRef] [PubMed]
  23. Guo, X.; Li, Z.; Zhou, Y.; Yu, S.; Yang, H.; Sun, G.; Zheng, L.; Afzal, J.; Liu, Y.; Sun, Y. The effects of transitions in metabolic health and obesity status on incident cardiovascular disease: Insights from a general Chinese population. Eur. J. Prev. Cardiol. 2021, 28, 1250–1258. [Google Scholar] [CrossRef] [PubMed]
  24. Li, G.; Shi, C.; Li, T.; Ouyang, N.; Guo, X.; Chen, Y.; Li, Z.; Zhou, Y.; Yang, H.; Yu, S.; et al. A nomogram integrating non-ECG factors with ECG to screen left ventricular hypertrophy among hypertensive patients from northern China. J. Hypertens. 2022, 40, 264–273. [Google Scholar] [CrossRef] [PubMed]
  25. Pickering, T.G.; Hall, J.E.; Appel, L.J.; Falkner, B.E.; Graves, J.; Hill, M.N.; Jones, D.W.; Kurtz, T.; Sheps, S.G.; Roccella, E.J. Recommendations for blood pressure measurement in humans and experimental animals: Part 1: Blood pressure measurement in humans: A statement for professionals from the Subcommittee of Professional and Public Education of the American Heart Association Council on High Blood Pressure Research. Circulation 2005, 111, 697–716. [Google Scholar] [CrossRef]
  26. Chobanian, A.V.; Bakris, G.L.; Black, H.R.; Cushman, W.C.; Green, L.A.; Izzo, J.L., Jr.; Jones, D.W.; Materson, B.J.; Oparil, S.; Wright, J.T., Jr.; et al. The Seventh Report of the Joint National Committee on Prevention, Detection, Evaluation, and Treatment of High Blood Pressure: The JNC 7 report. JAMA 2003, 289, 2560–2572. [Google Scholar] [CrossRef]
  27. Chamberlain, J.J.; Rhinehart, A.S.; Shaefer, C.F., Jr.; Neuman, A. Diagnosis and Management of Diabetes: Synopsis of the 2016 American Diabetes Association Standards of Medical Care in Diabetes. Ann. Intern. Med. 2016, 164, 542–552. [Google Scholar] [CrossRef]
  28. Levey, A.S.; Stevens, L.A.; Schmid, C.H.; Zhang, Y.L.; Castro, A.F., 3rd; Feldman, H.I.; Kusek, J.W.; Eggers, P.; van Lente, F.; Greene, T.; et al. A new equation to estimate glomerular filtration rate. Ann. Intern. Med. 2009, 150, 604–612. [Google Scholar] [CrossRef]
  29. McCarter, R.J.; Hempe, J.M.; Gomez, R.; Chalew, S.A. Biological variation in HbA1c predicts risk of retinopathy and nephropathy in type 1 diabetes. Diabetes Care 2004, 27, 1259–1264. [Google Scholar] [CrossRef]
  30. Xing, L.; Jing, L.; Tian, Y.; Liu, S.; Lin, M.; Du, Z.; Ren, G.; Sun, Q.; Shi, L.; Dai, D.; et al. High prevalence of stroke and uncontrolled associated risk factors are major public health challenges in rural northeast China: A population-based study. Int. J. Stroke 2020, 15, 399–411. [Google Scholar] [CrossRef]
  31. Lei, C.; Wu, B.; Liu, M.; Chen, Y. Association between hemoglobin A1C levels and clinical outcome in ischemic stroke patients with or without diabetes. J. Clin. Neurosci. 2015, 22, 498–503. [Google Scholar] [CrossRef] [PubMed]
  32. Eriksson, M.; Carlberg, B.; Eliasson, M. The disparity in long-term survival after a first stroke in patients with and without diabetes persists: The Northern Sweden MONICA study. Cerebrovasc. Dis. 2012, 34, 153–160. [Google Scholar] [CrossRef] [PubMed]
  33. Lu, J.; He, J.; Li, M.; Tang, X.; Hu, R.; Shi, L.; Su, Q.; Peng, K.; Xu, M.; Xu, Y.; et al. Predictive Value of Fasting Glucose, Postload Glucose, and Hemoglobin A(1c) on Risk of Diabetes and Complications in Chinese Adults. Diabetes Care 2019, 42, 1539–1548. [Google Scholar] [CrossRef] [PubMed]
  34. Hägg, S.; Thorn, L.M.; Forsblom, C.M.; Gordin, D.; Saraheimo, M.; Tolonen, N.; Wadén, J.; Liebkind, R.; Putaala, J.; Tatlisumak, T.; et al. Different risk factor profiles for ischemic and hemorrhagic stroke in type 1 diabetes mellitus. Stroke 2014, 45, 2558–2562. [Google Scholar] [CrossRef] [PubMed]
  35. Rawshani, A.; Rawshani, A.; Franzén, S.; Sattar, N.; Eliasson, B.; Svensson, A.M.; Zethelius, B.; Miftaraj, M.; McGuire, D.K.; Rosengren, A.; et al. Risk Factors, Mortality, and Cardiovascular Outcomes in Patients with Type 2 Diabetes. N. Engl. J. Med. 2018, 379, 633–644. [Google Scholar] [CrossRef]
  36. Fiorentino, T.V.; Marini, M.A.; Succurro, E.; Sciacqua, A.; Andreozzi, F.; Perticone, F.; Sesti, G. Elevated hemoglobin glycation index identify non-diabetic individuals at increased risk of kidney dysfunction. Oncotarget 2017, 8, 79576–79586. [Google Scholar] [CrossRef]
  37. Fiorentino, T.V.; Marini, M.A.; Succurro, E.; Andreozzi, F.; Sciacqua, A.; Hribal, M.L.; Perticone, F.; Sesti, G. Association between hemoglobin glycation index and hepatic steatosis in non-diabetic individuals. Diabetes Res. Clin. Pract. 2017, 134, 53–61. [Google Scholar] [CrossRef]
  38. Hempe, J.M.; Yang, S.; Liu, S.; Hsia, D.S. Standardizing the haemoglobin glycation index. Endocrinol. Diabetes Metab. 2021, 4, e00299. [Google Scholar] [CrossRef]
  39. Van Steen, S.C.; Schrieks, I.C.; Hoekstra, J.B.; Lincoff, A.M.; Tardif, J.C.; Mellbin, L.G.; Rydén, L.; Grobbee, D.E.; DeVries, J.H. The haemoglobin glycation index as predictor of diabetes-related complications in the AleCardio trial. Eur. J. Prev. Cardiol. 2017, 24, 858–866. [Google Scholar] [CrossRef]
  40. Van Steen, S.C.; Woodward, M.; Chalmers, J.; Li, Q.; Marre, M.; Cooper, M.E.; Hamet, P.; Mancia, G.; Colagiuri, S.; Williams, B.; et al. Haemoglobin glycation index and risk for diabetes-related complications in the Action in Diabetes and Vascular Disease: Preterax and Diamicron Modified Release Controlled Evaluation (ADVANCE) trial. Diabetologia 2018, 61, 780–789. [Google Scholar] [CrossRef] [Green Version]
  41. Klein, K.R.; Franek, E.; Marso, S.; Pieber, T.R.; Pratley, R.E.; Gowda, A.; Kvist, K.; Buse, J.B. Hemoglobin glycation index, calculated from a single fasting glucose value, as a prediction tool for severe hypoglycemia and major adverse cardiovascular events in DEVOTE. BMJ Open Diabetes Res. Care 2021, 9, e002339. [Google Scholar] [CrossRef] [PubMed]
  42. Kim, M.K.; Jeong, J.S.; Yun, J.S.; Kwon, H.S.; Baek, K.H.; Song, K.H.; Ahn, Y.B.; Ko, S.H. Hemoglobin glycation index predicts cardiovascular disease in people with type 2 diabetes mellitus: A 10-year longitudinal cohort study. J. Diabetes Complicat. 2018, 32, 906–910. [Google Scholar] [CrossRef] [PubMed]
  43. Hsia, D.S.; Rasouli, N.; Pittas, A.G.; Lary, C.W.; Peters, A.; Lewis, M.R.; Kashyap, S.R.; Johnson, K.C.; LeBlanc, E.S.; Phillips, L.S.; et al. Implications of the Hemoglobin Glycation Index on the Diagnosis of Prediabetes and Diabetes. J. Clin. Endocrinol. Metab. 2020, 105, e130–e138. [Google Scholar] [CrossRef] [PubMed]
  44. Hempe, J.M.; Liu, S.; Myers, L.; McCarter, R.J.; Buse, J.B.; Fonseca, V. The hemoglobin glycation index identifies subpopulations with harms or benefits from intensive treatment in the ACCORD trial. Diabetes Care 2015, 38, 1067–1074. [Google Scholar] [CrossRef] [Green Version]
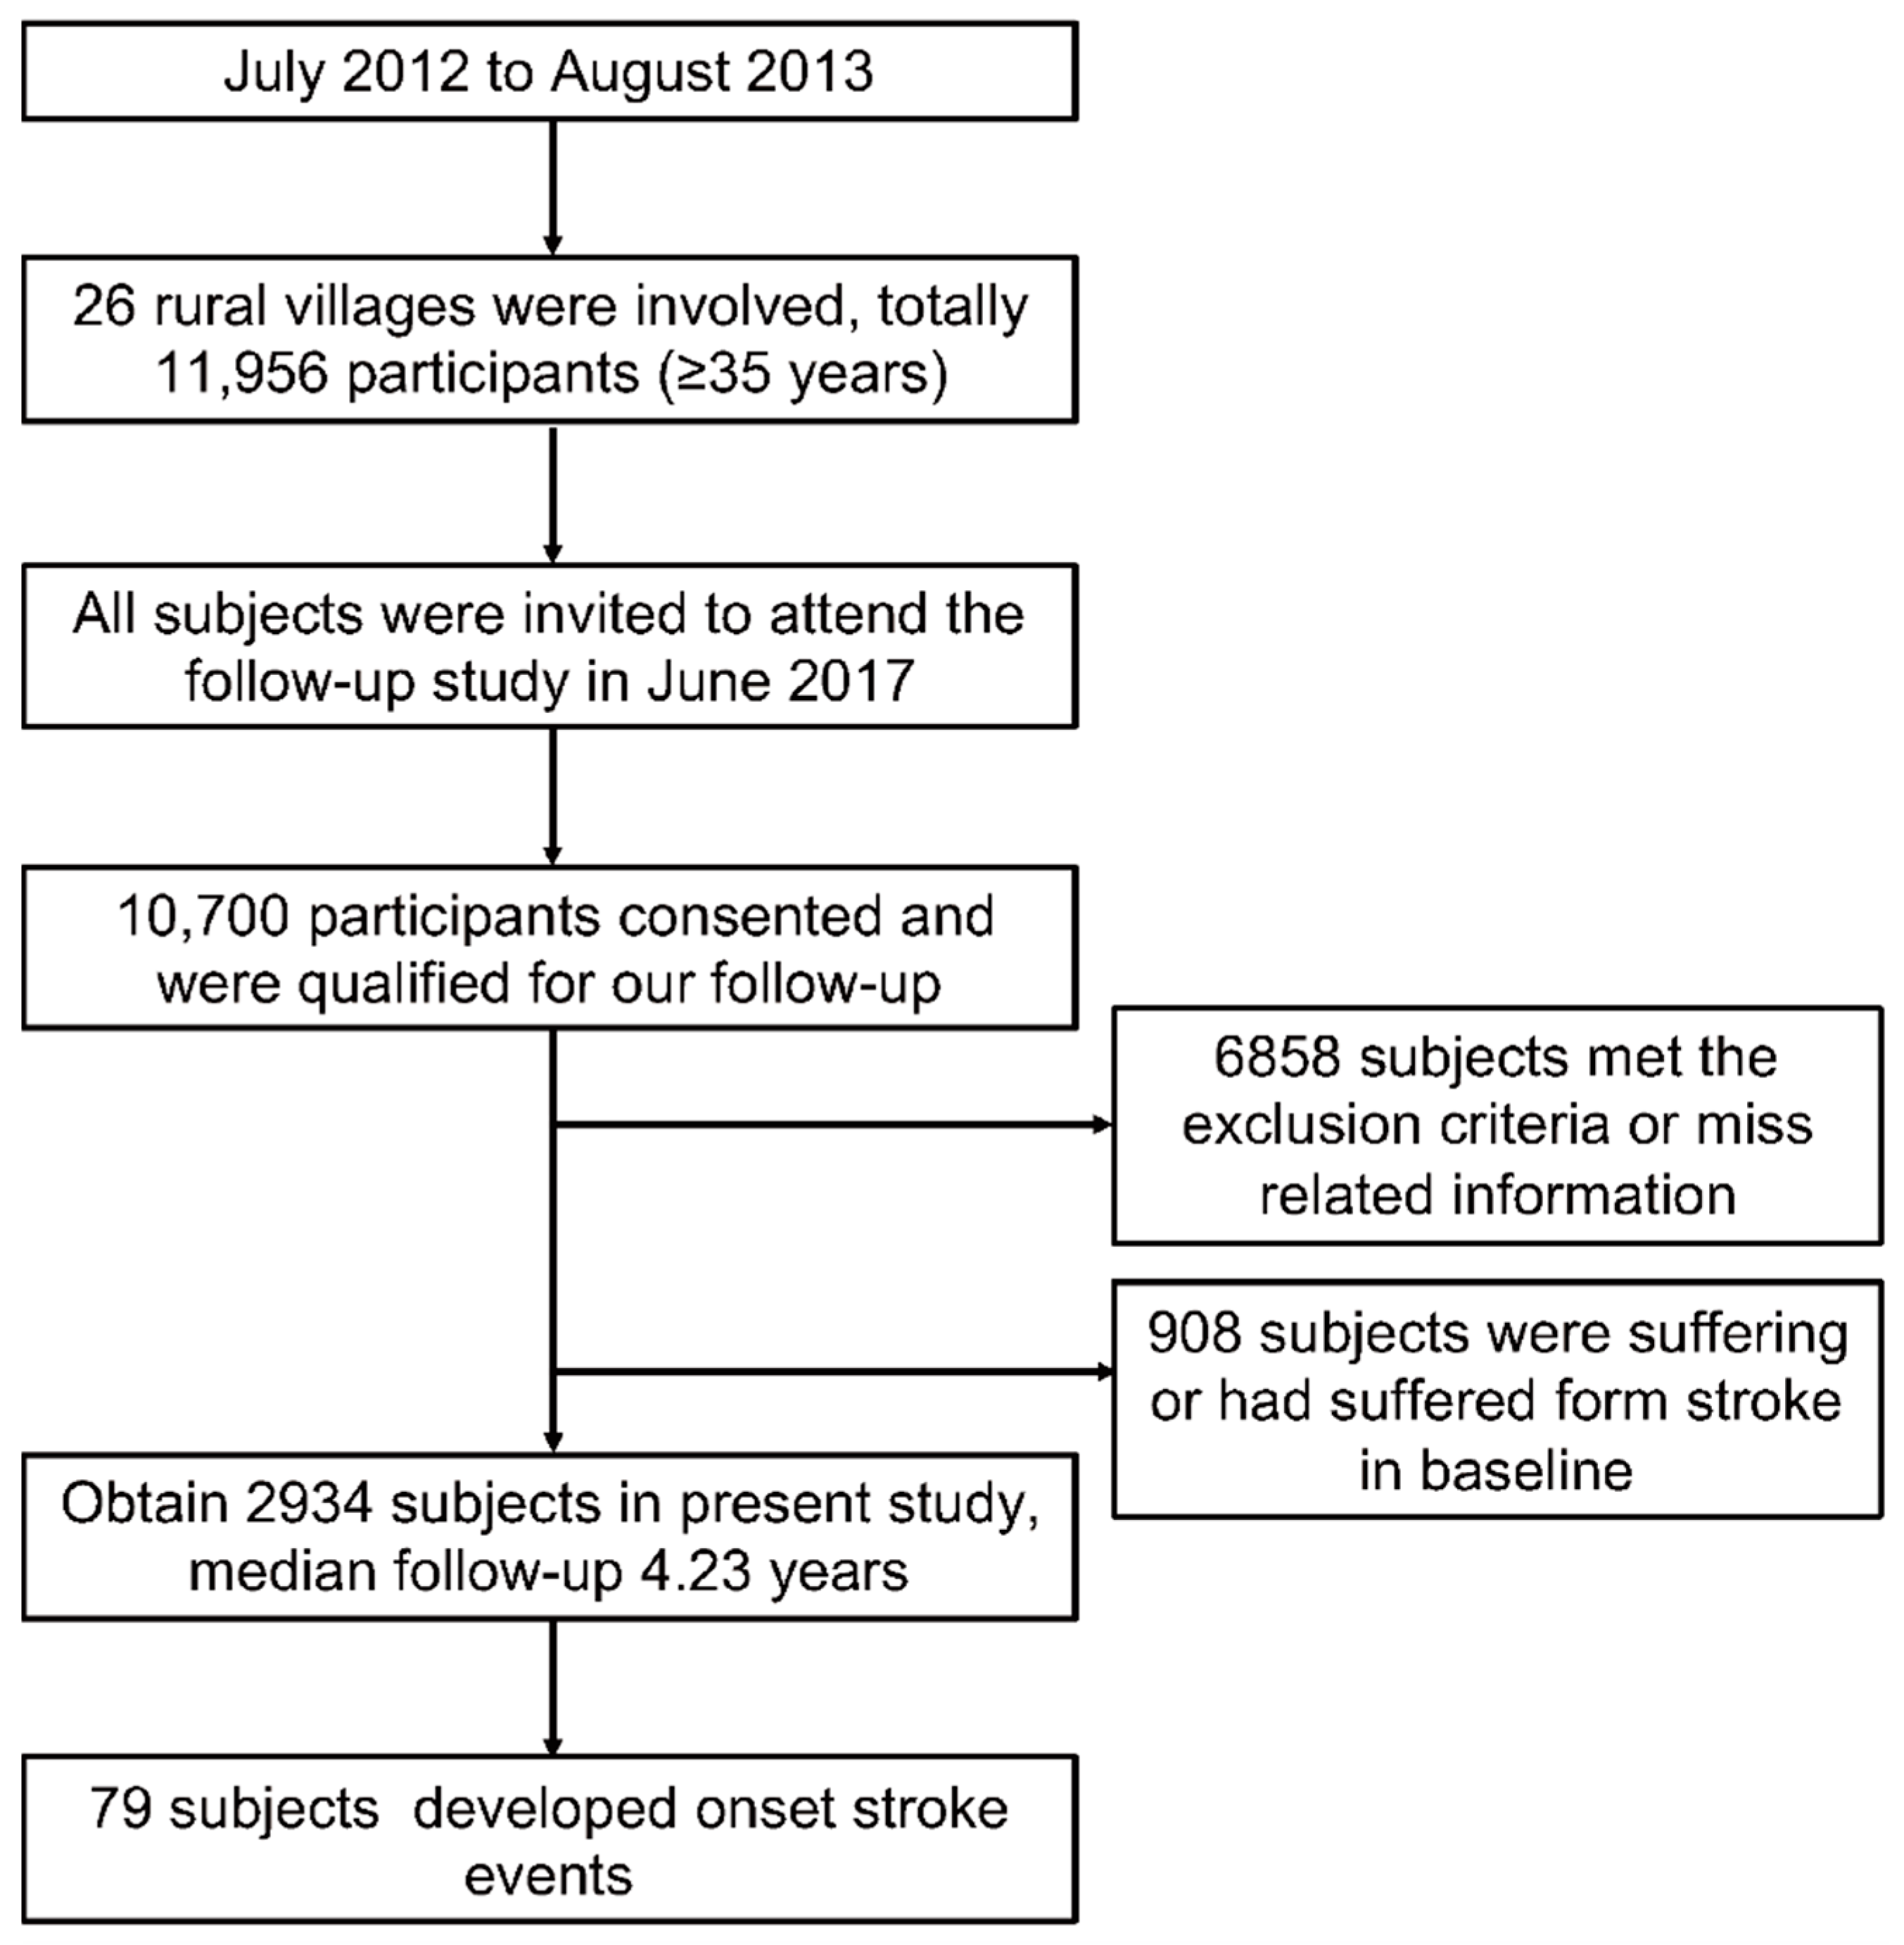
Figure 1. Flow chart of our study population’s selected protocol. We recruited a total of 11,956 natural residents (age ≥ 35 years) from rural regions in three counties in northeastern China. In 2017, 10,700 participants consented and were qualified for our follow-up study. In the present study, we excluded 6858 participants who lacked related information or missed the follow-up and further excluded 908 participants who were suffering or had suffered from stroke in baseline. Eventually, we obtained a target population of 2934 for the present study.
Jcm 11 05814 g001
Figure 2. The incidence of onset stroke based on HGI–DM system. After 4.23 years of follow-up, based on HGI–DM system, the highest incidence of stroke took place in both DM and high-HGI subgroups. Moreover, the isolated high-HGI subjects had a slightly higher incidence than the isolated DM subjects. Abbreviations: HGI, glycated hemoglobin index; DM, diabetes mellitus.
Jcm 11 05814 g002
Figure 3. Kaplan–Meier curves for cumulative hazard of incident stroke events stratified by DM-HGI system. Kaplan–Meier curves exhibited the tendency of cumulative hazard, and we further compared different DM-HGI statuses using the log-rank test. Compared with the subjects who had neither DM nor high HGI (blue curve), isolated DM patients did not present a higher incident stroke risk (red curve). However, two high-HGI subgroups both had higher cumulative hazards of stroke than reference. Especially, the isolated high-HGI subgroup presented an elevated risk of stroke, although the subgroup population did not suffer from DM (green curve). Moreover, the patients with both DM and high HGI had the highest hazard of stroke (orange curve). Abbreviations: HGI, glycated hemoglobin index; DM, diabetes mellitus. Statistical significance was defined as p < 0.05 under two-tailed condition.
Jcm 11 05814 g003
Figure 4. The RCS of HGI levels and incident stroke risk grouped by DM status. The HGI had a linear correlation with the risk of onset stroke, in which higher HGI could increase the risk of incident stroke. Meanwhile, even in the subjects without DM, high HGI still could increase the risk of incident stroke. (A). The RCS of HGI and risk of incident stroke in non-DM participants, n = 2620; (B). The RCS of HGI and risk of incident stroke in DM participants, n = 314. Abbreviations: HR, hazard ratio; CI, confidence interval; HGI, glycated hemoglobin index.
Jcm 11 05814 g004
Table 1. Baseline characteristics of the study.
VariableNormal PopulationDM Patientsp Value
Low HGI
n = 1276
High HGI
n = 1344
Low HGI
n = 131
High HGI
n = 183
Age (years)54.4 ± 10.356.0 ± 9.957.9 ± 9.358.1 ± 8.5<0.001
Male639 (50.1)556 (41.4)74 (56.5)68 (37.2)<0.001
Smoking465 (36.4)483 (35.9)58 (44.3)57 (31.1)0.122
Drinking322 (25.2)202 (15.0)43 (32.8)23 (12.6)<0.001
History of CVD189 (14.8)219 (16.3)38 (29.0)52 (28.4)<0.001
Hypertension516 (40.4)544 (40.5)85 (64.9)118 (64.5)<0.001
BMI (kg/m2)24.06 ± 3.5124.30 ± 3.8425.77 ± 3.5625.63 ± 3.68<0.001
SBP (mmHg)136.28 ± 21.39135.77 ± 22.28148.15 ± 24.34147.81 ± 23.67<0.001
DBP (mmHg)81.33 ± 11.2280.40 ± 11.7484.01 ± 13.2083.98 ± 11.90<0.001
FPG (mmol/L)5.61 ± 0.535.42 ± 0.529.46 ± 2.929.08 ± 2.65<0.001
TC (mmol/L)5.05 ± 1.025.12 ± 1.045.27 ± 1.205.45 ± 1.13<0.001
TG (mmol/L)1.74 ± 1.661.67 ± 1.442.73 ± 2.492.56 ± 2.32<0.001
HDL-C (mmol/L)1.32 ± 0.291.31 ± 0.291.26 ± 0.291.26 ± 0.260.004
LDL-C (mmol/L)2.61 ± 0.622.71 ± 0.682.67 ± 0.642.85 ± 0.70<0.001
eGFR (mL/min/1.73 m2)89.35 ± 13.3487.34 ± 12.5786.18 ± 16.0385.78 ± 13.12<0.001
HbA1c (%)4.73 ± 0.495.59 ± 0.386.11 ± 1.067.67 ± 1.67<0.001
HGI−0.50 ± 0.380.43 ± 0.32−0.81 ± 0.860.92 ± 0.87<0.001
Data are presented as M ± SD or N(%), as appropriate. Statistical significance was defined as p < 0.05 under two-tailed condition. Abbreviations: CVD, cardiovascular disease; eGFR, estimated glomerular filtration rate; FPG, fast plasma glucose; TC, plasma total cholesterol; TG, triglyceride; HDL-C, high-density lipoprotein cholesterol; LDL-C, low-density lipoprotein cholesterol; SBP, systolic blood pressure; DBP, diastolic blood pressure; BMI, body mass index; HbA1c, glycated hemoglobin; HGI, hemoglobin glycation index; SD, standard deviation; M, mean.
Table 2. The association of HGI and the risk of incident stroke.
VariableIncidence of Stroke
Crude HRsAdjusted HRs
HR (95% CI)pHR (95% CI)p
Continuous
per SD of HGI1.284 (1.047–1.574)0.0221.279 (1.063–1.539)0.009
Categorical
HGI < 0reference-reference-
HGI ≥ 01.977 (1.221–3.205)0.0201.780 (1.120–2.830)0.015
Cox proportional hazards models include age, gender, current smoking and drinking, hypertension, DM, eGFR, TC, TG, HDL-C, LDL-C, and HGI. Statistical significance was defined as p < 0.05 under two-tailed condition. Abbreviations: HR, hazard ratio; SD, standard deviation; CI, confidence interval; HGI, glycated hemoglobin index.
Table 3. The value of HGI–DM system in predicting and evaluating the risk of stroke.
DMHigh HGIEvents/ParticipantsIncidence of Stroke
Crude HRsAdjusted HRs
HR (95% CI)pHR (95% CI)p
21/1276Reference-Reference-
+3/1311.601 (0.478–5.368)0.4461.138 (0.337–3.847)0.835
+47/13441.966 (1.173–3.295)0.0391.701 (0.337–3.847)0.036
++8/1832.566 (1.128–5.836)0.0252.655 (1.251–5.636)0.011
Cox proportional hazards models include age, gender, current smoking and drinking, hypertension, eGFR, TC, TG, HDL-C, and LDL-C. The subjects were divided into 4 subgroups by HGI level and DM status. ‘+’ means positive and ‘−’ means negative. Statistical significance was defined as p < 0.05 under two-tailed condition. Abbreviations: HR, hazard ratio; SD, standard deviation; CI, confidence interval; HGI, glycated hemoglobin index; DM, diabetes mellitus.
Table 4. Reclassification analysis of HGI in improving conventional stroke model.
Incident StrokeIDINRI
Conventional model--
Conventional model+ HGI0.012 (0.007–0.015)0.036 (0.0198–0.0522)
p value<0.001<0.001
Conventional model includes age, gender, current smoking and drinking, hypertension, DM, eGFR, TC, TG, HDL-C, and LDL-C. Abbreviations: IDI, integrated discrimination improvement; NRI, net reclassification index; HGI, glycated hemoglobin index.
Publisher’s Note: MDPI stays neutral with regard to jurisdictional claims in published maps and institutional affiliations.