Abstract
Investigation of pulmonary gas exchange efficacy usually requires arterial blood gas analysis (aBGA) to determine arterial partial pressure of oxygen (mPaO2) and compute the Riley alveolar-to-arterial oxygen difference (A-aDO2); that is a demanding and invasive procedure. A noninvasive approach (AGM100), allowing the calculation of PaO2 (cPaO2) derived from pulse oximetry (SpO2), has been developed, but this has not been validated in a large cohort of chronic obstructive pulmonary disease (COPD) patients. Our aim was to conduct a validation study of the AG100 in hypoxemic moderate-to-severe COPD. Concurrent measurements of cPaO2 (AGM100) and mPaO2 (EPOC, portable aBGA device) were performed in 131 moderate-to-severe COPD patients (mean ±SD FEV1: 60 ± 10% of predicted value) and low-altitude residents, becoming hypoxemic (i.e., SpO2 < 94%) during a short stay at 3100 m (Too-Ashu, Kyrgyzstan). Agreements between cPaO2 (AGM100) and mPaO2 (EPOC) and between the O2-deficit (calculated as the difference between end-tidal pressure of O2 and cPaO2 by the AGM100) and Riley A-aDO2 were assessed. Mean bias (±SD) between cPaO2 and mPaO2 was 2.0 ± 4.6 mmHg (95% Confidence Interval (CI): 1.2 to 2.8 mmHg) with 95% limits of agreement (LoA): −7.1 to 11.1 mmHg. In multivariable analysis, larger body mass index (p = 0.046), an increase in SpO2 (p < 0.001), and an increase in PaCO2-PETCO2 difference (p < 0.001) were associated with imprecision (i.e., the discrepancy between cPaO2 and mPaO2). The positive predictive value of cPaO2 to detect severe hypoxemia (i.e., PaO2 ≤ 55 mmHg) was 0.94 (95% CI: 0.87 to 0.98) with a positive likelihood ratio of 3.77 (95% CI: 1.71 to 8.33). The mean bias between O2-deficit and A-aDO2 was 6.2 ± 5.5 mmHg (95% CI: 5.3 to 7.2 mmHg; 95%LoA: −4.5 to 17.0 mmHg). AGM100 provided an accurate estimate of PaO2 in hypoxemic patients with COPD, but the precision for individual values was modest. This device is promising for noninvasive assessment of pulmonary gas exchange efficacy in COPD patients.
1. Introduction
In clinical practice, sampling arterial blood to measure the partial pressures of oxygen (PaO2) and carbon dioxide (PaCO2) remains a keystone to investigating pulmonary gas exchange abnormalities [1]. Additionally, using the Riley ideal alveolar partial pressure of oxygen (PAO2) equation [2], the traditional alveolar-to-arterial oxygen difference (A-aDO2) can be calculated [3]. This approach is, for instance, helpful to assess and follow up over time the decline of gas exchange accountable for diffusion or ventilation-to-perfusion ratio () impairments in patients with chronic lung diseases [4,5]. Furthermore, for these patients, the PaO2 value may lead to therapeutic decisions such as long-term oxygen therapy [6]. However, this traditional assessment strategy has some disadvantages: arterial puncture often remains a painful experience for patients, and puncture failure is not unusual [7]. Arterial blood gas analysis (aBGA) also requires expensive analyzers and trained operators, which is not compatible with an easy pulmonary gas exchange assessment outside hospital facilities. Thus, well-validated, reproductible, and easy-to-perform gas exchange assessment options are currently lacking [8].
Recently, a non-invasive approach for measuring the pulmonary gas exchange has been developed and commercialized (AGM100TM, MediPines Corp., Yorba Linda, CA, USA). AGM100 requires sampling partial pressure of end-tidal oxygen (PETO2) and carbon dioxide (PETCO2) during quiet and steady breathing (thus reflecting intra-alveolar values); the PaO2 is calculated (cPaO2) from oxygen saturation measured through a pulse oximeter (SpO2) using the oxygen–hemoglobin dissociation curve with a PaCO2-shift-correction based on PETCO2 values [9,10]. This approach allows the computation of the O2 deficit, defined as the difference between alveolar PO2 and cPaO2, which has been suggested to be a reliable surrogate of the conventional A-aDO2 and mismatch [11]. This O2 deficit has been shown indeed to strongly correlate with the conventional A-aDO2 in hypoxemic patients [12] and in healthy volunteers exercising in a hypoxic environment [13]. Moreover, the O2 deficit is elevated with normal ageing and augmented in patients with lung diseases when compared to healthy young volunteers [14,15]. Furthermore, the cPaO2 has been shown to be a valid estimation of the measured PaO2 (mPaO2) in healthy, hypoxic subjects achieving a progressive cycling test in normobaric hypoxia [13].
This new and non-invasive pulmonary gas exchange measurement may thus represent a promising method for the assessment of gas exchange impairment [8,11]. One small validation study (n = 23) reported a mean bias of −4 mmHg between cPaO2 and mPaO2 in a heterogeneous group of patients [12]. However, validation data and insights into the accuracy of such non-invasive measurements in particular are currently lacking in a large and homogenous population of patients suffering from chronic lung diseases, such as chronic obstructive pulmonary disease (COPD). COPD is a highly prevalent disease and represents the third leading cause of death worldwide [16,17]. In these patients, disease progression gradually leads to hypoxemia, mainly through impairments [18], which requires regular follow-up of pulmonary gas exchange efficiency, including aBGA [4,5,16].
Therefore, the aim of this diagnostic accuracy study was to compare the cPaO2 and O2 deficit obtained from the AGM100 to PaO2 and A-aDO2 obtained and calculated from aBGA in a homogenous population of COPD patients becoming hypoxemic during a short high-altitude sojourn.
2. Methods
2.1. Study Design and Participants
This study was conducted within a large research project conducted in Kyrgyzstan in 2021, which involved stable, moderate-to-severe COPD patients exposed to a high-altitude environment (High Altitude Clinic, Too-Ashu, 3100 m) during a 2-day period (ClinicalTrials.gov NCT03957759 and NCT04913389). The study was approved by the Ethics Committee of the National Center for Cardiology and Internal Medicine (01-2021, Bishkek, Kyrgyzstan) and was conducted in accordance with the Declaration of Helsinki. All participants were fully informed in their native language and provided a written consent.
Participants included were patients aged between 35 and 75 years, with stable, moderate-to-severe COPD diagnosed according to the Global initiative for Obstructive Lung Disease (GOLD) guidelines [16] with a forced expiratory volume in the first second of expiration (FEV1) between 40 and 80% of predicted value and a resting SpO2 < 94% at 3100 m. All patients were living at low altitude (<1000 m) and free of other unstable comorbidities.
2.2. Experimental Protocol
All measurements were conducted in a supine, bedrest position with the head at 10–20°. No position change was allowed between the AGM100 measurement and the arterial puncture. Measurements were conducted at different time points while patients were exposed to a hypobaric environment at 3100 m: (1) at 6:00 AM after the first night at 3100 m while patients were awake but still in bed or (2) in patients who prematurely, i.e., before the first night at high altitude, experienced an altitude-related adverse health effect (ARAHE, a composite criterion including a severe hypoxemia defined as resting SpO2 < 80% over 30 min or a resting SpO2 < 75% over 15 min) [19]. In case of an ARAHE, AGM100 measurement and aBGA were performed before starting oxygen therapy or after stopping oxygen therapy for at least 20 min. Procedures were standardized as follows:
- -
- Non-invasive AGM100 measurement was first performed: participants were asked to breathe through a mouthpiece (with a nose clip) to record PETO2 and PETCO2, while SpO2 was continuously measured with a finger pulse oximeter, connected to the device. After automatic detection of a breathing steady-state, the measurement was automatically stopped and values for SpO2, PETO2, and PETCO2 were recorded, and the cPaO2 and O2 deficit were calculated [10,11].
- -
- Immediately after the AGM100 measurement, an arterial blood sample was collected by radial artery puncture while participants were breathing ambient air. Each sample was analyzed using a point-of-care blood gas analyzer (EPOC®, Siemens Healthcare, Erlangen, Germany). PaO2, PaCO2, and arterial pH were analyzed. The EPOC has been previously validated in a high-altitude environment [20].
Using the mPaO2 from the EPOC, the conventional A-aDO2 was calculated [1]. Calculated PAO2 (cPAO2) was obtained using the alveolar gas equation [3]: where the respiratory exchange ratio (RER) was assumed to be equal to 0.8; PAtm represents the atmospheric pressure; and PH2O represents the saturated water vapor pressure at 37 °C (47 mmHg).
2.3. Clinical Assessment
For each patient, the medical history was obtained, and a clinical examination was performed prior to the inclusion in the main study at low altitude (Bishkek, Kyrgyzstan, 760 m). At the same time, spirometry was performed to confirm the airflow obstruction and COPD severity according to standard guidelines [21]. Severity of COPD was classified according to the GOLD grade [16]. Assessment of breathlessness and life-impact of COPD were evaluated using the modified British medical research council (mMRC) and the COPD assessment test (CAT) scores [16].
2.4. Outcomes
The main outcome of this validation study was the accuracy and precision of cPaO2 (AGM100) in comparison to mPaO2 (EPOC). Secondary outcomes included the identification of factors associated with the imprecision of the cPaO2 estimation, the diagnostic performance of the AGM100 to detect a predefined severe resting hypoxemia, and the agreement between the O2 deficit (AGM100) and the A-aDO2 (EPOC).
2.5. Statistical Analysis
Data reporting: continuous variables are presented as mean ± standard deviation (SD) or median (25–75th percentiles) as appropriate. Categorical variables were reported in numbers and percentages (%).
Agreement analysis between AGM100 and EPOC: agreement between cPaO2 (AGM100) and mPaO2 (EPOC), between PETCO2 (AGM100) and mPaCO2 (EPOC), and between O2 deficit (AGM100) and A-aDO2 (EPOC) were assessed using linear regression analyses, computation of Pearson correlation coefficients, and Bland–Altman plotting [22]. As an estimate of accuracy, mean bias ± SD with 95% confidence interval (CI) was calculated; as an estimate of precision, the upper and lower limits of agreements (LOA) were computed [23]. The possibility of a proportional bias was evaluated using a linear regression analysis on the Bland–Altman plot [23]. Bland–Altman was plotted considering the absolute difference against the mean value for PaO2, whereas absolute difference between O2 deficit and A-aDO2 was plotted against A-aDO2, considering A-aDO2 as the “gold standard” [24]. Furthermore, as PETCO2 is used as a surrogate of PaCO2 to correct the cPaO2 from SpO2 [9,10], agreement between the two values was also assessed using both linear regression and Bland–Altman plotting.
Sensitivity analysis: since aBGA point-of-care devices as EPOC may not be considered as accurate as stationary devices, we conducted a sensitivity analysis for PaO2 and A-aDO2 agreements, using a corrected value of mPaO2 computed from the regression equation developed in a previous validation study of the EPOC, conducted in similar field conditions [20].
Multivariable regression analysis: to assess confounding factors that may explain a discrepancy between cPaO2 and mPaO2, we performed a multivariable regression analysis, considering the difference between the two values as the dependent variable and age, sex, body mass index, SpO2, and time delay between the two measurements and PaCO2-PETCO2 gradient as potential explanatory variables. A parsimonious model was built using a backward stepwise elimination of the most non-significant variables; therefore, the only significant explanatory variables were retained in the final model.
Diagnosis performance: the predictive performance of the AGM100 to detect predefined severe resting hypoxemia of PaO2 < 60 mmHg and PaO2 ≤ 55 mmHg (versus EPOC mPaO2) was investigated by computation of the sensitivity (Sn), specificity (Sp), positive predictive value (PPV), negative predictive value (NPV), and positive likelihood ratio (LR+). Both hypoxemia thresholds are commonly admitted for home oxygen therapy in COPD [6].
All tests were two-sided, and a p-value < 0.05 or a 95% CI excluding zero was considered statistically significant. All statistical analyses were performed using R software (version 4.1.2, The R Foundation for Statistical Computing, Vienna, Austria) and GraphPad Prism (version 9.3.1, GraphPad Software, Boston, MA, USA).
3. Results
3.1. Measurements and Patients Included in the Study
During the study period, 153 single AGM100 measurements were performed in 153 COPD patients sojourning at 3100 m. Among them, 12 were not paired with an aBGA due to arterial puncture failures (n = 12, 8% failure rate), and 10 measurements were excluded from the analysis due to a SpO2 ≥ 94% at the time of measurement. Thus, 131 paired AGM100-EPOC measurements obtained from 131 COPD patients were included in the analysis. Among them, 110 measurements (84%) were preplanned measurements (i.e., conducted at 06:00 AM after the first night at 3100 m), whereas 21 measurements (16%) were non-planned measurements performed when experiencing an ARAHE (mostly isolated severe hypoxemia). A steady-state was automatically reached in 65 (60–81) seconds, for all, except one, measurements. Median delay between the end of the AGM100 measurement and the arterial puncture was 217 (153–384) seconds, and aBGA was performed at 163 (109–285) seconds after the arterial puncture. Mean SpO2 at the time of the AGM100 measurement was 87 ± 4% (range: 74 to 93%). Demographic characteristics of the patients are presented in the Table 1.

Table 1.
Participant characteristics.
3.2. PaO2 Agreement between cPaO2 (AGM100) and mPaO2 (EPOC)
A moderate but significant correlation was observed between cPaO2 and mPaO2 (Figure 1A). Furthermore, the two methods showed good accuracy with a low mean positive bias, albeit significant (Figure 1B and Table 2), but a low precision according to the large variability (Figure 1B and Table 2). Linear regression analysis (Figure 1B) highlighted a proportional bias, which increased with higher values of PaO2 (p = 0.004). Sensitivity analysis using the corrected mPaO2 (Table 2) did not show any improvement in agreement between the two values, with a low mean negative bias.
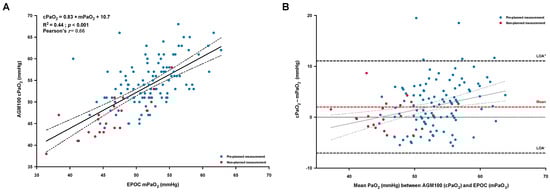
Figure 1.
Linear regression and correlation (A) between the measured arterial PaO2 (mPaO2) with the portable blood gas analyzer (EPOC) and the calculated PaO2 (cPaO2) provided by the AGM100 device; the solid and dashed lines represent the regression line with the 95% confident interval limits. Bland–Altman plot of agreement (B) between the cPaO2 and the mPaO2, expressed as absolute differences vs. the mean of both measurements; the dashed lines represent the mean bias (in red) and the 95% limits of agreement (LOA, in black). Individual values were identified as pre-planned measurement (early morning after a first night at high altitude, blue solid circles) or as non-planned measurement (occurrence of an early altitude-related adverse health effect, red solid circles).
Table 2.
Agreement among parameters derived from the AGM100 and EPOC devices.
3.3. Agreement between PETCO2 (AGM100) and PaCO2 (EPOC)
A moderate and significant correlation was shown between the mPaCO2 and the PETCO2 (Figure 2A). Bland–Altman analysis (Figure 2B) among the two variables highlighted a low and significant mean bias of −3.1 ± 2.7 mmHg (95% CI, −3.5 to −2.6 mmHg), which increased with higher values of PaCO2 (p = 0.004).
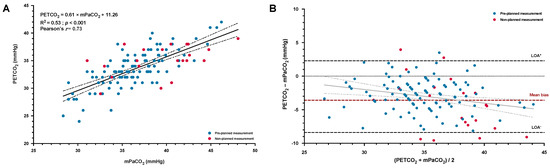
Figure 2.
Linear regression and correlation (A) between the measured arterial PaCO2 (mPaCO2) with the portable blood gas analyzer (EPOC) and the end-tidal CO2 (PETCO2) obtained from the AGM100; the solid and dashed lines represent the regression line with the 95% confident interval limits. Bland–Altman plot of agreement (B) between the PETCO2 and the mPaCO2, plotted as absolute differences vs. the mean of both measurements; the dashed lines represent the mean bias (in red) and the 95% limits of agreement (LOA, in black). Individual values were identified as pre-planned measurement (early morning after a first night at high altitude, blue solid circles) or as non-planned measurement (occurrence of an early altitude-related adverse health effect, red solid circles).
3.4. Factors Associated with the Accuracy of the cPaO2 and Diagnosis Performance
Multivariable linear analysis including both demographic and procedural factors (Table 3) highlighted that the increase in body mass index and in PaCO2-PETCO2 gradient were positively associated with an increase in discrepancy between cPaO2 and mPaO2. Conversely, lower SpO2 were independently associated with a better accuracy (i.e., a lower absolute difference) between cPaO2 and mPaO2. When considering the predictive diagnosis performance (Table 4), the AGM100 device showed a high PPV to detect a severe resting hypoxemia for both considered thresholds of PaO2.
Table 3.
Multivariable linear analysis of factors associated with the discrepancy between cPaO2 and mPaO2.
Table 4.
Diagnostic accuracy of the AGM100 device to diagnose severe resting hypoxemia in COPD.
3.5. Agreement between O2 Deficit and A-aDO2
Patients exhibited larger values for O2 deficit than for A-aDO2 (11.8 ± 6.1 vs. 5.5 ± 4.8 mmHg, respectively, p < 0.001) that seemed mostly explained by the difference between measured PETO2 and cPAO2 (mean difference: 8.2 ± 4.4 mmHg, 95% CI, 7.4 to 8.9 mmHg), rather than by the difference between cPaO2 and mPaO2 (mean difference: 2.0 ± 4.6 mmHg, 95% CI, 1.2 to 2.8 mmHg). O2 deficit showed a moderate but significant correlation with A-aDO2 (Figure 3A) with a global positive and significant mean bias of 6.2 ± 5.5 mmHg (Table 2 and Figure 3B). Neither O2 deficit nor A-aDO2 were significantly correlated with pulmonary function (FEV1 and FVC, all p > 0.05). Sensitivity analysis using the corrected values of mPaO2 to compute A-aDO2 (Table 2) led to a larger bias among the two parameters.
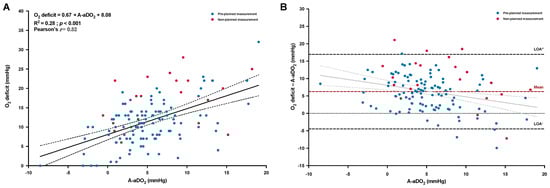
Figure 3.
Linear regression and correlation (A) between the traditional alveolar-to-arterial oxygen difference (A-aDO2) and the oxygen deficit (O2 deficit); the solid and dashed lines represent the regression line with the 95% confident interval limits. Bland–Altman plot of agreement (B) between the O2 deficit and the A-aDO2, plotted as the absolute difference vs. A-aDO2; the dashed lines represent the mean bias (in red) and the 95% limits of agreement (LOA, in black). Individual values were identified as pre-planned measurement (early morning after a first night at high altitude, blue solid circles) or as non-planned measurement (occurrence of an early altitude-related adverse health effect, red solid circles).
4. Discussion
Until now, reports of clinical application of the AGM100 remained anecdotal and confined to patients with acute respiratory failure [25,26], mainly due to the novelty of this method. To the best of our knowledge, this research represents the widest validation study of such non-invasive gas exchange assessment method in a homogenous cohort of hypoxemic patients with moderate-to-severe COPD, following a short high-altitude exposure. The main findings indicate the ability of the AGM100 to predict PaO2 (with an absolute low mean bias of 2 mmHg versus measured PaO2 with a previously validated point-of-care analyzer [20]) and the satisfying diagnosis predictive performance (Table 4) of this device to diagnose severe resting hypoxemia. Moreover, the AGM100 provides an estimation of the pulmonary gas exchange efficacy through the O2 deficit. Taken together, these results suggest that this non-invasive method may serve as a tool to investigate gas exchanges in hypoxemic COPD patients. Such option may be particularly relevant when aBGA are not available or fail.
Despite our promising results, some aspects of the agreement between methods need to be discussed. Even though we reported a similar positive mean bias (2.0 ± 4.6 mmHg) to the one previously reported in a small and heterogenous sample of 23 hypoxemic patients (2.7 ± 7.0 mmHg) [12], the accuracy reported by Howe et al. [13] in healthy volunteers via an intra-arterial catheter during rest and exercise in hypoxia was slightly better (mean bias of 1.0 ± 2.8 mmHg). Moreover, the precision of the cPaO2 could probably be improved, as suggested by our results, regarding the high observed dispersion around the mean bias, albeit concordant with previous results [12]. In particular, we identified that the inaccuracy (i.e., the increase in cPaO2-mPaO2 difference) of the measurement was independently associated with the difference between PaCO2 and PETCO2. This statistical relationship may partially explain some errors in the estimated PaO2, as the algorithm of the AGM100, considering the Bohr effect, corrects the cPaO2 using the PETCO2 [10,11]. Measurement of PETCO2 in healthy people breathing a hypoxic mixture has been shown to be highly reproducible and can be considered as a reliable surrogate of PaCO2 [27]. However, the reliability of this estimation may be lower in patients with abnormalities such as COPD [28], being even more pronounced at altitude (as reflected by an increase in dead space fraction) [29]. The previously suggested relative inability of the AGM100 to compute an accurate cPaO2 in a non-hypoxemic patient (due to the flat portion of the hemoglobin dissociation curve) [9,14,15] was evidenced in our study by the proportional bias (Figure 1B) and by the independent association between greater SpO2 and larger divergence between cPaO2 and mPaO2. However, as previously emphasized, this technical limitation is, by itself, not a major problem because gas exchange impairments are unlikely in non-hypoxemic subjects [27]. Therefore, according to previous studies [12,14,15], we did not include non-hypoxemic COPD patients (SpO2 ≥ 94%) at the time of the pre-planned aBGA.
The O2 deficit, promptly computed by the AGM100 from the measured PETO2 and cPaO2 may represent another important clinical parameter similar to A-aDO2 to investigate the underlying mechanisms of hypoxemia [11]. Such alternative may also be a paradigm shift compared to the A-aDO2, since PaO2 and PAO2 are inversely calculated or measured among the two methods [9,11]. This allows the O2 deficit option to better considers lung units with high ratios compared to the A-aDO2 [9,11,27]. This may be of particular interest in chronic lung diseases with mismatches, especially in patients with COPD and emphysematous phenotype that typically leads to pulmonary areas with high ratio [18,30]. Thus, as expected and previously reported, we observed larger values for O2 deficit than for A-aDO2 [12,13]. Furthermore, COPD patients included in our study exhibited higher O2 deficit than healthy young subjects breathing a 12.5% O2 mixture (corresponding to an elevation of ~3800 m) [15] and older people in similar conditions [31] but remained lower than measured in hospitalized patients [12]. The positive difference between O2 deficit and A-aDO2 observed in our study was mainly explained by a larger discrepancy between PETO2 and cPAO2 rather than between cPaO2 and mPaO2. This observation indicates that, in our cohort of COPD patients, the ideal cPAO2 (that did not consider the contribution of the lung units with high ratio) underestimated the true mixed value of alveolar PO2. Other methodological consideration may include that the alveolar gas equation assumed a resting RER value of 0.8 [3], which was probably underestimated at high altitude, leading to underestimating the “true” PAO2 value. Thus, this pitfall may also explain the aberrant negative A-aDO2 values observed (Figure 3A), as also noted in the study conducted by Howe et al. in healthy people [13]. Nevertheless, a significant (but moderate) relationship was still observed between O2 deficit and A-aDO2 (Figure 3A) as previously shown [12,13]. We acknowledge, however, that this relationship and exploration of the agreement of O2 deficit and A-aDO2 is somewhat limited due to the inclusion of negative values from the A-aDO2 measures (that are due to technical rather than physiological differences), and PaO2 and PAO2 are inversely calculated or measured among the two methods; therefore, unlike PaO2, there is no real gold-standard comparison.
Our study has some methodological limitations. One may argue that the two measurements were not conducted simultaneously, and then ventilation and gas exchange may have been altered during this timeframe. However, similar to a previous study [12], this delay was reduced to only a few minutes with no position change to avoid postural gas exchange modifications [32]. Otherwise, we did not exactly assess the skin pigmentation of the participants; that may be an inaccuracy factor in SpO2 measurement (and so in PaO2 computation by the AGM100) for the darkest skin tones [33]. However, patients included in the present study, all natives from Kyrgyzstan in Central Asia, had skin tones mostly ranging from fair to moderate-brown skin (type II to IV on the Fitzpatrick scale) that probably did not induce significant SpO2 misestimations.
Another potential limitation for the transposition of our findings to clinical settings (i.e., the use of the AGM100 for long-term follow-up or acute assessment during COPD exacerbation) is that the primary mechanism of hypoxemia in our study is mainly driven by a decrease in PAO2 due to the hypobaric environment without any other cause of worsening hypoxemia (mainly involved in acute or chronic decrease in gas exchange efficiency in COPD). However, impairment of gas exchange in patients with COPD exposed to high altitude may also involve diffusion limitation and worsening of pulmonary hypertension [34,35].
5. Conclusions
The AGM100 proved a reliable and promising non-invasive method of gas exchange assessment in a large population of hypoxemic patients with moderate-to-severe COPD exposed to high altitude. These findings may be of strong interest for long-term follow-up, repetitive, or acute assessments of pulmonary gas exchange, especially in places where medical resources are limited. Further studies are required to specify the potential usefulness and added clinical value of the non-invasive gas exchange assessment in COPD patients or other chronic respiratory diseases. Especially, the ability of the AGM100 to estimate gas exchange changes over the time versus changes measured by aBGA remains to be investigated.
Author Contributions
Conceptualization, B.C., L.R., P.N.A., S.V. and M.F.; Formal analysis, B.C. and M.M. (Mathieu Marillier); Funding acquisition, S.U., K.E.B., S.V. and M.F.; Investigation, B.C., L.R., M.M. (Maamed Mademilov), T.U., A.F.C., P.S., S.B.S., U.U.S., A.K.A., K.M.M., G.M., A.T.T., A.K.O., A.O.E., N.U.S., S.A.A. and M.F.; Methodology, B.C., P.N.A., S.V. and M.F.; Project administration, T.M.S., S.U., K.E.B., S.V. and M.F.; Resources, M.M. (Maamed Mademilov), P.N.A., T.M.S., S.U., K.E.B. and M.F.; Supervision, B.C., M.M. (Maamed Mademilov), T.M.S., S.U., K.E.B., S.V. and M.F.; Validation, B.C.; Visualization, B.C., L.R., M.M. (Mathieu Marillier), P.N.A. and M.F.; Writing—original draft, B.C., L.R. and M.F.; Writing—review and editing, M.M. (Maamed Mademilov), M.M. (Mathieu Marillier), T.U., A.F.C., P.S., S.B.S., U.U.S., A.K.A., K.M.M., G.M., A.T.T., A.K.O., A.O.E., N.U.S., S.A.A., P.N.A., T.M.S., S.U., K.E.B. and S.V. All authors have read and agreed to the published version of the manuscript.
Funding
Samuel Vergès is supported by the Grenoble Alpes University foundation, the “Fonds de dotation AGIR pour les maladies chroniques” and by the French National Research Agency (ANR-12-TECS-0010) in the framework of the “Investissements d’avenir” program (ANR-15-IDEX-02). Michael Furian is supported by the Swiss National Science Foundation Fellowship “Postdoc.Mobility” (191029). Michael Furian, Konrad E. Bloch, and Silvia Ulrich are supported by the Swiss National Science Foundation project grant (192048). Devices and consumables used for this study were kindly provided by MediPines Corporation (Newport Beach, CA, USA). However, the sponsor had no further involvement in any steps of the study (study design, collection, and analysis of the data or writing of the manuscript).
Institutional Review Board Statement
The study was approved by the Ethics Committee of the National Center for Cardiology and Internal Medicine (01-2021, Bishkek, Kyrgyzstan) and was conducted in accordance with the Declaration of Helsinki.
Informed Consent Statement
Written informed consent was obtained from all subjects involved in the study.
Data Availability Statement
Data are available upon reasonable request to the corresponding author.
Conflicts of Interest
Pr. Silvia Ulrich receives grants from the Swiss National Science Foundation, Zurich Lung, Swiss Lung League, and EMDO Foundation and grants, speaker and advisory fees, and travel support from Orpha Swiss, MSD SA, Janssen, and Novartis not related to the present work.
References
- Wagner, P.D. The physiological basis of pulmonary gas exchange: Implications for clinical interpretation of arterial blood gases. Eur. Respir. J. 2015, 45, 227–243. [Google Scholar] [CrossRef] [PubMed]
- Riley, R.L.; Cournand, A. ‘Ideal’ Alveolar Air and the Analysis of Ventilation-Perfusion Relationships in the Lungs. J. Appl. Physiol. 1949, 1, 825–847. [Google Scholar] [CrossRef] [PubMed]
- Petersson, J.; Glenny, R.W. Gas exchange and ventilation-perfusion relationships in the lung. Eur. Respir. J. 2014, 44, 1023–1041. [Google Scholar] [CrossRef]
- Uemasu, K.; Sato, S.; Muro, S.; Sato, A.; Tanabe, N.; Hasegawa, K.; Hamakawa, Y.; Mizutani, T.; Fuseya, Y.; Tanimura, K.; et al. Annual decline in arterial blood oxygen predicts development of chronic respiratory failure in COPD with mild hypoxaemia: A 6-year follow-up study. Respirology 2019, 24, 262–269. [Google Scholar] [CrossRef] [PubMed]
- Agusti, A.; Faner, R. Lung function trajectories in health and disease. Lancet Respir. Med. 2019, 7, 358–364. [Google Scholar] [CrossRef]
- Hardinge, M.; Annandale, J.; Bourne, S.; Cooper, B.; Evans, A.; Freeman, D.; Green, A.; Hippolyte, S.; Knowles, V.; MacNee, W.; et al. British Thoracic Society guidelines for home oxygen use in adults. Thorax 2015, 70 (Suppl. S1), i1–i43. [Google Scholar] [CrossRef]
- Giner, J.; Casan, P.; Belda, J.; González, M.; Miralda, R.M.; Sanchis, J. Pain During Arterial Puncture. Chest 1996, 110, 1443–1445. [Google Scholar] [CrossRef]
- Pickerodt, P.A.; Kuebler, W.M. Go West: Translational physiology for noninvasive measurement of pulmonary gas exchange in patients with hypoxemic lung disease. Am. J. Physiol. Lung. Cell. Mol. Physiol. 2019, 316, L701–L702. [Google Scholar] [CrossRef]
- West, J.B.; Prisk, G.K. A new method for noninvasive measurement of pulmonary gas exchange using expired gas. Resp. Physiol. Neurobiol. 2018, 247, 112–115. [Google Scholar] [CrossRef]
- Prisk, G.K.; West, J.B. Deriving the arterial Po2 and oxygen deficit from expired gas and pulse oximetry. J. Appl. Physiol. 2019, 127, 1067–1074. [Google Scholar] [CrossRef]
- Prisk, G.K.; West, J.B. Non-invasive Measurement of Pulmonary Gas Exchange Efficiency: The Oxygen Deficit. Front. Physiol. 2021, 12, 757857. [Google Scholar] [CrossRef]
- West, J.B.; Wang, D.L.; Prisk, G.K.; Fine, J.M.; Bellinghausen, A.; Light, M.; Crouch, D.R. Noninvasive measurement of pulmonary gas exchange: Comparison with data from arterial blood gases. Am. J. Physiol. Lung. Cell. Mol. Physiol. 2019, 316, L114–L118. [Google Scholar] [CrossRef]
- Howe, C.A.; MacLeod, D.B.; Wainman, L.; Oliver, S.J.; Ainslie, P.N. Validation of a Noninvasive Assessment of Pulmonary Gas Exchange During Exercise in Hypoxia. Chest 2020, 158, 1644–1650. [Google Scholar] [CrossRef]
- West, J.B.; Crouch, D.R.; Fine, J.M.; Makadia, D.; Wang, D.L.; Prisk, G.K. A New, Noninvasive Method of Measuring Impaired Pulmonary Gas Exchange in Lung Disease: An Outpatient Study. Chest 2018, 154, 363–369. [Google Scholar] [CrossRef]
- West, J.B.; Wang, D.L.; Prisk, G.K. Measurements of pulmonary gas exchange efficiency using expired gas and oximetry: Results in normal subjects. Am. J. Physiol. Lung. Cell. Mol. Physiol. 2018, 314, L686–L689. [Google Scholar] [CrossRef]
- Global Strategy for the Diagnosis, Management, and Prevention of Chronic Obstructive Pulmonary Disease(2022 Report). Available online: https://goldcopd.org/wp-content/uploads/2021/12/GOLD-REPORT-2022-v1.1-22Nov2021_WMV.pdf (accessed on 16 January 2023).
- Chronic Obstructive Pulmonary Disease (COPD). Available online: https://www.who.int/news-room/fact-sheets/detail/chronic-obstructive-pulmonary-disease-(copd) (accessed on 16 January 2023).
- Kent, B.D.; Mitchell, P.D.; McNicholas, W.T. Hypoxemia in patients with COPD: Cause, effects, and disease progression. Int. J. Chronic. Obs. Pulmon. Dis. 2011, 6, 199–208. [Google Scholar]
- Furian, M.; Mademilov, M.; Buergin, A.; Scheiwiller, P.M.; Mayer, L.; Schneider, S.; Emilov, B.; Lichtblau, M.; Bitos, K.; Muralt, L.; et al. Acetazolamide to Prevent Adverse Altitude Effects in COPD and Healthy Adults. Nejm. Évid. 2022, 1. [Google Scholar] [CrossRef]
- Nawrocki, J.; Furian, M.; Buergin, A.; Mayer, L.; Schneider, S.R.; Mademilov, M.; Bloch, M.; Sooronbaev, T.M.; Ulrich, S.; Bloch, K.E. Validation of a Portable Blood Gas Analyzer for Use in Challenging Field Conditions at High Altitude. Front. Physiol. 2021, 11, 600551. [Google Scholar] [CrossRef]
- Graham, B.L.; Steenbruggen, I.; Miller, M.R.; Barjaktarevic, I.Z.; Cooper, B.G.; Hall, G.L.; Hallstrand, T.S.; Kaminsky, D.A.; McCarthy, K.; McCormack, M.C.; et al. Standardization of Spirometry 2019 Update. An Official American Thoracic Society and European Respiratory Society Technical Statement. Am. J. Resp. Crit. Care 2019, 200, e70–e88. [Google Scholar] [CrossRef]
- Bland, J.M.; Altman, D.G. Statistical methods for assessing agreement between two methods of clinical measurement. Lancet 1986, 327, 307–310. [Google Scholar] [CrossRef]
- Montenij, L.J.; Buhre, W.F.; Jansen, J.R.; Kruitwagen, C.L.; EE de, W. Methodology of method comparison studies evaluating the validity of cardiac output monitors: A stepwise approach and checklist. Bja. Br. J. Anaesth. 2016, 116, 750–758. [Google Scholar] [CrossRef] [PubMed]
- Giavarina, D. Understanding Bland Altman analysis. Biochem. Med. 2015, 25, 141–151. [Google Scholar] [CrossRef] [PubMed]
- Mcguire, W.C.; Crouch, D.R.; Pearce, A.; West, J.B.; Prisk, G.K.; Elliott, A.R.; Fine, J.M.; Malhotra, A. The Use of the Alveolar Gas Meter for Assessment of Gas Exchange Abnormalities in COVID-19. Am. J. Respir. Crit. Care. Med. 2021, 203, A4454. [Google Scholar]
- Amaza, I.; Kalra, H.; Eberlein, M.; Jethava, Y.; McDonell, J.; Wolfe, B.; Tomasson, M.H.; Bates, M.L. Case Studies in Physiology: Untangling the cause of hypoxemia in a patient with obesity with acute leukemia. J. Appl. Physiol. 2021, 131, 788–793. [Google Scholar] [CrossRef] [PubMed]
- West, J.B.; Liu, M.A.; Stark, P.C.; Prisk, G.K. Measuring the efficiency of pulmonary gas exchange using expired gas instead of arterial blood: Comparing the “ideal” Po2 of Riley with end-tidal Po2. Am. J. Physiol. Lung Cell. Mol. Physiol. 2020, 319, L289–L293. [Google Scholar] [CrossRef]
- Cao, M.; Stringer, W.W.; Corey, S.; Orogian, A.; Cao, R.; Calmelat, R.; Lin, F.; Casaburi, R.; Rossiter, H.B.; Porszasz, J. Transcutaneous PCO2 for Exercise Gas Exchange Efficiency in Chronic Obstructive Pulmonary Disease. Copd. J. Chronic. Obs. Pulm. Dis. 2020, 18, 16–25. [Google Scholar] [CrossRef]
- Furian, M.; Hartmann, S.E.; Latshang, T.D.; Flueck, D.; Murer, C.; Scheiwiller, P.M.; Osmonov, B.; Ulrich, S.; Kohler, M.; Poulin, M.J.; et al. Exercise Performance of Lowlanders with COPD at 2590 m: Data from a Randomized Trial. Respiration 2018, 95, 422–432. [Google Scholar] [CrossRef]
- Neder, J.A.; Kirby, M.; Santyr, G.; Pourafkari, M.; Smyth, R.; Phillips, D.B.; Crinion, S.; de-Torres, J.P.; O’Donnell, D.E. Ventilation/Perfusion Mismatch: A Novel Target for COPD Treatment. Chest 2022, 162, 1030–1047. [Google Scholar] [CrossRef]
- Liu, M.A.; Stark, P.C.; Prisk, G.K.; West, J.B. Oxygen deficit is a sensitive measure of mild gas exchange impairment at inspired O2 between 12.5% and 21%. Am. J. Physiol. Lung Cell. Mol. Physiol. 2020, 319, L91–L94. [Google Scholar] [CrossRef]
- Kuenzel, A.; Marshall, B.; Verges, S.; Anholm, J.D. Positional Changes in Arterial Oxygen Saturation and End-Tidal Carbon Dioxide at High Altitude: Medex 2015. High. Alt. Med. Biol. 2020, 21, 144–151. [Google Scholar] [CrossRef]
- Jamali, H.; Castillo, T.L.; Morgan, C.C.; Coult, J.; Muhammad, J.L.; Osobamiro, O.O.; Parsons, E.C.; Adamson, R. Racial Disparity in Oxygen Saturation Measurements by Pulse Oximetry: Evidence and Implications. Ann. Am. Thorac. Soc. 2022, 19, 1951–1964. [Google Scholar] [CrossRef]
- Lichtblau, M.; Latshang, T.D.; Furian, M.; Müller-Mottet, S.; Küest, S.; Tanner, F.; Grünig, E.; Bloch, K.E.; Ulrich, S. Right and Left Heart Function in Lowlanders with COPD at Altitude: Data from a Randomized Study. Respiration 2019, 97, 125–134. [Google Scholar] [CrossRef]
- Furian, M.; Flueck, D.; Latshang, T.D.; Scheiwiller, P.M.; Segitz, S.D.; Mueller-Mottet, S.; Murer, C.; Steiner, A.; Uirich, S.; Rothe, T.; et al. Exercise performance and symptoms in lowlanders with COPD ascending to moderate altitude: Randomized trial. Int. J. Chron. Obs. Pulmon. Dis. 2018, 13, 3529–3538. [Google Scholar] [CrossRef]


Disclaimer/Publisher’s Note: The statements, opinions and data contained in all publications are solely those of the individual author(s) and contributor(s) and not of MDPI and/or the editor(s). MDPI and/or the editor(s) disclaim responsibility for any injury to people or property resulting from any ideas, methods, instructions or products referred to in the content. |
© 2023 by the authors. Licensee MDPI, Basel, Switzerland. This article is an open access article distributed under the terms and conditions of the Creative Commons Attribution (CC BY) license (https://creativecommons.org/licenses/by/4.0/).