
Screening for RV Dysfunction Using Smartphone ECG Analysis App: Validation Study with Acute Pulmonary Embolism Patients
 , , , , , and
Abstract
:1. Introduction
2. Methods
2.1. Study Design and Data Collection
2.2. Assessment of RV Function
2.3. ECG Analysis by AI Application
2.4. Expert Analysis of ECGs
2.5. Statistical Analysis
3. Results
4. Discussion
5. Conclusions
Supplementary Materials
Author Contributions
Funding
Institutional Review Board Statement
Informed Consent Statement
Data Availability Statement
Conflicts of Interest
References
- Members, A.F.; Torbicki, A.; Perrier, A.; Konstantinides, S.; Agnelli, G.; Galiè, N.; Pruszczyk, P.; Bengel, F.; Brady, A.J.B.; Ferreira, D.; et al. Guidelines on the Diagnosis and Management of Acute Pulmonary EmbolismThe Task Force for the Diagnosis and Management of Acute Pulmonary Embolism of the European Society of Cardiology (ESC). Eur. Heart J. 2008, 29, 2276–2315. [Google Scholar] [CrossRef]
- Konstantinides, S.V.; Meyer, G.; Becattini, C.; Bueno, H.; Geersing, G.-J.; Harjola, V.-P.; Huisman, M.V.; Humbert, M.; Jennings, C.S.; Jiménez, D.; et al. 2019 ESC Guidelines for the Diagnosis and Management of Acute Pulmonary Embolism Developed in Collaboration with the European Respiratory Society (ERS)The Task Force for the Diagnosis and Management of Acute Pulmonary Embolism of the European Society of Cardiology (ESC). Eur. Heart J. 2019, 41, 543–603. [Google Scholar] [CrossRef]
- Ryan, T.; Petrovic, O.; Dillon, J.C.; Feigenbaum, H.; Conley, M.J.; Armstrong, W.F. An Echocardiographic Index for Separation of Right Ventricular Volume and Pressure Overload. J. Am. Coll. Cardiol. 1985, 5, 918–924. [Google Scholar] [CrossRef] [PubMed]
- McConnell, M.V.; Solomon, S.D.; Rayan, M.E.; Come, P.C.; Goldhaber, S.Z.; Lee, R.T. Regional Right Ventricular Dysfunction Detected by Echocardiography in Acute Pulmonary Embolism. Am. J. Cardiol. 1996, 78, 469–473. [Google Scholar] [CrossRef] [PubMed]
- Rudski, L.G.; Lai, W.W.; Afilalo, J.; Hua, L.; Handschumacher, M.D.; Chandrasekaran, K.; Solomon, S.D.; Louie, E.K.; Schiller, N.B. Guidelines for the Echocardiographic Assessment of the Right Heart in Adults: A Report from the American Society of Echocardiography Endorsed by the European Association of Echocardiography, a Registered Branch of the European Society of Cardiology, and the Canadian Society of Echocardiography. J. Am. Soc. Echocardiogr. 2010, 23, 685–713. [Google Scholar] [CrossRef] [PubMed]
- Rodger, M.; Makropoulos, D.; Turek, M.; Quevillon, J.; Raymond, F.; Rasuli, P.; Wells, P.S. Diagnostic Value of the Electrocardiogram in Suspected Pulmonary Embolism. Am. J. Cardiol. 2000, 86, 807–809. [Google Scholar] [CrossRef] [PubMed]
- Geibel, A.; Zehender, M.; Kasper, W.; Olschewski, M.; Klima, C.; Konstantinides, S.V. Prognostic Value of the ECG on Admission in Patients with Acute Major Pulmonary Embolism. Eur. Respir. J. 2005, 25, 843–848. [Google Scholar] [CrossRef] [PubMed]
- Yao, X.; Rushlow, D.R.; Inselman, J.W.; McCoy, R.G.; Thacher, T.D.; Behnken, E.M.; Bernard, M.E.; Rosas, S.L.; Akfaly, A.; Misra, A.; et al. Artificial Intelligence–Enabled Electrocardiograms for Identification of Patients with Low Ejection Fraction: A Pragmatic, Randomized Clinical Trial. Nat. Med. 2021, 27, 815–819. [Google Scholar] [CrossRef] [PubMed]
- Attia, Z.I.; Kapa, S.; Yao, X.; Lopez-Jimenez, F.; Mohan, T.L.; Pellikka, P.A.; Carter, R.E.; Shah, N.D.; Friedman, P.A.; Noseworthy, P.A. Prospective Validation of a Deep Learning Electrocardiogram Algorithm for the Detection of Left Ventricular Systolic Dysfunction. J. Cardiovasc. Electrophysiol. 2019, 30, 668–674. [Google Scholar] [CrossRef]
- Choi, Y.J.; Park, M.J.; Ko, Y.; Soh, M.-S.; Kim, H.M.; Kim, C.H.; Lee, E.; Kim, J. Artificial Intelligence versus Physicians on Interpretation of Printed ECG Images: Diagnostic Performance of ST-Elevation Myocardial Infarction on Electrocardiography. Int. J. Cardiol. 2022, 363, 6–10. [Google Scholar] [CrossRef]
- Kim, D.; Jeong, J.; Kim, J.; Cho, Y.; Park, I.; Lee, S.-M.; Oh, Y.T.; Baek, S.; Kang, D.; Lee, E.; et al. Hyperkalemia Detection in Emergency Departments Using Initial ECGs: A Smartphone AI ECG Analyzer vs. Board-Certified Physicians. J. Korean Méd. Sci. 2023, 38, e322. [Google Scholar] [CrossRef]
- Lee, S.H.; Hong, W.P.; Kim, J.; Cho, Y.; Lee, E. Smartphone AI vs. Medical Experts: A Comparative Study in Prehospital STEMI Diagnosis. Yonsei Méd. J. 2024, 65, 174–180. [Google Scholar] [CrossRef]
- Park, M.J.; Choi, Y.J.; Shim, M.; Cho, Y.; Park, J.; Choi, J.; Kim, J.; Lee, E.; Kim, S.-Y. Performance of ECG-Derived Digital Biomarker for Screening Coronary Occlusion in Resuscitated Out-of-Hospital Cardiac Arrest Patients: A Comparative Study between Artificial Intelligence and a Group of Experts. J. Clin. Med. 2024, 13, 1354. [Google Scholar] [CrossRef] [PubMed]
- Ministry of Food and Drug Safety. Available online: https://emedi.mfds.go.kr/search/data/MNU20237 (accessed on 5 April 2024).
- Barman, H.A.; Atici, A.; Sahin, I.; Dogan, O.; Okur, O.; Tugrul, S.; Avci, I.; Yildirmak, M.T.; Gungor, B.; Dogan, S.M. Prognostic Value of Right Ventricular Strain Pattern on ECG in COVID-19 Patients. Am. J. Emerg. Med. 2021, 49, 1–5. [Google Scholar] [CrossRef]
- Raad, M.; Gorgis, S.; Dabbagh, M.; Chehab, O.; Parikh, S.; Singh, G. Right Heart Strain on Presenting 12-Lead Electrocardiogram Predicts Critical Illness in COVID-19. JACC Clin. Electrophysiol. 2021, 7, 485–493. [Google Scholar] [CrossRef] [PubMed]
- Jaff, M.R.; McMurtry, M.S.; Archer, S.L.; Cushman, M.; Goldenberg, N.; Goldhaber, S.Z.; Jenkins, J.S.; Kline, J.A.; Michaels, A.D.; Thistlethwaite, P.; et al. Management of Massive and Submassive Pulmonary Embolism, Iliofemoral Deep Vein Thrombosis, and Chronic Thromboembolic Pulmonary Hypertension. Circulation 2011, 123, 1788–1830. [Google Scholar] [CrossRef] [PubMed]
- Kucher, N.; Goldhaber, S.Z. Management of Massive Pulmonary Embolism. Circulation 2005, 112, e28–e32. [Google Scholar] [CrossRef] [PubMed]
- Chen, Y.-C.; Tsai, S.-C.; Lin, C.; Lin, C.-S.; Fang, W.-H.; Lou, Y.-S.; Lee, C.-C.; Liu, P.-Y. A Deep-Learning Algorithm-Enhanced Electrocardiogram Interpretation for Detecting Pulmonary Embolism. Acta Cardiol. Sin. 2022, 39, 913–928. [Google Scholar] [CrossRef]
- Kalmady, S.V.; Salimi, A.; Sun, W.; Sepehrvand, N.; Nademi, Y.; Bainey, K.; Ezekowitz, J.; Hindle, A.; McAlister, F.; Greiner, R.; et al. Development and Validation of Machine Learning Algorithms Based on Electrocardiograms for Cardiovascular Diagnoses at the Population Level. npj Digit. Med. 2024, 7, 133. [Google Scholar] [CrossRef]
- Ose, B.; Sattar, Z.; Gupta, A.; Toquica, C.; Harvey, C.; Noheria, A. Artificial Intelligence Interpretation of the Electrocardiogram: A State-of-the-Art Review. Curr. Cardiol. Rep. 2024, 26, 561–580. [Google Scholar] [CrossRef]
- Somani, S.S.; Honarvar, H.; Narula, S.; Landi, I.; Lee, S.; Khachatoorian, Y.; Rehmani, A.; Kim, A.; Freitas, J.K.D.; Teng, S.; et al. Development of a Machine Learning Model Using Electrocardiogram Signals to Improve Acute Pulmonary Embolism Screening. Eur. Heart J. Digit. Health 2021, 3, 56–66. [Google Scholar] [CrossRef] [PubMed]
- Silva, B.V.; Marques, J.; Menezes, M.N.; Oliveira, A.L.; Pinto, F.J. Artificial Intelligence-Based Diagnosis of Acute Pulmonary Embolism: Development of a Machine Learning Model Using 12-Lead Electrocardiogram. Rev. Port. Cardiol. 2023, 42, 643–651. [Google Scholar] [CrossRef] [PubMed]
- Wysokinski, W.E.; Meverden, R.A.; Lopez-Jimenez, F.; Harmon, D.M.; Inojosa, B.J.M.; Suarez, A.B.; Liu, K.; Inojosa, J.R.M.; Casanegra, A.I.; McBane, R.D.; et al. Electrocardiogram Signal Analysis with a Machine Learning Model Predicts the Presence of Pulmonary Embolism with Accuracy Dependent on Embolism Burden. Mayo Clin. Proc. Digit. Health 2024, in press. [Google Scholar] [CrossRef]
- Vieillard-Baron, A.; Matthay, M.; Teboul, J.L.; Bein, T.; Schultz, M.; Magder, S.; Marini, J.J. Experts’ Opinion on Management of Hemodynamics in ARDS Patients: Focus on the Effects of Mechanical Ventilation. Intensive Care Med. 2016, 42, 739–749. [Google Scholar] [CrossRef] [PubMed]
- Ghignone, M.; Girling, L.; Prewitt, R.M. Volume Expansion versus Norepinephrine in Treatment of a Low Cardiac Output Complicating an Acute Increase in Right Ventricular Afterload in Dogs. Anesthesiology 1984, 60, 132–135. [Google Scholar] [CrossRef] [PubMed]
- Schneider, A.J.; Teule, G.J.J.; Groeneveld, A.B.J.; Nauta, J.; Heidendal, G.A.K.; Thijs, L.G. Biventricular Performance during Volume Loading in Patients with Early Septic Shock, with Emphasis on the Right Ventricle: A Combined Hemodynamic and Radionuclide Study. Am. Heart J. 1988, 116, 103–112. [Google Scholar] [CrossRef] [PubMed]
- Dessap, A.M.; Boissier, F.; Charron, C.; Bégot, E.; Repessé, X.; Legras, A.; Brun-Buisson, C.; Vignon, P.; Vieillard-Baron, A. Acute Cor Pulmonale during Protective Ventilation for Acute Respiratory Distress Syndrome: Prevalence, Predictors, and Clinical Impact. Intensive Care Med. 2016, 42, 862–870. [Google Scholar] [CrossRef]
- Ghio, S.; Gavazzi, A.; Campana, C. Independent and Additive Prognostic Value of Right Ventricular Systolic Function and Pulmonary Artery Pressure in Patients with Chronic Heart Failure. ACC Curr. J. Rev. 2001, 10, 56. [Google Scholar] [CrossRef]
- Giusca, S.; Jurcut, R.; Ticulescu, R.; Dumitru, D.; Vladaia, A.; Savu, O.; Voican, A.; Popescu, B.A.; Ginghina, C. Accuracy of Handheld Echocardiography for Bedside Diagnostic Evaluation in a Tertiary Cardiology Center: Comparison with Standard Echocardiography. Echocardiography 2011, 28, 136–141. [Google Scholar] [CrossRef]
- Squizzato, A.; Galli, L.; Gerdes, V.E.A. Point-of-Care Ultrasound in the Diagnosis of Pulmonary Embolism. Crit. Ultrasound J. 2015, 7, 7. [Google Scholar] [CrossRef]
- Cardim, N.; Dalen, H.; Voigt, J.-U.; Ionescu, A.; Price, S.; Neskovic, A.N.; Edvardsen, T.; Galderisi, M.; Sicari, R.; Donal, E.; et al. The Use of Handheld Ultrasound Devices: A Position Statement of the European Association of Cardiovascular Imaging (2018 Update). Eur. Heart J. Cardiovasc. Imaging 2019, 20, 245–252. [Google Scholar] [CrossRef] [PubMed]
- Daley, J.I.; Dwyer, K.H.; Grunwald, Z.; Shaw, D.L.; Stone, M.B.; Schick, A.; Vrablik, M.; Hall, M.K.; Hall, J.; Liteplo, A.S.; et al. Increased Sensitivity of Focused Cardiac Ultrasound for Pulmonary Embolism in Emergency Department Patients with Abnormal Vital Signs. Acad. Emerg. Med. 2019, 26, 1211–1220. [Google Scholar] [CrossRef] [PubMed]


| Presence of RV Dysfunction | ||||
|---|---|---|---|---|
| No (N = 81) | Yes (N = 35) | |||
| Demographics | Age, years, median (IQR) | 72.0 (50.0–81.0) | 67.0 (45.5–77.0) | 0.388 |
| Sex, male, N (%) | 35 (43.2%) | 14 (40.0%) | 0.907 | |
| Weight, kilograms, median (IQR) | 61.3 (50.2–73.8) | 55.8 (53.0–74.0) | 0.946 | |
| Height, centimeters, median (IQR) | 160.0 (155.0–170.0) | 162.0 (157.0–168.0) | 0.781 | |
| Risk Factors of PTE | Diabetes Mellitus, N (%) | 18 (22.2%) | 5 (14.3%) | 0.465 |
| Hypertension, N (%) | 37 (45.7%) | 12 (34.3%) | 0.350 | |
| Coronary artery occlusive disease, N (%) | 7 (8.6%) | 3 (8.6%) | 1.000 | |
| Cerebrovascular disease, N (%) | 10 (12.3%) | 1 (2.9%) | 0.209 | |
| Current smoker, N (%) | 5 (6.2%) | 3 (8.6%) | 0.945 | |
| Prolonged immobility (>1 week), N (%) | 18 (22.2%) | 8 (22.9%) | 1.000 | |
| Recent trauma or surgery (within 3 months), N (%) | 16 (19.8%) | 13 (37.1%) | 0.080 | |
| Active malignancy, N (%) | 18 (22.2%) | 3 (8.6%) | 0.136 | |
| Infectious disease (within 3 months), N (%) | 19 (23.5%) | 3 (8.6%) | 0.105 | |
| Hormone treatment, N (%) | 2 (2.5%) | 1 (2.9%) | 1.000 | |
| History of pulmonary thromboembolism, N (%) | 10 (12.3%) | 4 (11.4%) | 1.000 | |
| History of deep vein thrombosis, N (%) | 0 (0.0%) | 3 (8.6%) | 0.042 | |
| Vital Signs | Systolic blood pressure, mean (SD) | 130.0 (26.1) | 129.4 (26.6) | 0.915 |
| Diastolic blood pressure, mean (SD) | 82.2 (17.7) | 81.0 (15.1) | 0.734 | |
| Pulse rate, median (IQR) | 99.0 (81.5–115.5) | 101.0 (90.0–117.0) | 0.150 | |
| Respiratory rate, median (IQR) | 20.0 (18.0–22.0) | 21.0 (20.0–24.0) | 0.092 | |
| Laboratory Measurements | White blood cell, 109/L, median (IQR) | 9.2 (7.4–13.1) | 10.0 (7.3–13.5) | 0.740 |
| Hemoglobin, g/dL, mean (SD) | 12.1 (2.4) | 12.4 (2.3) | 0.486 | |
| Aspartate transaminase, U/L, median (IQR) | 22.5 (16.0–35.0) | 32.0 (25.0–56.0) | 0.003 | |
| Alanine transaminase, U/L, median (IQR) | 19.0 (12.0–34.0) | 30.0 (18.0–60.5) | 0.017 | |
| Blood urea nitrogen, mg/dL, median (IQR) | 14.9 (11.0–22.4) | 14.3 (11.5–19.6) | 0.551 | |
| Creatinine, mg/dL, median (IQR) | 0.9 (0.7–1.1) | 0.8 (0.7–1.1) | 0.440 | |
| Troponin I, μg/mL, median (IQR) | 0.052 (0.019–0.266) | 0.176 (0.075–0.723) | 0.034 | |
| ProBNP, pg/mL, median (IQR) | 482.0 (140.0–2400.0) | 1366.0 (576.0–4733.0) | 0.024 | |
| D-dimer, mg/L, median (IQR) | 3.6 (2.1–12.3) | 4.6 (2.8–10.7) | 0.599 | |
| Lactate, mg/dL, median (IQR) | 1.0 (0.8–2.3) | 2.0 (1.1–2.3) | 0.097 | |
| Heart rhythm (on ECG) | 0.117 | |||
| Sinus Rhythm, N (%) | 52 (64.2%) | 14 (41.2%) | ||
| Sinus Tachycardia, N (%) | 22 (27.2%) | 16 (47.1%) | ||
| Atrial Fibrillation, N (%) | 3 (3.7%) | 1 (2.9%) | ||
| Multifocal Atrial Tachycardia, N (%) | 2 (2.5%) | 0 (0.0%) | ||
| Sinus Arrhythmia, N (%) | 1 (1.2%) | 0 (0.0%) | ||
| Atrial Rhythm, N (%) | 0 (0.0%) | 1 (2.9%) | ||
| Wandering Atrial Rhythm, N (%) | 0 (0.0%) | 1 (2.9%) | ||
| Undetermined Rhythm, N (%) | 1 (1.2%) | 1 (2.9%) | ||
| Right Ventricular Systolic Pressure (RVSP) | <0.001 | |||
| RVSP I (<35 mmHg), N (%) | 61 (75.3%) | 4 (11.4%) | ||
| RVSP II (35–49 mmHg), N (%) | 15 (18.5%) | 12 (34.3%) | ||
| RVSP III (50–64 mmHg), N (%) | 5 (6.2%) | 10 (28.6%) | ||
| RVSP IV (>64 mmHg), N (%) | 0 (0.0%) | 9 (25.7%) | ||
| Time of the test | ED arrival to ECG, hours, median (IQR) | 1.0 (0.6–1.6) | 0.8 (0.6–1.3) | 0.388 |
| ED arrival to echocardiography, hours, median (IQR) | 22.1 (16.0–35.6) | 16.1 (4.8–27.5) | 0.036 | |
| ECG to echocardiography, hours, median (IQR) | 20.4 (14.9–34.0) | 13.8 (4.3–26.1) | 0.045 | |
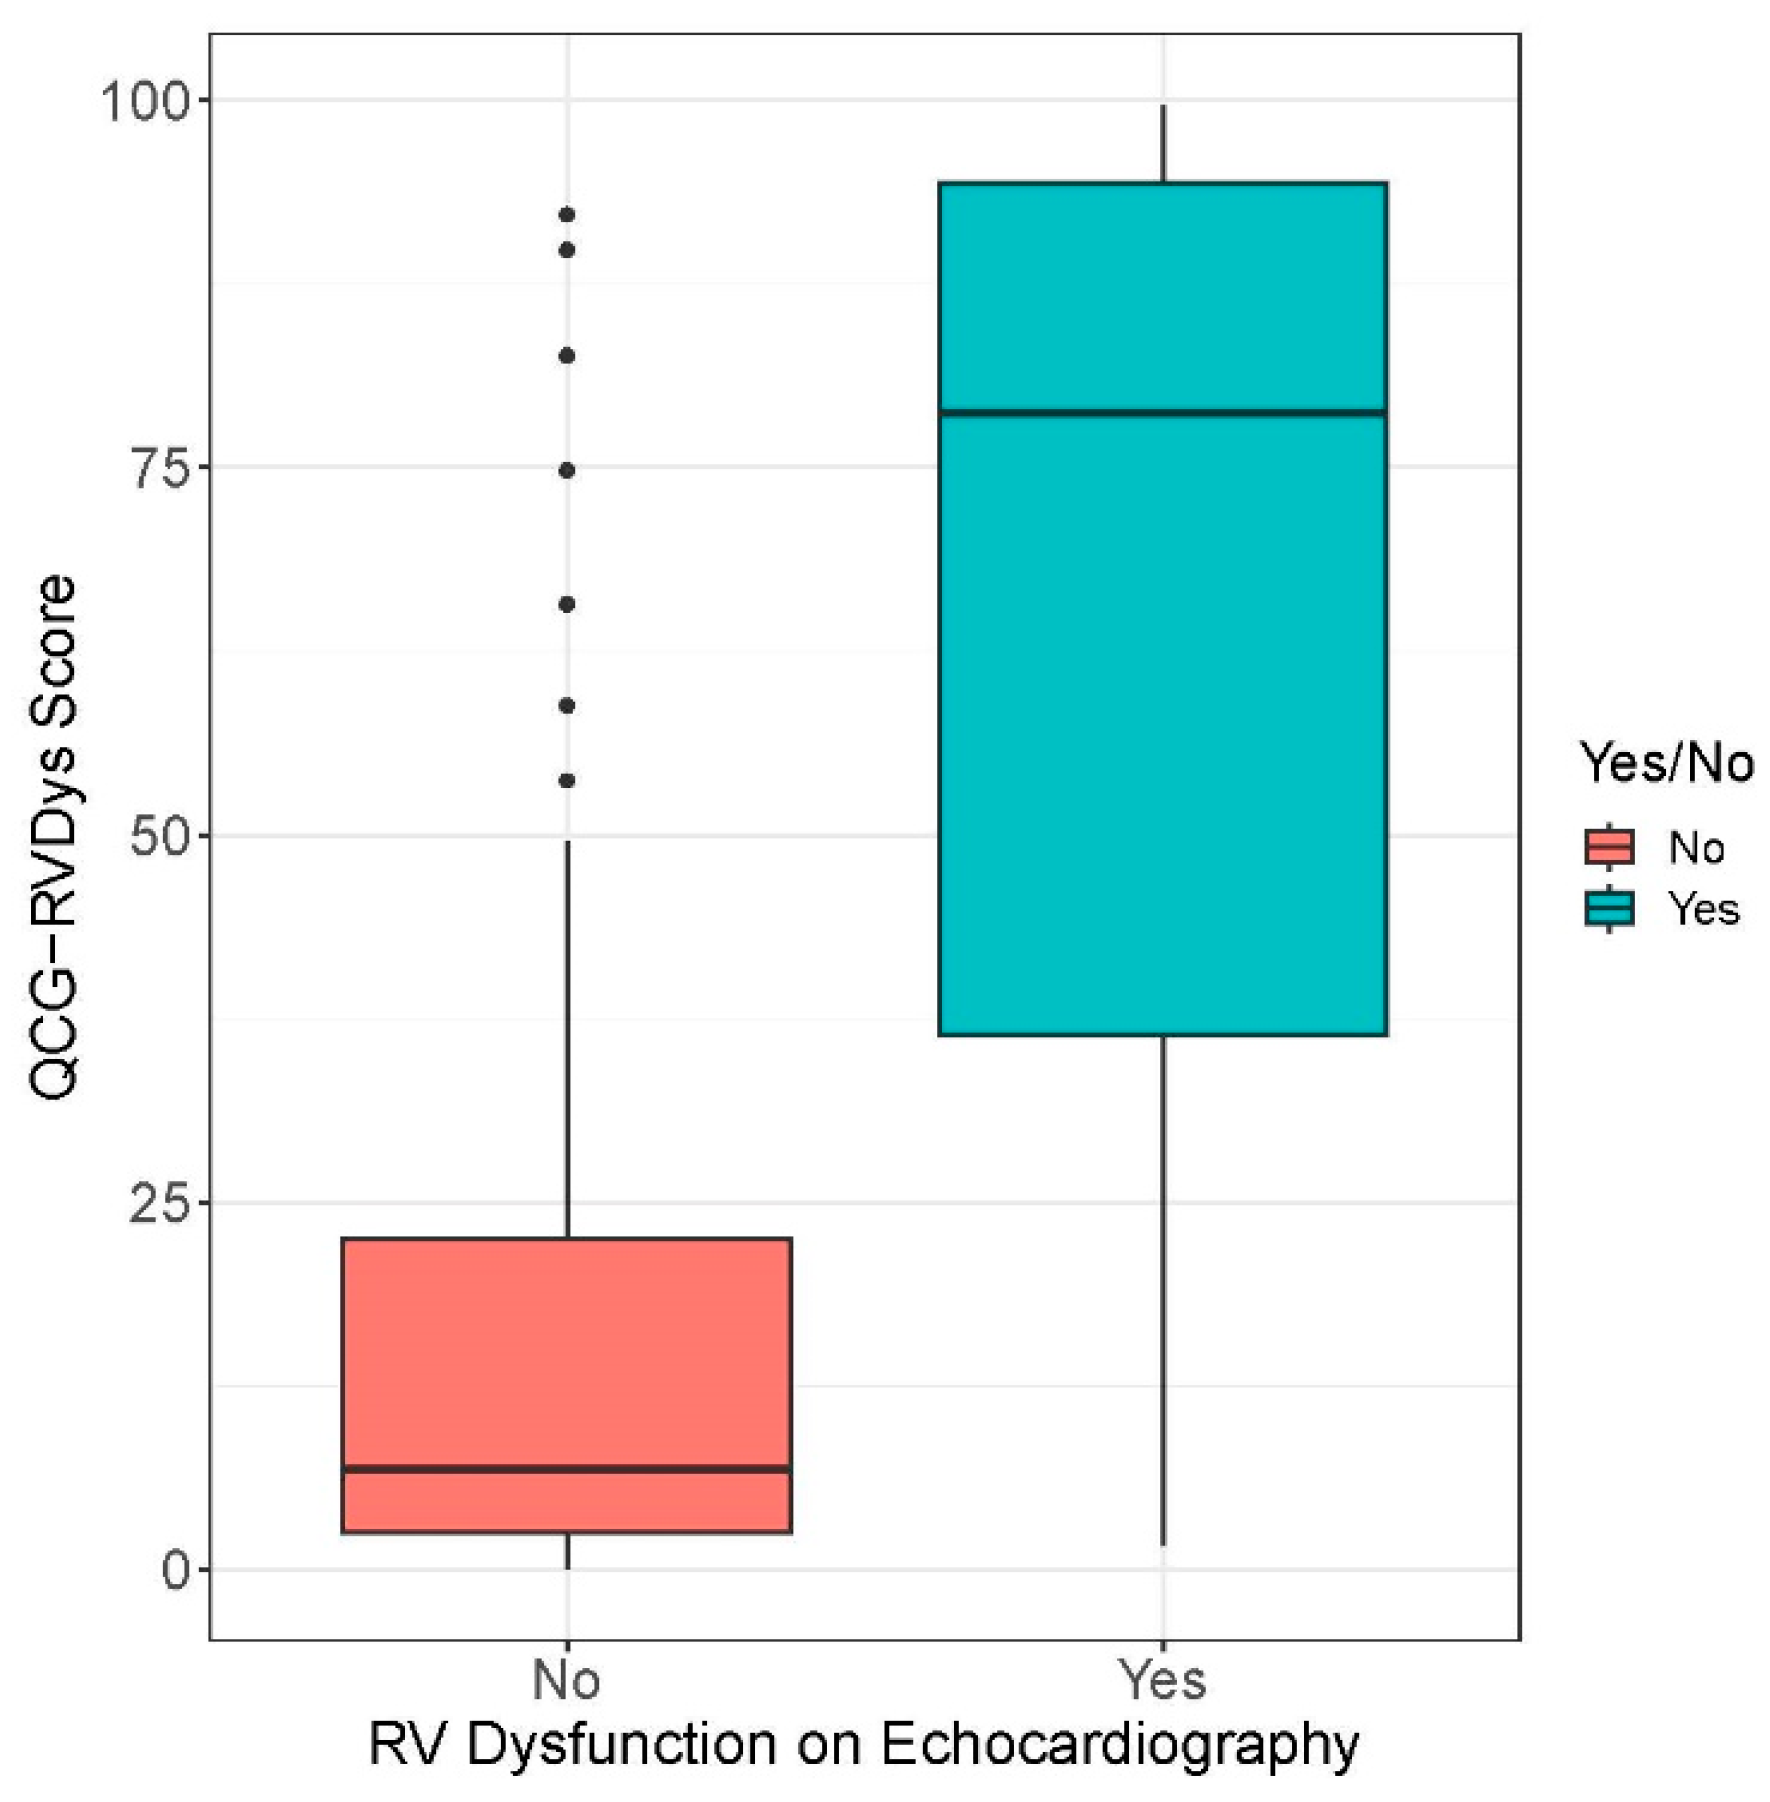
| QCG Biomarker | Group | Biomarker Measurements, Median (IQR) | p |
|---|---|---|---|
| QCG-RVDys | RVD | 6.8 (2.5–22.5) | <0.001 (for difference) |
| No RVD | 78.7 (35.7–94.9) | ||
| QCG-PHTN | RVSP I (<35 mmHg) | 8.1 (2.1–22.9) | <0.001 (for both difference and trend) |
| RVSP II (35–49 mmHg) | 21.7 (13.4–38.3) | ||
| RVSP III (50–64 mmHg) | 41.6 (31.2–65.1) | ||
| RVSP IV (>64 mmHg) | 49.2 (19.9–85.4) |
| Biomarker | AUC | p for Difference | Sensitivity (95% CI) | Specificity (95% CI) | PPV (95% CI) | NPV (95% CI) | Threshold |
|---|---|---|---|---|---|---|---|
| QCG-RVDys (continuous scale) | 0.895 (0.829–0.960) | - | 91.2 (82.4–100) | 77.8 (69.1–86.4) | 63.3 (54.4–73.9) | 95.5 (90.8–100) | 24.65 |
| Troponin I | 0.692 (0.536–0.847) | 0.046 | 81.2 (62.5–100) | 54.8 (38.7–71) | 48.1 (37.5–61.1) | 85 (70.6–100) | 0.0685 μg/mL |
| ProBNP | 0.655 (0.532–0.778) | 0.001 | 80.8 (65.4–96.2) | 53.4 (39.7–65.5) | 43.8 (35.6–52.5) | 86.4 (75.8–96.3) | 534.5 pg/mL |
Disclaimer/Publisher’s Note: The statements, opinions and data contained in all publications are solely those of the individual author(s) and contributor(s) and not of MDPI and/or the editor(s). MDPI and/or the editor(s) disclaim responsibility for any injury to people or property resulting from any ideas, methods, instructions or products referred to in the content. |
© 2024 by the authors. Licensee MDPI, Basel, Switzerland. This article is an open access article distributed under the terms and conditions of the Creative Commons Attribution (CC BY) license (https://creativecommons.org/licenses/by/4.0/).
Share and Cite
Choi, Y.J.; Park, M.J.; Cho, Y.; Kim, J.; Lee, E.; Son, D.; Kim, S.-Y.; Soh, M.S. Screening for RV Dysfunction Using Smartphone ECG Analysis App: Validation Study with Acute Pulmonary Embolism Patients. J. Clin. Med. 2024, 13, 4792. https://doi.org/10.3390/jcm13164792
Choi YJ, Park MJ, Cho Y, Kim J, Lee E, Son D, Kim S-Y, Soh MS. Screening for RV Dysfunction Using Smartphone ECG Analysis App: Validation Study with Acute Pulmonary Embolism Patients. Journal of Clinical Medicine. 2024; 13(16):4792. https://doi.org/10.3390/jcm13164792
Chicago/Turabian StyleChoi, Yoo Jin, Min Ji Park, Youngjin Cho, Joonghee Kim, Eunkyoung Lee, Dahyeon Son, Seo-Yoon Kim, and Moon Seung Soh. 2024. "Screening for RV Dysfunction Using Smartphone ECG Analysis App: Validation Study with Acute Pulmonary Embolism Patients" Journal of Clinical Medicine 13, no. 16: 4792. https://doi.org/10.3390/jcm13164792
APA StyleChoi, Y. J., Park, M. J., Cho, Y., Kim, J., Lee, E., Son, D., Kim, S.-Y., & Soh, M. S. (2024). Screening for RV Dysfunction Using Smartphone ECG Analysis App: Validation Study with Acute Pulmonary Embolism Patients. Journal of Clinical Medicine, 13(16), 4792. https://doi.org/10.3390/jcm13164792