

Sex Differences in the Energy System Contribution during Sprint Exercise in Speed-Power and Endurance Athletes

 ,
,  , , and
Abstract
:1. Introduction
2. Materials and Methods
2.1. Participants
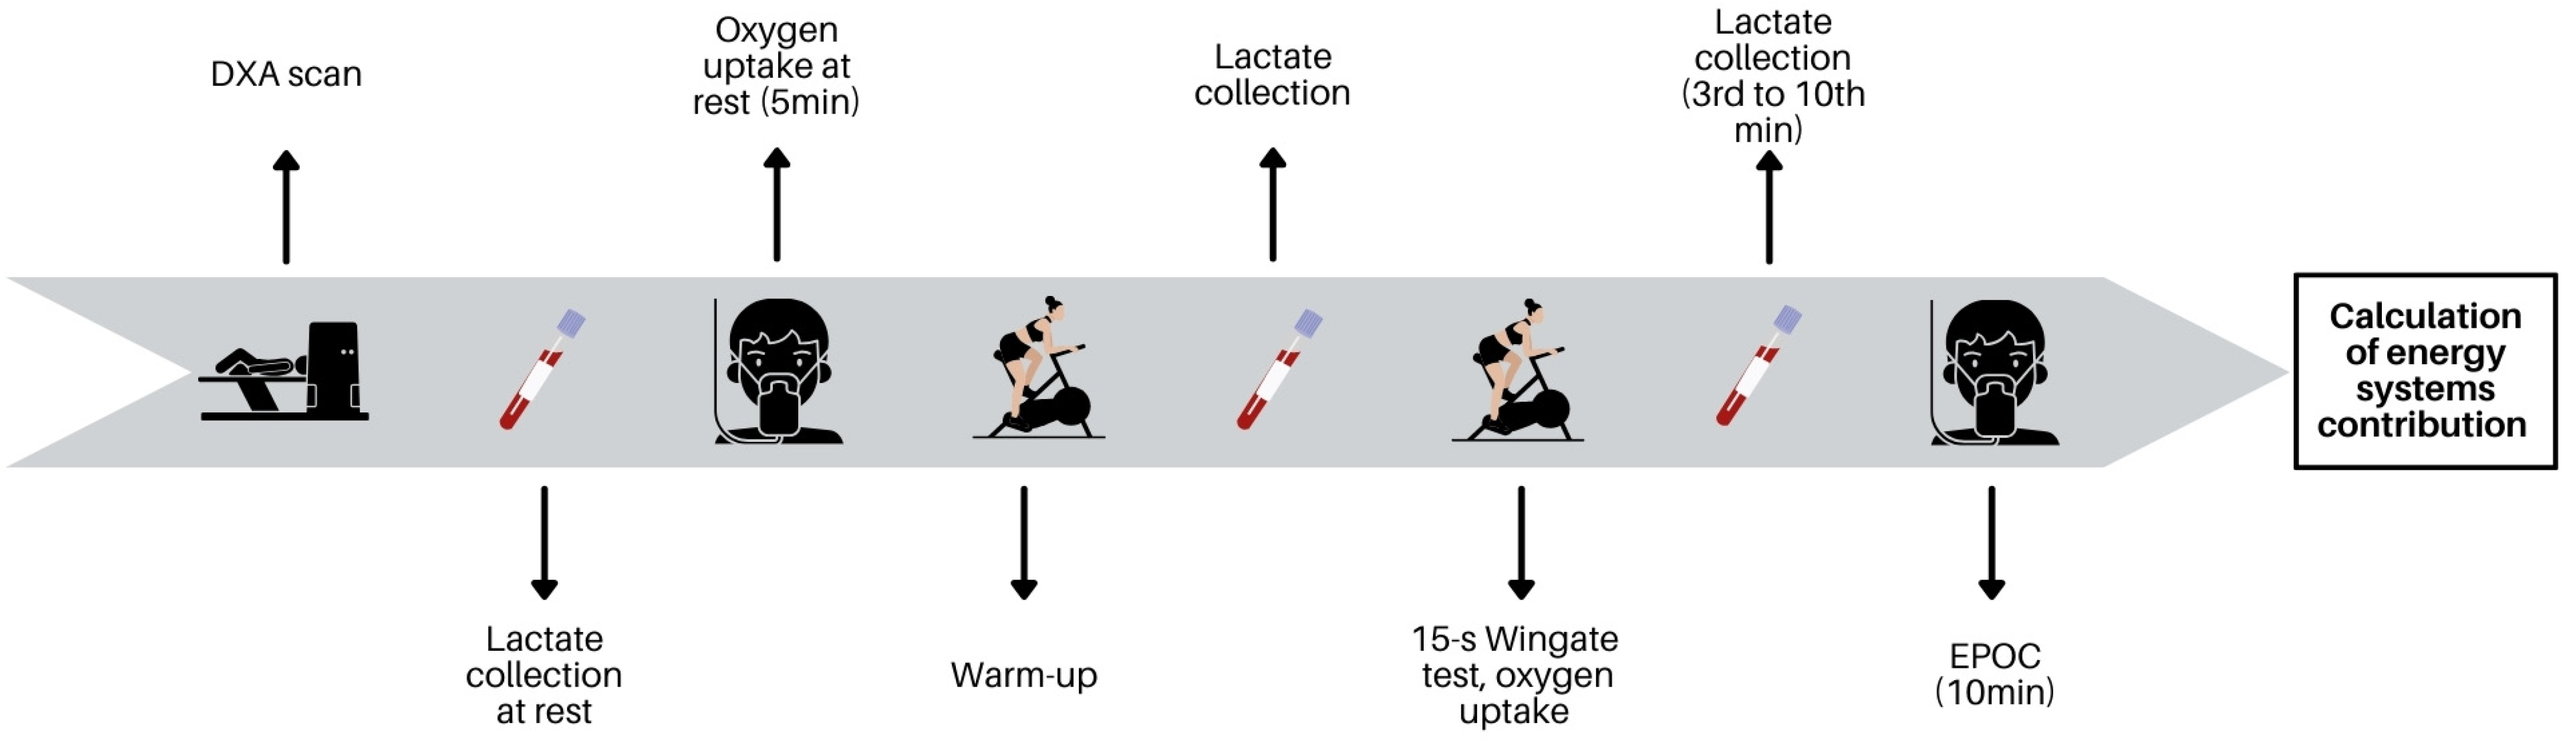
2.2. Procedures
2.3. Body Composition Analysis
2.4. Wingate Test
2.5. Oxygen Uptake and Lactate
2.6. Calculation of the Energy System Contribution
2.7. Statistical Analyses
3. Results
3.1. Body Composition Analysis and Skeletal Muscle Mass
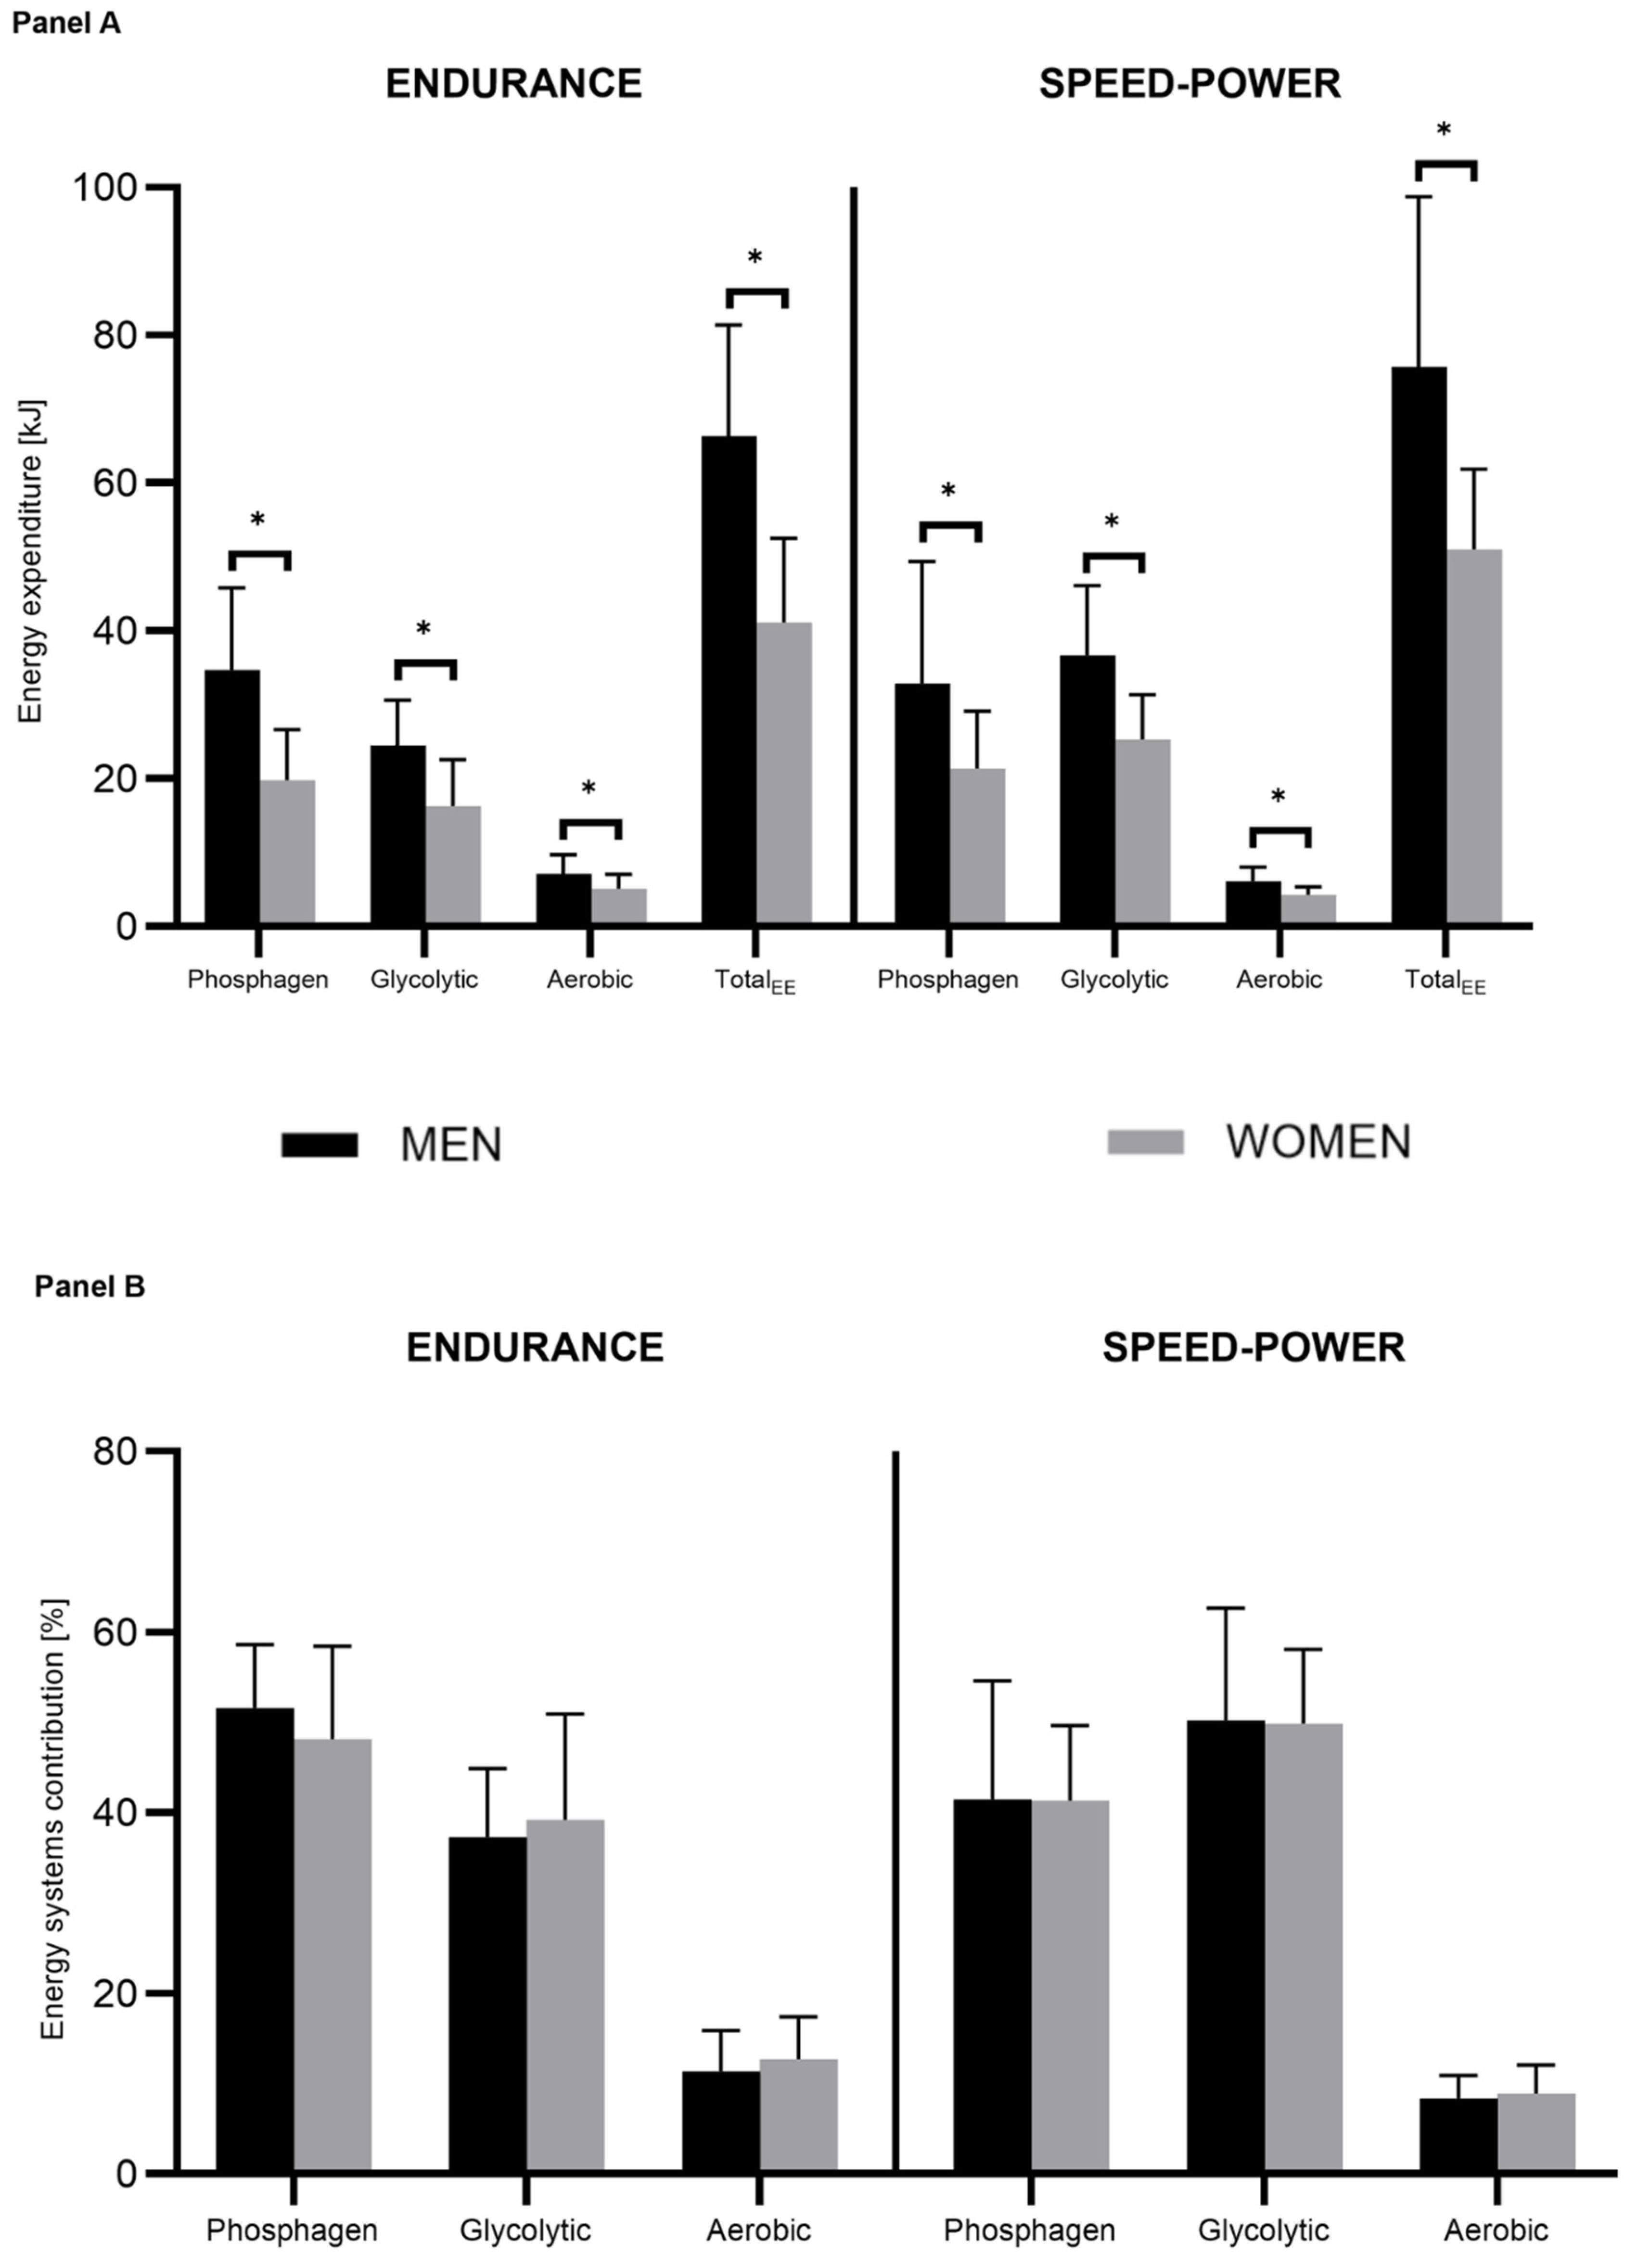
3.2. Energy Systems Contribution
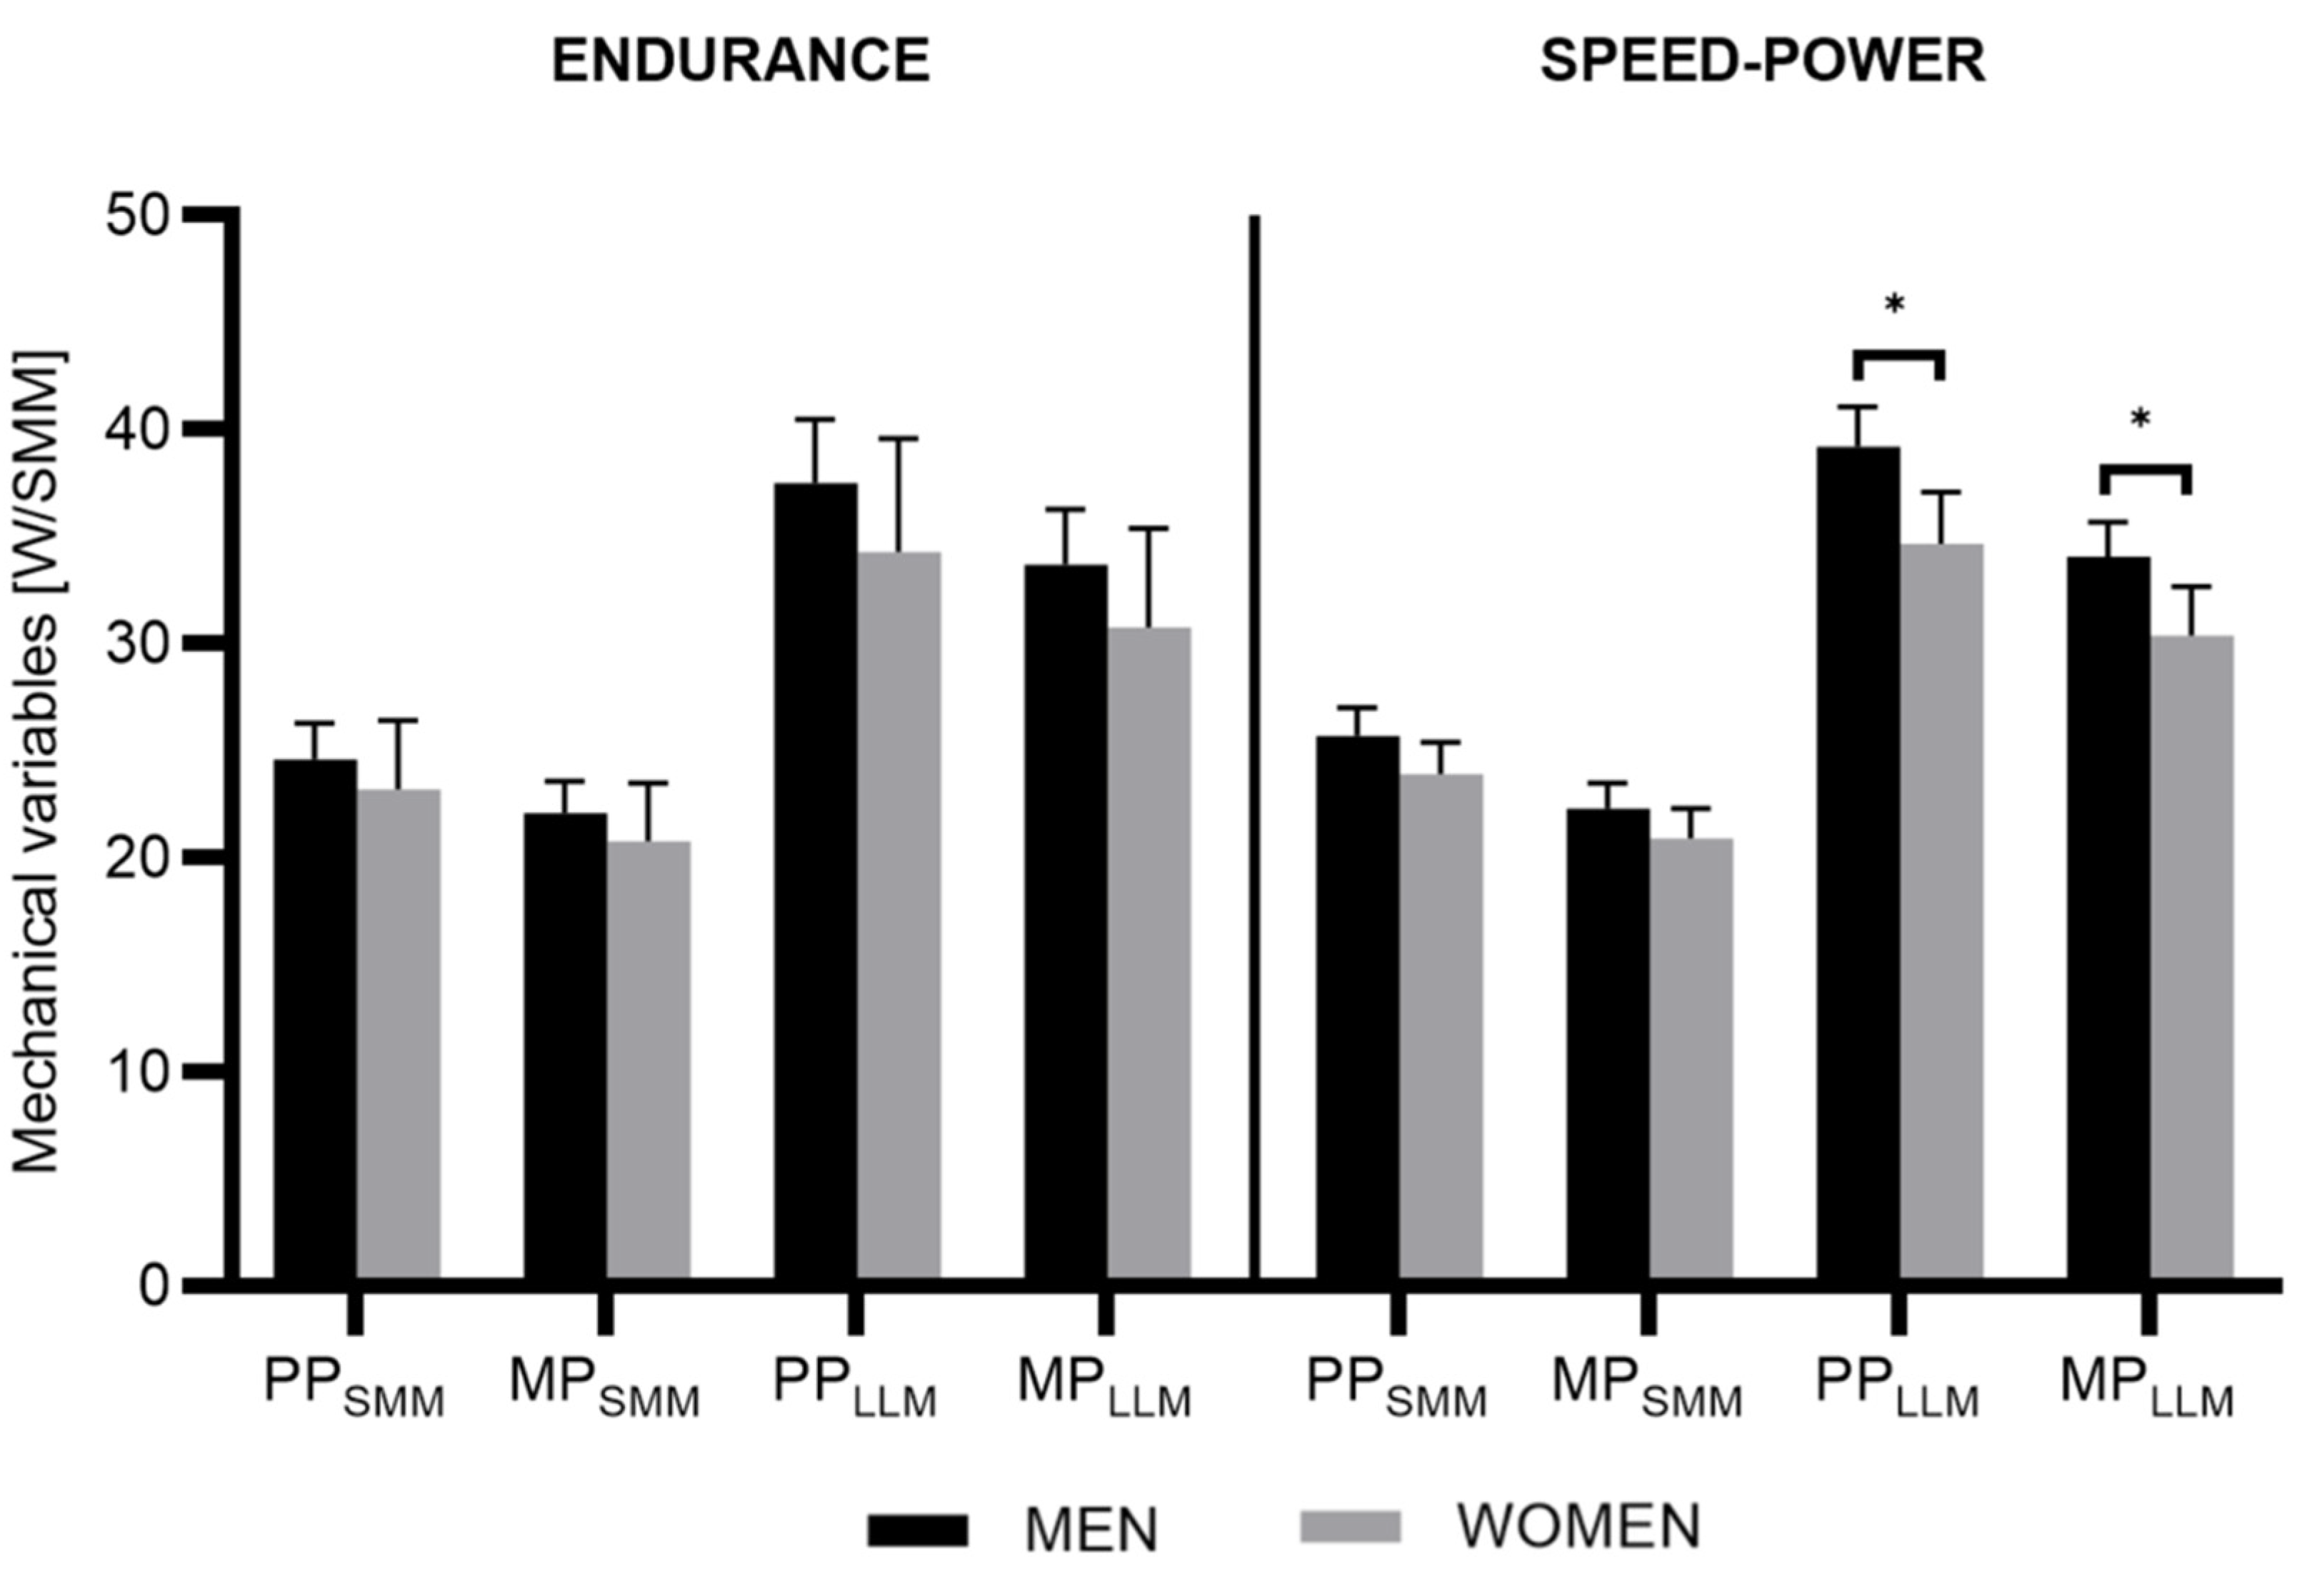
3.3. Peak and Mean Power
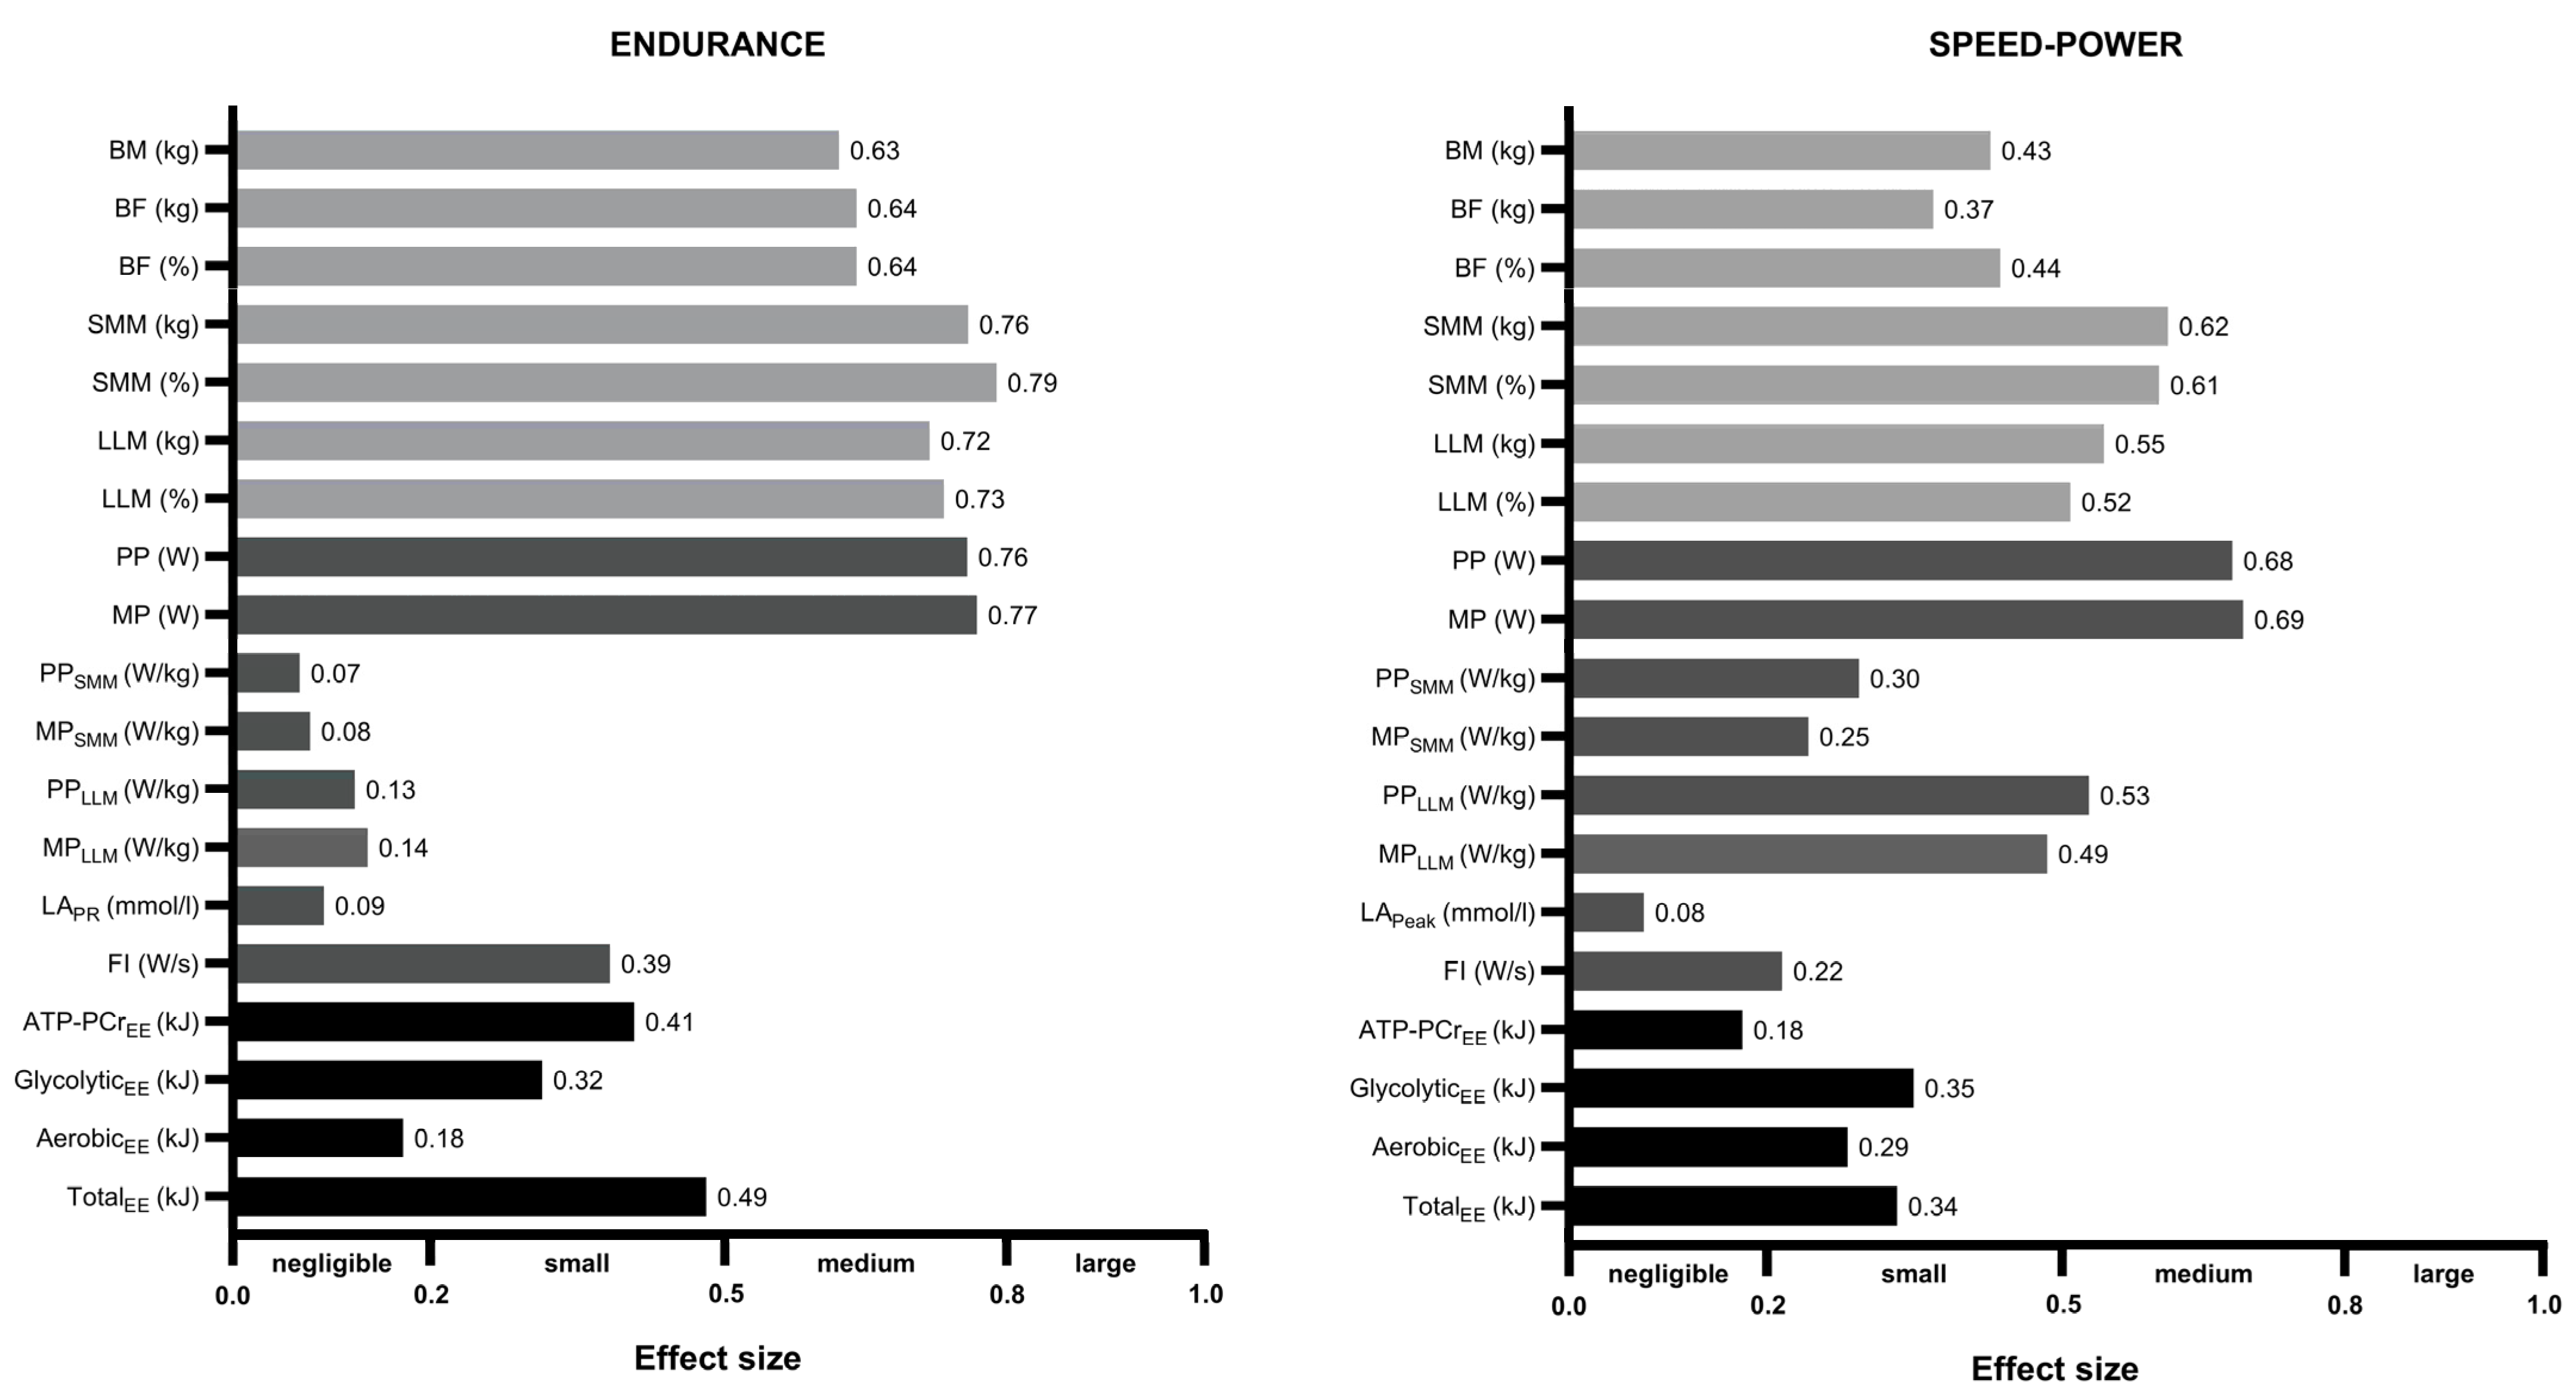
3.4. Size of the Sex Differences
4. Discussion
4.1. Sex Differences in Body Composition and Peak Power Output
4.2. Sex Differences in Energy Expenditure and Energy System Contribution
4.3. Limitations
5. Conclusions
Author Contributions
Funding
Institutional Review Board Statement
Informed Consent Statement
Data Availability Statement
Acknowledgments
Conflicts of Interest
References
- Hargreaves, M.; Spriet, L.L. Skeletal muscle energy metabolism during exercise. Nat. Metab. 2020, 2, 817–828. [Google Scholar] [CrossRef] [PubMed]
- Gastin, P.B. Energy System Interaction and Relative Contribution During Maximal Exercise. Sports Med. 2001, 31, 725–741. [Google Scholar] [CrossRef]
- Pilegaard, H.; Domino, K.; Noland, T.; Juel, C.; Hellsten, Y.; Halestrap, A.P.; Bangsbo, J. Effect of high-intensity exercise training on lactate/H+ transport capacity in human skeletal muscle. Am. J. Physiol.-Endocrinol. Metab. 1999, 276, E255–E261. [Google Scholar] [CrossRef] [PubMed]
- Kon, M.; Nakagaki, K.; Ebi, Y. Effects of all-out sprint interval training under hyperoxia on exercise performance. Physiol. Rep. 2019, 7, 14194. [Google Scholar] [CrossRef] [PubMed]
- Baker, J.S.; McCormick, M.C.; Robergs, R.A. Interaction among Skeletal Muscle Metabolic Energy Systems during Intense Exercise. J. Nutr. Metab. 2010, 2010, 905612. [Google Scholar] [CrossRef]
- Serresse, O.; Lortie, G.; Bouchard, C.; Boulay, M. Estimation of the Contribution of the Various Energy Systems During Maximal Work of Short Duration. Int. J. Sports Med. 1988, 9, 456–460. [Google Scholar] [CrossRef]
- Duffield, R.; Dawson, B.; Goodman, C. Energy system contribution to 100-m and 200-m track running events. J. Sci. Med. Sport 2004, 7, 302–313. [Google Scholar] [CrossRef]
- Duffield, R.; Dawson, B.; Goodman, C. Energy system contribution to 400-metre and 800-metre track running. J. Sports Sci. 2005, 23, 299–307. [Google Scholar] [CrossRef]
- Duffield, R.; Dawson, B.; Goodman, C. Energy system contribution to 1500- and 3000-metre track running. J. Sports Sci. 2005, 23, 993–1002. [Google Scholar] [CrossRef]
- Lundsgaard, A.-M.; Fritzen, A.M.; Kiens, B. Exercise Physiology in Men and Women. In Principles of Gender-Specific Medicine; Elsevier: Amsterdam, The Netherlands, 2017; pp. 525–542. ISBN 978-0-12-803506-1. [Google Scholar]
- Gray, S.R.; De Vito, G.; Nimmo, M.A.; Farina, D.; Ferguson, R.A. Skeletal muscle ATP turnover and muscle fiber conduction velocity are elevated at higher muscle temperatures during maximal power output development in humans. Am. J. Physiol. -Regul. Integr. Comp. Physiol. 2006, 290, R376–R382. [Google Scholar] [CrossRef]
- Esbjörnsson, M.; Sylvén, C.; Holm, I.; Jansson, E. Fast Twitch Fibres May Predict Anaerobic Performance in Both Females and Males. Int. J. Sports Med. 1993, 14, 257–263. [Google Scholar] [CrossRef] [PubMed]
- Esbjörnsson-Liljedahl, M.; Bodin, K.; Jansson, E. Smaller muscle ATP reduction in women than in men by repeated bouts of sprint exercise. J. Appl. Physiol. 2002, 93, 1075–1083. [Google Scholar] [CrossRef]
- Ribeiro, J.; Figueiredo, P.; Morais, S.; Alves, F.; Toussaint, H.; Vilas-Boas, J.P.; Fernandes, R.J. Biomechanics, energetics and coordination during extreme swimming intensity: Effect of performance level. J. Sports Sci. 2016, 35, 1614–1621. [Google Scholar] [CrossRef] [PubMed]
- Tortu, E.; Gökhan, D. Comparison of energy system contributions in lower body Wingate test between sexes. Phys. Act. Rev. 2024, 12, 13–21. [Google Scholar] [CrossRef]
- Tortu, E.; Hazir, T.; Kin Isler, A. Energy System Contributions in Repeated Sprint Tests: Protocol and Sex Comparison. J. Hum. Kinet. 2024, 92, 87–98. [Google Scholar] [CrossRef]
- Nana, A.; Slater, G.J.; Stewart, A.D.; Burke, L.M. Methodology Review: Using Dual-Energy X-Ray Absorptiometry (DXA) for the Assessment of Body Composition in Athletes and Active People. Int. J. Sport Nutr. Exerc. Metab. 2015, 25, 198–215. [Google Scholar] [CrossRef]
- Kim, J.; Wang, Z.; Heymsfield, S.B.; Baumgartner, R.N.; Gallagher, D. Total-body skeletal muscle mass: Estimation by a new dual-energy X-ray absorptiometry method. Am. J. Clin. Nutr. 2002, 76, 378–383. [Google Scholar] [CrossRef]
- Inbar, O.; Bar-Or, O.; Skinner, J.S. The Wingate Anaerobic Test; Human Kinetics: Champaign, IL, USA, 1996; ISBN 978-0-87322-946-3. [Google Scholar]
- Katch, V.; Weltman, A.; Martin, R.; Gray, L. Optimal Test Characteristics for Maximal Anaerobic Work on the Bicycle Ergometer. Res. Q. Am. Alliance Health Phys. Educ. Recreat. 1977, 48, 319–327. [Google Scholar] [CrossRef]
- Bar-Or, O. The Wingate Anaerobic Test: An Update on Methodology, Reliability and Validity. Sports Med. 1987, 4, 381–394. [Google Scholar] [CrossRef]
- Coppin, E.; Heath, E.M.; Bressel, E.; Wagner, D.R. Wingate Anaerobic Test Reference Values for Male Power Athletes. Int. J. Sports Physiol. Perform. 2012, 7, 232–236. [Google Scholar] [CrossRef]
- Beneke, R.; Pollman, C.; Hutler, M. How anaerobic is the Wingate Anaerobic Test for humans? Eur. J. Appl. Physiol. 2002, 87, 388–392. [Google Scholar] [CrossRef] [PubMed]
- Beneke, R.; Beyer, T.; Jachner, C.; Erasmus, J.; Hütler, M. Energetics of karate kumite. Eur. J. Appl. Physiol. 2004, 92, 518–523. [Google Scholar] [CrossRef] [PubMed]
- Bertuzzi, R.C.D.M.; Franchini, E.; Kokubun, E.; Kiss, M.A.P.D.M. Energy system contributions in indoor rock climbing. Eur. J. Appl. Physiol. 2007, 101, 293–300. [Google Scholar] [CrossRef]
- Spencer, M.; Lawrence, S.; Rechichi, C.; Bishop, D.; Dawson, B.; Goodman, C. Time–motion analysis of elite field hockey, with special reference to repeated-sprint activity. J. Sports Sci. 2004, 22, 843–850. [Google Scholar] [CrossRef]
- Gaesser, G.A.; Brooks, G.A. Metabolic bases of excess post-exercise oxygen consumption: A review. Med. Sci. Sports Exerc. 1984, 16, 29–43. [Google Scholar] [CrossRef]
- Bertuzzi, R.; Melegati, J.; Bueno, S.; Ghiarone, T.; Pasqua, L.A.; Gáspari, A.F.; Lima-Silva, A.E.; Goldman, A. GEDAE-LaB: A Free Software to Calculate the Energy System Contributions during Exercise. PLoS ONE 2016, 11, e0145733. [Google Scholar] [CrossRef]
- Özyener, F.; Rossiter, H.B.; Ward, S.A.; Whipp, B.J. Influence of exercise intensity on the on- and off-transient kinetics of pulmonary oxygen uptake in humans. J. Physiol. 2001, 533, 891–902. [Google Scholar] [CrossRef] [PubMed]
- Artioli, G.G.; Bertuzzi, R.C.; Roschel, H.; Mendes, S.H.; Lancha, A.H., Jr.; Franchini, E. Determining the Contribution of the Energy Systems During Exercise. JoVE 2012, 61, 3413. [Google Scholar] [CrossRef]
- Doria, C.; Verratti, V.; Pietrangelo, T.; Fanò-Illic, G.; Bisconti, A.V.; Shokohyar, S.; Rampichini, S.; Limonta, E.; Coratella, G.; Longo, S.; et al. Changes in energy system contributions to the Wingate anaerobic test in climbers after a high altitude expedition. Eur. J. Appl. Physiol. 2020, 120, 1629–1636. [Google Scholar] [CrossRef]
- Park, S.-B.; Park, D.-S.; Kim, M.; Lee, E.; Lee, D.; Jung, J.; Son, S.J.; Hong, J.; Yang, W.-H. High-Intensity Warm-Up Increases Anaerobic Energy Contribution during 100-m Sprint. Biology 2021, 10, 198. [Google Scholar] [CrossRef]
- Yang, W.-H.; Park, S.-Y.; Kim, T.; Jeon, H.-J.; Heine, O.; Gehlert, S. A modified formula using energy system contributions to calculate pure maximal rate of lactate accumulation during a maximal sprint cycling test. Front. Physiol. 2023, 14, 1147321. [Google Scholar] [CrossRef]
- Lamarra, N.; Whipp, B.J.; Ward, S.A.; Wasserman, K. Effect of interbreath fluctuations on characterizing exercise gas exchange kinetics. J. Appl. Physiol. 1987, 62, 2003–2012. [Google Scholar] [CrossRef] [PubMed]
- Myers, J.; Walsh, D.; Sullivan, M.; Froelicher, V. Effect of sampling on variability and plateau in oxygen uptake. J. Appl. Physiol. 1990, 68, 404–410. [Google Scholar] [CrossRef] [PubMed]
- Cohen, J. Statistical Power Analysis for the Behavioral Sciences, 2nd ed.; L. Erlbaum Associates: Hillsdale, NJ, USA, 1988; ISBN 978-0-8058-0283-2. [Google Scholar]
- Gollnick, P.D.; Armstrong, R.B.; Saubert, C.W.; Piehl, K.; Saltin, B. Enzyme activity and fiber composition in skeletal muscle of untrained and trained men. J. Appl. Physiol. 1972, 33, 312–319. [Google Scholar] [CrossRef]
- Jones, A.M.; Carter, H. The Effect of Endurance Training on Parameters of Aerobic Fitness. Sports Med. 2000; 29, 373–386. [Google Scholar] [CrossRef]
- Bassett, D.R. Limiting factors for maximum oxygen uptake and determinants of endurance performance. Med. Sci. Sports Exerc. 2000, 32, 70. [Google Scholar] [CrossRef] [PubMed]
- Holloszy, J.O.; Coyle, E.F. Adaptations of skeletal muscle to endurance exercise and their metabolic consequences. J. Appl. Physiol. 1984, 56, 831–838. [Google Scholar] [CrossRef]
- Parry, H.A.; Roberts, M.D.; Kavazis, A.N. Human Skeletal Muscle Mitochondrial Adaptations Following Resistance Exercise Training. Int. J. Sports Med. 2020, 41, 349–359. [Google Scholar] [CrossRef]
- Trappe, S.; Luden, N.; Minchev, K.; Raue, U.; Jemiolo, B.; Trappe, T.A. Skeletal muscle signature of a champion sprint runner. J. Appl. Physiol. 2015, 118, 1460–1466. [Google Scholar] [CrossRef] [PubMed]
- Lievens, E.; Klass, M.; Bex, T.; Derave, W. Muscle fiber typology substantially influences time to recover from high-intensity exercise. J. Appl. Physiol. 2020, 128, 648–659. [Google Scholar] [CrossRef] [PubMed]
- Perez-Gomez, J.; Rodriguez, G.V.; Ara, I.; Olmedillas, H.; Chavarren, J.; González-Henriquez, J.J.; Dorado, C.; Calbet, J.A.L. Role of muscle mass on sprint performance: Gender differences? Eur. J. Appl. Physiol. 2008, 102, 685–694. [Google Scholar] [CrossRef]
- Nuzzo, J.L. Sex differences in skeletal muscle fiber types: A meta-analysis. Clin. Anat. 2024, 37, 81–91. [Google Scholar] [CrossRef] [PubMed]
- Bottinelli, R.; Canepari, M.; Pellegrino, M.A.; Reggiani, C. Force-velocity properties of human skeletal muscle fibres: Myosin heavy chain isoform and temperature dependence. J. Physiol. 1996, 495, 573–586. [Google Scholar] [CrossRef] [PubMed]
- Bottinelli, R.; Pellegrino, M.A.; Canepari, M.; Rossi, R.; Reggiani, C. Specific contributions of various muscle fibre types to human muscle performance: An in vitro study. J. Electromyogr. Kinesiol. 1999, 9, 87–95. [Google Scholar] [CrossRef] [PubMed]
- Widrick, J.J.; Stelzer, J.E.; Shoepe, T.C.; Garner, D.P. Functional properties of human muscle fibers after short-term resistance exercise training. Am. J. Physiol. -Regul. Integr. Comp. Physiol. 2002, 283, R408–R416. [Google Scholar] [CrossRef]
- Costill, D.L.; Daniels, J.; Evans, W.; Fink, W.; Krahenbuhl, G.; Saltin, B. Skeletal muscle enzymes and fiber composition in male and female track athletes. J. Appl. Physiol. 1976, 40, 149–154. [Google Scholar] [CrossRef]
- Saltin, B. Metabolic fundamentals in exercise. Med. Sci. Sports 1973, 5, 137–146. [Google Scholar] [CrossRef]
- Trinschek, J.; Zieliński, J.; Zarębska, E.A.; Kusy, K. Male and female athletes matched for maximum oxygen uptake per skeletal muscle mass: Equal but still different. J. Sports Med. Phys. Fit. 2022, 63, 95–103. [Google Scholar] [CrossRef]
- Hallam, L.C.; Amorim, F.T. Expanding the Gap: An Updated Look Into Sex Differences in Running Performance. Front. Physiol. 2022, 12, 804149. [Google Scholar] [CrossRef]
- Green, H.J.; Fraser, I.G.; Ranney, D.A. Male and female differences in enzyme activities of energy metabolism in vastus lateralis muscle. J. Neurol. Sci. 1984, 65, 323–331. [Google Scholar] [CrossRef]
- Murphy, M.M.; Patton, J.F.; Frederick, F.A. Comparative anaerobic power of men and women. Aviat. Space Environ. Med. 1986, 57, 636–641. [Google Scholar] [PubMed]
- Nindl, B.C.; Mahar, M.T.; Harman, E.A.; Patton, J.F. Lower and upper body anaerobic performance in male and female adolescent athletes. Med. Sci. Sports Exerc. 1995, 27, 235–241. [Google Scholar] [CrossRef]
- Serresse, O.; Ama, P.F.; Simoneau, J.A.; Lortie, G.; Bouchard, C.; Boulay, M.R. Anaerobic performances of sedentary and trained subjects. Can. J. Sport Sci. 1989, 14, 46–52. [Google Scholar]
- Weber, C.L.; Chia, M.; Inbar, O. Gender Differences in Anaerobic Power of the Arms and Legs—A Scaling Issue. Med. Sci. Sports Exerc. 2006, 38, 129–137. [Google Scholar] [CrossRef]
- Miller, A.E.J.; MacDougall, J.D.; Tarnopolsky, M.A.; Sale, D.G. Gender differences in strength and muscle fiber characteristics. Europ. J. Appl. Physiol. 1993, 66, 254–262. [Google Scholar] [CrossRef] [PubMed]
- Tortu, E.; Ouergui, I.; Ulupinar, S.; Özbay, S.; Gençoğlu, C.; Ardigò, L.P. The contribution of energy systems during 30-s lower body Wingate anaerobic test in combat sports athletes: Intermittent versus single forms and gender comparison. PLoS ONE 2024, 19, e0303888. [Google Scholar] [CrossRef]
- Komi, P.V.; Karlsson, J. Skeletal muscle fibre types, enzyme activities and physical performance in young males and females. Acta Physiol. Scand. 1978, 103, 210–218. [Google Scholar] [CrossRef] [PubMed]
- Simoneau, J.A.; Bouchard, C. Human variation in skeletal muscle fiber-type proportion and enzyme activities. Am. J. Physiol. -Endocrinol. Metab. 1989, 257, E567–E572. [Google Scholar] [CrossRef]
- Jaworowski, Å.; Porter, M.M.; Holmbäck, A.M.; Downham, D.; Lexell, J. Enzyme activities in the tibialis anterior muscle of young moderately active men and women: Relationship with body composition, muscle cross-sectional area and fibre type composition. Acta Physiol. Scand. 2002, 176, 215–225. [Google Scholar] [CrossRef] [PubMed]
- Marra, M.; Di Vincenzo, O.; Cioffi, I.; Sammarco, R.; Morlino, D.; Scalfi, L. Resting energy expenditure in elite athletes: Development of new predictive equations based on anthropometric variables and bioelectrical impedance analysis derived phase angle. J. Int. Soc. Sports Nutr. 2021, 18, 68. [Google Scholar] [CrossRef]
- Massini, D.A.; Almeida, T.A.F.; Vasconcelos, C.M.T.; Macedo, A.G.; Espada, M.A.C.; Reis, J.F.; Alves, F.J.B.; Fernandes, R.J.P.; Pessôa Filho, D.M. Are Young Swimmers Short and Middle Distances Energy Cost Sex-Specific? Front. Physiol. 2021, 12, 796886. [Google Scholar] [CrossRef]
- Almeida, T.A.F.; Pessôa Filho, D.M.; Espada, M.A.C.; Reis, J.F.; Simionato, A.R.; Siqueira, L.O.C.; Alves, F.B. Kinetics and energy contribution in simulated maximal performance during short and middle distance-trials in swimming. Eur. J. Appl. Physiol. 2020, 120, 1097–1109. [Google Scholar] [CrossRef] [PubMed]
- Yang, W.-H.; Park, J.-H.; Park, S.-Y.; Park, Y. Energetic Contributions Including Gender Differences and Metabolic Flexibility in the General Population and Athletes. Metabolites 2022, 12, 965. [Google Scholar] [CrossRef] [PubMed]
- Zamparo, P.; Cortesi, M.; Gatta, G. The energy cost of swimming and its determinants. Eur. J. Appl. Physiol. 2020, 120, 41–66. [Google Scholar] [CrossRef] [PubMed]
- Zamparo, P.; Capelli, C.; Guerrini, G. Energetics of kayaking at submaximal and maximal speeds. Eur. J. Appl. Physiol. 1999, 80, 542–548. [Google Scholar] [CrossRef]

| Endurance | Speed-Power | |||
|---|---|---|---|---|
| Male | Female | Male | Female | |
| Age (y) | 23 ± 7 | 20 ± 2 | 21.1 ± 2.6 | 20 ± 3 |
| Height (cm) | 179 ± 6 # | 165.1 ± 4.2 | 182.1 ± 5.4 # | 171.1 ± 9 |
| BM (kg) | 68 ± 6.6 #* | 54 ± 4.4 † | 78 ± 9.4 # | 62.9 ± 11 |
| BF (kg) | 9.0 ± 2.5 | 11.7 ± 1.8 † | 12.4 ± 4.0 | 15.8 ± 5.9 |
| BF (%) | 13.2 ± 3 #* | 21.8 ± 3.6 † | 15.9 ± 4.8 # | 24.5 ± 5 |
| SMM (kg) | 29.9 ± 3.2 #* | 20.3 ± 2.3 † | 34.6 ± 5 # | 24 ± 3.6 |
| SMM (%) | 43.9 ± 1.4 # | 37.6 ± 1.9 | 44.2 ± 2.8 # | 38.3 ± 2.1 |
| LLM (kg) | 19.6 ± 2.1 #* | 13.8 ± 1.7 † | 22.6 ± 3.1 # | 16.5 ± 3 |
| LLM (%) | 81.7 ± 3 # | 70.5 ± 4 | 79.7 ± 5 # | 69.5 ± 5 |
| LAREST (mmol/L) | 2.2 ± 0.6 | 2.1 ± 0.6 | 2.3 ± 0.6 | 2.2 ± 0.5 |
| LAPEAK (mmol/L) | 7.8 ± 1.1 #* | 6.9 ± 1.8 † | 9.6 ± 1.7 | 8.7 ± 1.6 |
| MANOVA | ||||||
|---|---|---|---|---|---|---|
| Energy expenditure | ||||||
| Sex | p = 0.011 *, η2 = 0.210 | |||||
| Discipline | p = 0.001 *, η2 = 0.626 | |||||
| Sex ∗ Discipline | p = 0.027 *, η2 = 0.187 | |||||
| Energy system contribution | ||||||
| Sex | p = 0.003 *, η2 = 0.241 | |||||
| Discipline | p < 0.001 *, η2 = 0.949 | |||||
| Sex ∗ Discipline | p = 0.007 *, η2 = 0.221 | |||||
| Phosphagen | Glycolytic | Aerobic | ||||
| p-value | η2 | p-value | η2 | p-value | η2 | |
| ANOVA | ||||||
| Energy expenditure | ||||||
| Sex | <0.001 * | 0.278 * | <0.001 * | 0.339 * | <0.001 * | 0.206 * |
| Discipline | 0.974 | 0.000 | <0.001 * | 0.377 * | 0.076 | 0.052 |
| Sex ∗ Discipline | 0.545 | 0.006 | 0.385 | 0.013 | 0.875 | 0.000 |
| Energy system contribution | ||||||
| Sex | 0.466 | 0.009 | 0.754 | 0.001 | 0.309 | 0.017 |
| Discipline | 0.001 * | 0.165 * | <0.001 * | 0.261 | 0.002 * | 0.148 |
| Sex ∗ Discipline | 0.516 | 0.007 | 0.682 | 0.002 | 0.573 | 0.005 |
| ANCOVA | ||||||
| Energy expenditure | ||||||
| Sex | 0.482 | 0.009 | 0.169 | 0.033 | 0.584 | 0.005 |
| Discipline | <0.001 * | 0.521 | 0.001 * | 0.190 | <0.001 * | 0.349 |
| Body fat | 0.488 | 0.008 | 0.461 | 0.010 | 0.274 | 0.020 |
| Muscle mass | 0.017 * | 0.096 | 0.008 * | 0.117 | 0.709 | 0.002 |
| Energy system contribution | ||||||
| Sex | 0.371 | 0.014 | 0.315 | 0.017 | 0.103 | 0.046 |
| Discipline | <0.001 * | 0.776 | <0.001 * | 0.429 | <0.001 * | 0.425 |
| Body fat | 0.982 | <0.001 | 0.995 | <0.001 | 0.953 | <0.001 |
| Muscle mass | 0.607 | 0.004 | 0.652 | 0.004 | 0.961 | <0.001 |
| Endurance | Speed-Power | |||
|---|---|---|---|---|
| Male | Female | Male | Female | |
| Relative values (%) | ||||
| EPCR | 51.6 ± 7 * | 48.1 ± 10.3 | 41.5 ± 13.1 | 41.3 ± 8.4 |
| ELA | 37.3 ± 7.6 * | 39.2 ± 11.7 † | 50.2 ± 12.5 | 49.9 ± 8.2 |
| EAER | 11.1 ± 4.5 | 12.7 ± 4.7 | 8.3 ± 2.5 | 8.8 ± 3.5 |
| Absolute values (kJ) | ||||
| EPCR | 34.7 ± 11.1 # | 19.8 ± 6.8 | 32.9 ± 16.5 # | 21.4 ± 7.7 |
| ELA | 24.5 ± 6.1 #* | 16.3 ± 6.2 † | 36.7 ± 9.4 # | 25.3 ± 6.1 |
| EAER | 7.1 ± 2.6# | 5.1 ± 1.9 | 6.1 ± 1.9 # | 4.3 ± 1.1 |
| Total energy expenditure | ||||
| EETOTAL[kJ] | 66.4 ± 15 #* | 41.1 ± 11.4 † | 75.7 ± 23 # | 51.0 ± 10.9 |
| EETOTAL/BM [kJ/kg] | 0.98 ± 0.21 | 0.76 ± 0.21 | 0.97 ± 0.25 | 0.81 ± 0.14 |
| EETOTAL/SMM [kJ/kg] | 2.23 ± 0.48 | 2.04 ± 0.58 | 2.18 ± 0.48 | 2.13 ± 0.36 |
Disclaimer/Publisher’s Note: The statements, opinions and data contained in all publications are solely those of the individual author(s) and contributor(s) and not of MDPI and/or the editor(s). MDPI and/or the editor(s) disclaim responsibility for any injury to people or property resulting from any ideas, methods, instructions or products referred to in the content. |
© 2024 by the authors. Licensee MDPI, Basel, Switzerland. This article is an open access article distributed under the terms and conditions of the Creative Commons Attribution (CC BY) license (https://creativecommons.org/licenses/by/4.0/).
Share and Cite
Archacki, D.; Zieliński, J.; Ciekot-Sołtysiak, M.; Zarębska, E.A.; Kusy, K. Sex Differences in the Energy System Contribution during Sprint Exercise in Speed-Power and Endurance Athletes. J. Clin. Med. 2024, 13, 4812. https://doi.org/10.3390/jcm13164812
Archacki D, Zieliński J, Ciekot-Sołtysiak M, Zarębska EA, Kusy K. Sex Differences in the Energy System Contribution during Sprint Exercise in Speed-Power and Endurance Athletes. Journal of Clinical Medicine. 2024; 13(16):4812. https://doi.org/10.3390/jcm13164812
Chicago/Turabian StyleArchacki, Damian, Jacek Zieliński, Monika Ciekot-Sołtysiak, Ewa Anna Zarębska, and Krzysztof Kusy. 2024. "Sex Differences in the Energy System Contribution during Sprint Exercise in Speed-Power and Endurance Athletes" Journal of Clinical Medicine 13, no. 16: 4812. https://doi.org/10.3390/jcm13164812