
Neurological Validation of ASD Diagnostic Criteria Using Frontal Alpha and Theta Asymmetry


Abstract
:1. Introduction
1.1. Autism Spectrum Disorder
1.2. EEG, FAA, and ASD
1.3. EEG and ASD Symptomatology
1.4. Study Aims
2. Materials and Methods
2.1. Participants
2.2. Instruments
2.3. EEG
2.4. Procedure
2.4.1. Data Acquisition and Pre-Processing
2.4.2. EEG Signal Processing
2.5. Statistical Analysis
3. Results
3.1. Data
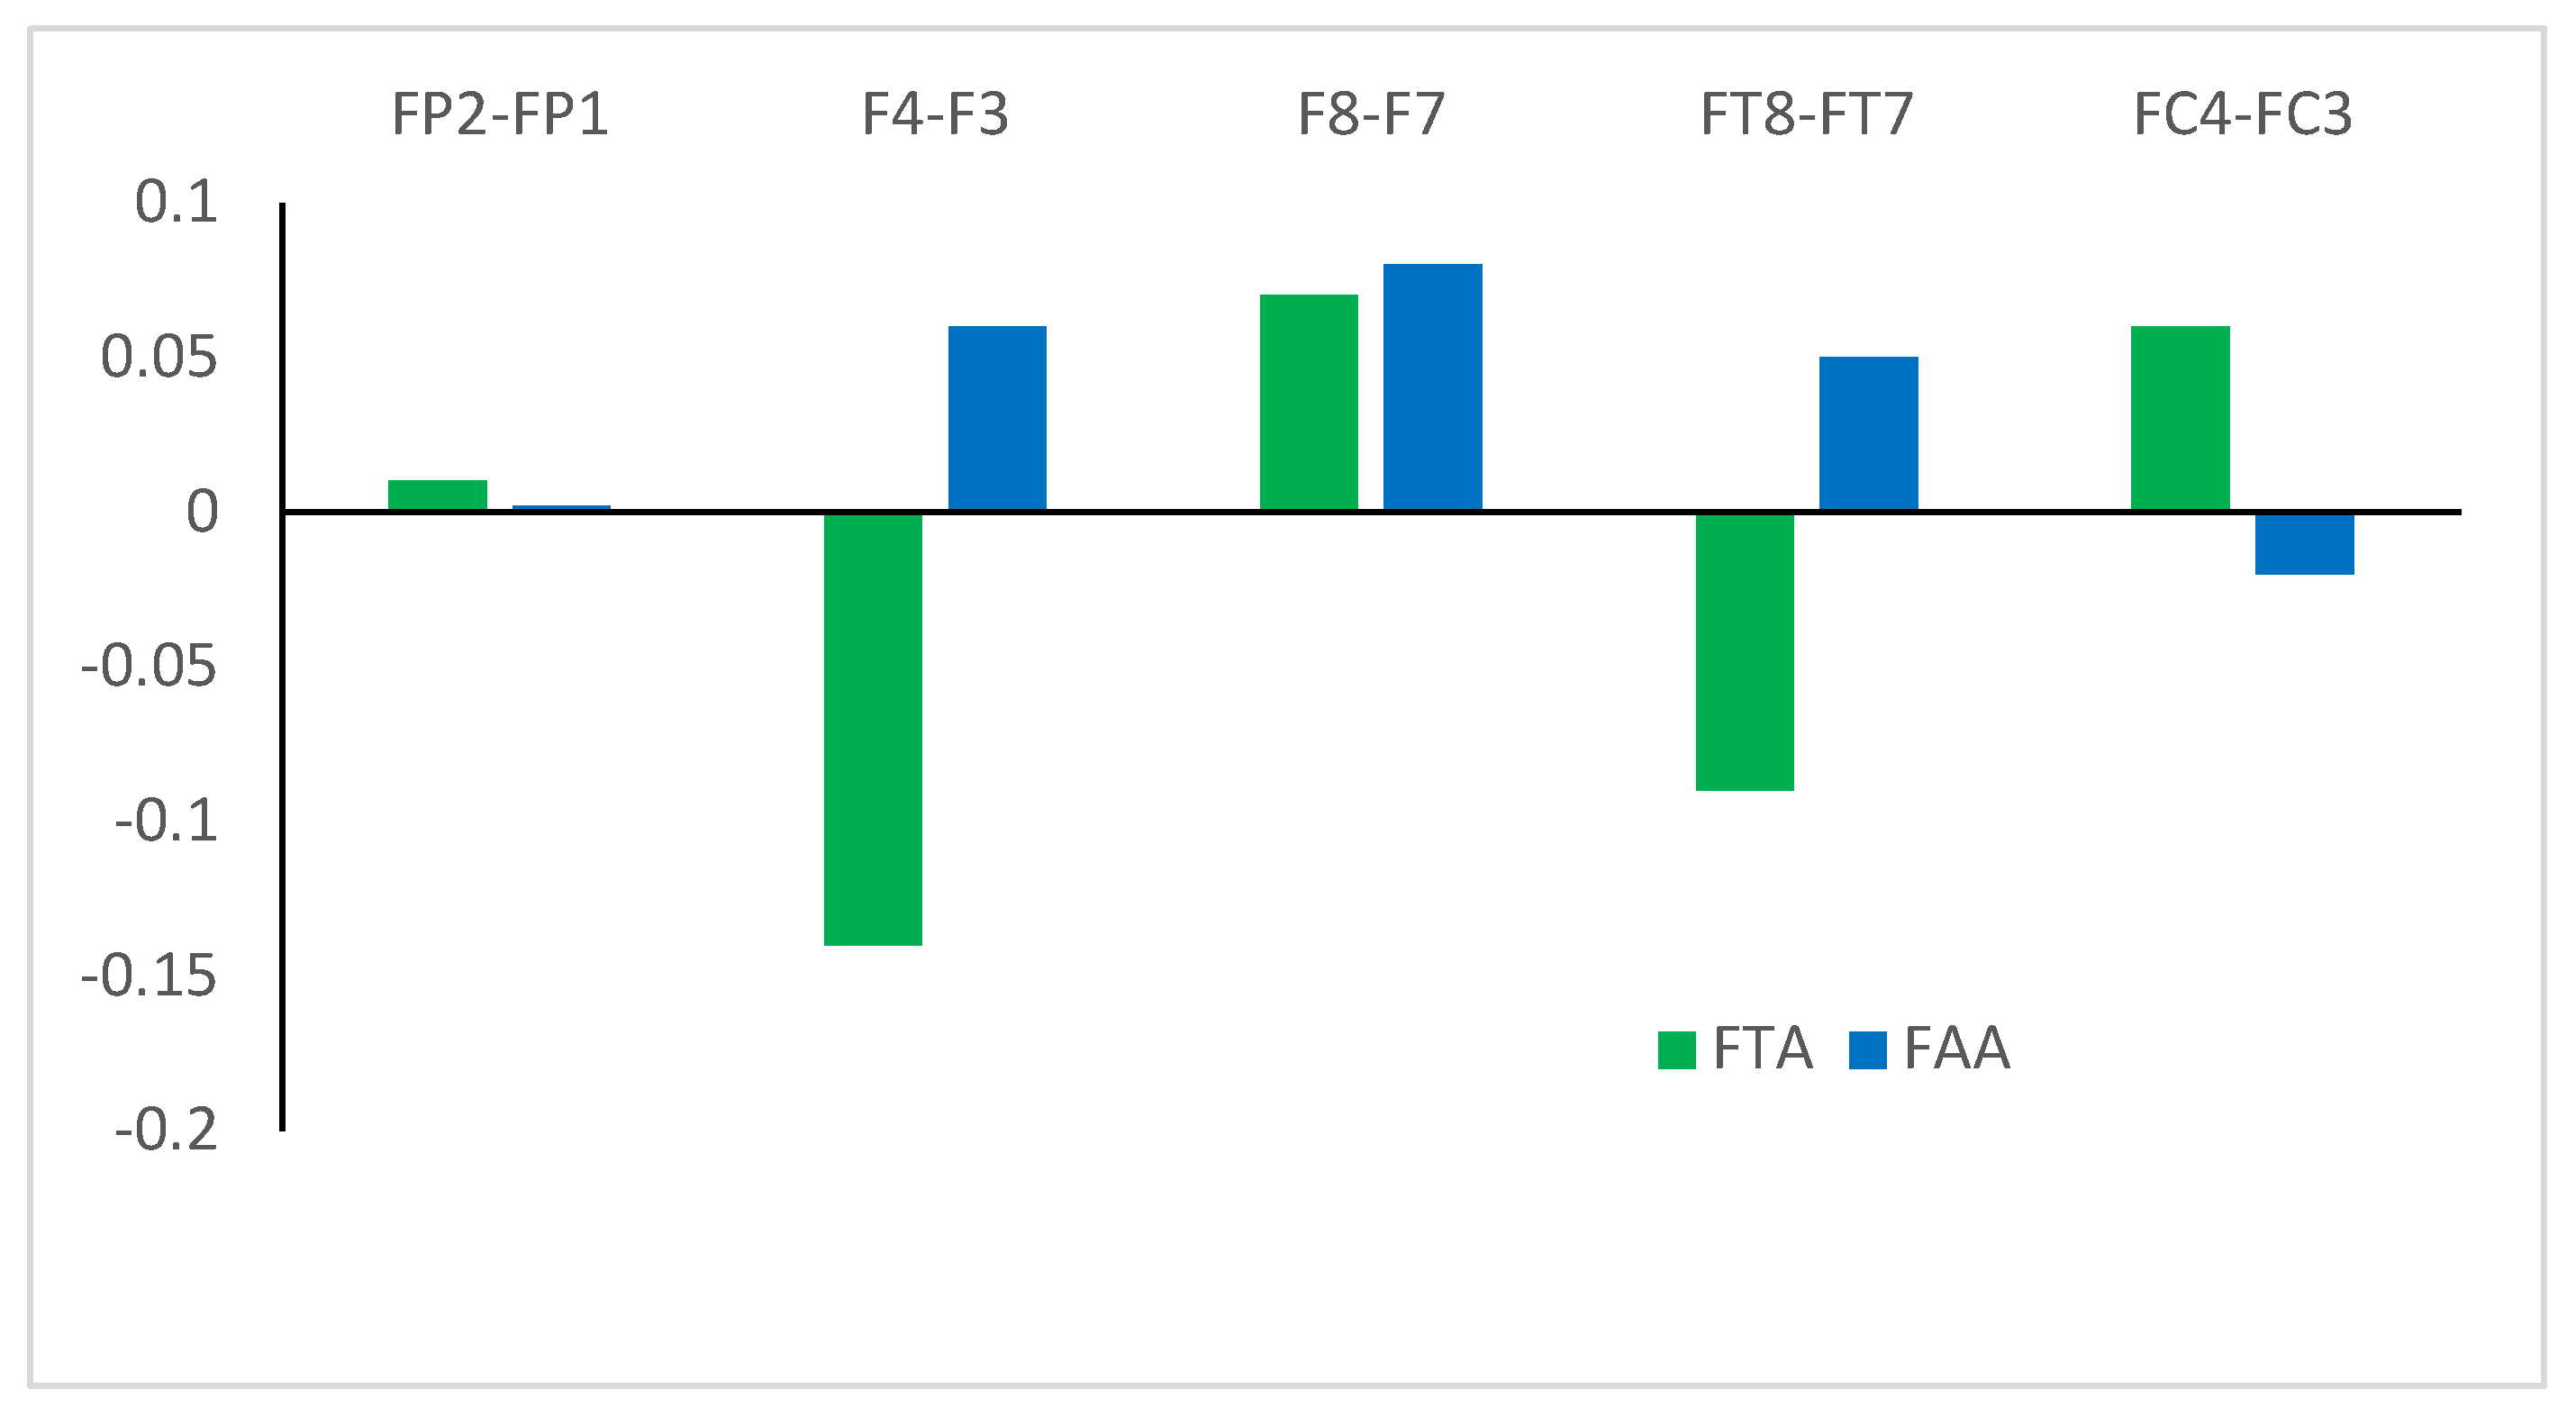
3.2. Asymmetry Data
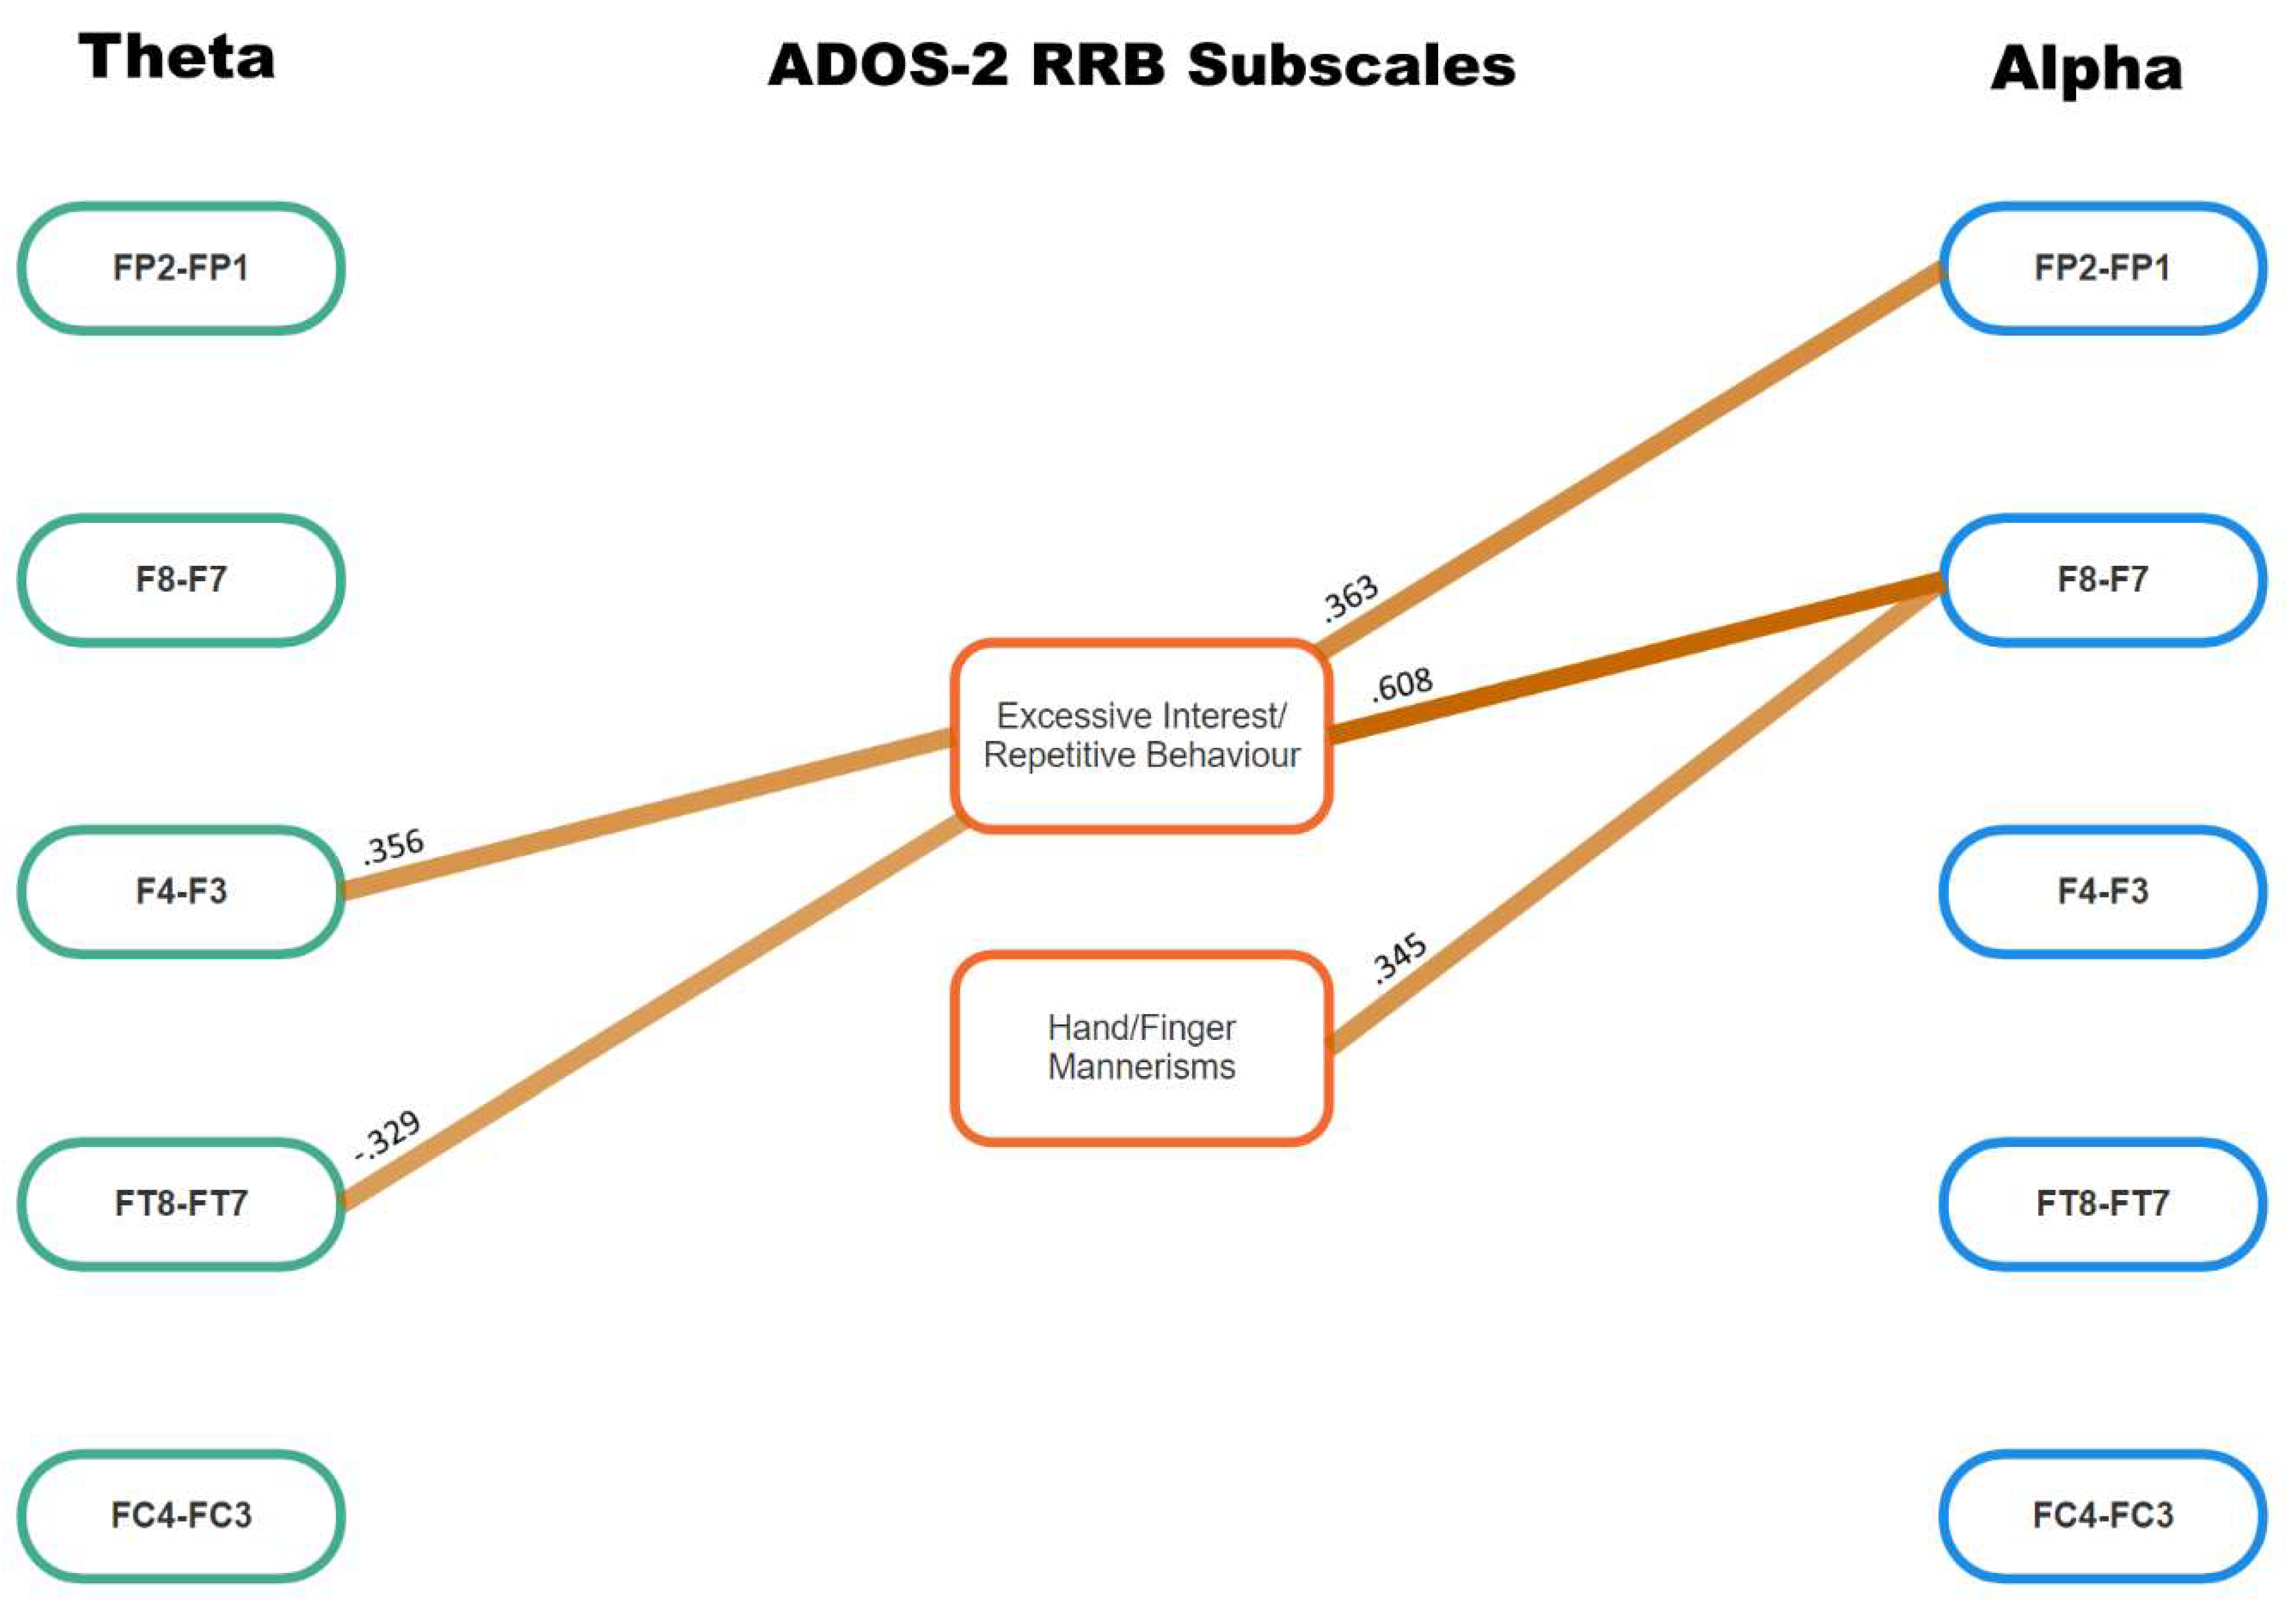
3.3. Associations between ADOS-2 Scores and Asymmetry Data
4. Discussion
4.1. Major Findings
4.2. Clinical Implications
4.3. Limitations and Future Research
5. Conclusions
Author Contributions
Funding
Institutional Review Board Statement
Informed Consent Statement
Data Availability Statement
Conflicts of Interest
References
- APA. Diagnostic and Statistical Manual of Mental Disorders; 5th Ed Text Revision; American Psychiatric Association: Washington, DC, USA, 2022. [Google Scholar]
- Postema, M.C.; van Rooij, D.; Anagnostou, E.; Arango, C.; Auzias, G.; Behrmann, M.; Filho, G.B.; Calderoni, S.; Calvo, R.; Daly, E.; et al. Altered structural brain asymmetry in autism spectrum disorder in a study of 54 datasets. Nat. Commun. 2019, 10, 4958. [Google Scholar] [CrossRef]
- Wang, J.; Barstein, J.; Ethridge, L.; Mosconi, M.; Takarae, Y.; Sweeney, J. Resting state EEG abnormalities in autism spectrum disorders. J. Neurodev. Disord. 2013, 5, 24. [Google Scholar] [CrossRef]
- Coan, J.; Allen, J. Frontal EEG asymmetry as a moderator and mediator of emotion. Biol. Psychol. 2004, 67, 7–49. [Google Scholar] [CrossRef]
- Jesulola, E.; Sharpley, C.; Bitsika, V.; Agnew, L.; Wilson, P. Frontal Alpha Asymmetry as a pathway to behavioural withdrawal in depression: Research findings and issues. Behav. Brain Res. 2015, 292, 56–67. [Google Scholar] [CrossRef] [PubMed]
- Reznik, S.J.; Allen, J.J.B. Frontal asymmetry as a mediator and moderator of emotion: An updated review. Psychophysiology 2018, 55, e12965. [Google Scholar] [CrossRef]
- Lees, T.; Fry, C.M.; Jetha, M.K.; Segalowitz, S.J.; Gatzke-Kopp, L.M. Association between EEG asymmetry and the error-related negativity across middle childhood. Biol. Psychol. 2021, 163, 108137. [Google Scholar] [CrossRef]
- Nusslock, R.; Shackman, A.J.; Harmon-Jones, E.; Alloy, L.B.; Coan, J.A.; Abramson, L.Y. Cognitive vulnerability and frontal brain asymmetry: Common predictors of first prospective depressive episode. J Abnorm. Psychol. 2011, 120, 497–503. [Google Scholar] [CrossRef]
- Bruder, G.E.; Stewart, J.W.; McGrath, P.J. Right brain, left brain in depressive disorders: Clinical and theoretical implications of behavioral, electrophysiological and neuroimaging findings. Neurosci. Biobehav. Rev. 2017, 78, 178–191. [Google Scholar] [CrossRef]
- Gabard-Durnam, L.; Tierney, A.L.; Vogel-Farley, V.; Tager-Flusberg, H.; Nelson, C.A. Alpha asymmetry in infants at risk for autism spectrum disorders. J. Autism Dev. Disord. 2015, 45, 473–480. [Google Scholar] [CrossRef]
- Lauttia, J.; Helminen, T.; Leppänen, J.; Yrttiaho, S.; Eriksson, K.; Hietanen, J.; Kylliäinen, A. Atypical Pattern of Frontal EEG Asymmetry for Direct Gaze in Young Children with Autism Spectrum Disorder. J. Autism Dev. Disord. 2019, 49, 3592–3601. [Google Scholar] [CrossRef]
- Schiltz, H.K.; McVey, A.J.; Barrington, A.; Haendel, A.D.; Dolan, B.K.; Willar, K.S.; Pleiss, S.; Karst, J.S.; Vogt, E.; Murphy, C.C. Behavioral inhibition and activation as a modifier process in autism spectrum disorder: Examination of self-reported BIS/BAS and alpha EEG asymmetry. Autism Res. 2018, 11, 1653–1666. [Google Scholar] [CrossRef]
- Garcés, P.; Baumeister, S.; Mason, L.; Chatham, C.H.; Holiga, S.; Dukart, J.; Jones, E.J.; Banaschewski, T.; Baron-Cohen, S.; Bölte, S. Resting state EEG power spectrum and functional connectivity in autism: A cross-sectional analysis. Mol. Autism 2022, 13, 22. [Google Scholar] [CrossRef]
- Loomes, R.; Hull, L.; Mandy, W. What Is the Male-to-Female Ratio in Autism Spectrum Disorder? A Systematic Review and Meta-Analysis. J. Am. Acad. Child Adolesc. Psychiatry 2017, 56, 466–474. [Google Scholar] [CrossRef]
- Brunissen, L.; Rapoport, E.; Chawarska, K.; Adesman, A. Sex differences in gender-diverse expressions and identities among youth with autism spectrum disorder. Autism Res. 2021, 14, 143–155. [Google Scholar] [CrossRef]
- Hull, L.; Petrides, K.; Allison, C.; Smith, P.; Baron-Cohen, S.; Lai, M.; Mandy, W. “Putting on my best normal”: Social camouflaging in adults with autism spectrum conditions. J. Autism Dev. Disord. 2017, 47, 2519–2534. [Google Scholar] [CrossRef]
- Neuhaus, E.; Santhosh, M.; Kresse, A.; Aylward, E.; Bernier, R.; Bookheimer, S.; Jeste, S.; Jack, A.; McPartland, J.C.; Naples, A. Frontal EEG alpha asymmetry in youth with autism: Sex differences and social–emotional correlates. Autism Res. 2023, 16, 2364–2377. [Google Scholar] [CrossRef]
- Grzadzinski, R.; Huerta, M.; Lord, C. DSM-5 and autism spectrum disorders (ASDs): An opportunity for identifying ASD subtypes. Mol. Autism 2013, 4, 1–6. [Google Scholar] [CrossRef]
- Lord, C.; Rutter, M.; DiLavore, P.; Risi, S.; Gotham, K.; Bishop, S. Autism Diagnostic Observation Schedule, Second Edition (ADOS-2); Western Psychological Services: Los Angeles, CA, USA, 2012. [Google Scholar]
- Davidson, R.J. EEG measures of cerebral asymmetry: Conceptual and methodological issues. Int. J. Neurosci. 1988, 39, 71–89. [Google Scholar] [CrossRef]
- Koller-Schlaud, K.; Ströhle, A.; Bärwolf, E.; Behr, J.; Rentzsch, J. EEG Frontal Asymmetry and Theta Power in Unipolar and Bipolar Depression. J. Affect. Disord. 2020, 276, 501–510. [Google Scholar] [CrossRef] [PubMed]
- Cavanagh, J.F.; Frank, M.J. Frontal theta as a mechanism for cognitive control. Trends Cogn. Sci. 2014, 18, 414–421. [Google Scholar] [CrossRef]
- Kawasaki, M.; Kitajo, K.; Fukao, K.; Murai, T.; Yamaguchi, Y.; Funabiki, Y. Frontal theta activation during motor synchronization in autism. Sci. Rep. 2017, 7, 15034. [Google Scholar] [CrossRef] [PubMed]
- Liegel, N.; Schneider, D.; Wascher, E.; Arnau, S. Task prioritization modulates alpha, theta and beta EEG dynamics reflecting proactive cognitive control. Sci. Rep. 2022, 12, 15072. [Google Scholar] [CrossRef]
- Filipek, P.; Accardo, P.; Baranek, G.; Cook, E.; Dawson, G.; Gordon, B.; Gravel, J.; Johnson, C.; Kallen, R.; Levy, S.; et al. The screening and diagnosis of autistic spectrum disorders. J. Autism Dev. Disabil. 1999, 29, 439–484. [Google Scholar] [CrossRef] [PubMed]
- National Research Council. Educating Children with Autism; National Academy Press: Washington, DC, USA, 2001. [Google Scholar]
- Wechsler, D. The Wechsler Abbreviated Scale of Intelligence, 2nd ed.; Pearson: Bloomington, MN, USA, 2011. [Google Scholar]
- Bitsika, V.; Sharpley, C. Brain-Behaviour Research Group Autism Study; University of New England: Armidale, NSW, Australia, 2016. [Google Scholar]
- Duffy, F.H.; Als, H. A stable pattern of EEG spectral coherence distinguishes children with autism from neuro-typical controls-a large case control study. BMC Med. 2012, 10, 64. [Google Scholar] [CrossRef] [PubMed]
- Faul, F.; Erdfelder, E.; Lang, A.-G.; Buchner, A. G*Power 3: A flexible statistical power analysis program for the social, behavioral, and biomedical sciences. Behav. Res. Methods 2007, 39, 175–191. [Google Scholar] [CrossRef] [PubMed]
- Cohen, J. Statistical Power for the Behavioural Sciences; Erlbaun: Hillsdale, NJ, USA, 1988. [Google Scholar]
- Sharpley, C.F.; Arnold, W.; Evans, I.; Bitsika, V.; Jesulola, E.; Agnew, L. Studies of EEG Asymmetry and Depression: To Normalise or Not? Symmetry 2023, 15, 1689. [Google Scholar] [CrossRef]
- Feng, C.; Wang, H.; Lu, N.; Chen, T.; He, H.; Lu, Y.; Tu, X. Log-transformation and its implications for data analysis. Shanghai Arch. Psychiatry 2014, 26, 105–109. [Google Scholar] [CrossRef]
- Koessler, L.; Maillard, L.; Benhadid, A.; Vignal, J.P.; Felblinger, J.; Vespignani, H.; Braun, M. Automated cortical projection of EEG sensors: Anatomical correlation via the international 10–10 system. Neuroimage 2009, 46, 64–72. [Google Scholar] [CrossRef]
- Silva, P.; Spedo, C.; Barreira, A.A.; Leoni, R.F. Symbol Digit Modalities Test adaptation for Magnetic Resonance Imaging environment: A systematic review and meta-analysis. Mult. Scler. Relat. Disord. 2018, 20, 136–143. [Google Scholar] [CrossRef]
- Rämä, P.; Martinkauppi, S.; Linnankoski, I.; Koivisto, J.; Aronen, H.J.; Carlson, S. Working Memory of Identification of Emotional Vocal Expressions: An fMRI Study. NeuroImage 2001, 13, 1090–1101. [Google Scholar] [CrossRef]
- Karbe, H.; Würker, M.; Herholz, K.; Ghaemi, M.; Pietrzyk, U.; Kessler, J.; Heiss, W.-D. Planum Temporale and Brodmann’s Area 22: Magnetic Resonance Imaging and High-Resolution Positron Emission Tomography Demonstrate Functional Left-Right Asymmetry. Arch. Neurol. 1995, 52, 869–874. [Google Scholar] [CrossRef]
- Rodgers, J.; Glod, M.; Connoly, B.; McConachie, H. The relationship between anxiety and repetitive behaviours in Autism Spectrum Disorder. J. Autism Dev. Disord. 2012, 42, 2404–2409. [Google Scholar] [CrossRef] [PubMed]
- Jacot-Descombes, S.; Uppal, N.; Wicinski, B.; Santos, M.; Schmeidler, J.; Giannakopoulos, P.; Heinsein, H.; Schmitz, C.; Hof, P.R. Decreased pyramidal neuron size in Brodmann areas 44 and 45 in patients with autism. Acta Neuropathol. 2012, 124, 67–79. [Google Scholar] [CrossRef]
- Bitsika, V.; Heyne, D.; Sharpley, C. Is Bullying Associated with Emerging School Refusal in Autistic Boys? J. Autism Dev. Disord. 2020, 51, 1081–1092. [Google Scholar] [CrossRef]
- Sharpley, C.; Bitsika, V.; Agnew, L.; Andronicos, N. Social Motivation is associated with elevated salivary cortisol in boys with an ASD. J. Dev. Phys. Disabil. 2015, 27, 811–822. [Google Scholar]
- Hurley-Hanson, A.E.; Giannantonio, C.M.; Griffiths, A.J.; Hurley-Hanson, A.E.; Giannantonio, C.M.; Griffiths, A.J. The stigma of autism. In Autism in the Workplace: Creating Positive Employment and Career Outcomes for Generation A; Springer: Berlin/Heidelberg, Germany, 2020; pp. 21–45. [Google Scholar]
- Kamp-Becker, I.; Tauscher, J.; Wolff, N.; Küpper, C.; Poustka, L.; Roepke, S.; Roessner, V.; Heider, D.; Stroth, S. Is the combination of ADOS and ADI-R necessary to classify ASD? Rethinking the “gold standard” in diagnosing ASD. Front. Psychiatry 2021, 12, 727308. [Google Scholar] [CrossRef]
- Kapur, S.; Phillips, A.; Insel, T. Why has it taken so long for biological psychiatry to develop clinical tests and what to do about it? Mol. Psychiatry 2012, 17, 1174. [Google Scholar] [CrossRef]
- Insel, T. Transforming Diagnosis USA: National Institute of Mental Health; 2013 [Post]. Available online: https://www.nimh.nih.gov/ (accessed on 27 May 2013).


| ADOS-2: Social Affect | |||||||||
|---|---|---|---|---|---|---|---|---|---|
| Reporting Events | Conversation | Descriptive Gestures | Eye Contact | Facial Expressions | Shared Enjoyment | Social Overtures | Social Response | Reciprocal Social Comm. | Quality of Rapport |
| 1.80 (0.40) | 1.71 (0.46) | 1.95 (0.22) | 1.80 (0.61) | 1.61 (0.49) | 1.56 (0.50) | 1.66 (0.48) | 1.49 (0.55) | 1.88 (0.33) | 1.59 (0.55) |
| ADOS-2: Restricted and Repetitive Behavior | |||||||||
| Stereotypic words | Sensory interest | Hand, finger mannerisms | Excessive interest/Repetitive behaviors | ||||||
| 0.85 (0.65) | 0.29 (0.12) | 0.51 (0.23) | 0.39 (0.32) | ||||||
| Site | FP1 | FP2 | F3 | F4 | F7 | F8 | FT7 | FT8 | FC3 | FC4 |
|---|---|---|---|---|---|---|---|---|---|---|
| Alpha | 1.56 (0.96) | 1.56 (1.01) | 1.45 (0.91) | 1.51 (0.88) | 1.51 (0.92) | 1.55 (0.91) | 1.43 (0.83) | 1.47 (0.87) | 1.55 (1.23) | 1.54 (0.95) |
| Theta | 2.22 (1.60) | 2.27 (1.76) | 1.77 (1.20) | 1.88 (1.26) | 1.96 (1.38) | 1.97 (1.31) | 1.81 (1.10) | 1.72 (1.16) | 1.41 (1.03) | 1.47 (1.00) |
| ADOS-2/EEG | SA: Reporting Events | SA: Conversation | SA: Eye Contact | SA: Shared Enjoyment | SA: Social Overtures | SA: Reciprocal Social | RRB: Hand, Finger Mannerisms | RRB: Excessive Interest/Repetitive Behaviors | Totals |
|---|---|---|---|---|---|---|---|---|---|
| FP2–FP1: theta | 0 | ||||||||
| FP2–FP1: alpha | 0.363 | 1 | |||||||
| F8–F7: theta | 0.311 | 1 | |||||||
| F8–F7: alpha | 0.385 | 0.333 | 0.345 | 0.608 | 4 | ||||
| F4–F3: theta | 0.356 | 1 | |||||||
| F4–F3: alpha | 0.421 | 0.327 | 0.346 | 3 | |||||
| FT8–FT7: theta | 0.335 | −0.329 | 2 | ||||||
| FT8–FT7: alpha | 0.417 | 1 | |||||||
| FC4–FC3: theta | 0.426 | 0.415 | 0.335 | 3 | |||||
| FC4–FC3: alpha | 0.456 | 1 |
Disclaimer/Publisher’s Note: The statements, opinions and data contained in all publications are solely those of the individual author(s) and contributor(s) and not of MDPI and/or the editor(s). MDPI and/or the editor(s) disclaim responsibility for any injury to people or property resulting from any ideas, methods, instructions or products referred to in the content. |
© 2024 by the authors. Licensee MDPI, Basel, Switzerland. This article is an open access article distributed under the terms and conditions of the Creative Commons Attribution (CC BY) license (https://creativecommons.org/licenses/by/4.0/).
Share and Cite
Bitsika, V.; Sharpley, C.F.; Evans, I.D.; Vessey, K.A. Neurological Validation of ASD Diagnostic Criteria Using Frontal Alpha and Theta Asymmetry. J. Clin. Med. 2024, 13, 4876. https://doi.org/10.3390/jcm13164876
Bitsika V, Sharpley CF, Evans ID, Vessey KA. Neurological Validation of ASD Diagnostic Criteria Using Frontal Alpha and Theta Asymmetry. Journal of Clinical Medicine. 2024; 13(16):4876. https://doi.org/10.3390/jcm13164876
Chicago/Turabian StyleBitsika, Vicki, Christopher F. Sharpley, Ian D. Evans, and Kirstan A. Vessey. 2024. "Neurological Validation of ASD Diagnostic Criteria Using Frontal Alpha and Theta Asymmetry" Journal of Clinical Medicine 13, no. 16: 4876. https://doi.org/10.3390/jcm13164876