
Evaluation of Intra- and Inter-Network Connectivity within Major Brain Networks in Drug-Resistant Depression Using rs-fMRI

 , , ,
, , ,  , ,
, ,
Abstract
1. Introduction
2. Materials and Methods
2.1. Study Participants
2.2. Neuroimaging
2.2.1. First-Level Analysis
2.2.2. Second-Level Analysis
3. Results
4. Discussion
5. Strengths and Limitations
6. Conclusions
Author Contributions
Funding
Institutional Review Board Statement
Informed Consent Statement
Data Availability Statement
Acknowledgments
Conflicts of Interest
References
- The Global Burden of Disease: 2004 Update. World Health Organization. Available online: https://www.who.int/publications/i/item/9789241563710 (accessed on 13 August 2024).
- Pedersen, C.B.; Mors, O.; Bertelsen, A.; Waltoft, B.L.; Agerbo, E.; McGrath, J.J.; Mortensen, P.B.; Eaton, W.W. A comprehensive nationwide study of the incidence rate and lifetime risk for treated mental disorders. JAMA Psychiatry 2014, 71, 573–581. [Google Scholar] [CrossRef] [PubMed]
- Malhi, G.S.; Mann, J.J. Depression. Lancet 2018, 392, 2299–2312. [Google Scholar] [CrossRef] [PubMed]
- Chand, S.P.; Arif, H. Depression. In StatPearls [Internet]; StatPearls Publishing: Treasure Island, FL, USA, 2024. [Google Scholar] [PubMed]
- Proudman, D.; Greenberg, P.; Nellesen, D. The Growing Burden of Major Depressive Disorders (MDD): Implications for Researchers and Policy Makers. Pharmacoeconomics 2021, 39, 619–625. [Google Scholar] [CrossRef] [PubMed] [PubMed Central]
- Mathers, C.D.; Loncar, D. Projections of global mortality and burden of disease from 2002 to 2030. PLoS Med. 2006, 3, e442. [Google Scholar] [CrossRef] [PubMed] [PubMed Central]
- Guo, W.; Liu, F.; Xue, Z.; Gao, K.; Liu, Z.; Xiao, C.; Chen, H.; Zhao, J. Decreased interhemispheric coordination in treatment-resistant depression: A resting-state fMRI study. PLoS ONE 2013, 8, e71368. [Google Scholar] [CrossRef] [PubMed] [PubMed Central]
- Helm, K.; Viol, K.; Weiger, T.M.; Tass, P.A.; Grefkes, C.; Del Monte, D.; Schiepek, G. Neuronal connectivity in major depressive disorder: A systematic review. Neuropsychiatr. Dis. Treat. 2018, 14, 2715–2737. [Google Scholar] [CrossRef] [PubMed]
- Castrén, E. Neuronal network plasticity and recovery from depression. JAMA Psychiatry 2013, 70, 983–989. [Google Scholar] [CrossRef] [PubMed]
- Leistedt, S.J.; Linkowski, P. Brain, networks, depression, and more. Eur. Neuropsychopharmacol. 2013, 23, 55–62. [Google Scholar] [CrossRef] [PubMed]
- Dutta, A.; McKie, S.; Deakin, J.F. Resting state networks in major depressive disorder. Psychiatry Res. 2014, 224, 139–151, Erratum in Psychiatry Res. 2015, 234, 392–397. [Google Scholar] [CrossRef] [PubMed]
- Castrén, E. Is mood chemistry? Nat. Rev. Neurosci. 2005, 6, 241–246. [Google Scholar] [CrossRef] [PubMed]
- Eickhoff, S.B.; Grefkes, C. Approaches for the integrated analysis of structure, function and connectivity of the human brain. Clin. EEG Neurosci. 2011, 42, 107–121. [Google Scholar] [CrossRef] [PubMed] [PubMed Central]
- Belmaker, R.H.; Agam, G. Major depressive disorder. N. Engl. J. Med. 2008, 358, 55–68. [Google Scholar] [CrossRef] [PubMed]
- Millan, M.J. The role of monoamines in the actions of established and “novel” antidepressant agents: A critical review. Eur. J. Pharmacol. 2004, 500, 371–384. [Google Scholar] [CrossRef] [PubMed]
- Whitfield-Gabrieli, S.; Ford, J.M. Default mode network activity and connectivity in psychopathology. Annu. Rev. Clin. Psychol. 2012, 8, 49–76. [Google Scholar] [CrossRef] [PubMed]
- Mulders, P.C.; van Eijndhoven, P.F.; Schene, A.H.; Beckmann, C.F.; Tendolkar, I. Resting-state functional connectivity in major depressive disorder: A review. Neurosci. Biobehav. Rev. 2015, 56, 330–344. [Google Scholar] [CrossRef] [PubMed]
- Albert, P.R. Why is depression more prevalent in women? J. Psychiatry Neurosci. 2015, 40, 219–221. [Google Scholar] [CrossRef] [PubMed] [PubMed Central]
- Greicius, M.D.; Menon, V. Default-mode activity during a passive sensory task: Uncoupled from deactivation but impacting activation. J. Cogn. Neurosci. 2004, 16, 1484–1492. [Google Scholar] [CrossRef] [PubMed]
- Zhu, Y.; Huang, T.; Li, R.; Yang, Q.; Zhao, C.; Yang, M.; Lin, B.; DIRECT Consortium; Li, X. Distinct resting-state effective connectivity of large-scale networks in first-episode and recurrent major depression disorder: Evidence from the REST-meta-MDD consortium. Front. Neurosci. 2023, 17, 1308551. [Google Scholar] [CrossRef] [PubMed]
- Fox, M.D.; Greicius, M. Clinical applications of resting state functional connectivity. Front. Syst. Neurosci. 2010, 4, 19. [Google Scholar] [CrossRef] [PubMed] [PubMed Central]
- Lee, M.H.; Smyser, C.D.; Shimony, J.S. Resting-state fMRI: A review of methods and clinical applications. AJNR Am. J. Neuroradiol. 2013, 34, 1866–1872. [Google Scholar] [CrossRef] [PubMed] [PubMed Central]
- Iwabuchi, S.J.; Krishnadas, R.; Li, C.; Auer, D.P.; Radua, J.; Palaniyappan, L. Localized connectivity in depression: A meta-analysis of resting state functional imaging studies. Neurosci. Biobehav. Rev. 2015, 51, 77–86. [Google Scholar] [CrossRef] [PubMed]
- Brakowski, J.; Spinelli, S.; Dörig, N.; Bosch, O.G.; Manoliu, A.; Holtforth, M.G.; Seifritz, E. Resting state brain network function in major depression—Depression symptomatology, antidepressant treatment effects, future research. J. Psychiatr. Res. 2017, 92, 147–159. [Google Scholar] [CrossRef] [PubMed]
- Runia, N.; Yücel, D.E.; Lok, A.; de Jong, K.; Denys, D.A.J.P.; van Wingen, G.A.; Bergfeld, I.O. The neurobiology of treatment-resistant depression: A systematic review of neuroimaging studies. Neurosci. Biobehav. Rev. 2022, 132, 433–448. [Google Scholar] [CrossRef] [PubMed]
- Ding, Y.D.; Chen, X.; Chen, Z.B.; Li, L.; Li, X.Y.; Castellanos, F.X.; Bai, T.J.; Bo, Q.J.; Cao, J.; Chang, Z.K.; et al. Reduced nucleus accumbens functional connectivity in reward network and default mode network in patients with recurrent major depressive disorder. Transl. Psychiatry 2022, 12, 236. [Google Scholar] [CrossRef] [PubMed] [PubMed Central]
- Tan, W.; Ouyang, X.; Huang, D.; Wu, Z.; Liu, Z.; He, Z.; Long, Y. REST-meta-MDD Consortium. Disrupted intrinsic functional brain network in patients with late-life depression: Evidence from a multi-site dataset. J. Affect. Disord. 2023, 323, 631–639. [Google Scholar] [CrossRef] [PubMed]
- Friston, K.J.; Ashburner, J.; Kiebel, S.J.; Nichols, T.E.; Penny, W.D. (Eds.) Statistical Parametric Mapping: The Analysis of Functional Brain Images; Academic Press: Cambridge, MA, USA, 2007. [Google Scholar]
- Andersson, J.L.; Hutton, C.; Ashburner, J.; Turner, R.; Friston, K. Modeling geometric deformations in EPI time series. NeuroImage 2001, 13, 903–919. [Google Scholar] [CrossRef] [PubMed]
- Henson, R.N.A.; Buechel, C.; Josephs, O.; Friston, K.J. The slicetiming problem in event-related fMRI. NeuroImage 1999, 9, 125. [Google Scholar]
- Ashburner, J.; Friston, K.J. Unified segmentation. NeuroImage 2005, 26, 839–851. [Google Scholar] [CrossRef] [PubMed]
- Behzadi, Y.; Restom, K.; Liau, J.; Liu, T.T. A component based noise correction method (CompCor) for BOLD and perfusion based fMRI. NeuroImage 2007, 37, 90–101. [Google Scholar] [CrossRef] [PubMed]
- Hallquist, M.N.; Hwang, K.; Luna, B. The nuisance of nuisance regression: Spectral misspecification in a common approach to resting-state fMRI preprocessing reintroduces noise and obscures functional connectivity. NeuroImage 2013, 82, 208–225. [Google Scholar] [CrossRef] [PubMed]
- Boubela, R.N.; Kalcher, K.; Huf, W.; Seidel, E.M.; Derntl, B.; Pezawas, L.; Našel, C.; Moser, E. fMRI measurements of amygdala activation are confounded by stimulus correlated signal fluctuation in nearby veins draining distant brain regions. Sci. Rep. 2015, 5, 10499. [Google Scholar] [CrossRef] [PubMed] [PubMed Central]
- Via, E.; Cardoner, N.; Pujol, J.; Alonso, P.; López-Solà, M.; Real, E.; Contreras-Rodríguez, O.; Deus, J.; Segalàs, C.; Menchón, J.M.; et al. Amygdala activation and symptom dimensions in obsessive-compulsive disorder. Br. J. Psychiatry 2014, 204, 61–68. [Google Scholar] [CrossRef] [PubMed]
- Smith, S.M.; Beckmann, C.F.; Andersson, J.; Auerbach, E.J.; Bijsterbosch, J.; Douaud, G.; Duff, E.; Feinberg, D.A.; Griffanti, L.; Harms, M.P.; et al. Resting-state fMRI in the Human Connectome Project. Neuroimage 2013, 80, 144–168. [Google Scholar] [CrossRef] [PubMed] [PubMed Central]
- Uddin, L.Q.; Yeo, B.T.T.; Spreng, R.N. Towards a Universal Taxonomy of Macro-scale Functional Human Brain Networks. Brain Topogr. 2019, 32, 926–942. [Google Scholar] [CrossRef] [PubMed] [PubMed Central]
- Liu, J.; Zhu, Q.; Zhu, L.; Yang, Y.; Zhang, Y.; Liu, X.; Zhang, L.; Jia, Y.; Peng, Q.; Wang, J.; et al. Altered brain network in first-episode, drug-naive patients with major depressive disorder. J. Affect. Disord. 2022, 297, 1–7. [Google Scholar] [CrossRef] [PubMed]
- Javaheripour, N.; Lim, M.; Chand, T.; Krug, A.; Kircher, T.; Dannlowski, U.; Nenadić, I.; Hamilton, J.P.; Sacchet, M.D.; Gotlib, I.H.; et al. Altered resting-state functional connectome in major depressive disorder: A mega-analysis from the PsyMRI consortium. Transl. Psychiatry 2021, 11, 511. [Google Scholar] [CrossRef] [PubMed]
- Deng, Y.; Shi, L.; Lei, Y.; Liang, P.; Li, K.; Chu, W.C.; Wang, D. Alzheimer’s Disease Neuroimaging Initiative. Mapping the “What” and “Where” Visual Cortices and Their Atrophy in Alzheimer’s Disease: Combined Activation Likelihood Estimation with Voxel-Based Morphometry. Front. Hum. Neurosci. 2016, 10, 333. [Google Scholar] [CrossRef] [PubMed] [PubMed Central]
- Wandell, B.A.; Brewer, A.A.; Dougherty, R.F. Visual field map clusters in human cortex. Philos. Trans. R. Soc. Lond. B Biol. Sci. 2005, 360, 693–707. [Google Scholar] [CrossRef] [PubMed] [PubMed Central]
- Tyler, C.W.; Likova, L.T.; Chen, C.; Kontsevich, L.L.; Schira, M.M.; Wade, A.R. Extended concepts of occipital retinotopy. Curr. Med. Imaging Rev. 2005, 1, 319–329. [Google Scholar] [CrossRef]
- Li, D.; Zhang, H.; Liu, Y.; Liang, X.; Chen, Y.; Zheng, Y.; Qiu, S.; Cui, Y. Abnormal Functional Connectivity of Posterior Cingulate Cortex Correlates With Phonemic Verbal Fluency Deficits in Major Depressive Disorder. Front. Neurol. 2021, 12, 724874. [Google Scholar] [CrossRef] [PubMed]
- Hamilton, J.P.; Farmer, M.; Fogelman, P.; Gotlib, I.H. Depressive Rumination, the Default-Mode Network, and the Dark Matter of Clinical Neuroscience. Biol. Psychiatry 2015, 78, 224–230. [Google Scholar] [CrossRef] [PubMed] [PubMed Central]
- Wang, K.; Jiang, T.; Yu, C.; Tian, L.; Li, J.; Liu, Y.; Zhou, Y.; Xu, L.; Song, M.; Li, K. Spontaneous activity associated with primary visual cortex: A resting-state FMRI study. Cereb. Cortex. 2008, 18, 697–704. [Google Scholar] [CrossRef] [PubMed]
- Gosselin, P.; Kirouac, G.; Doré, F.Y. Components and recognition of facial expression in the communication of emotion by actors. J. Pers. Soc. Psychol. 1995, 68, 83–96. [Google Scholar] [CrossRef] [PubMed]
- Sagliano, L.; Ponari, M.; Conson, M.; Trojano, L. Editorial: The interpersonal effects of emotions: The influence of facial expressions on social interactions. Front. Psychol. 2022, 13, 1074216. [Google Scholar] [CrossRef] [PubMed] [PubMed Central]
- Lu, F.; Cui, Q.; Huang, X.; Li, L.; Duan, X.; Chen, H.; Pang, Y.; He, Z.; Sheng, W.; Han, S.; et al. Anomalous intrinsic connectivity within and between visual and auditory networks in major depressive disorder. Prog. Neuropsychopharmacol. Biol. Psychiatry 2020, 100, 109889. [Google Scholar] [CrossRef] [PubMed]
- Long, Y.; Li, X.; Cao, H.; Zhang, M.; Lu, B.; Huang, Y.; Liu, M.; Xu, M.; Liu, Z.; Yan, C.; et al. Common and distinct functional brain network abnormalities in adolescent, early-middle adult, and late adult major depressive disorders. Psychol. Med. 2024, 54, 582–591. [Google Scholar] [CrossRef] [PubMed]
- Chen, H.; Liu, K.; Zhang, B.; Zhang, J.; Xue, X.; Lin, Y.; Zou, D.; Chen, M.; Kong, Y.; Wen, G.; et al. More optimal but less regulated dorsal and ventral visual networks in patients with major depressive disorder. J. Psychiatr. Res. 2019, 110, 172–178. [Google Scholar] [CrossRef] [PubMed]
- Abou, E.A.; Nissilä, J.; Liettu, A.; Remes, J.; Jokelainen, J.; Takala, T.; Aunio, A.; Starck, T.; Nikkinen, J.; Koponen, H.; et al. Altered resting-state activity in seasonal affective disorder. Hum. Brain Mapp. 2014, 35, 161–172. [Google Scholar] [CrossRef] [PubMed] [PubMed Central]
- Keedwell, P.; Drapier, D.; Surguladze, S.; Giampietro, V.; Brammer, M.; Phillips, M. Neural markers of symptomatic improvement during antidepressant therapy in severe depression: Subgenual cingulate and visual cortical responses to sad, but not happy, facial stimuli are correlated with changes in symptom score. J. Psychopharmacol. 2009, 23, 775–788. [Google Scholar] [CrossRef] [PubMed]
- Hamilton, J.P.; Chen, M.C.; Gotlib, I.H. Neural systems approaches to understanding major depressive disorder: An intrinsic functional organization perspective. Neurobiol. Dis. 2013, 52, 4–11. [Google Scholar] [CrossRef] [PubMed] [PubMed Central]
- Hamilton, J.P.; Etkin, A.; Furman, D.J.; Lemus, M.G.; Johnson, R.F.; Gotlib, I.H. Functional neuroimaging of major depressive disorder: A meta-analysis and new integration of base line activation and neural response data. Am. J. Psychiatry 2012, 169, 693–703. [Google Scholar] [CrossRef] [PubMed]
- Kaiser, R.H.; Andrews-Hanna, J.R.; Wager, T.D.; Pizzagalli, D.A. Large-Scale Network Dys-function in Major Depressive Disorder: A Meta-analysis of Resting-State Functional Connectivity. JAMA Psychiatry 2015, 72, 603–611. [Google Scholar] [CrossRef] [PubMed] [PubMed Central]
- Gao, Y.; Guo, X.; Zhong, Y.; Liu, X.; Tian, S.; Deng, J.; Lin, X.; Bao, Y.; Lu, L.; Wang, G. Decreased dorsal attention network homogeneity as a potential neuroimaging biomarker for major depressive disorder. J. Affect. Disord. 2023, 332, 136–142. [Google Scholar] [CrossRef] [PubMed]
- Yu, M.; Linn, K.A.; Shinohara, R.T.; Oathes, D.J.; Cook, P.A.; Duprat, R.; Moore, T.M.; Oquendo, M.A.; Phillips, M.L.; McInnis, M.; et al. Childhood trauma history is linked to abnormal brain connectivity in major depression. Proc. Natl. Acad. Sci. USA 2019, 116, 8582–8590, Erratum in Proc. Natl. Acad. Sci. USA 2019, 116, 13146. [Google Scholar] [CrossRef] [PubMed] [PubMed Central]
- Palaniyappan, L.; Liddle, P.F. Does the salience network play a cardinal role in psychosis? An emerging hypothesis of insular dysfunction. J. Psychiatry Neurosci. 2012, 37, 17–27. [Google Scholar] [CrossRef] [PubMed] [PubMed Central]
- Perlman, G.; Simmons, A.N.; Wu, J.; Hahn, K.S.; Tapert, S.F.; Max, J.E.; Paulus, M.P.; Brown, G.G.; Frank, G.K.; Campbell-Sills, L.; et al. Amygdala response and functional connectivity during emotion regulation: A study of 14 depressed adolescents. J. Affect. Disord. 2012, 139, 75–84. [Google Scholar] [CrossRef] [PubMed] [PubMed Central]
- Pizzagalli, D.A.; Roberts, A.C. Correction: Prefrontal cortex and depression. Neuropsychopharmacology 2022, 47, 609, Erratum in Neuropsychopharmacology 2022, 47, 225–246. [Google Scholar] [CrossRef] [PubMed] [PubMed Central]
- Dumontheil, I.; Burgess, P.W.; Blakemore, S.J. Development of rostral prefrontal cortex and cognitive and behavioural disorders. Dev. Med. Child. Neurol. 2008, 50, 168–181. [Google Scholar] [CrossRef] [PubMed] [PubMed Central]
- McGlade, E.; Rogowska, J.; DiMuzio, J.; Bueler, E.; Sheth, C.; Legarreta, M.; Yurgelun-Todd, D. Neurobiological evidence of sexual dimorphism in limbic circuitry of US Veterans. J. Affect. Disord. 2020, 274, 1091–1101. [Google Scholar] [CrossRef] [PubMed]
- Colich, N.L.; Ho, T.C.; Foland-Ross, L.C.; Eggleston, C.; Ordaz, S.J.; Singh, M.K.; Gotlib, I.H. Hyperactivation in Cognitive Control and Visual Attention Brain Regions During Emotional Interference in Adolescent Depression. Biol. Psychiatry Cogn. Neurosci. Neuroimaging. 2017, 2, 388–395. [Google Scholar] [CrossRef] [PubMed] [PubMed Central]
- Seeley, W.W.; Menon, V.; Schatzberg, A.F.; Keller, J.; Glover, G.H.; Kenna, H.; Reiss, A.L.; Greicius, M.D. Dissociable intrinsic connectivity networks for salience processing and executive control. J. Neurosci. 2007, 27, 2349–2356. [Google Scholar] [CrossRef] [PubMed]
- Podgórski, P.; Waliszewska-Prosół, M.; Zimny, A.; Sąsiadek, M.; Bladowska, J. Resting-State Functional Connectivity of the Ageing Female Brain-Differences Between Young and Elderly Female Adults on Multislice Short TR rs-fMRI. Front. Neurol. 2021, 12, 645974. [Google Scholar] [CrossRef] [PubMed] [PubMed Central]
- Lai, C.H. Task MRI-Based Functional Brain Network of Major Depression. Adv. Exp. Med. Biol. 2021, 1305, 19–33. [Google Scholar] [CrossRef] [PubMed]
- Luking, K.R.; Repovs, G.; Belden, A.C.; Gaffrey, M.S.; Botteron, K.N.; Luby, J.L.; Barch, D.M. Functional connectivity of the amygdala in early-childhood-onset depression. J. Am. Acad. Child. Adolesc. Psychiatry 2011, 50, 1027–1041.e3. [Google Scholar] [CrossRef] [PubMed] [PubMed Central]
- Wei, S.; Womer, F.; Geng, H.; Jiang, X.; Zhou, Q.; Chang, M.; Zhou, Y.; Tang, Y.; Wang, F. Similarities and differences of functional connectivity in drug-naïve, first-episode adolescent and young adult with major depressive dis-order and schizophrenia. Sci. Rep. 2017, 7, 44316. [Google Scholar] [CrossRef] [PubMed] [PubMed Central]
- Tang, Y.; Kong, L.; Wu, F.; Womer, F.; Jiang, W.; Cao, Y.; Ren, L.; Wang, J.; Fan, G.; Blumberg, H.P.; et al. Decreased functional connectivity between the amygdala and the left ventral prefrontal cortex in treatment-naive patients with major depressive disorder: A resting-state functional magnetic resonance imaging study. Psychol. Med. 2013, 43, 1921–1927. [Google Scholar] [CrossRef] [PubMed]
- Lu, Q.; Li, H.; Luo, G.; Wang, Y.; Tang, H.; Han, L.; Yao, Z. Impaired prefrontal-amygdala effective connectivity is responsible for the dysfunction of emotion process in major depressive disorder: A dynamic causal modeling study on MEG. Neurosci. Lett. 2012, 523, 125–130. [Google Scholar] [CrossRef] [PubMed]
- Siegle, G.J.; Thompson, W.; Carter, C.S.; Steinhauer, S.R.; Thase, M.E. Increased amygdala and decreased dorsolateral prefrontal BOLD responses in unipolar depression: Related and independent features. Biol. Psychiatry 2007, 61, 198–209. [Google Scholar] [CrossRef] [PubMed]
- Kanske, P.; Heissler, J.; Schönfelder, S.; Bongers, A.; Wessa, M. How to regulate emotion? Neural networks for reappraisal and distraction. Cereb. Cortex. 2011, 21, 1379–1388. [Google Scholar] [CrossRef] [PubMed]
- Depping, M.S.; Schmitgen, M.M.; Kubera, K.M.; Wolf, R.C. Cerebellar Contributions to Major Depression. Front. Psychiatry 2018, 9, 634. [Google Scholar] [CrossRef] [PubMed] [PubMed Central]
- Alalade, E.; Denny, K.; Potter, G.; Steffens, D.; Wang, L. Altered cerebellar-cerebral function-al connectivity in geriatric depression. PLoS ONE 2011, 6, e20035. [Google Scholar] [CrossRef] [PubMed] [PubMed Central]
- Liu, L.; Zeng, L.L.; Li, Y.; Ma, Q.; Li, B.; Shen, H.; Hu, D. Altered cerebellar functional connectivity with intrinsic connectivity networks in adults with major depressive disorder. PLoS ONE 2012, 7, e39516. [Google Scholar] [CrossRef] [PubMed] [PubMed Central]
- Guo, W.; Liu, F.; Xue, Z.; Gao, K.; Liu, Z.; Xiao, C.; Chen, H.; Zhao, J. Abnormal resting-state cerebellar-cerebral function-al connectivity in treatment-resistant depression and treatment sensitive depression. Prog. Neuropsychopharmacol. Biol. Psychiatry 2013, 44, 51–57. [Google Scholar] [CrossRef] [PubMed]
- Guo, W.; Liu, F.; Dai, Y.; Jiang, M.; Zhang, J.; Yu, L.; Long, L.; Chen, H.; Gao, Q.; Xiao, C. Decreased interhemispheric resting-state function-al connectivity in first-episode, drug-naive major depressive disorder. Prog. Neuropsychopharmacol. Biol. Psychiatry 2013, 41, 24–29. [Google Scholar] [CrossRef] [PubMed]
- Guo, W.; Liu, F.; Liu, J.; Yu, M.; Zhang, Z.; Liu, G.; Xiao, C.; Zhao, J. Increased cerebellar-default-mode-network connectivity in drug-naive major depressive disorder at rest. Medicine 2015, 94, e560. [Google Scholar] [CrossRef] [PubMed] [PubMed Central]
- Feng, L.; Wu, D.; Ma, S.; Dong, L.; Yue, Y.; Li, T.; Tang, Y.; Ye, Z.; Mao, G. Resting-state functional connectivity of the cerebellum-cerebrum in older women with depressive symptoms. BMC Psychiatry 2023, 23, 732. [Google Scholar] [CrossRef] [PubMed] [PubMed Central]
- Machaj, W.; Podgórski, P.; Jagiełło, J.; Maciaszek, J.; Piotrowski, P.; Szcześniak, D.; Rymaszewska, J.; Zimny, A. Evaluation of alterations in intra- and inter-network connectivity in restingstate functional magnetic resonance imaging (rs-fMRI) in patients with Major Depressive Disorder. In Proceedings of the ECR24, Vienna, Austria, 28 February–3 March 2024. [Google Scholar]


| Demographic Data | Study Group | Control Group |
|---|---|---|
| Number of participants | 26 | 26 |
| Mean age (years) | 39.4 | 32.1 |
| Range age (years) | 21–64 | 26–60 |
| Female/male | 13/13 | 16/10 |
| Mean years of education | 15.3 | 15.9 |
| Mean duration of disease (years) | 14 (1–44) | - |
| Antidepressant usage | yes (26) | - |
| HAM-D score (range) | 21.7 (17–32) | - |
| MADRS score (range) | 27.7 (19–41) | - |
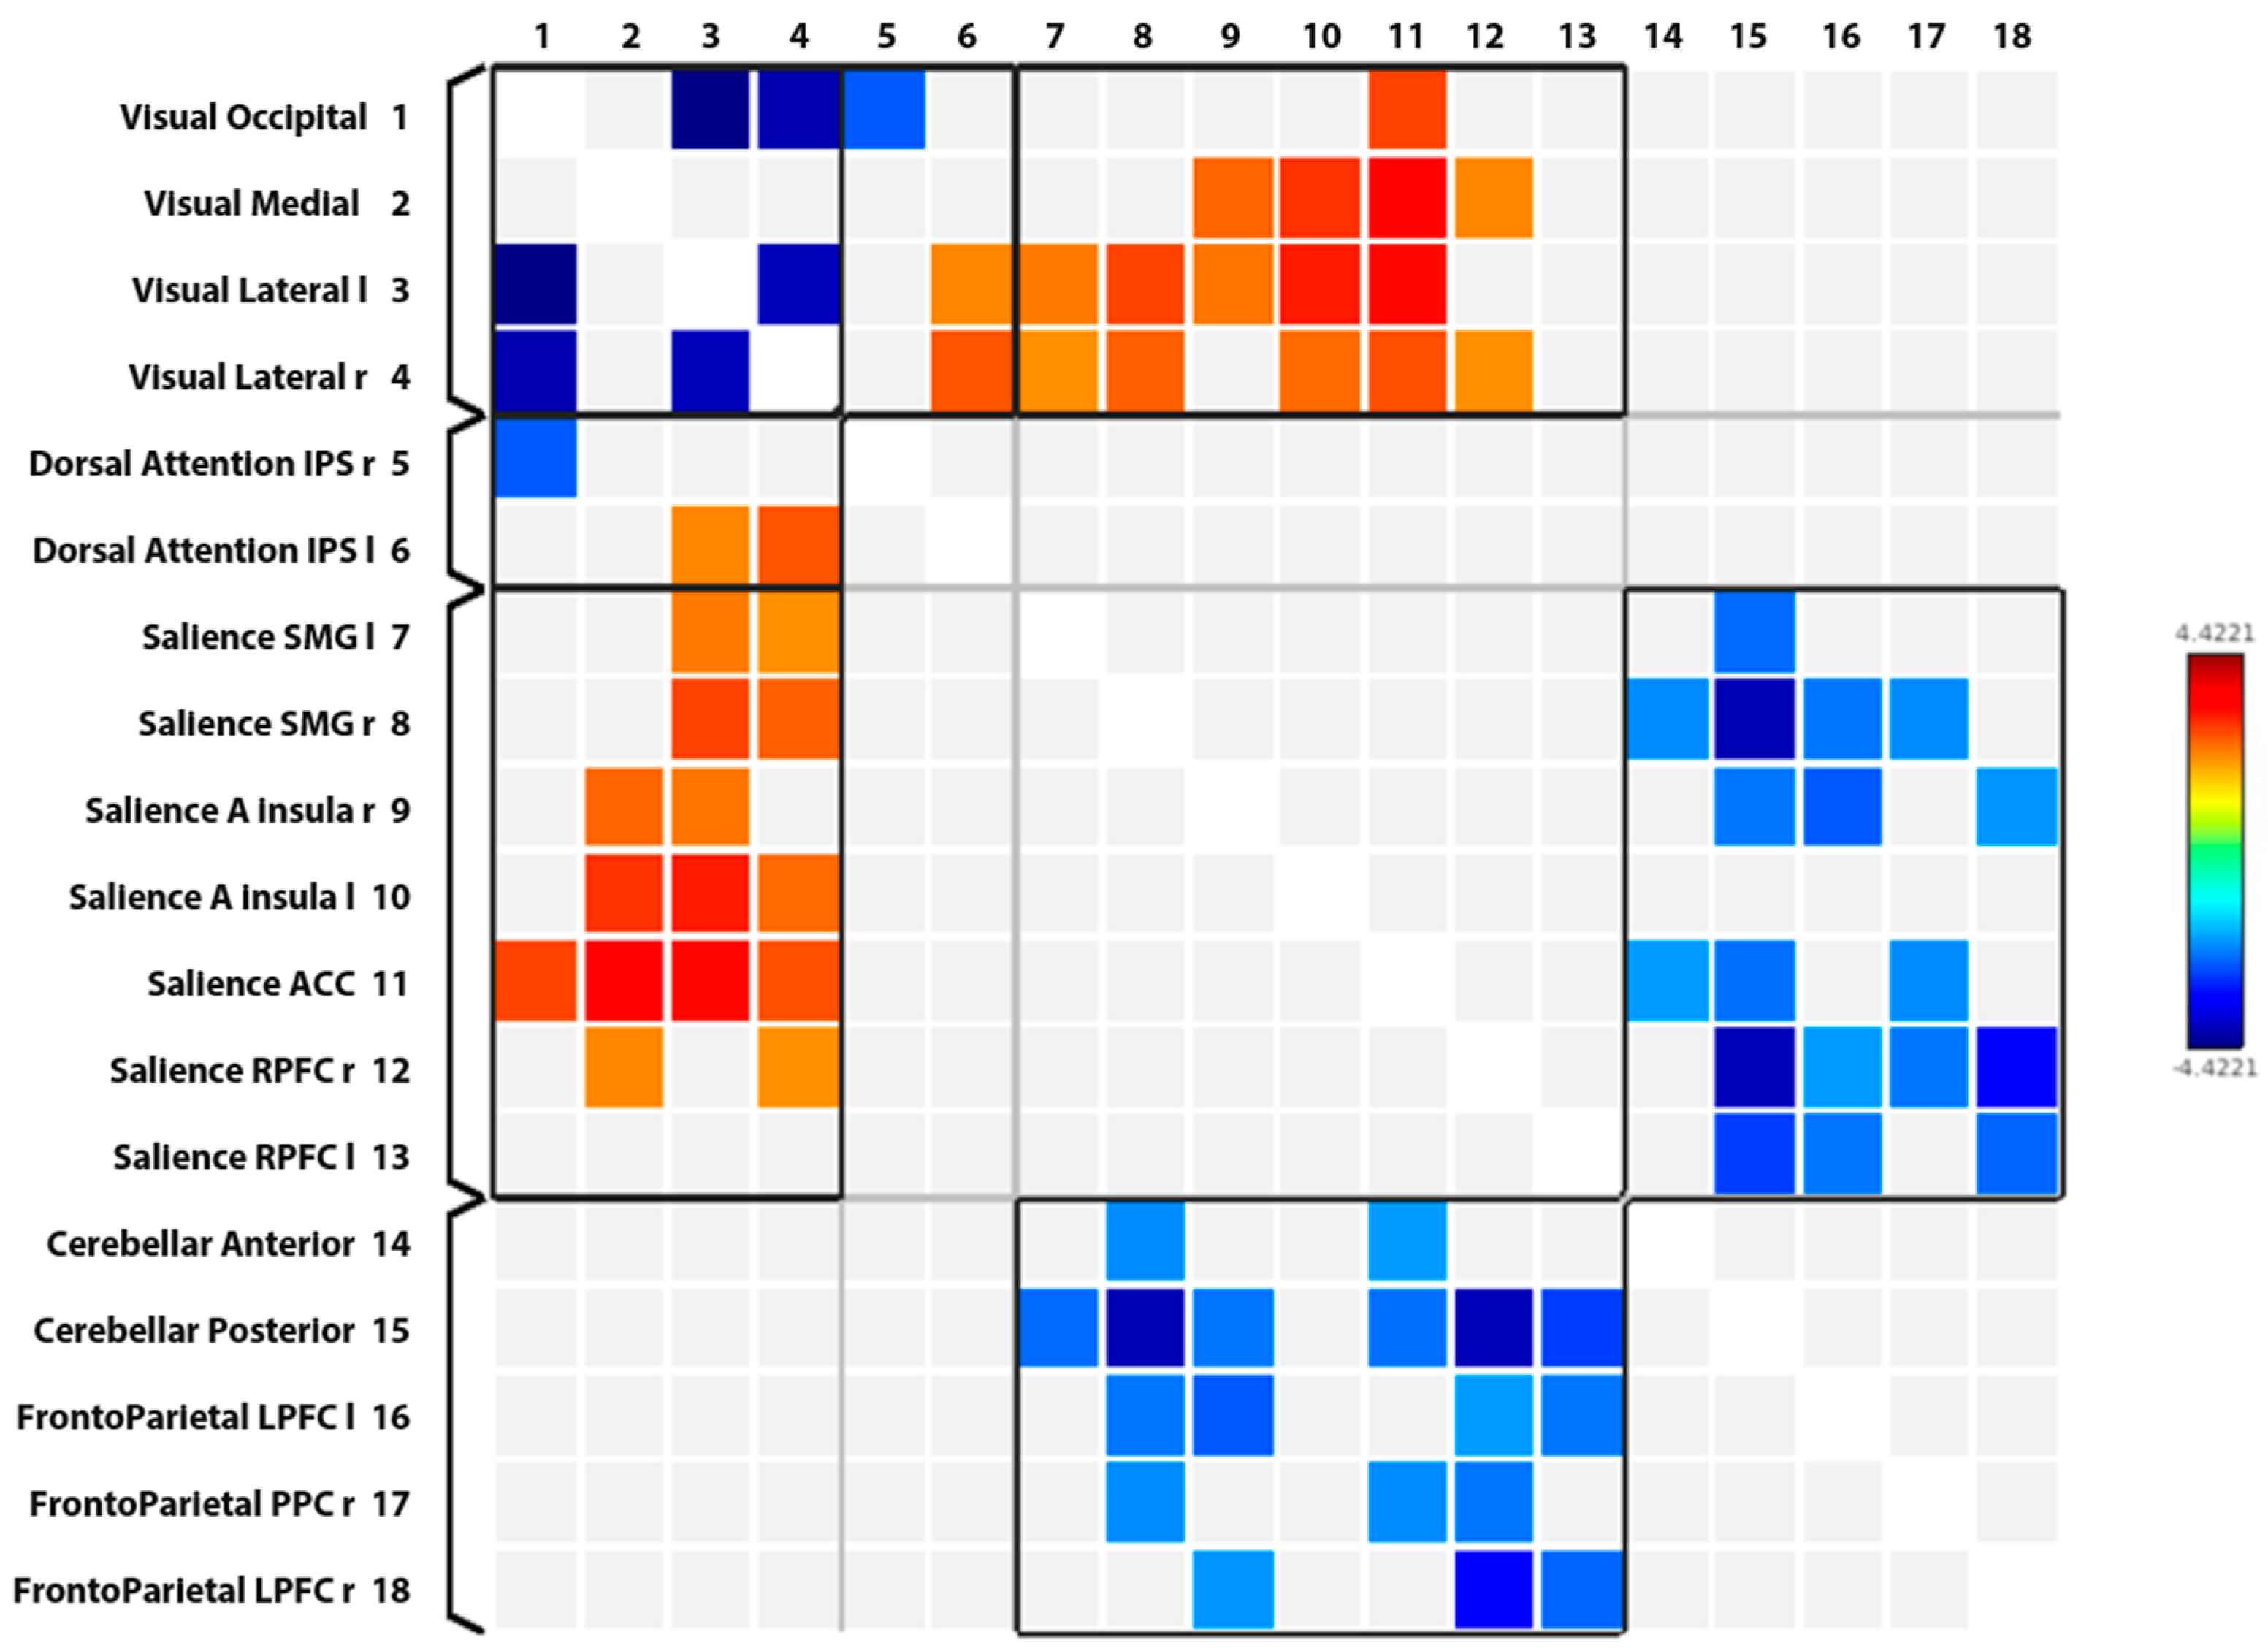
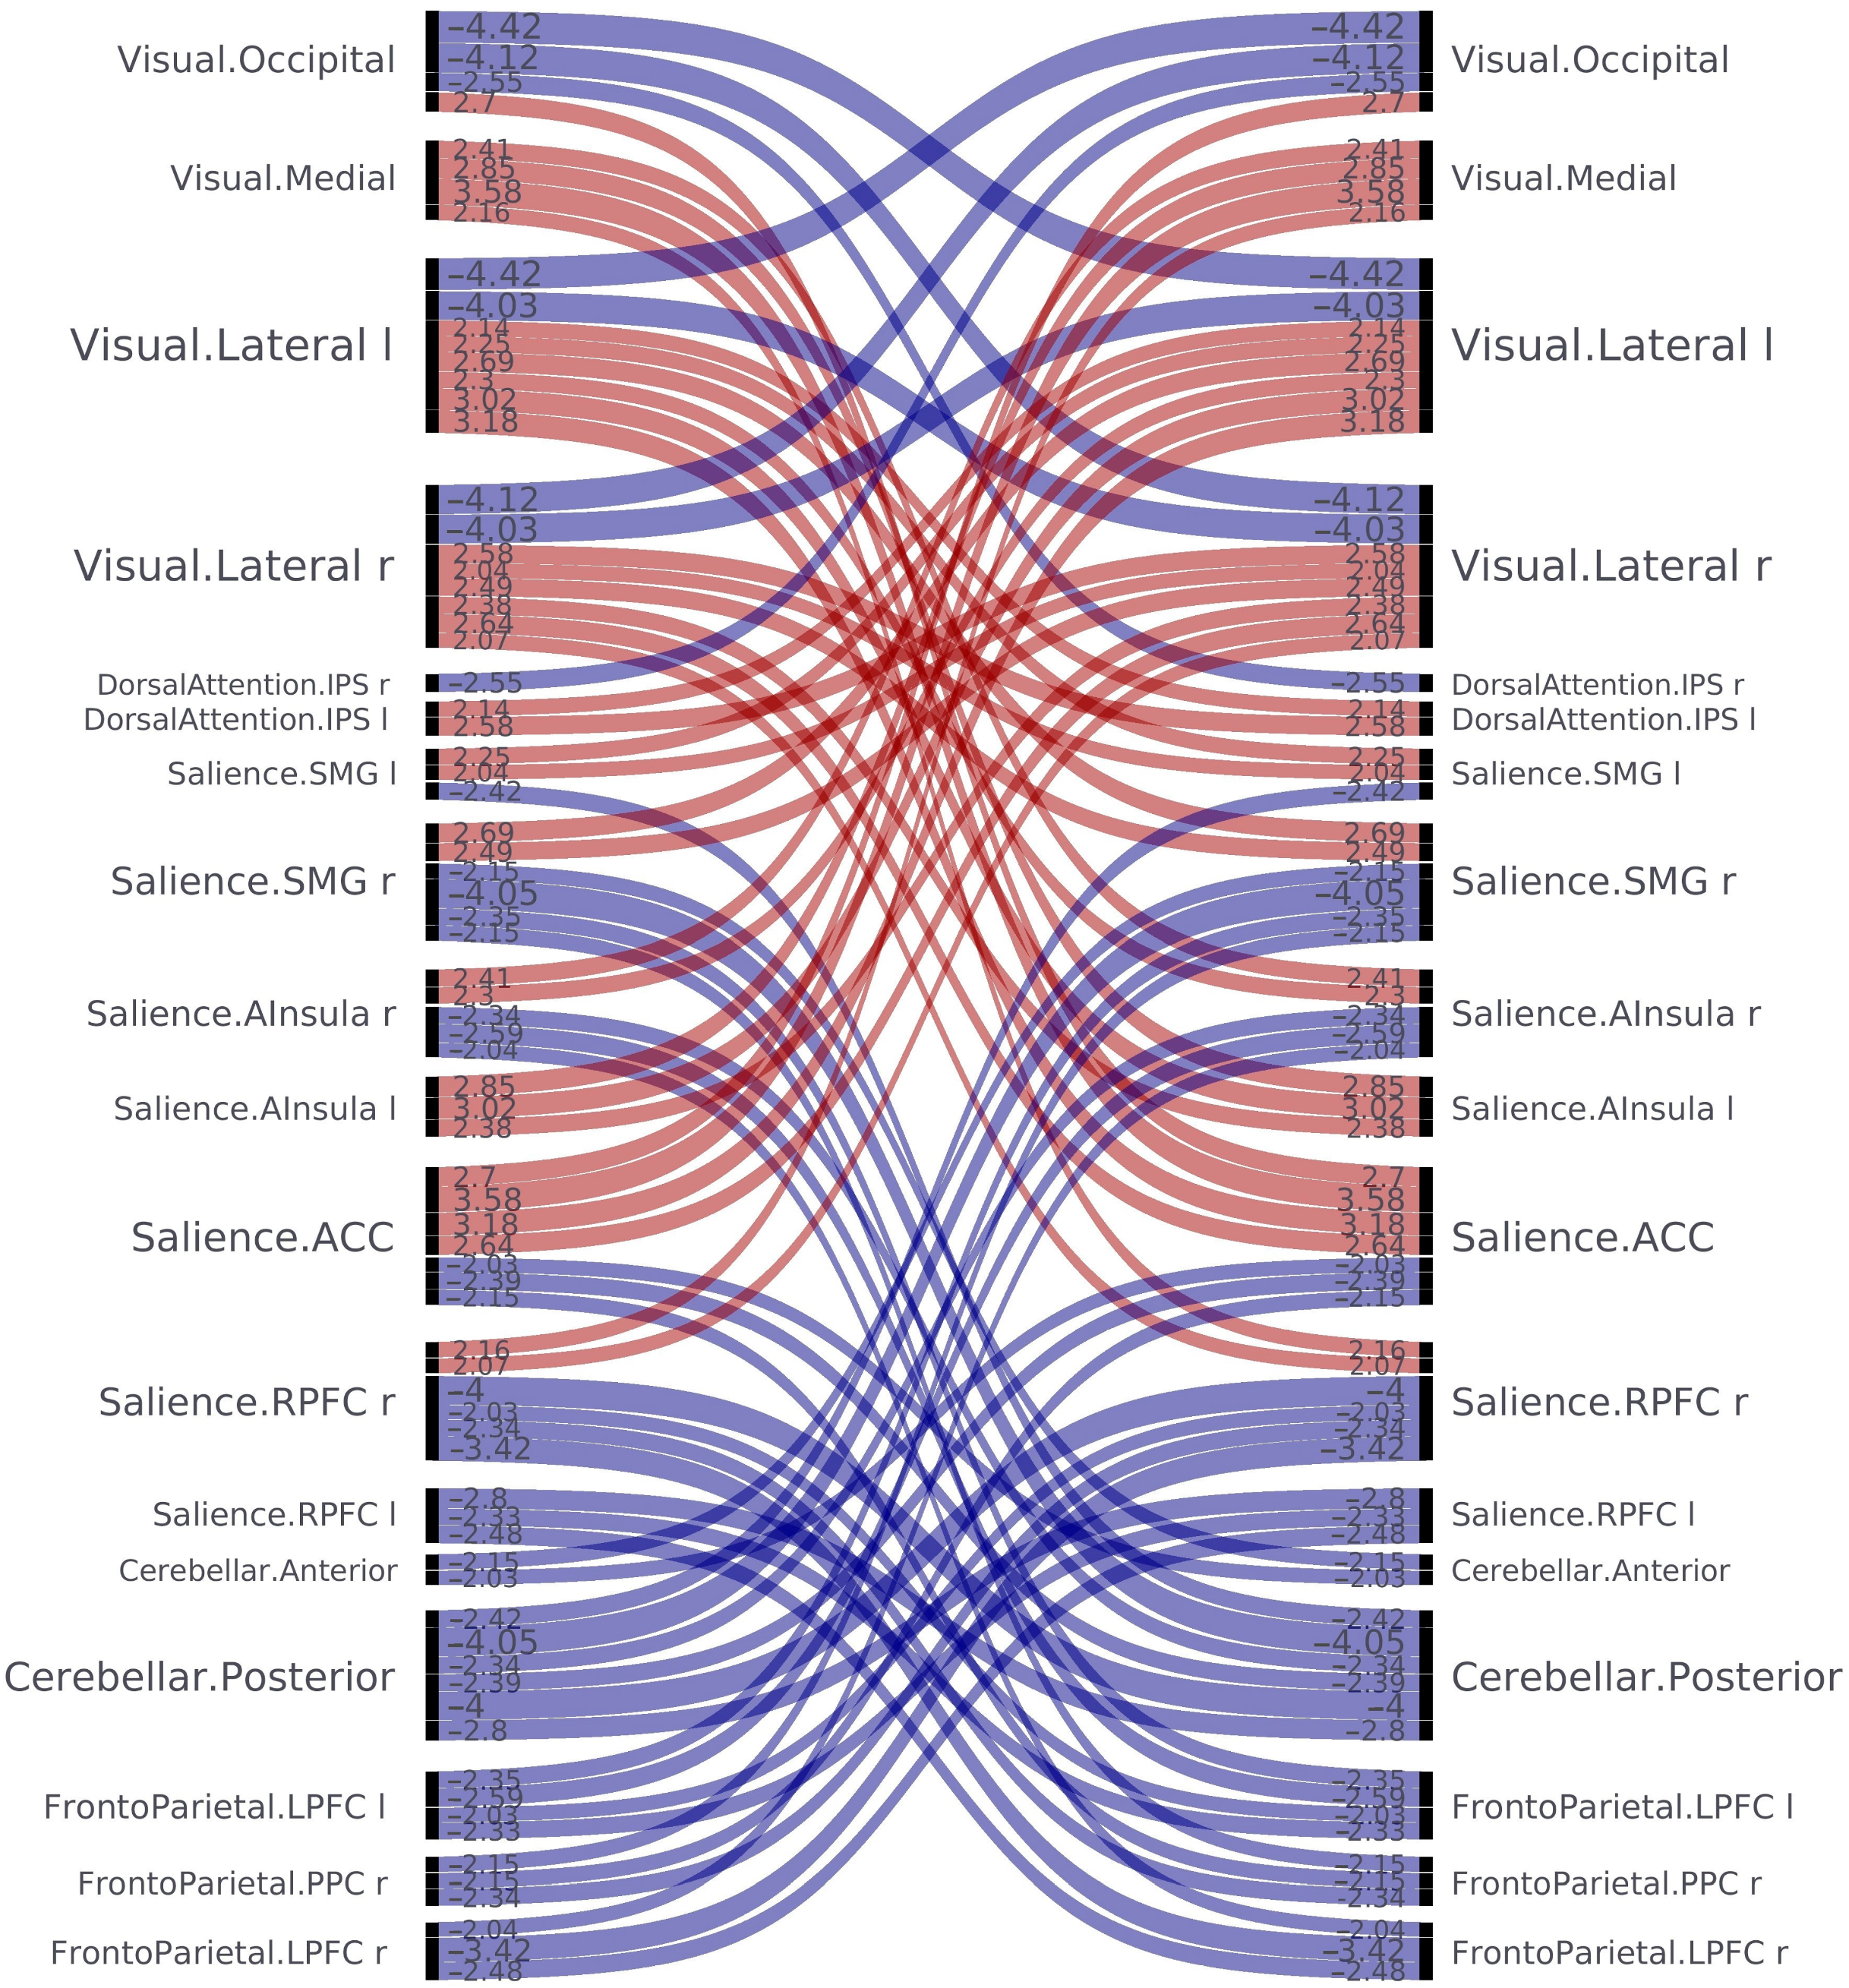
| Network/Nod 1 | Network/Nod 2 | Significant Increase (↑) Significant Decrease (↓) |
|---|---|---|
| Intra-network analysis | ||
| VN/Occipital | VN/Lateral left | ↓ |
| VN/Occipital | VN/Lateral right | ↓ |
| VN/Lateral left | VN/Lateral right | ↓ |
| Inter-network analysis | ||
| VN/Occipital | DAN/Intraparietal sulcus right | ↓ |
| VN/Occipital | SN/Anterior cingulate cortex | ↑ |
| VN/Medial | SN/Anterior Insular Cortex right | ↑ |
| VN/Medial | SN/Anterior Insular Cortex left | ↑ |
| VN/Medial | SN/Anterior cingulate cortex | ↑ |
| VN/Medial | SN/Rostral prefrontal cortex right | ↑ |
| VN/Lateral left | SN/Supramarginal gyrus left | ↑ |
| VN/Lateral left | SN/Supramarginal gyrus right | ↑ |
| VN/Lateral left | SN/Anterior Insular Cortex right | ↑ |
| VN/Lateral left | SN/Anterior Insular Cortex left | ↑ |
| VN/Lateral left | SN/Anterior cingulate cortex | ↑ |
| VN/Lateral left | DAN/Intraparietal sulcus left | ↑ |
| VN/Lateral right | SN/Supramarginal gyrus left | ↑ |
| VN/Lateral right | SN/Supramarginal gyrus right | ↑ |
| VN/Lateral right | SN/Anterior Insular Cortex left | ↑ |
| VN/Lateral right | SN/Anterior cingulate cortex | ↑ |
| VN/Lateral right | SN/Rostral prefrontal cortex right | ↑ |
| VN/Lateral right | DAN/Intraparietal sulcus left | ↑ |
| SN/Supramarginal gyrus left | CN/Posterior | ↓ |
| SN/Supramarginal gyrus right | CN/Anterior | ↓ |
| SN/Supramarginal gyrus right | CN/Posterior | ↓ |
| SN/Supramarginal gyrus right | FPN/LPFC left | ↓ |
| SN/Supramarginal gyrus right | FPN/PPC right | ↓ |
| SN/Anterior Insular Cortex right | CN/Posterior | ↓ |
| SN/Anterior Insular Cortex right | FPN/LPFC left | ↓ |
| SN/Anterior Insular Cortex right | FPN/LPFC right | ↓ |
| SN/Anterior cingulate cortex | CN/Anterior | ↓ |
| SN/Anterior cingulate cortex | CN/Posterior | ↓ |
| SN/Anterior cingulate cortex | FPN/PPC right | ↓ |
| SN/Rostral prefrontal cortex right | CN/Posterior | ↓ |
| SN/Rostral prefrontal cortex right | FPN/LPFC left | ↓ |
| SN/Rostral prefrontal cortex right | FPN/PPC right | ↓ |
| SN/Rostral prefrontal cortex right | FPN/LPFC right | ↓ |
| SN/Rostral prefrontal cortex left | CN/Posterior | ↓ |
| SN/Rostral prefrontal cortex left | FPN/LPFC left | ↓ |
| SN/Rostral prefrontal cortex left | FPN/LPFC right | ↓ |
Disclaimer/Publisher’s Note: The statements, opinions and data contained in all publications are solely those of the individual author(s) and contributor(s) and not of MDPI and/or the editor(s). MDPI and/or the editor(s) disclaim responsibility for any injury to people or property resulting from any ideas, methods, instructions or products referred to in the content. |
© 2024 by the authors. Licensee MDPI, Basel, Switzerland. This article is an open access article distributed under the terms and conditions of the Creative Commons Attribution (CC BY) license (https://creativecommons.org/licenses/by/4.0/).
Share and Cite
Machaj, W.; Podgórski, P.; Maciaszek, J.; Piotrowski, P.; Szcześniak, D.; Korbecki, A.; Rymaszewska, J.; Zimny, A. Evaluation of Intra- and Inter-Network Connectivity within Major Brain Networks in Drug-Resistant Depression Using rs-fMRI. J. Clin. Med. 2024, 13, 5507. https://doi.org/10.3390/jcm13185507
Machaj W, Podgórski P, Maciaszek J, Piotrowski P, Szcześniak D, Korbecki A, Rymaszewska J, Zimny A. Evaluation of Intra- and Inter-Network Connectivity within Major Brain Networks in Drug-Resistant Depression Using rs-fMRI. Journal of Clinical Medicine. 2024; 13(18):5507. https://doi.org/10.3390/jcm13185507
Chicago/Turabian StyleMachaj, Weronika, Przemysław Podgórski, Julian Maciaszek, Patryk Piotrowski, Dorota Szcześniak, Adrian Korbecki, Joanna Rymaszewska, and Anna Zimny. 2024. "Evaluation of Intra- and Inter-Network Connectivity within Major Brain Networks in Drug-Resistant Depression Using rs-fMRI" Journal of Clinical Medicine 13, no. 18: 5507. https://doi.org/10.3390/jcm13185507
APA StyleMachaj, W., Podgórski, P., Maciaszek, J., Piotrowski, P., Szcześniak, D., Korbecki, A., Rymaszewska, J., & Zimny, A. (2024). Evaluation of Intra- and Inter-Network Connectivity within Major Brain Networks in Drug-Resistant Depression Using rs-fMRI. Journal of Clinical Medicine, 13(18), 5507. https://doi.org/10.3390/jcm13185507