

Overweight, Obesity, and Age Are the Main Determinants of Cardiovascular Risk Aggregation in the Current Mexican Population: The FRIMEX III Study
 , and
, and
Abstract
1. Introduction
2. Materials and Methods
Statistics
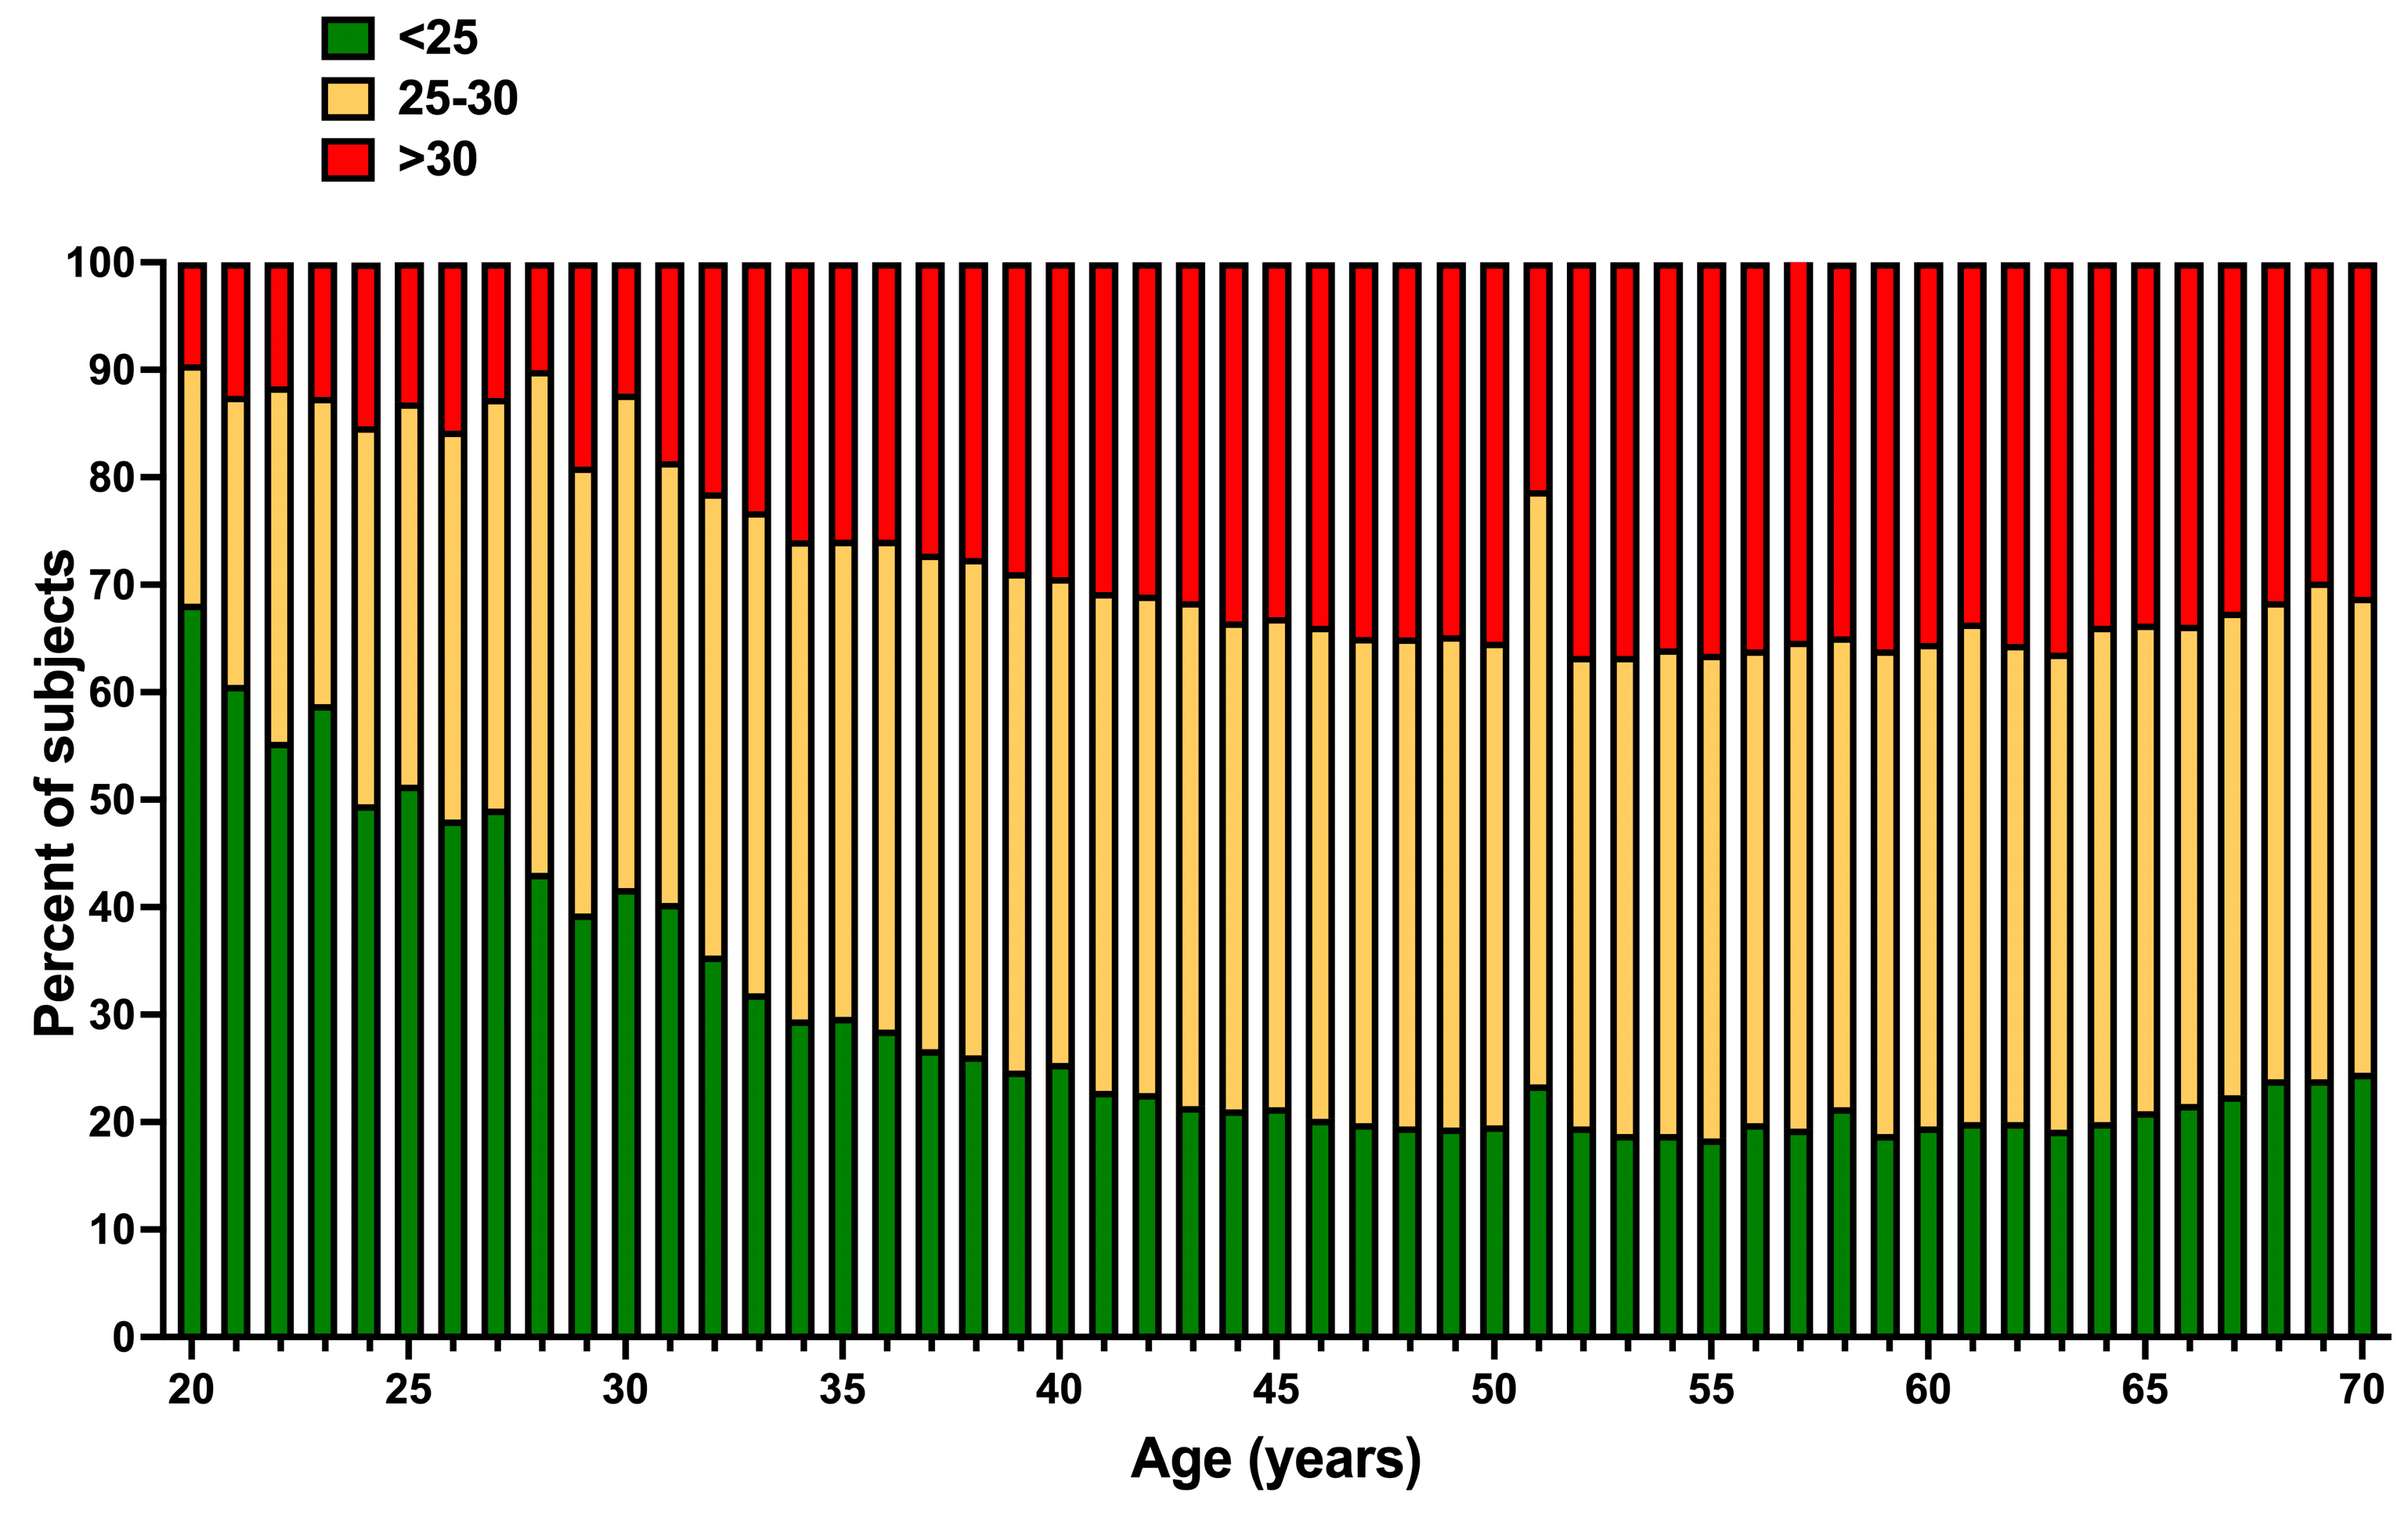
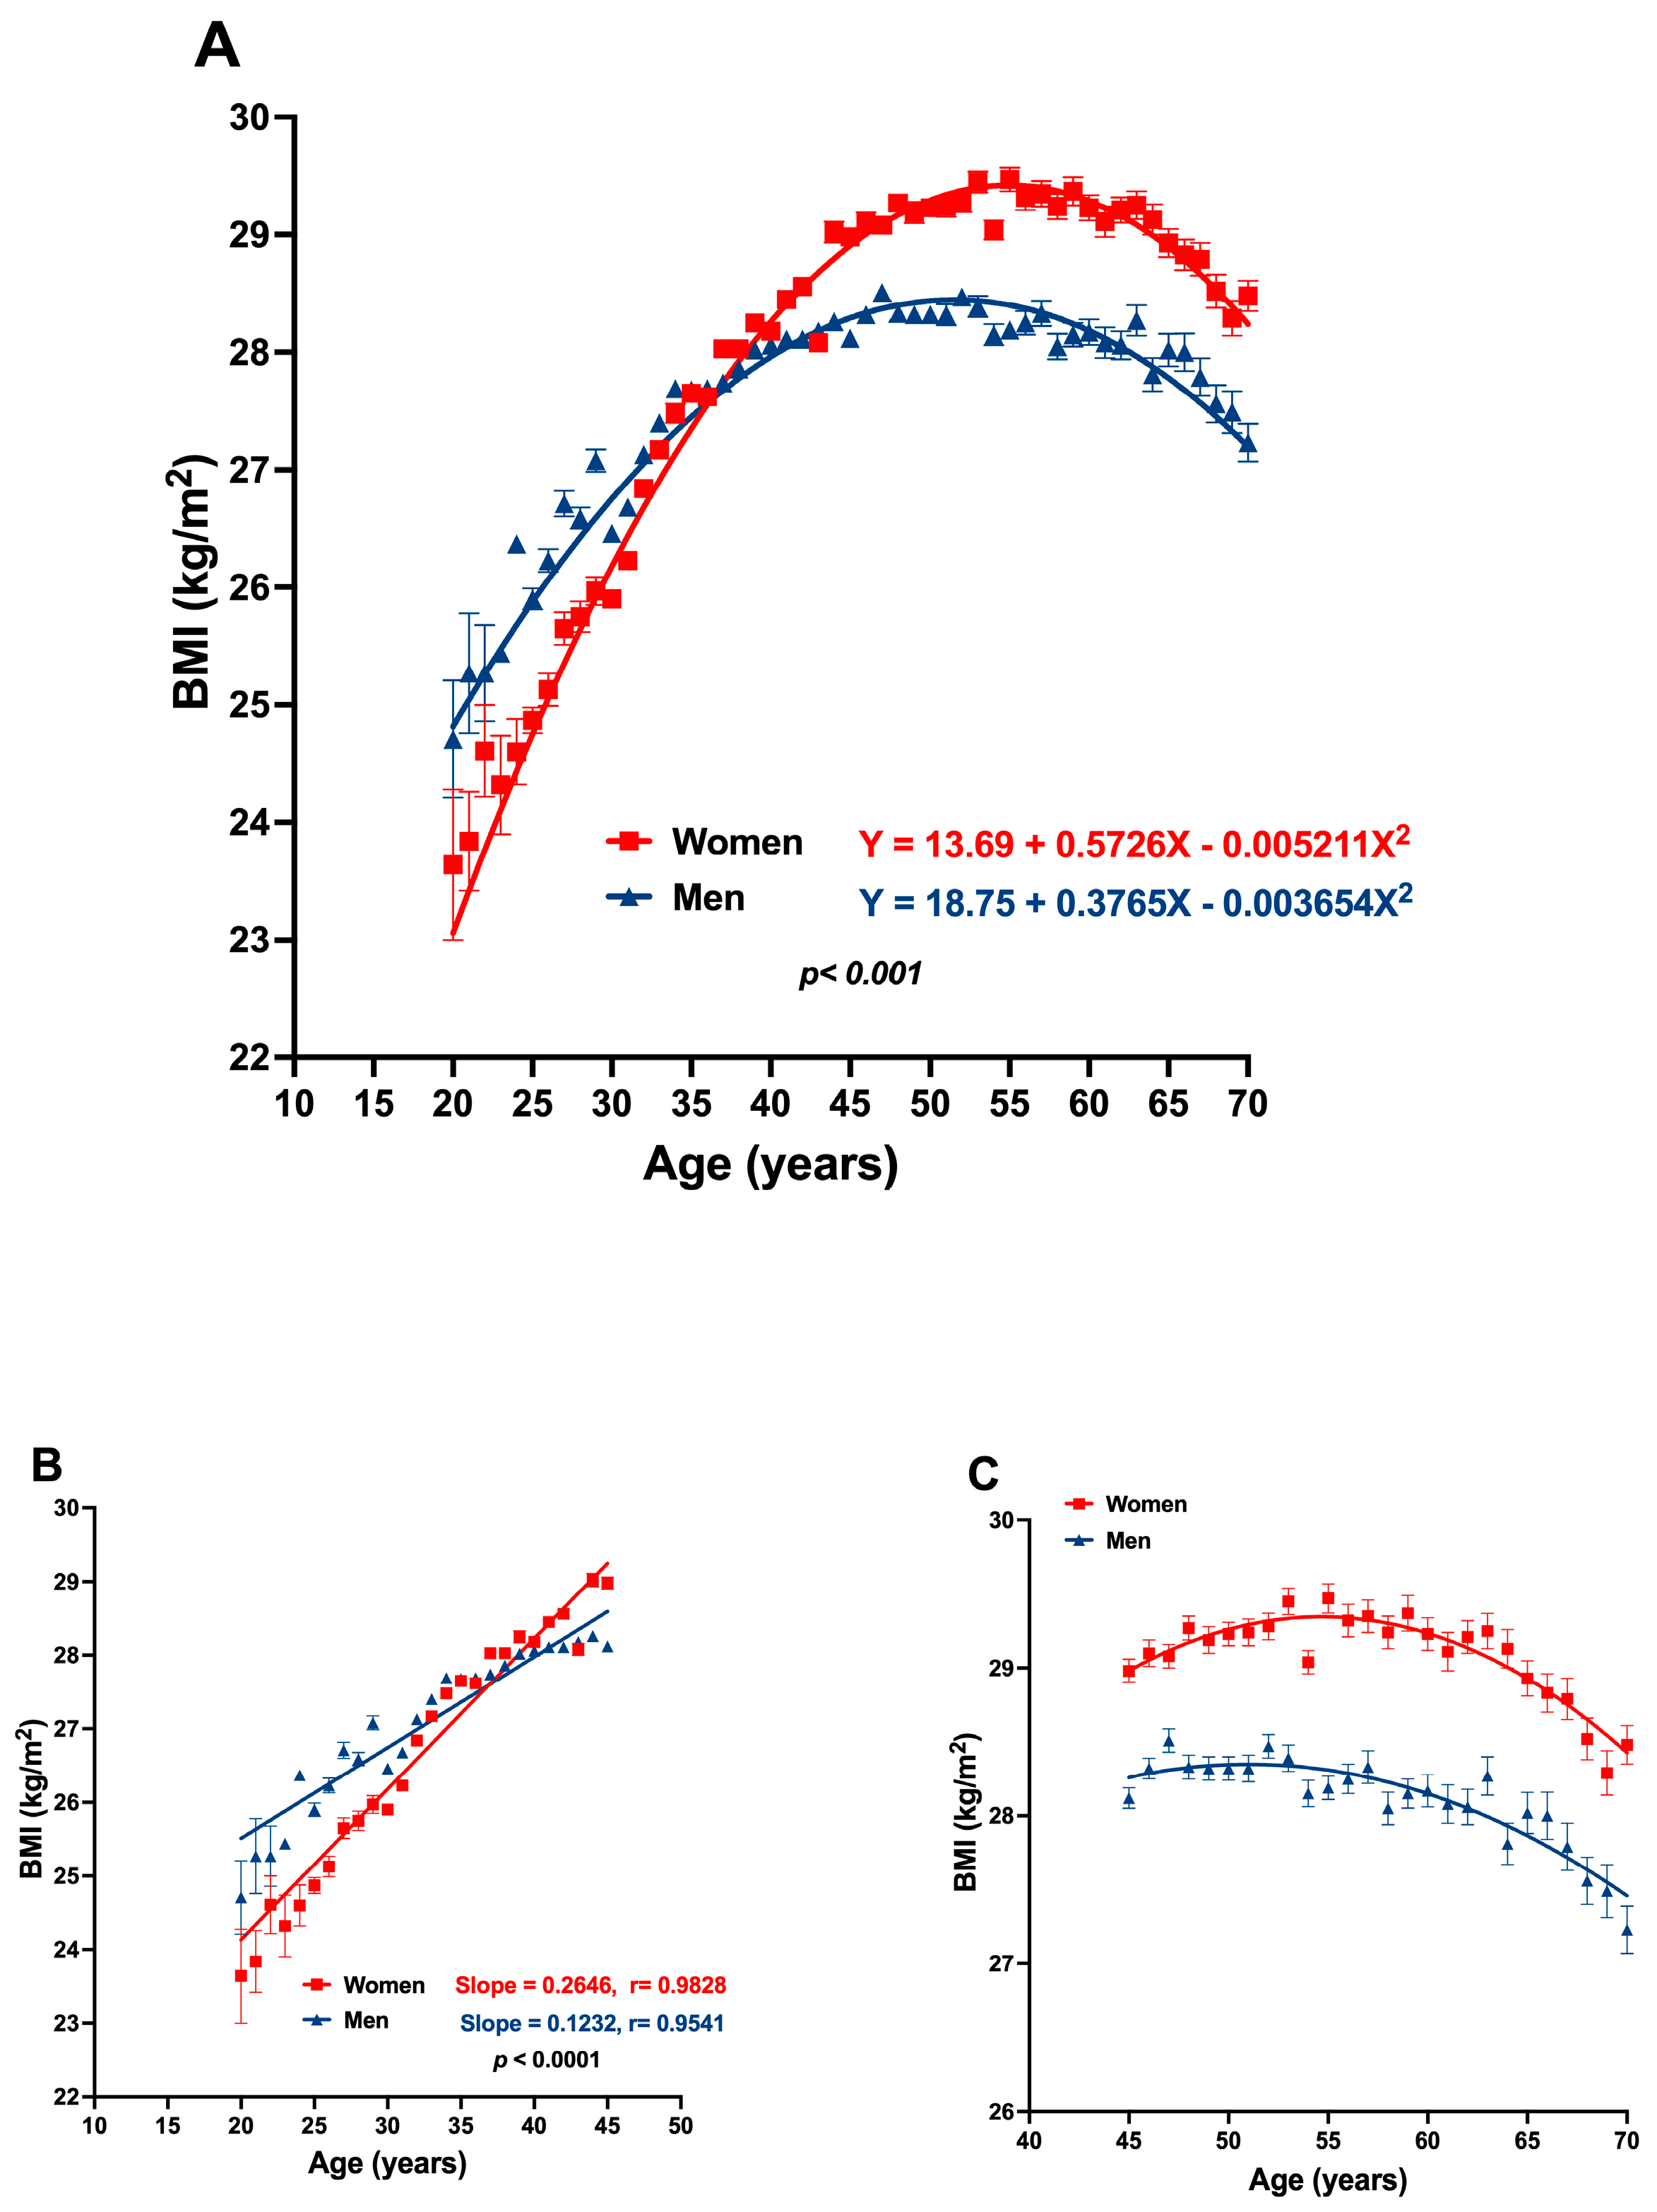
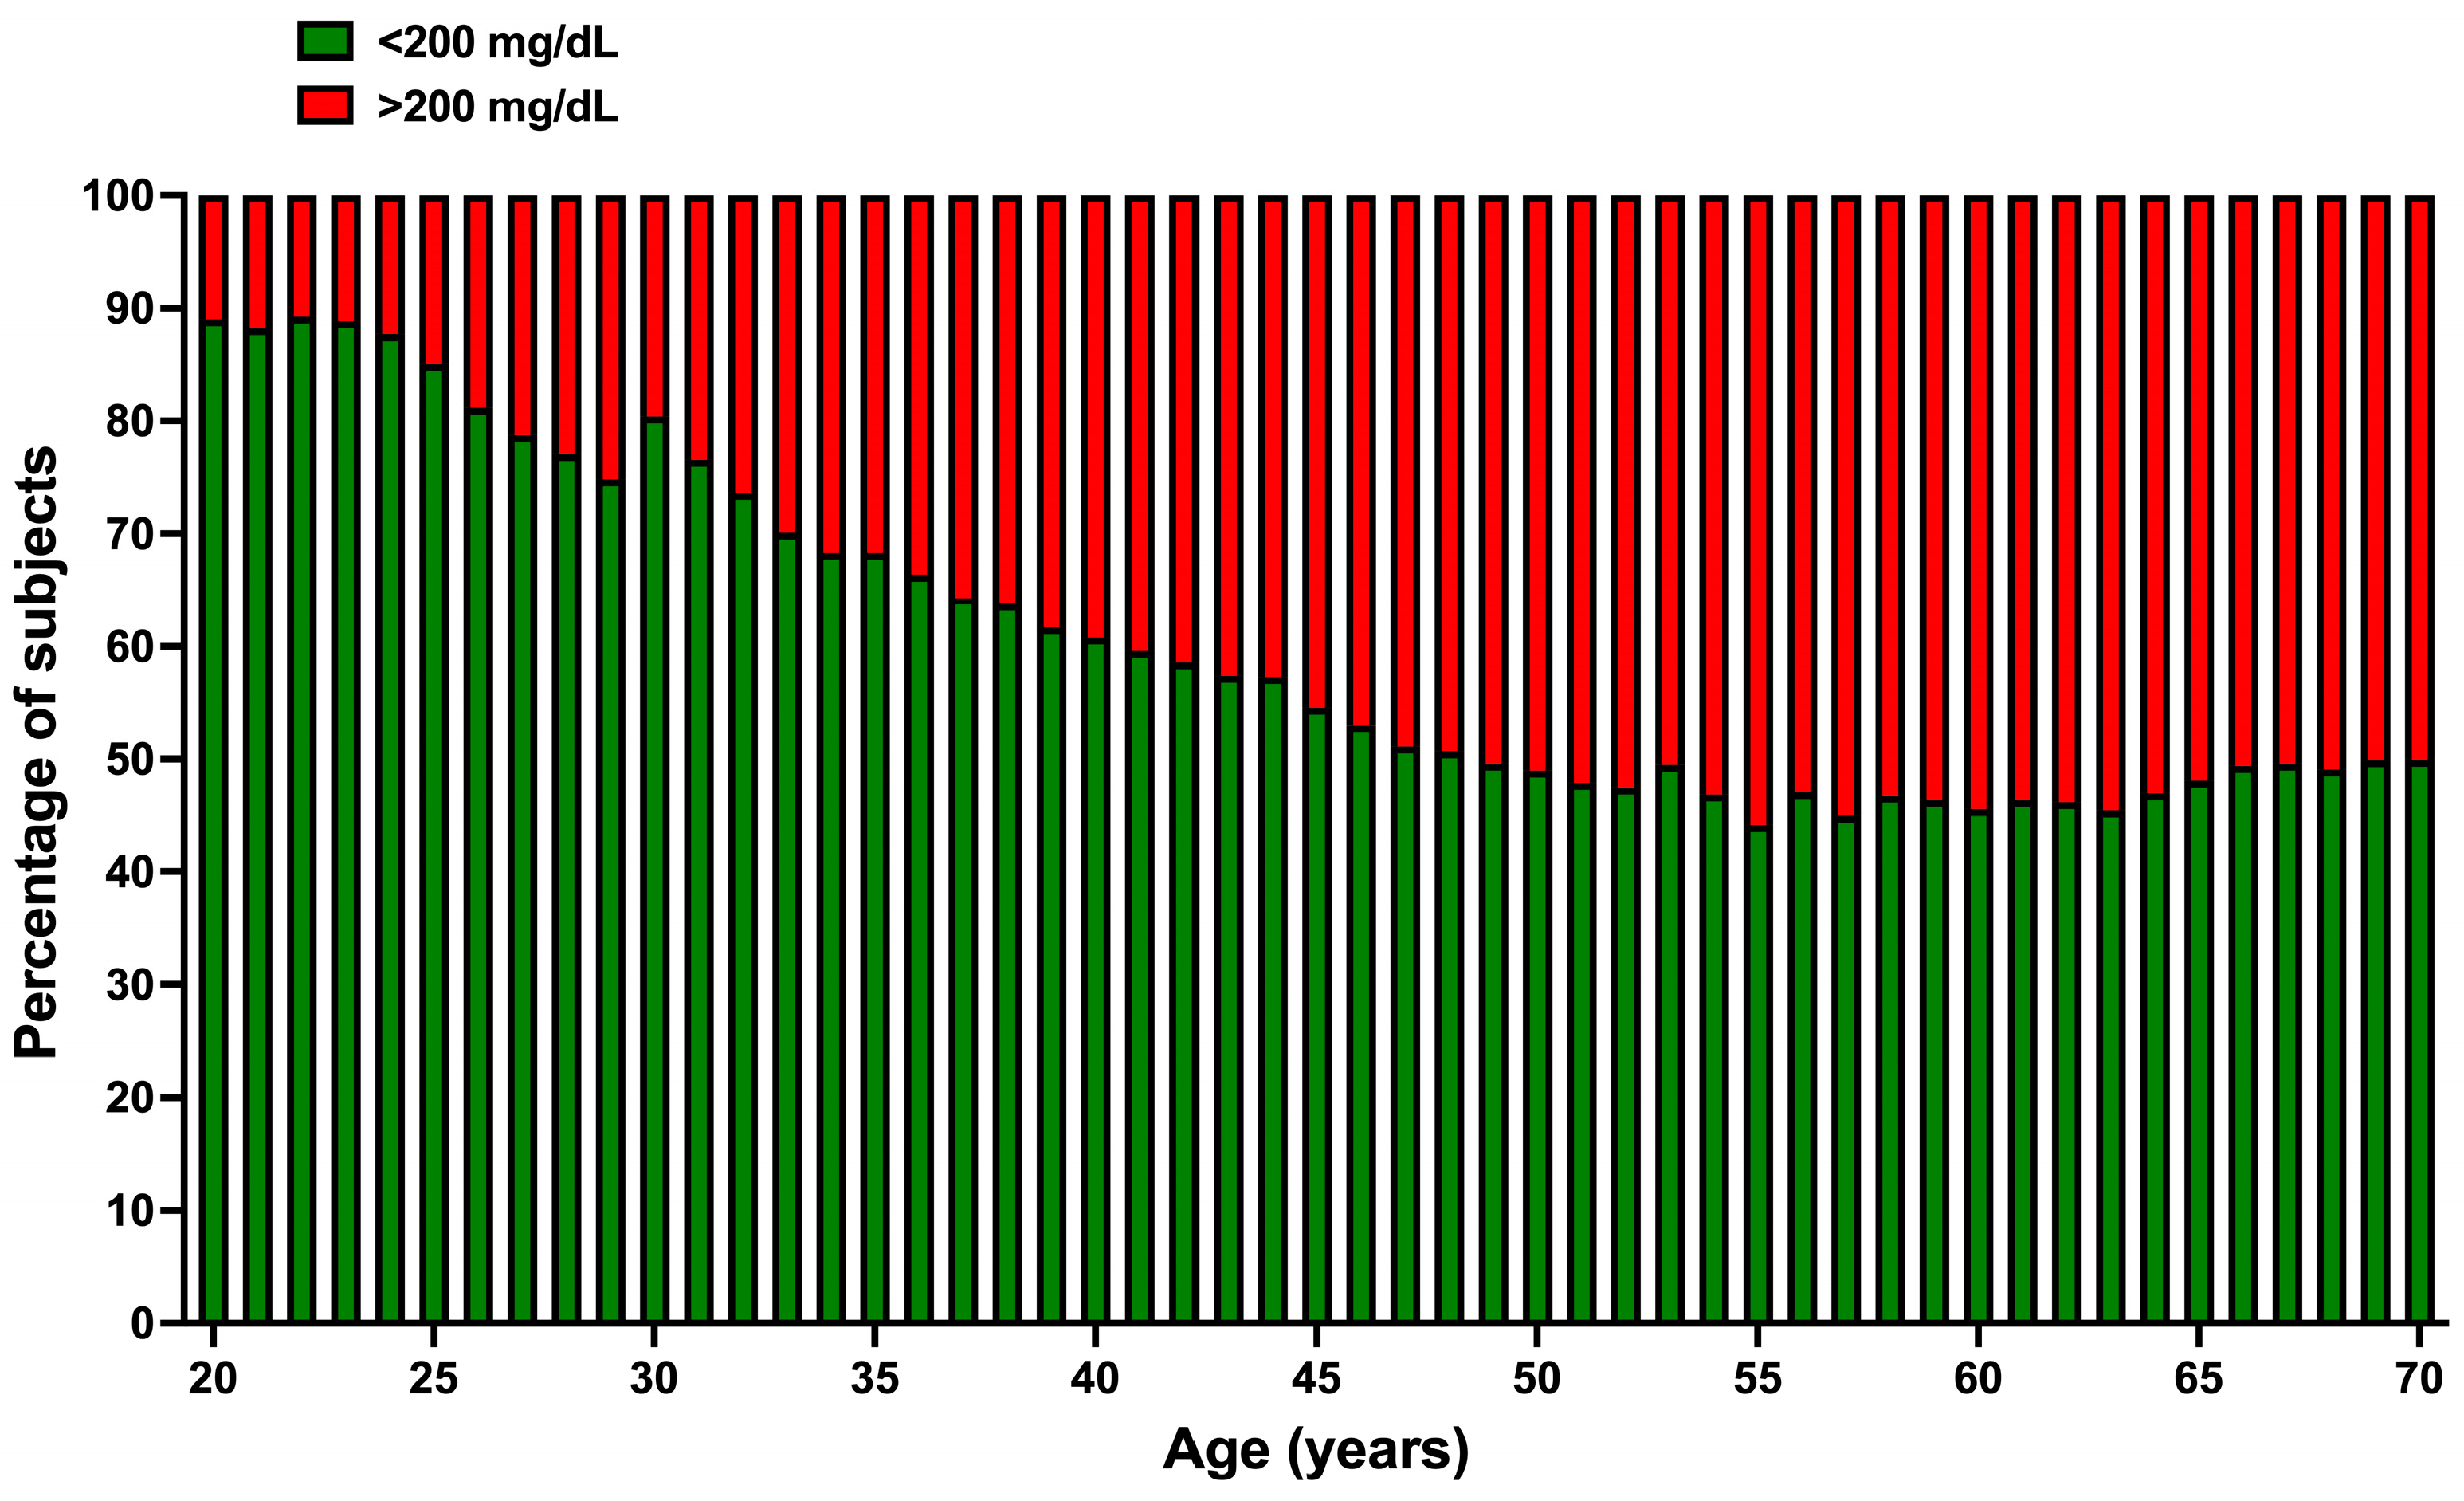
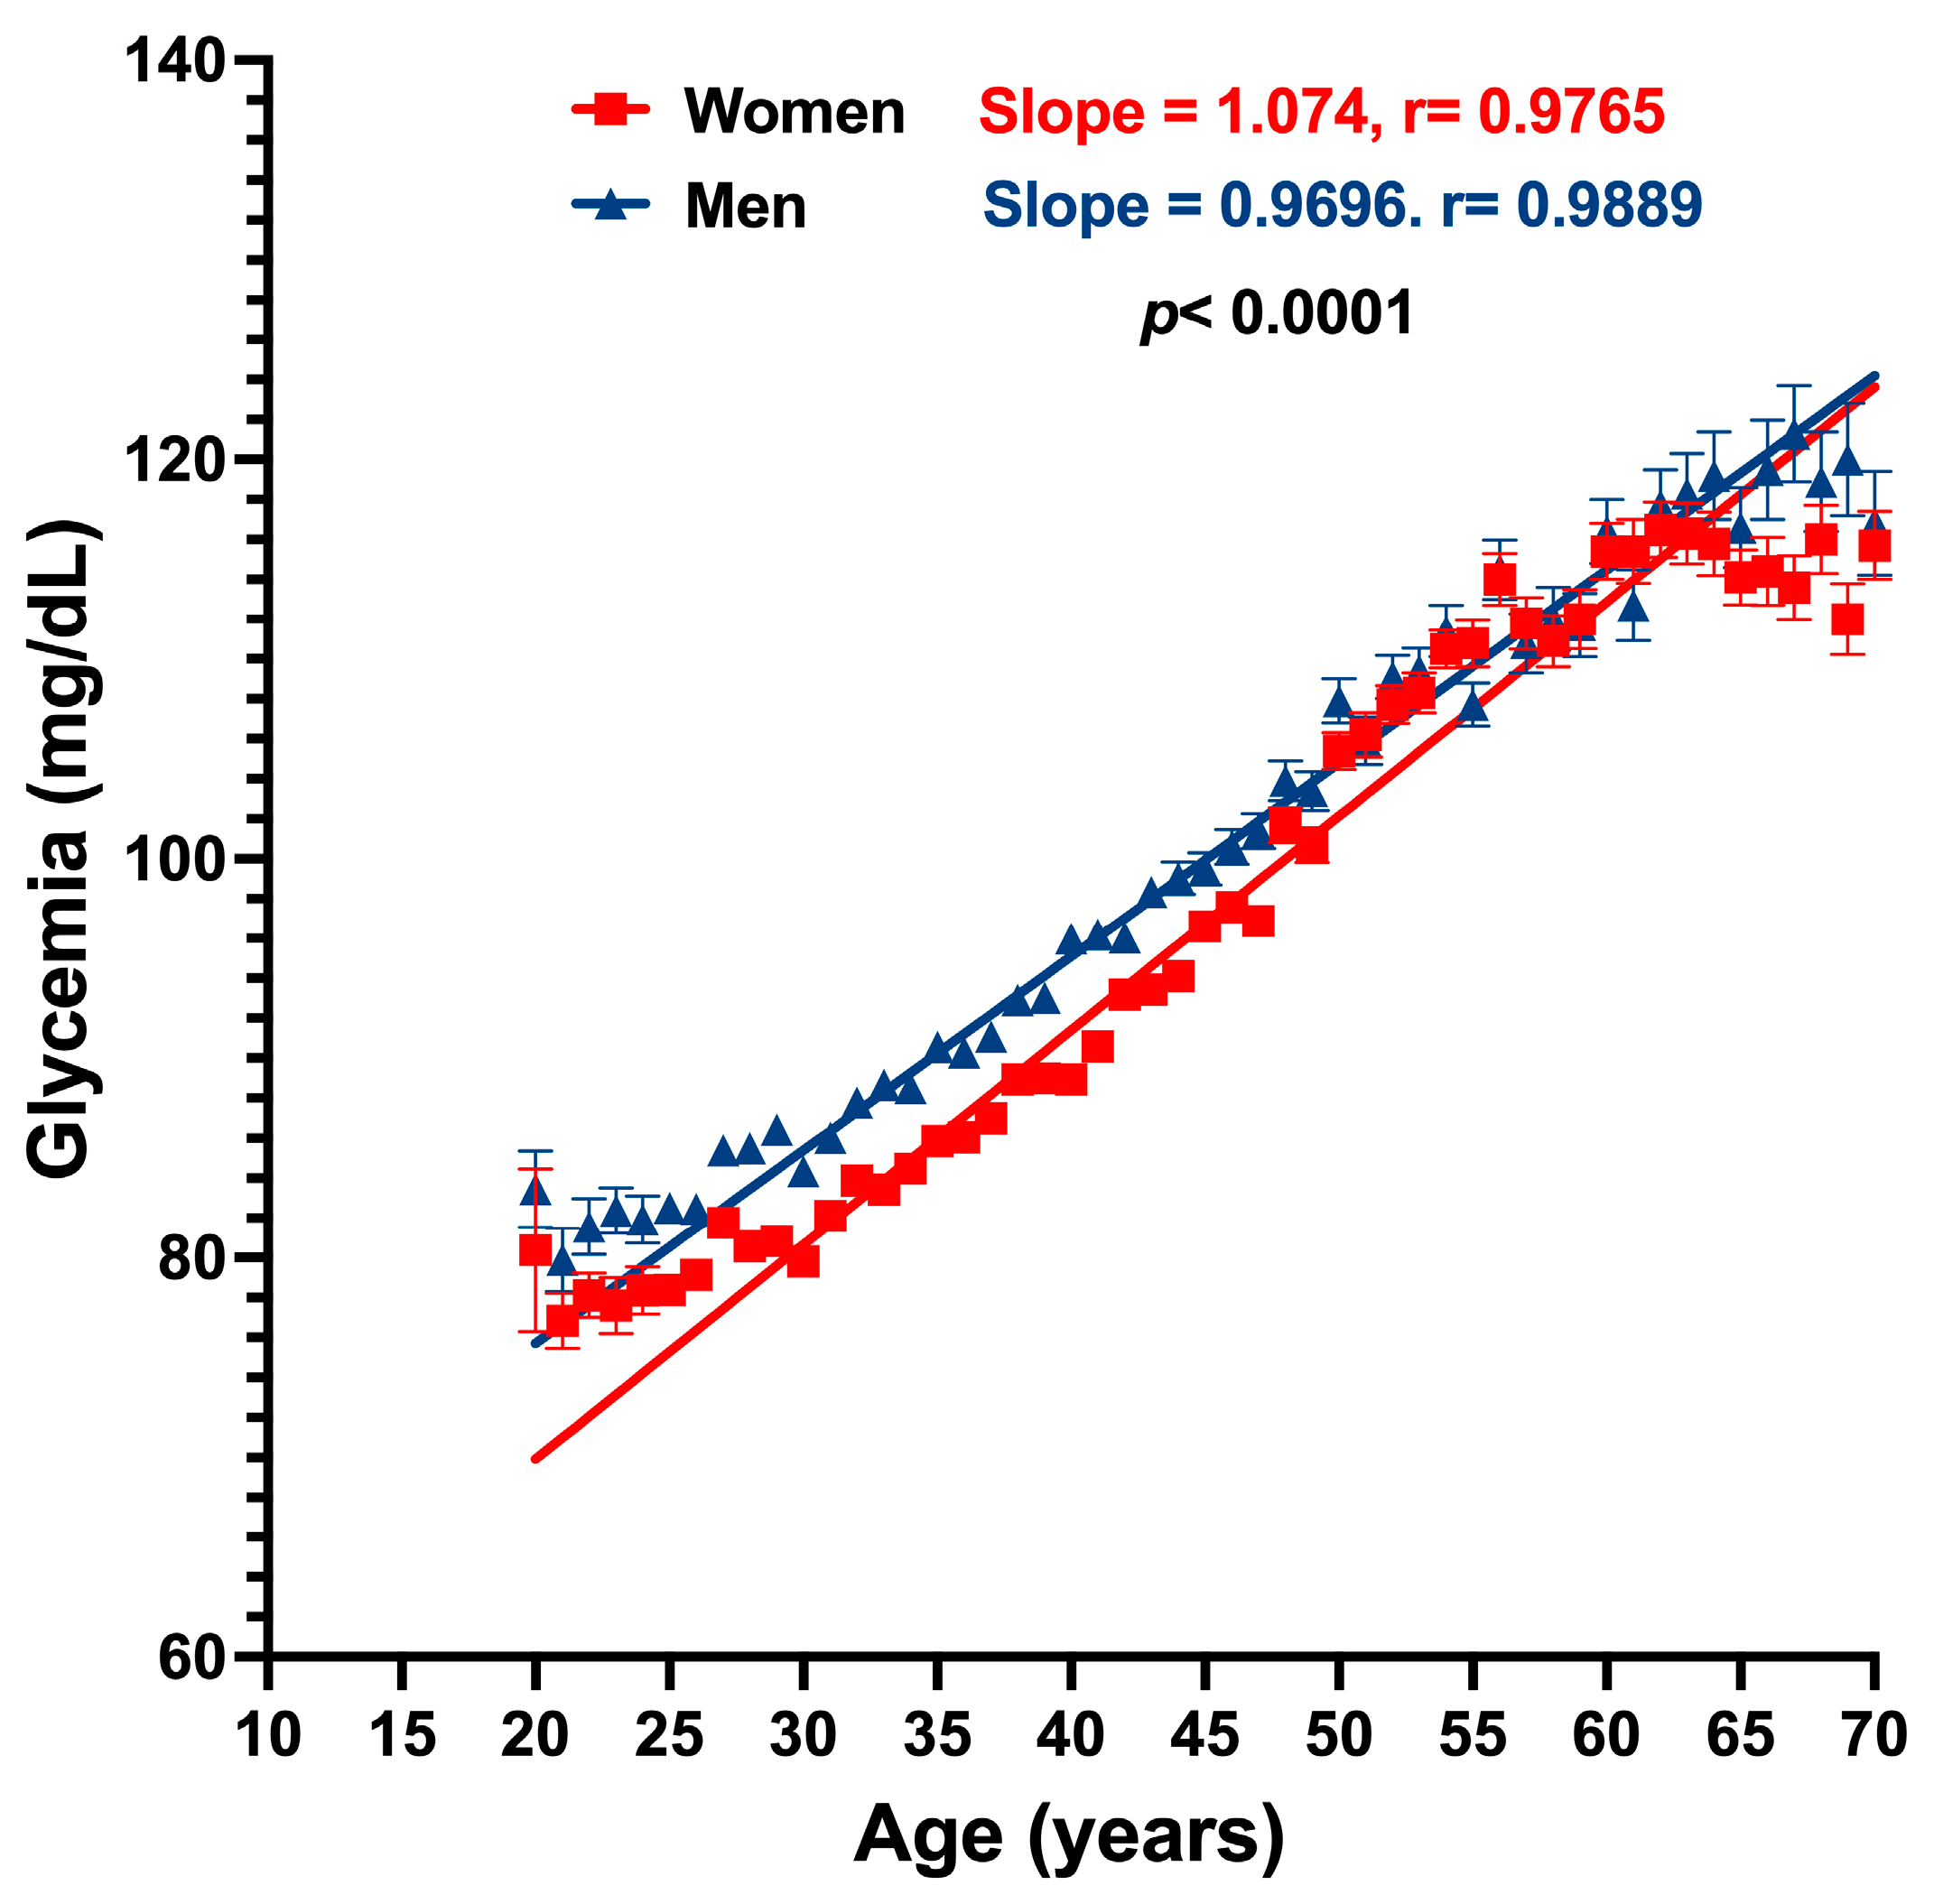
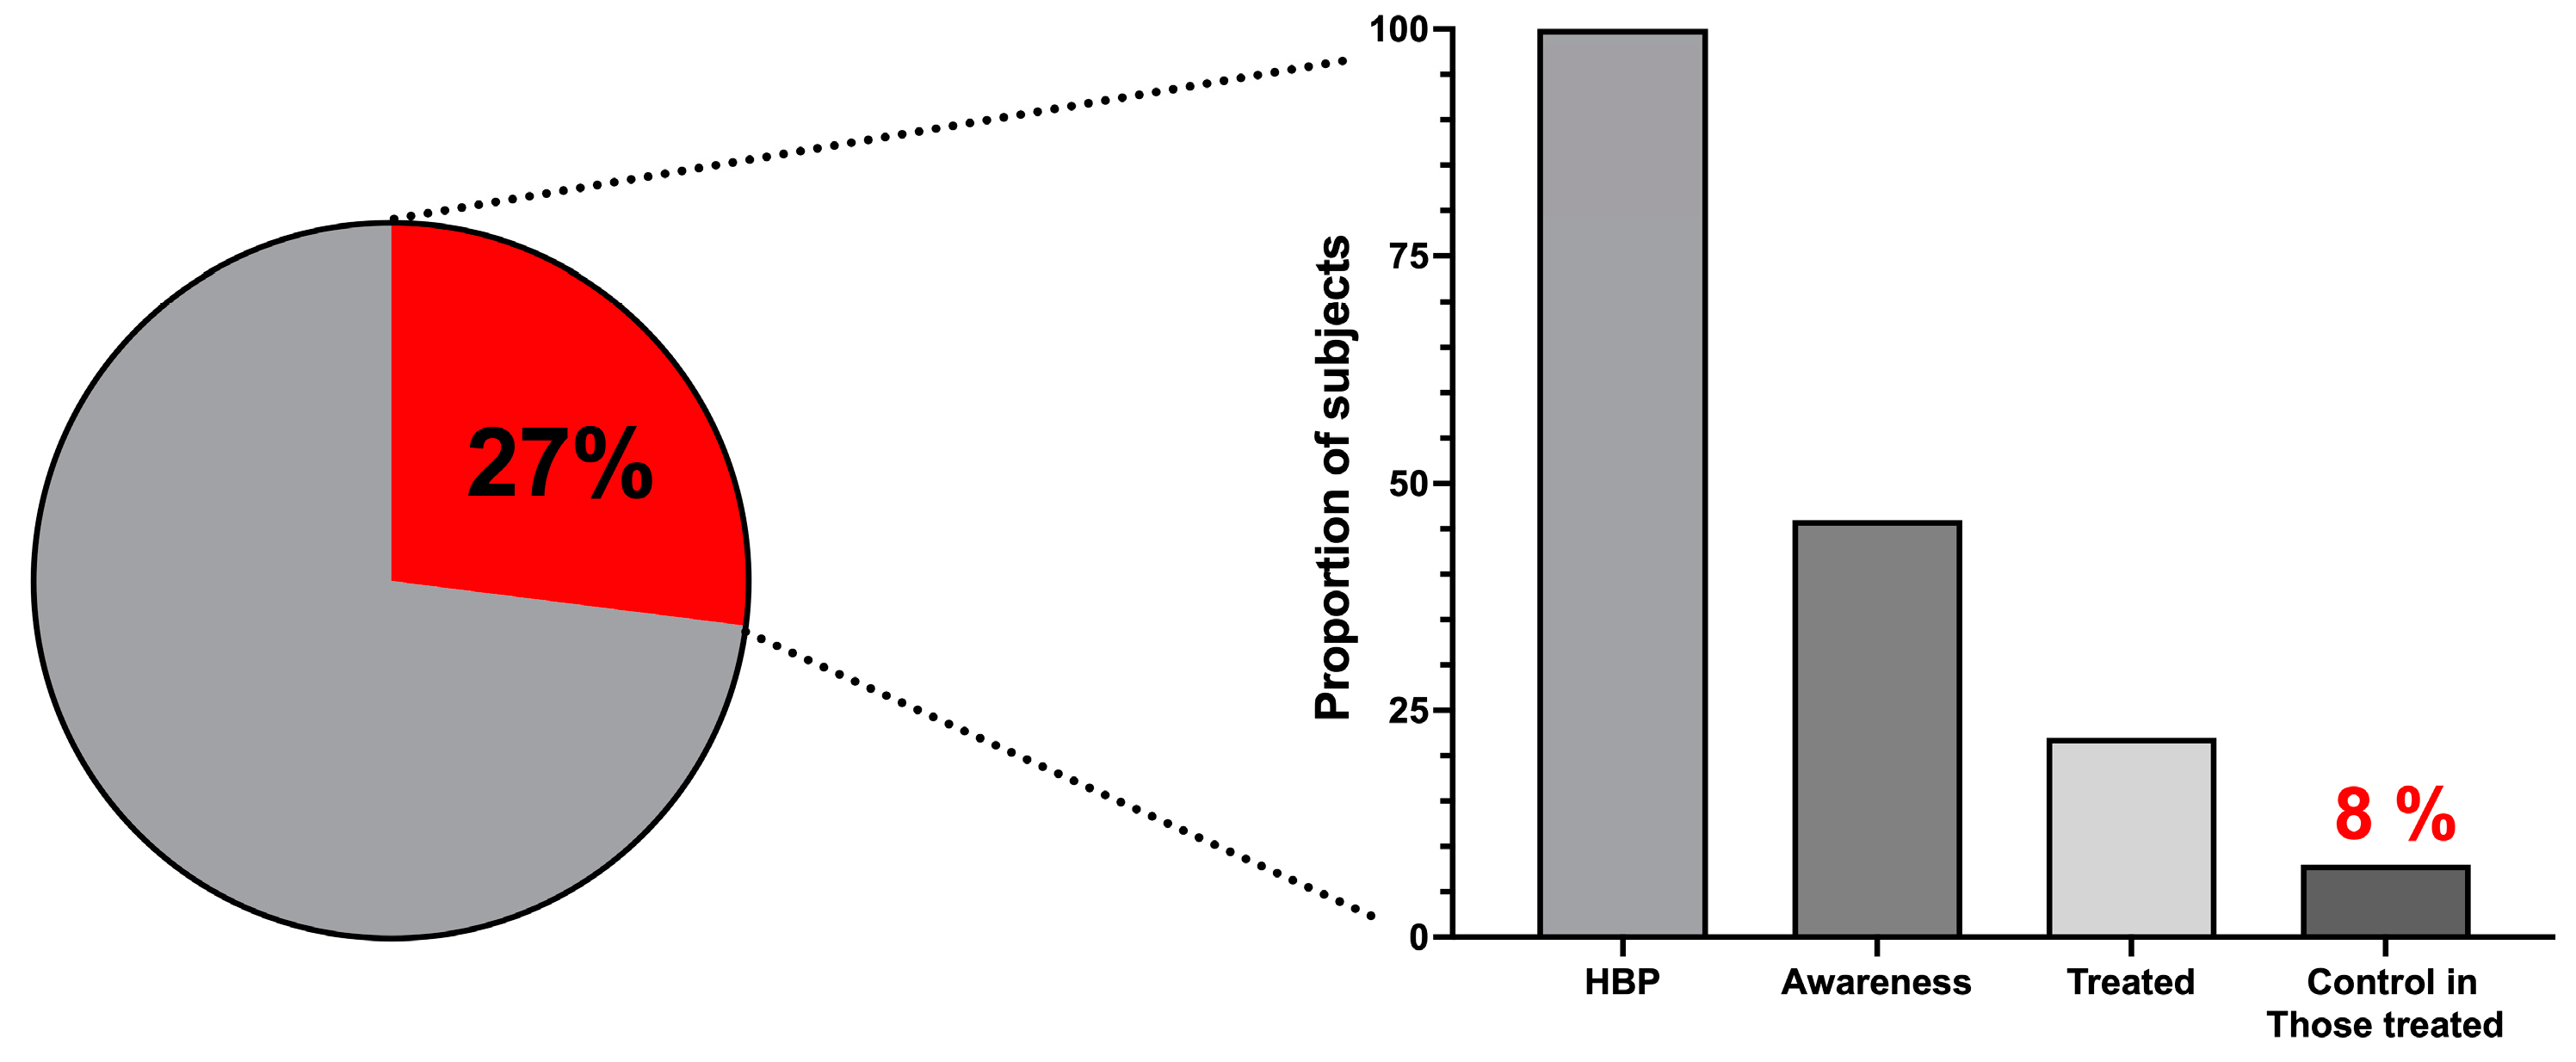
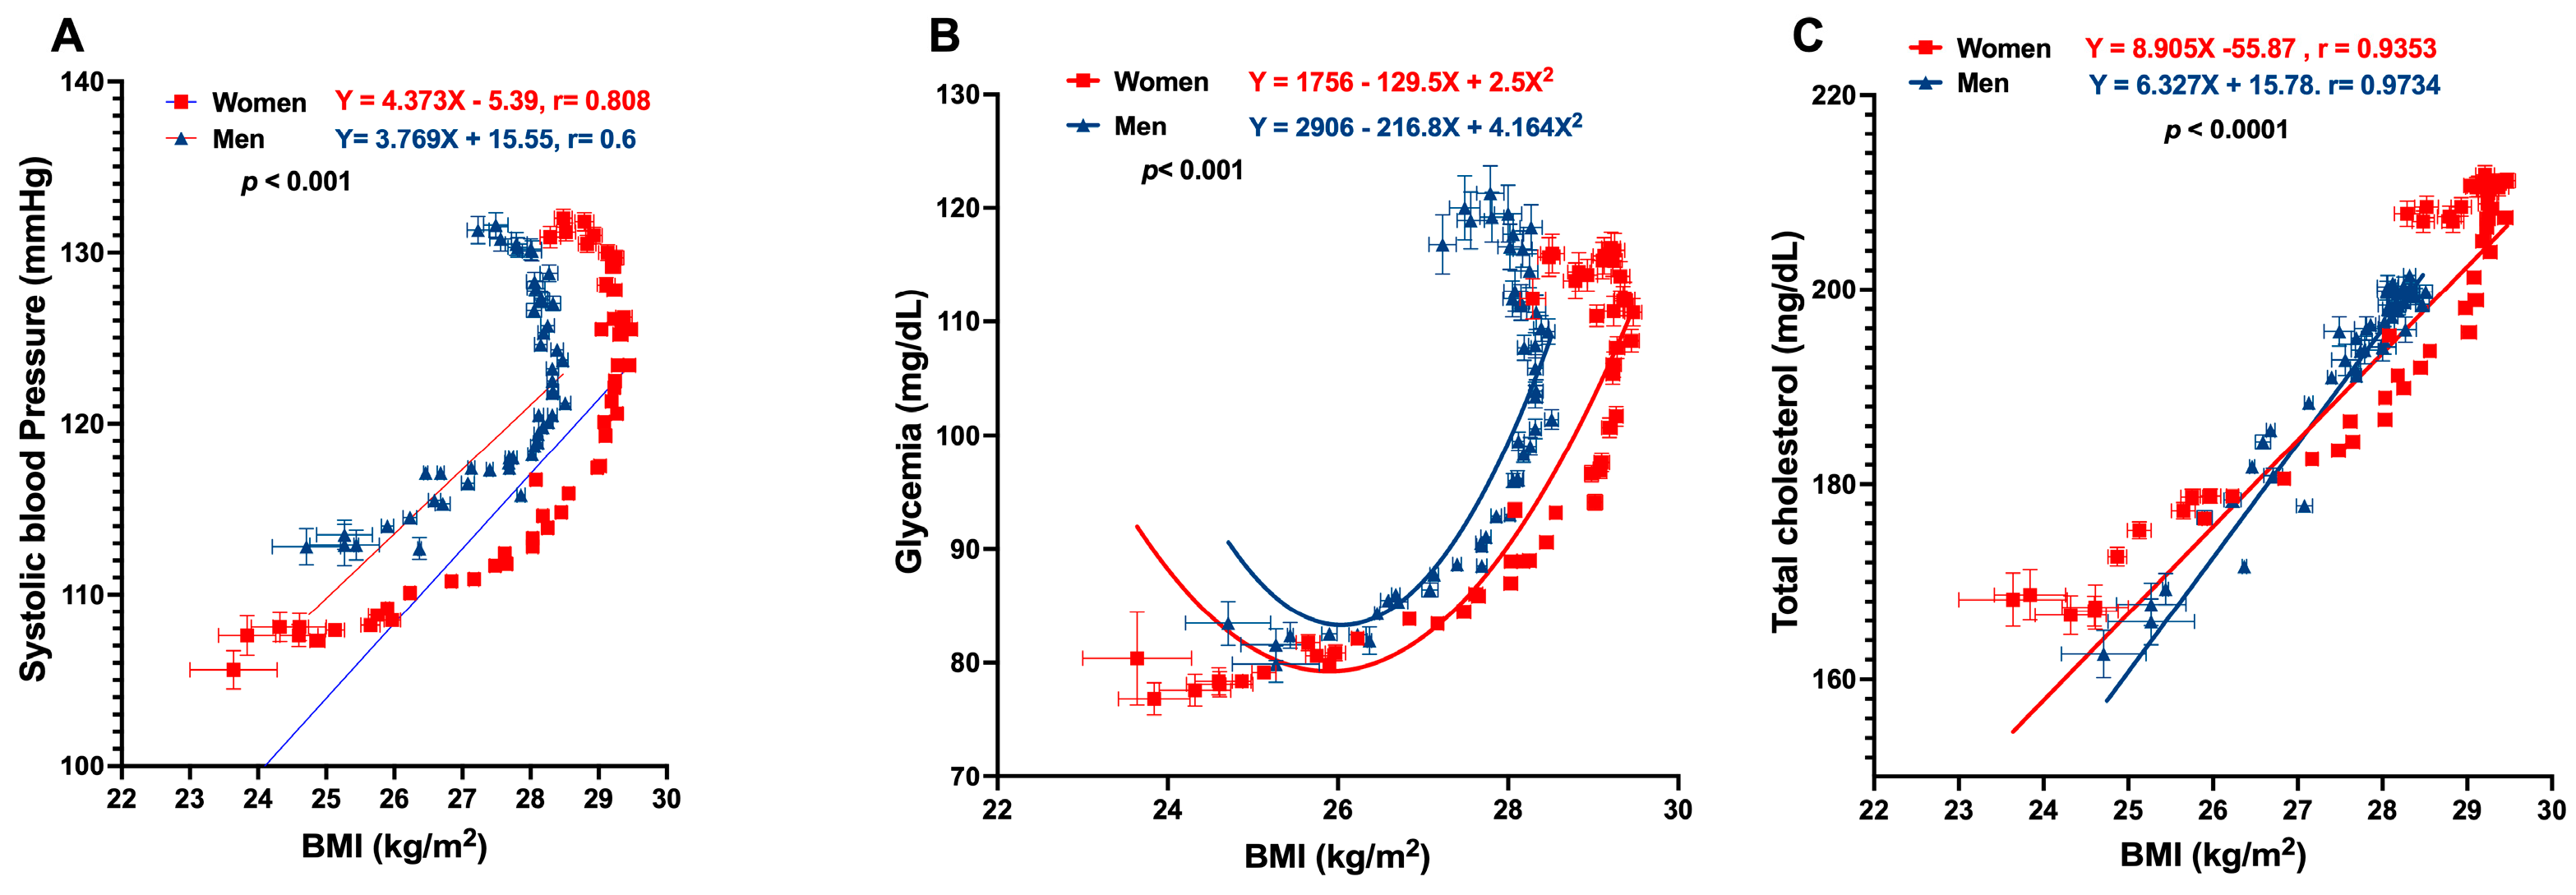
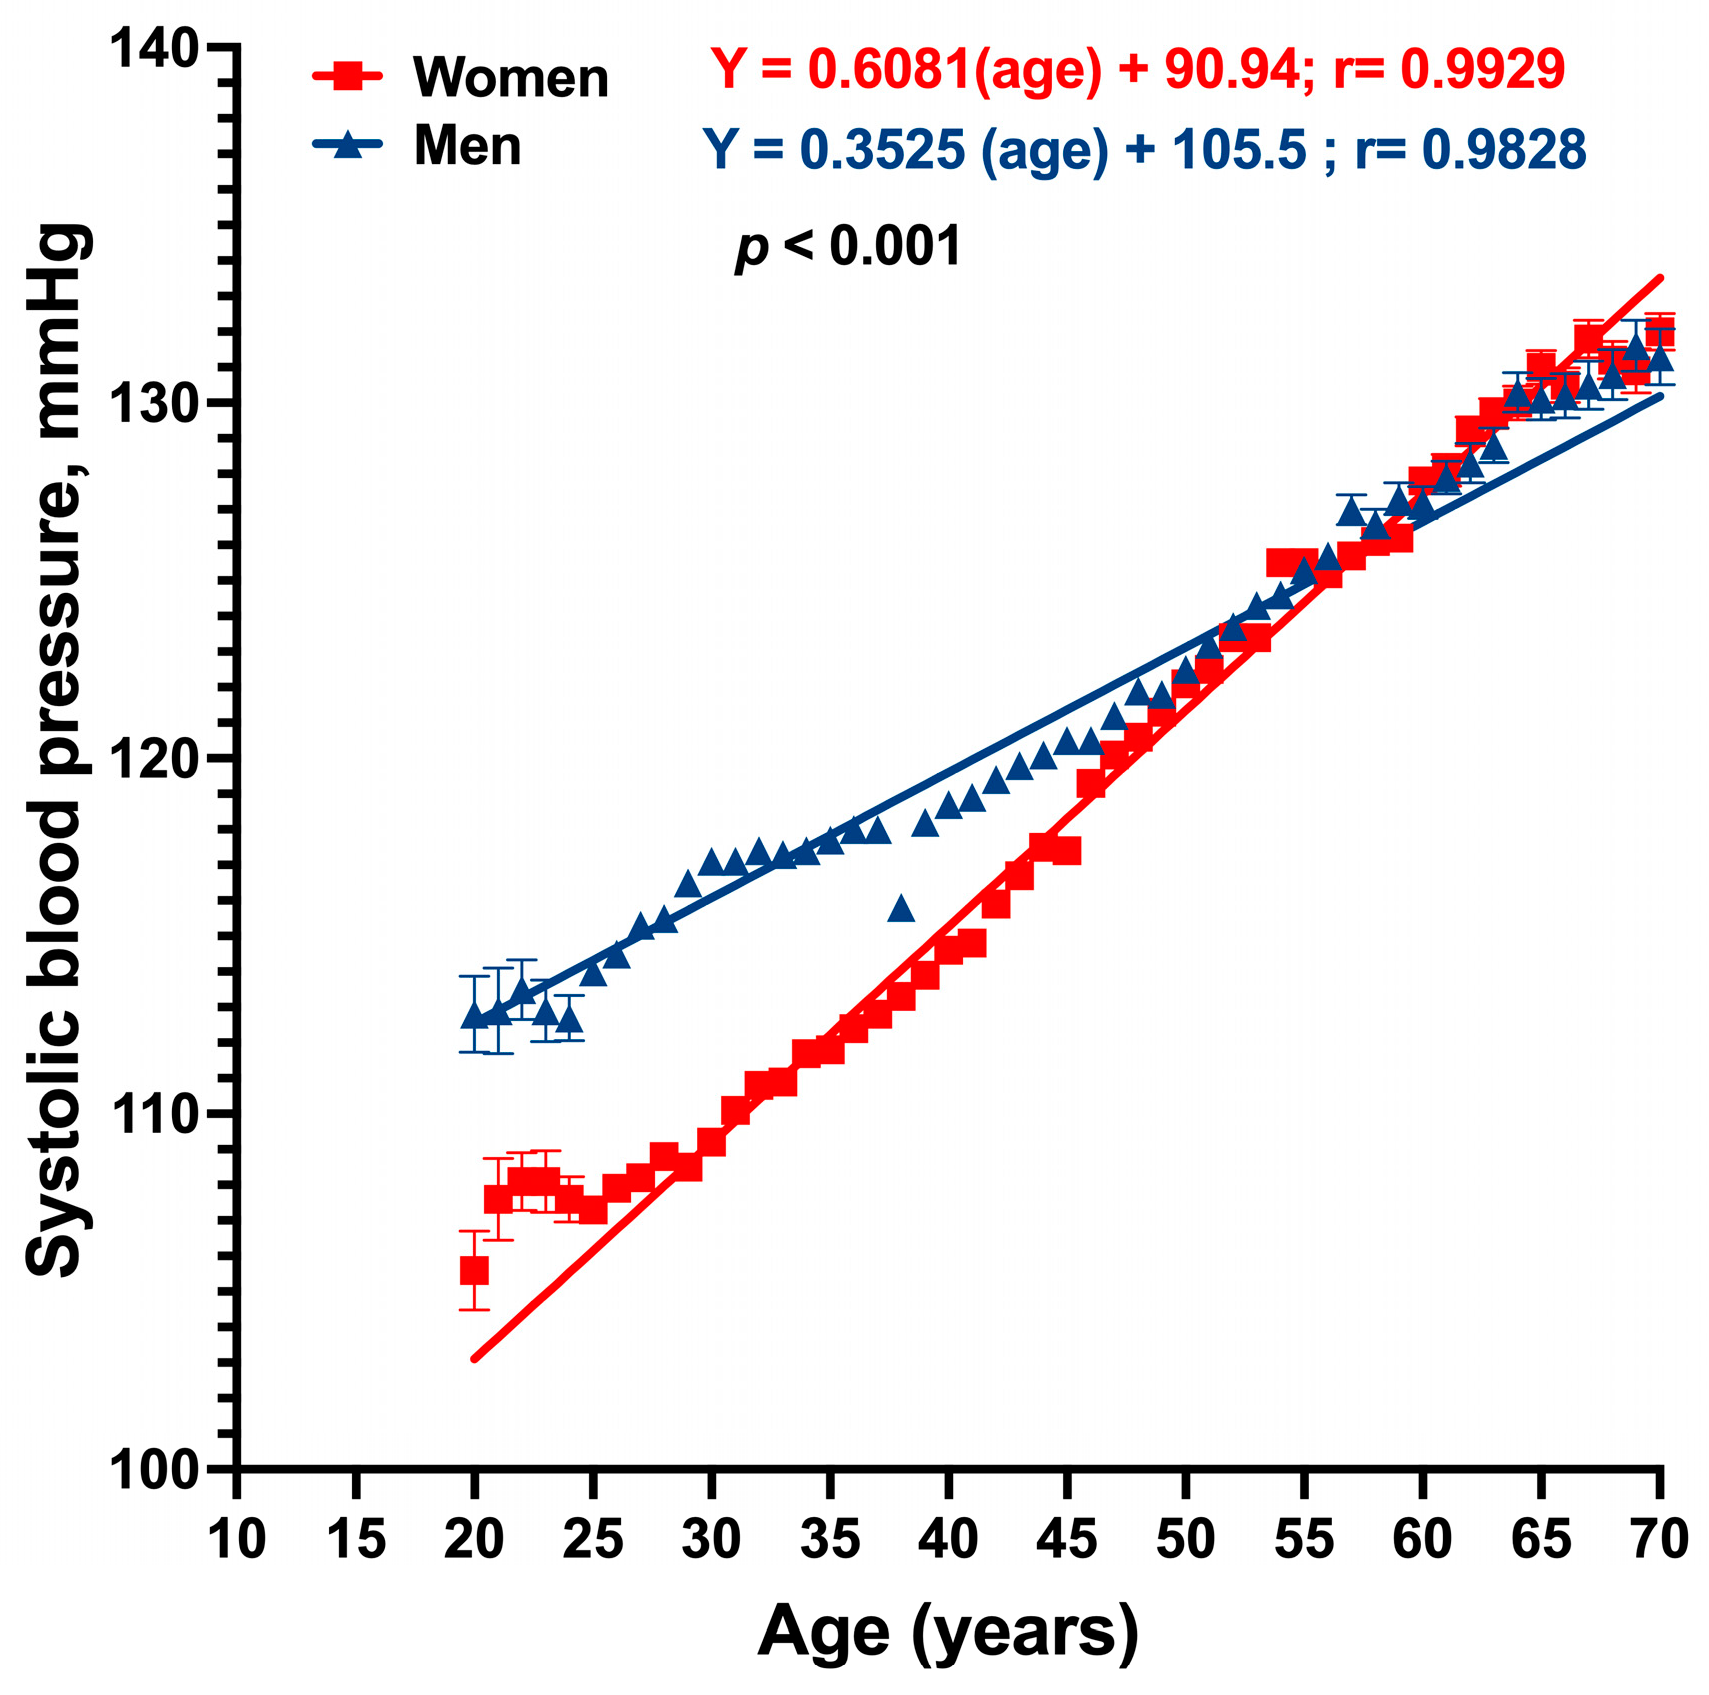
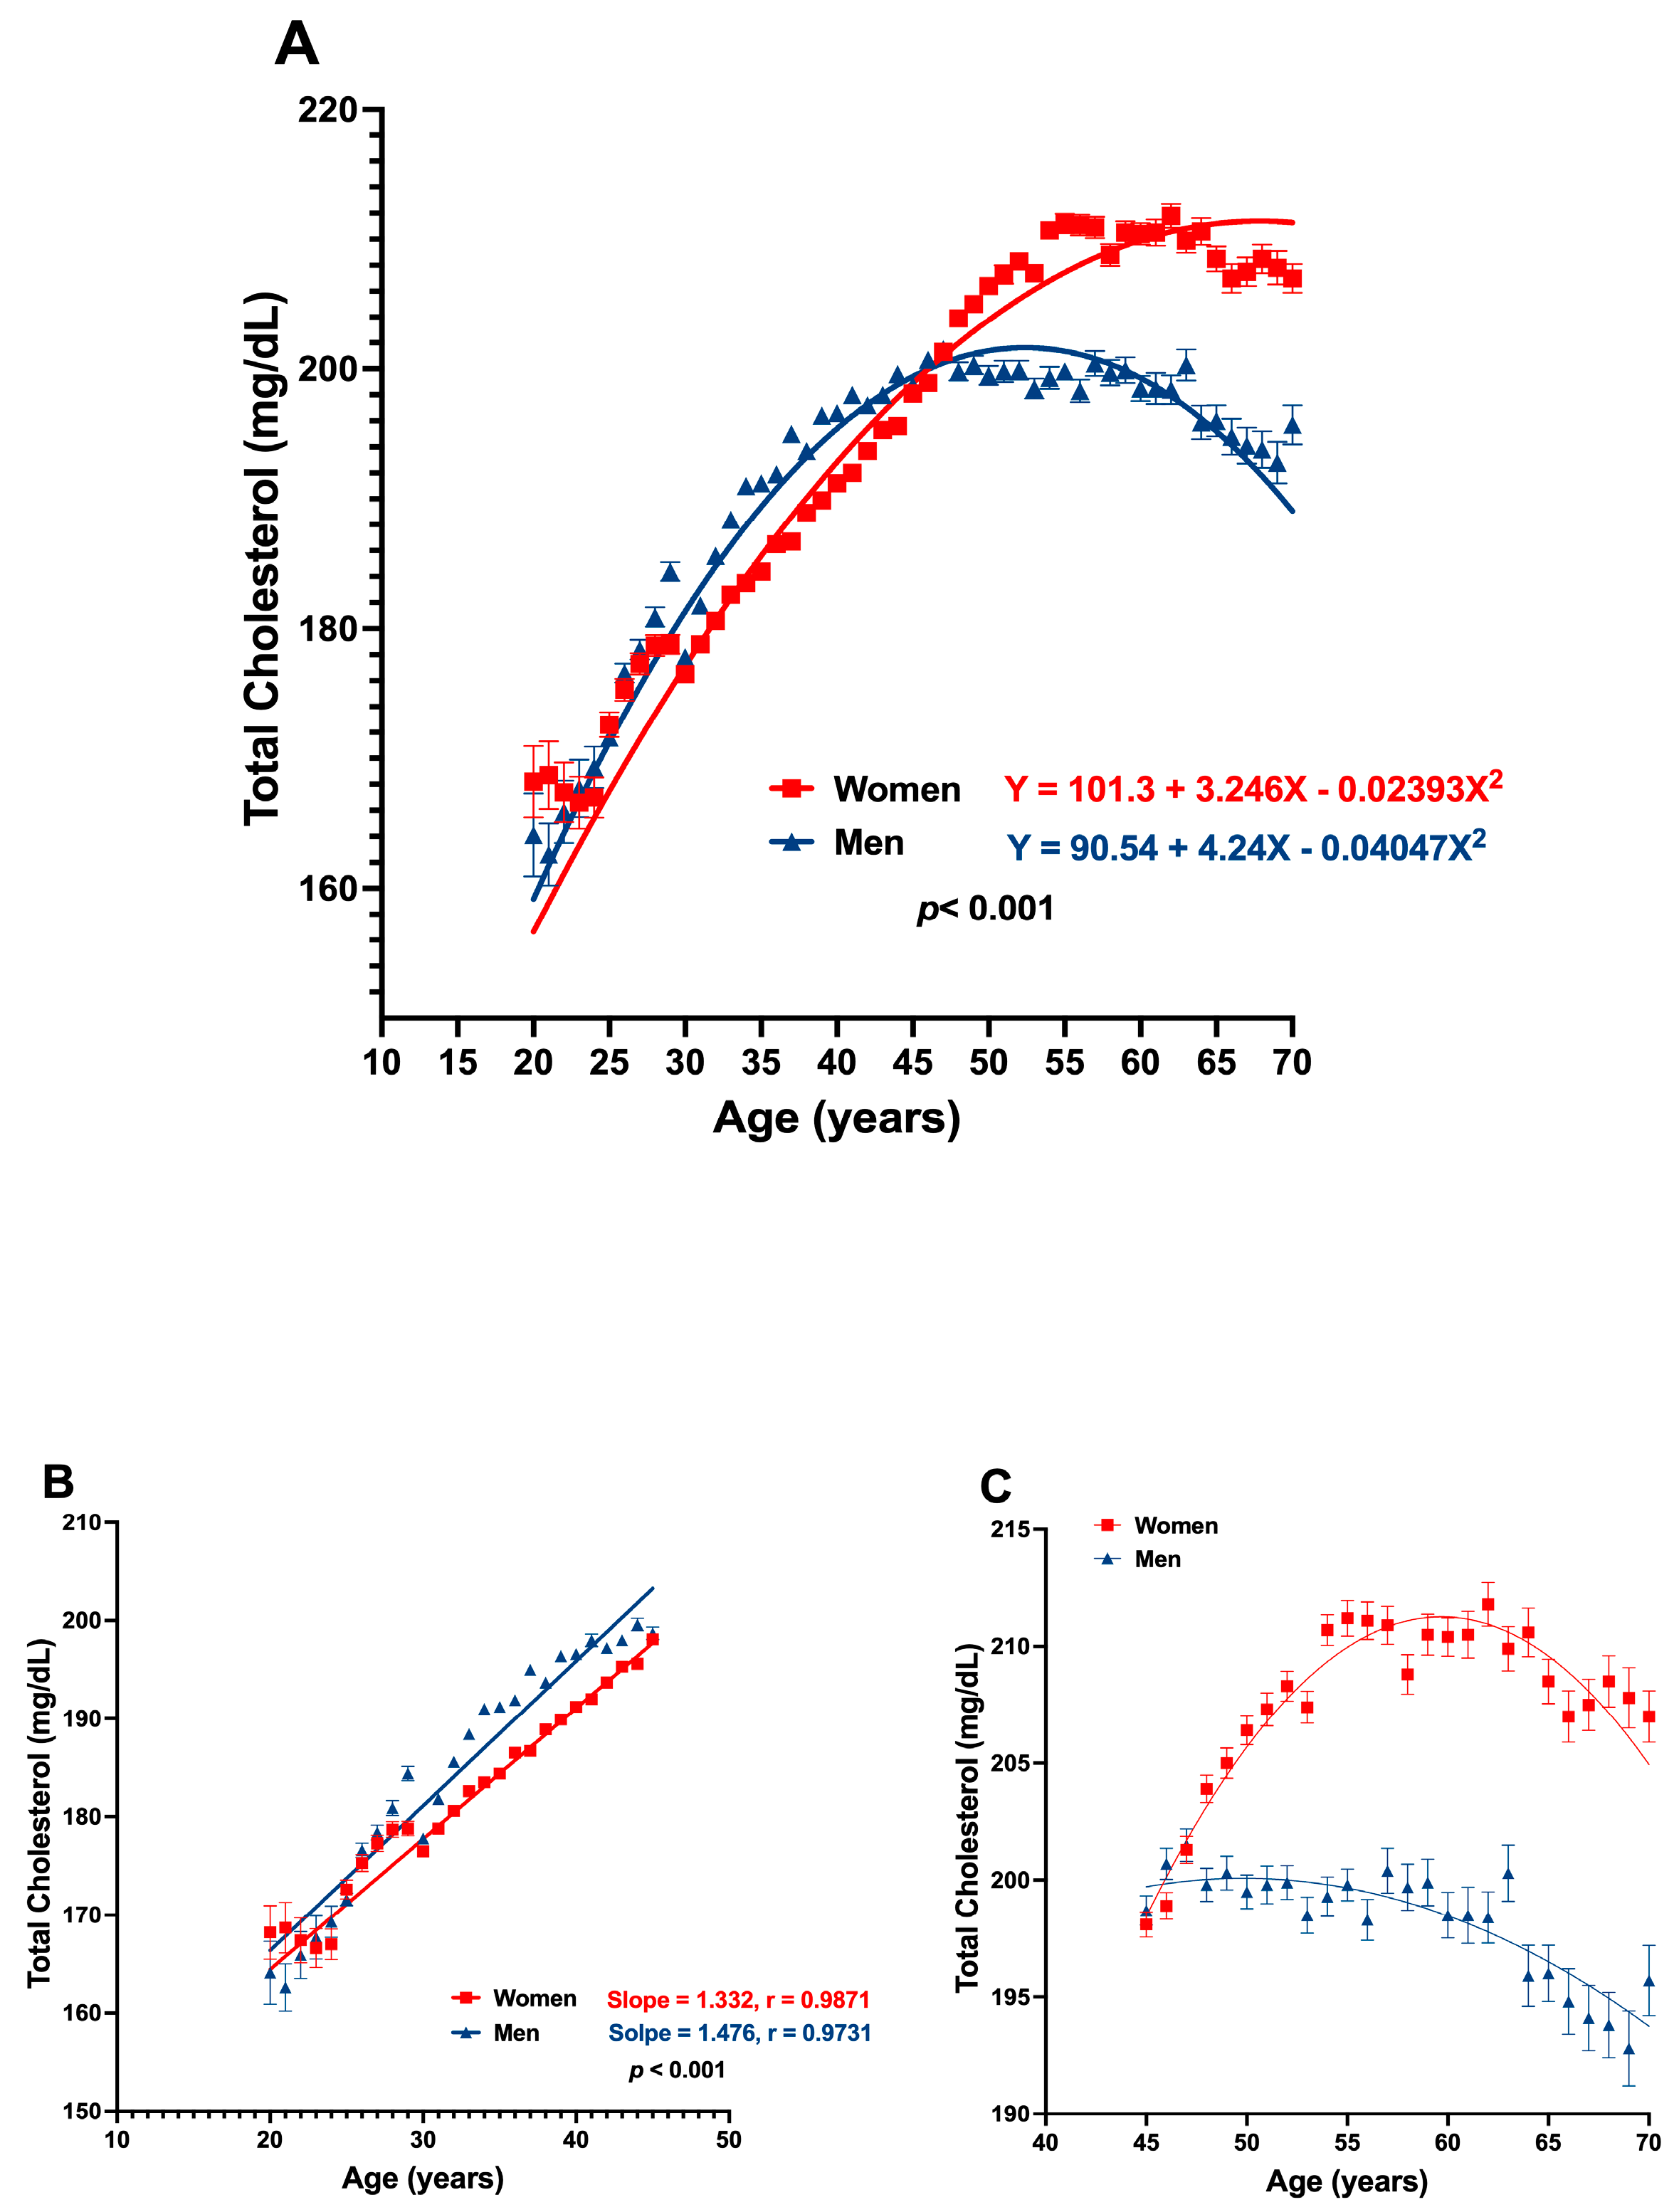
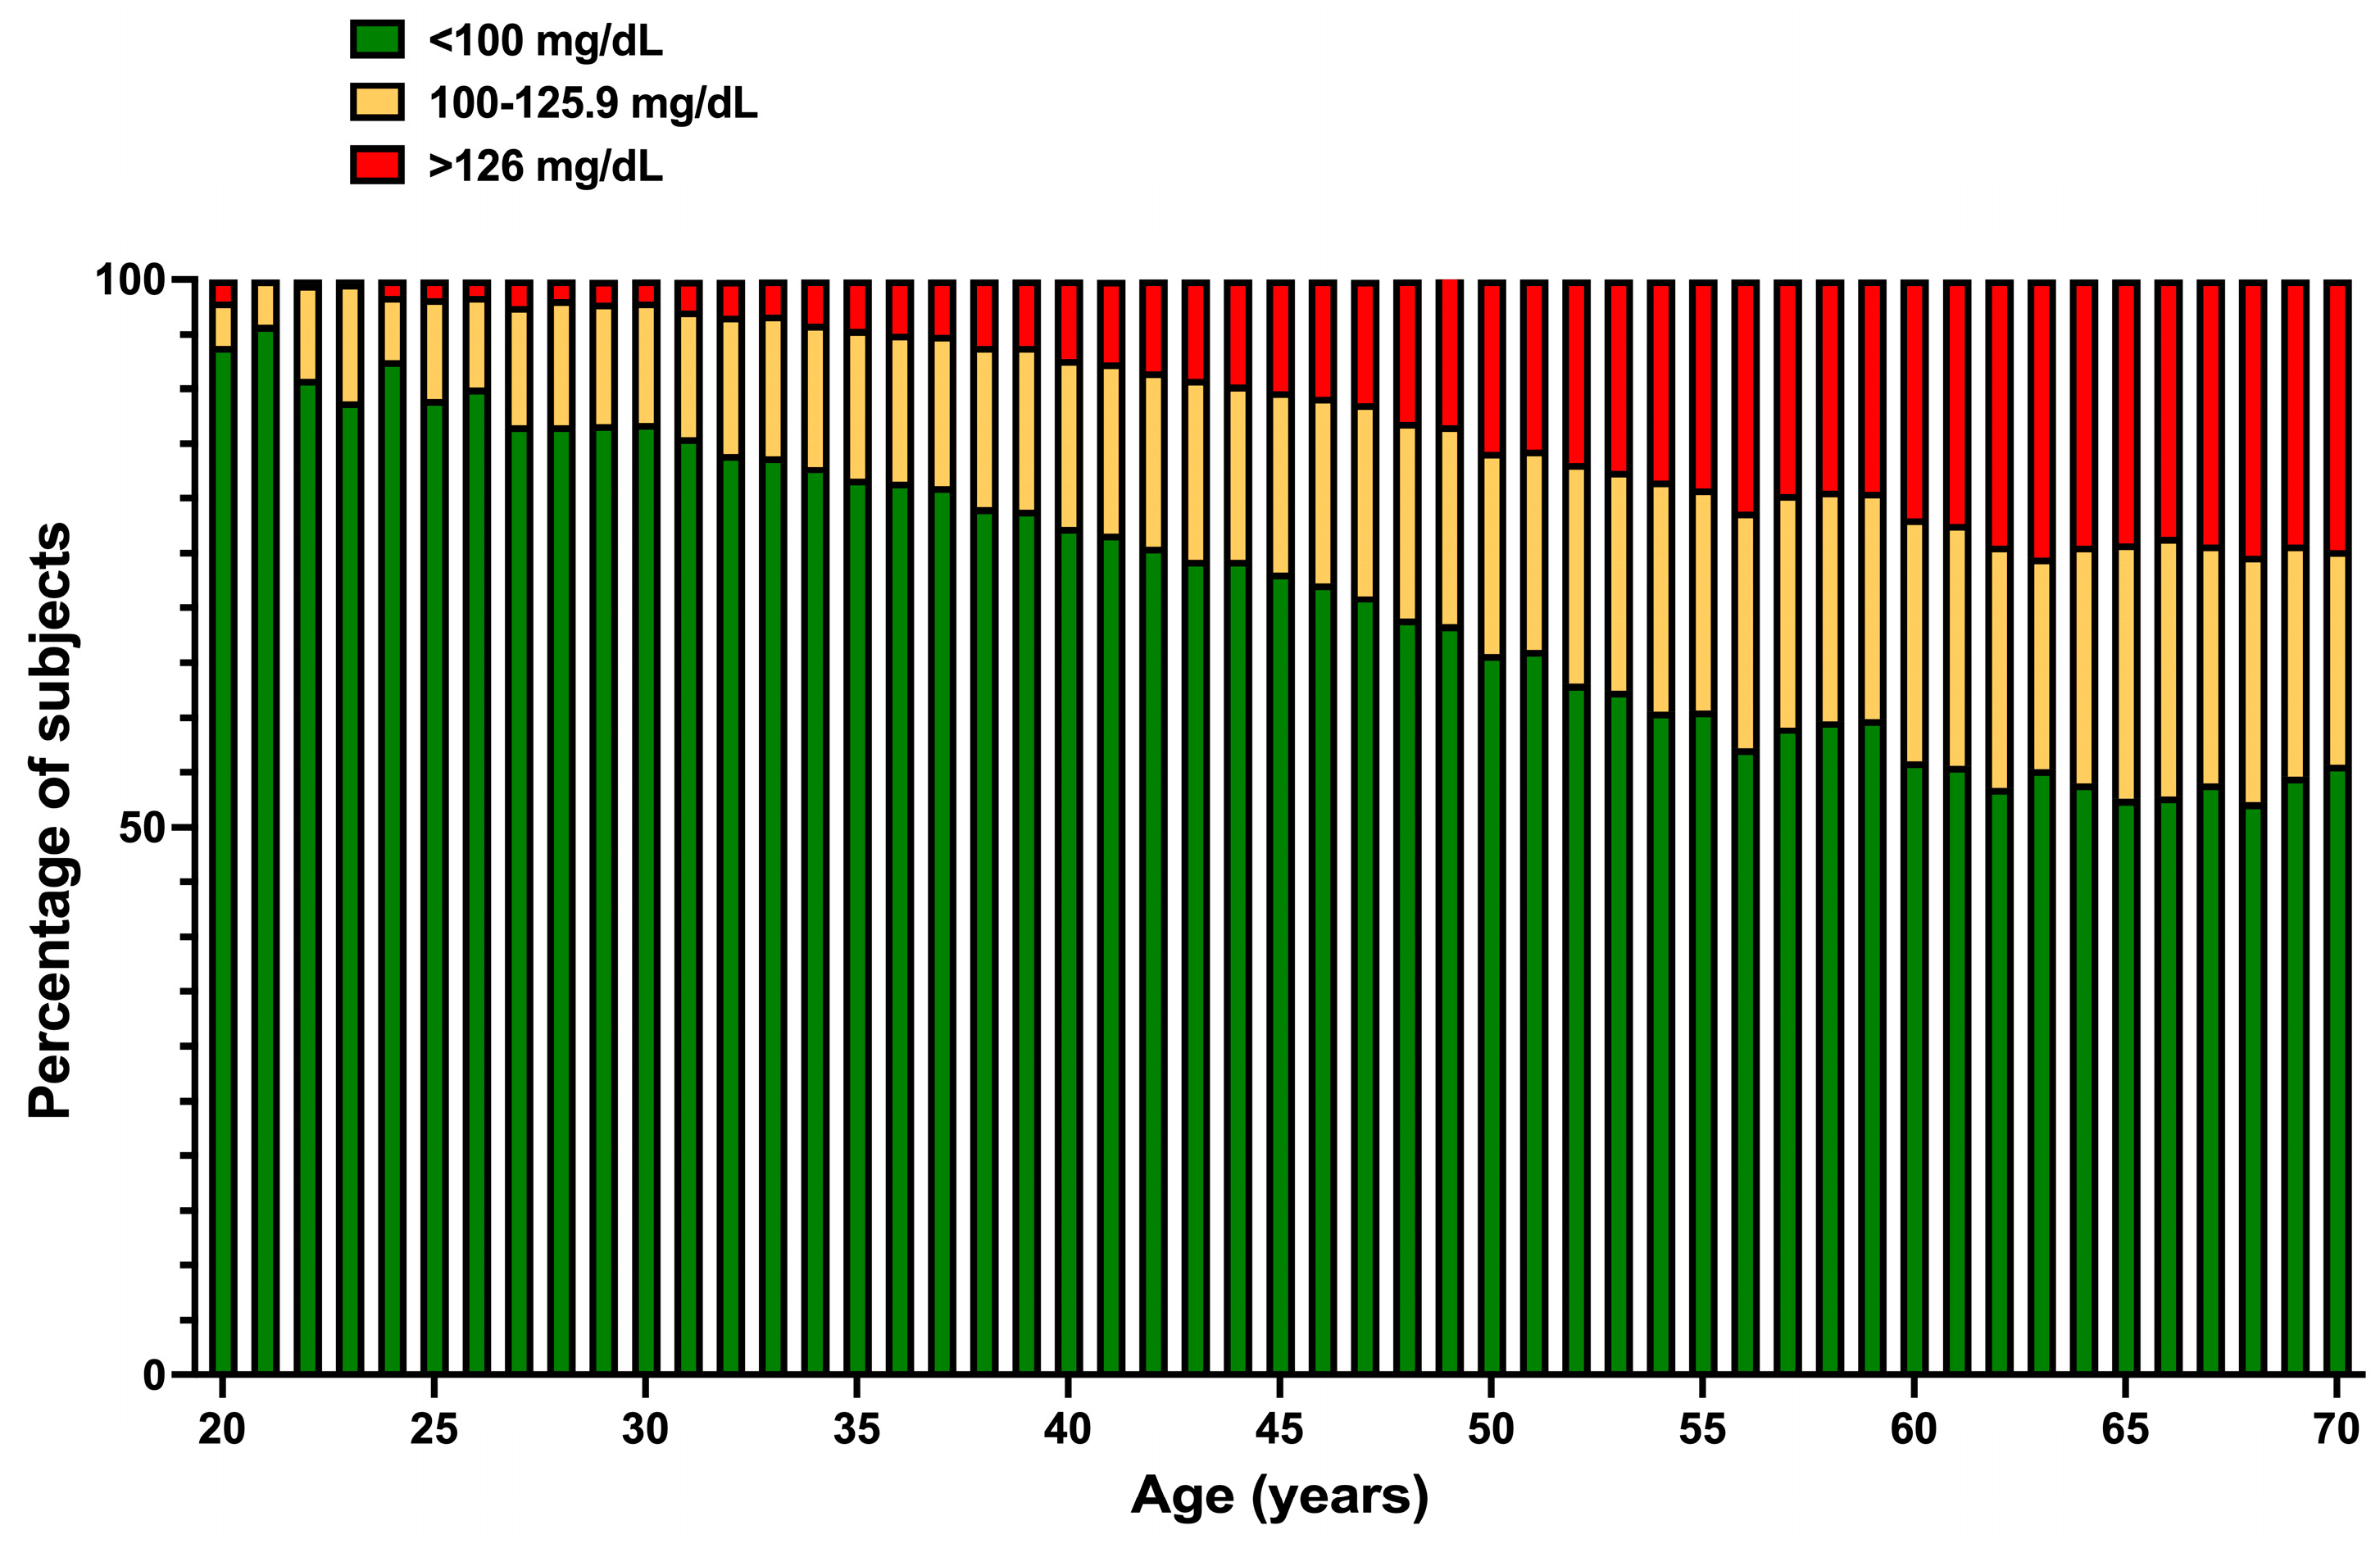
3. Results
4. Discussion
5. Conclusions
Author Contributions
Funding
Institutional Review Board Statement
Informed Consent Statement
Data Availability Statement
Acknowledgments
Conflicts of Interest
References
- Leong, D.P.; Joseph, P.G.; McKee, M.; Anand, S.S.; Teo, K.K.; Schwalm, J.-D.; Yusuf, S. Reducing the global burden of cardiovascular disease, part 2. Prevention and treatment of cardiovascular disease. Circ. Res. 2017, 121, 695–710. [Google Scholar] [CrossRef] [PubMed]
- Rippe, J.M. Lifestyle strategies for risk factor reduction, prevention, and treatment of cardiovascular disease. Am. J. Lifestyle Med. 2019, 13, 204–212. [Google Scholar] [CrossRef] [PubMed]
- Reiner, Ž.; Laufs, U.; Cosentino, F.; Landmesser, U. The year in cardiology 2018: Prevention. Eur. Heart J. 2019, 40, 336–344. [Google Scholar] [CrossRef] [PubMed]
- INEGI. Estadísticas de Defunciones Registradas (EDR) 2022 (Preliminar). Available online: https://www.inegi.org.mx/contenidos/saladeprensa/boletines/2023/EDR/EDR2022.pdf (accessed on 14 November 2023).
- Aguilar-Salinas, C.A.; Gómez-Pérez, F.J.; Rull, J.; Villalpando, S.; Barquera, S.; Rojas, R. Prevalence of dyslipidemias in the Mexican National Health and Nutrition Survey 2006. Salud Pública México 2010, 52 (Suppl. S1), 44–53. [Google Scholar] [CrossRef]
- Campos-Nonato, I.; Oviedo-Solís, C.; Vargas-Meza, J.; Ramírez-Villalobos, D.; Medina-García, C.; Gómez Álvarez, E.; Hernández-Barrera, L.; Barquera, S. Prevalence, treatment, and control of hypertension in Mexican adults: Results of the Ensanut 2022. Salud Pública México 2023, 65 (Suppl. S1), S169–S180. [Google Scholar] [CrossRef]
- Basto-Abreu, A.; López-Olmedo, N.; Rojas-Martínez, R.; Aguilar-Salinas, C.A.; Moreno-Banda, G.L.; Carnalla, M.; Rivera, J.A.; Romero-Martinez, M.; Barquera, S.; Barrientos-Gutiérrez, T. Prevalencia de prediabetes y diabetes en México: Ensanut 2022. Salud Pública México 2023, 65, s163–s168. [Google Scholar] [CrossRef] [PubMed]
- Arroyo-Quiroz, C.; Barrientos-Gutierrez, T.; O’Flaherty, M.; Guzman-Castillo, M.; Palacio-Mejia, L.; Osorio-Saldarriaga, E.; Rodriguez-Rodriguez, A.Y. Coronary heart disease mortality is decreasing in Argentina, and Colombia, but keeps increasing in Mexico: A time trend study. BMC Public Health 2020, 20, 162. [Google Scholar] [CrossRef] [PubMed]
- Fanghänel-Salmón, G.; Gutiérrez-Salmeán, G.; Samaniego, V.; Meaney, A.; Sánchez-Reyes, L.; Navarrete, U.; Alcocer, L.; Olivares-Corichi, I.; Najera, N.; Ceballos, G.; et al. Obesity phenotypes in urban middle-class cohorts; the PRIT-Lindavista merging evidence in Mexico: The OPUS PRIME study. Nutr. Hosp. 2015, 32, 182–188. [Google Scholar] [CrossRef]
- Meaney, A.; Ceballos-Reyes, G.; Gutierrez-Salmean, G.; Samaniego-Méndez, V.; Vela-Huerta, A.; Alcocer, L.; Zárate-Chavarría, E.; Mendoza-Castelán, E.; Olivares-Corichi, I.; García-Sánchez, R.; et al. Cardiovascular risk factors in a Mexican middle-class urban population. The Lindavista Study. Baseline Data. Arch. Cardiol. Mex. 2013, 83, 249–256. [Google Scholar] [CrossRef] [PubMed]
- Meaney, E.; Lara-Esqueda, A.; Ceballos-Reyes, G.M.; Asbun, J.; Vela, A.; Martínez-Marroquín, Y.; López, V.; Meaney, A.; de la Cabada-Tamez, E.; Velázquez-Monroy, O.; et al. Cardiovascular risk factors in the urban Mexican population: The Frimex study. Public Health 2007, 121, 378–384. [Google Scholar] [CrossRef]
- Bray, G.A.; Kim, K.K.; Wilding, J.P.H. World Obesity Federation Obesity: A chronic relapsing progressive disease process. A position statement of the World Obesity Federation. Obes. Rev. 2017, 18, 715–723. [Google Scholar] [CrossRef] [PubMed]
- Velázquez Moreno, H.; Gaxiola Cácerez, S.; Alcocer Chauvet, A.; González Coronado, V.J.; Zárate Chavarría, E.; Meaney, E. Obesidad y síndrome metabólico. In Medicina Cardiovascular; Navarro Robles, J., Ed.; Elsevier/Asociación Nacional de Cardiólogos de México: Ciudad de México, México, 2012; pp. 124–141. [Google Scholar]
- WHO Expert Committee. Physical Status: The Use and Interpretation of Anthropometry; WHO Technical Report Series No. 854; WHO: Geneva, Switzerland, 1995.
- Perone, F.; Pingitore, A.S.; Conte, E.; Halasz, G.; Ambrosetti, M.; Peruzzi, M.; Cavarretta, E. Obesity and cardiovascular risk: Systematic intervention is the key for prevention. Healthcare 2023, 11, 902. [Google Scholar] [CrossRef] [PubMed]
- Akil, L.; Ahmad, H.A. Relationships between obesity and cardiovascular diseases in four southern states and Colorado. J. Health Care Poor Underserved. 2011, 22 (Suppl. S4), 61–72. [Google Scholar] [CrossRef] [PubMed]
- Powell-Wiley, T.M.; Poirier, P.; Burke, L.E.; Després, J.-P.; Gordon-Larsen, P.; Lavie, C.J.; Lear, S.A.; Ndumele, C.E.; Neeland, I.J.; Sanders, P.; et al. Obesity and cardiovascular disease: A Scientific Statement From the American Heart Association. Circulation 2021, 143, e984–e1010. [Google Scholar] [CrossRef]
- Lopez-Jimenez, F.; Almahmeed, W.; Bays, H.; Cuevas, A.; Di Angelantonio, E.; le Roux, C.W.; Sattar, N.; Sun, M.C.; Wittert, G.; Pinto, F.J.; et al. Obesity and cardiovascular disease: Mechanistic insights and management strategies. A joint position paper by the World Heart Federation and World Obesity Federation. Eur. J. Prev. Cardiol. 2022, 29, 2218–2237. [Google Scholar] [CrossRef] [PubMed]
- International Conference on Harmonisation. Guidelines on Good Clinical Practice. Int. Dig. Health Legis. 1997, 48, 231–234. [Google Scholar] [CrossRef]
- World Medical Association. Declaration of Helsinki: Ethical principles for medical research involving human subjects. JAMA 2013, 310, 2191–2194. [Google Scholar] [CrossRef] [PubMed]
- Diario de la Federación. Available online: http://www.salud.gob.mx/cnts/pdfs/LEY_GENERAL_DE_SALUD.pdf (accessed on 30 October 2023).
- Pickering, T.G.; Hall, J.E.; Appel, L.J.; Falkner, B.E.; Graves, J.; Hill, M.N.; Jones, D.W.; Kurtz, T.; Sheps, S.G.; Roccella, E.J. Recommendations for blood pressure measurement in humans and experimental animals: Part 1: Blood pressure measurement in humans: A statement for professionals from the Subcommittee of Professional and Public Education of the American Heart Association Council on High Blood Pressure Research. Circulation 2005, 111, 697–716. [Google Scholar] [CrossRef] [PubMed]
- Proyecto de Norma Oficial Mexicana PROY-NOM030-SSA2-2017, Para la Prevención, Detección, Diagnóstico, Tratamiento y Control de la Hipertensión Arterial Sistémica. Diario Oficial de la Federación 19/04/2017. Available online: https://dof.gob.mx/nota_detalle.php?codigo=5480159&fecha=19/04/2017#gsc.tab=0 (accessed on 30 October 2023).
- Hadaye, R.; Kale, V.; Manapurath, R.M. Strategic implications of changing rule of halves in hypertension: A cross-sectional observational study. J. Fam. Med. Prim. Care 2019, 8, 1049–1053. [Google Scholar] [CrossRef]
- ElSayed, N.A.; Aleppo, G.; Aroda, V.R.; Bannuru, R.P.; Brown, F.M.; Bruemmer, D.; Collins, B.S.; Gaglia, J.L.; Hilliard, M.E.; Isaacs, D.; et al. Classification and diagnosis of diabetes: Standards of care in Diabetes—2023. Diabetes Care 2023, 46 (Suppl. S1), S19–S40. [Google Scholar] [CrossRef] [PubMed]
- Expert Panel on Detection, Evaluation, and Treatment of High Blood Cholesterol in Adults. Executive summary of the third report of the National Cholesterol Education Program (NCEP) expert panel on detection, evaluation, and treatment of high blood cholesterol in adults (Adult Treatment Panel III). JAMA 2001, 285, 2486–2497. [Google Scholar] [CrossRef] [PubMed]
- CDC. Office of Policy, Performance, and Evaluation. Definition of Policy. Available online: https://www.cdc.gov/policy/paeo/process/definition.html (accessed on 19 November 2023).
- Milio, N. Glossary: Healthy public policy. J. Epidemiol. Community Health 2001, 55, 622–623. [Google Scholar] [CrossRef]
- Shamah-Levy, T.; Villalpando-Hernández, S.; Rivera-Dommarco, J.A. Resultados de Nutrición de la ENSANUT 2006. Cuernavaca, México: Instituto Nacional de Salud Pública, 2007. Available online: https://ensanut.insp.mx/encuestas/ensanut2006/doctos/informes/resultados_ensanut2006.pdf. (accessed on 21 November 2023).
- Gutiérrez, J.P.; Rivera-Dommarco, J.; Shamah-Levy, T.; Villalpando-Hernández, S.; Franco, A.; Cuevas-Nasu, L.; Romero-Martínez, M. Encuesta Na-Cional de Salud y Nutrición 2012. Resultados Nacionales. Instituto Nacional de Salud Pública (MX): Cuernavaca, México, 2012. Available online: https://ensanut.insp.mx/encuestas/ensanut2012/doctos/informes/ENSANUT2012ResultadosNacionales.pdf (accessed on 21 November 2023).
- Campos-Nonato, I.; Galván-Valencia, O.; Hernández-Barrera, L.; Oviedo-Solís, C.; Barquera, S. Prevalence of obesity and associated risk factors in Mexican adults: Results of the Ensanut 2022. Salud Pública México 2023, 65 (Suppl. S1), S238–S247. [Google Scholar] [CrossRef]
- Al-Goblan, A.S.; Al-Alfi, M.A.; Khan, M.Z. Mechanism linking diabetes mellitus and obesity. Diabetes Metab. Syndr. Obes. 2014, 7, 587–591. [Google Scholar] [CrossRef] [PubMed]
- Piché, M.E.; Poirier, P.; Lemieux, I.; Després, J.P. Overview of epidemiology and contribution of obesity and body fat distribution to cardiovascular disease: An update. Prog. Cardiovasc. Dis. 2018, 61, 103–113. [Google Scholar] [CrossRef] [PubMed]
- Lindblad, U.; Ek, J.; Eckner, J.; Larsson, C.A.; Shan, G.; Råstam, L. Prevalence, awareness, treatment, and control of hypertension: Rule of thirds in the Skaraborg project. Scand. J. Prim. Health Care 2012, 30, 88–94. [Google Scholar] [CrossRef]
- Beckett, N.; Nunes, M.; Bulpitt, C. Is it advantageous to lower cholesterol in the elderly hypertensive? Cardiovasc. Drugs Ther. 2000, 14, 397–405. [Google Scholar] [CrossRef] [PubMed]
- Ferrara, A.; Barrett-Connor, E.; Shan, J. Total, LDL, and HDL Cholesterol decrease with age in older men and women. The Rancho Bernardo Study 1984–1994. Circulation 1997, 96, 37–43. [Google Scholar] [CrossRef] [PubMed]
- Estrella-Castillo, D.F.; Gómez-de-Regil, L. Comparison of body mass index range criteria and their association with cognition, functioning and depression: A cross-sectional study in Mexican older adults. BMC Geriatr. 2019, 19, 339. [Google Scholar] [CrossRef]
- Meaney, E.; Soltero, E.; Samaniego, V.; Alva, F.; Moguel, R.; Vela, A.; Gonzalez, V. Vascular dynamics in isolated systolic arterial hypertension. Clin. Cardiol. 1995, 18, 721–725. [Google Scholar] [CrossRef]
- Clamp, L.D.; Hume, D.J.; Lambert, E.V.; Kroff, J. Enhanced insulin sensitivity in successful, long-term weight loss maintainers compared with matched controls with no weight loss history. Nutr. Diabetes 2017, 7, e282. [Google Scholar] [CrossRef] [PubMed]
- Hall, J.E.; Brands, M.W.; Henegar, J.R. Mechanisms of hypertension and kidney disease in obesity. Ann. N. Y. Acad. Sci. 1999, 892, 91–107. [Google Scholar] [CrossRef]
- Dietz, W.H.; Baur, L.A.; Hall, K.; Puhl, R.M.; Taveras, E.M.; Uauy, R. Management of obesity: Improvement of health-care training and systems for prevention and care. Lancet 2015, 385, 2521–2533. [Google Scholar] [CrossRef]
- Meaney, E.; Munguía, L.; Nájera, N.; Ceballos, G. Mexican epidemiological paradox: A developing country with a burden of “richness” diseases. In An Update. Encyclopedia of Environmental Health, 2nd ed.; Elsevier: Amsterdam, The Netherlands, 2011; pp. 738–748. [Google Scholar] [CrossRef]
- He, J.; Zhu, Z.; Bundy, J.D.; Dorans, K.S.; Chen, J.; Hamm, L.L. Trends in cardiovascular risk factors in US adults by race and ethnicity and socioeconomic status, 1999–2018. JAMA 2021, 326, 1286–1298. [Google Scholar] [CrossRef] [PubMed]
- Amini, M.; Zayeri, F.; Salehi, M. Trend analysis of cardiovascular disease mortality, incidence, and mortality-to-incidence ratio: Results from global burden of disease study 2017. BMC Public Health 2021, 21, 401. [Google Scholar] [CrossRef] [PubMed]
- European Society of Cardiology: Cardiovascular Disease Statistics 2019. Available online: https://iris.unibocconi.it/retrieve/handle/11565/4023471/115818/Torbica%20EHJ%202019.pdf (accessed on 1 April 2024).
- Anonymous. Overweight and Obesity—BMI Statistics. Available online: https://ec.europa.eu/eurostat/statistics (accessed on 1 April 2024).
- Piechocki, M.; Przewłocki, T.; Pieni Pianiążek, P.; Trystuła, M.; Podolec, J.; Kabłak-Ziembicka, A. A non-coronary, peripheral arterial atherosclerotic disease (carotid, renal, lower limb) in elderly patients—A review: Part I—Epidemiology, risk factors, and atherosclerosis-related diversities in elderly patients. J. Clin. Med. 2024, 13, 1471. [Google Scholar] [CrossRef] [PubMed]


| Weight, kg Mean ± SD | BMI, kg/m2 Mean ± SD | TC, mg/dL Mean ± SD | Glycemia, mg/dL Mean ± SD | SBP, mm Hg Mean ± SD | DBP, mm Hg Mean ± SD |
|---|---|---|---|---|---|
| All, N = 297,370 | |||||
| 72.64 ± 14.28 | 27.8 ± 4.76 | 192.5 ± 35.62 | 95.33 ± 43.81 | 118.4 ± 16.19 | 78.17 ± 18.53 |
| Women, n = 161,264 | |||||
| 67.64 ± 13.1 | 27.99 ± 5.25 | 193.6 ± 36.2 | 94.84 ± 45.52 | 117.1 ± 17.22 | 77.06 ± 22.91 |
| Men, n = 136,106 | |||||
| 78.56 ± 13.2 | 27.57 ± 4.05 | 191.2 ± 34.86 | 95.91 ± 41.68 | 119.9 ± 14.74 | 79.49 ± 11.19 |
| Gender | Risk Factor | Equation |
|---|---|---|
| Women | Total cholesterol, mg/dL | TC = 18.21 + 3.936 (BMI) − 0.1087 (age) + 0.7374 (glucose) |
| Systolic blood pressure, mm Hg | SBP = 67.64 + 0.4703 (BMI) − 0.1544 (cholesterol) + 0.6989 (glucose) | |
| Body mass index, kg/m2 | BMI = −0.4008 + 0.03528 (age) + 0.2141 (cholesterol) − 0.1543 (glucose) | |
| Men | Total cholesterol, mg/dL | TC = −80.70 + 10.13 (BMI) + 0.2935 (age) + 0.2012 (glucose) |
| Systolic blood pressure, mm Hg | SBP = 100.8 − 1.593 (BMI) + 0.1072 (cholesterol) + 0.4391 (glucose) | |
| Body mass index, kg/m2 | BMI = 9.297 − 0.02189 (age) + 0.0912 (cholesterol) + 0.1612 (glucose) |
Disclaimer/Publisher’s Note: The statements, opinions and data contained in all publications are solely those of the individual author(s) and contributor(s) and not of MDPI and/or the editor(s). MDPI and/or the editor(s) disclaim responsibility for any injury to people or property resulting from any ideas, methods, instructions or products referred to in the content. |
© 2024 by the authors. Licensee MDPI, Basel, Switzerland. This article is an open access article distributed under the terms and conditions of the Creative Commons Attribution (CC BY) license (https://creativecommons.org/licenses/by/4.0/).
Share and Cite
Meaney, E.; Pérez-Robles, E.; Ortiz-Flores, M.; Perez-Ishiwara, G.; Meaney, A.; Munguía, L.; Roman, G., on behalf of the Coalición por el Corazón de México; Nájera, N.; Ceballos, G. Overweight, Obesity, and Age Are the Main Determinants of Cardiovascular Risk Aggregation in the Current Mexican Population: The FRIMEX III Study. J. Clin. Med. 2024, 13, 2248. https://doi.org/10.3390/jcm13082248
Meaney E, Pérez-Robles E, Ortiz-Flores M, Perez-Ishiwara G, Meaney A, Munguía L, Roman G on behalf of the Coalición por el Corazón de México, Nájera N, Ceballos G. Overweight, Obesity, and Age Are the Main Determinants of Cardiovascular Risk Aggregation in the Current Mexican Population: The FRIMEX III Study. Journal of Clinical Medicine. 2024; 13(8):2248. https://doi.org/10.3390/jcm13082248
Chicago/Turabian StyleMeaney, Eduardo, Enrique Pérez-Robles, Miguel Ortiz-Flores, Guillermo Perez-Ishiwara, Alejandra Meaney, Levy Munguía, Gisele Roman on behalf of the Coalición por el Corazón de México, Nayelli Nájera, and Guillermo Ceballos. 2024. "Overweight, Obesity, and Age Are the Main Determinants of Cardiovascular Risk Aggregation in the Current Mexican Population: The FRIMEX III Study" Journal of Clinical Medicine 13, no. 8: 2248. https://doi.org/10.3390/jcm13082248
APA StyleMeaney, E., Pérez-Robles, E., Ortiz-Flores, M., Perez-Ishiwara, G., Meaney, A., Munguía, L., Roman, G., on behalf of the Coalición por el Corazón de México, Nájera, N., & Ceballos, G. (2024). Overweight, Obesity, and Age Are the Main Determinants of Cardiovascular Risk Aggregation in the Current Mexican Population: The FRIMEX III Study. Journal of Clinical Medicine, 13(8), 2248. https://doi.org/10.3390/jcm13082248