

Electronic-Medical-Record-Driven Machine Learning Predictive Model for Hospital-Acquired Pressure Injuries: Development and External Validation

 , , , , ,
Abstract
:1. Introduction
- -
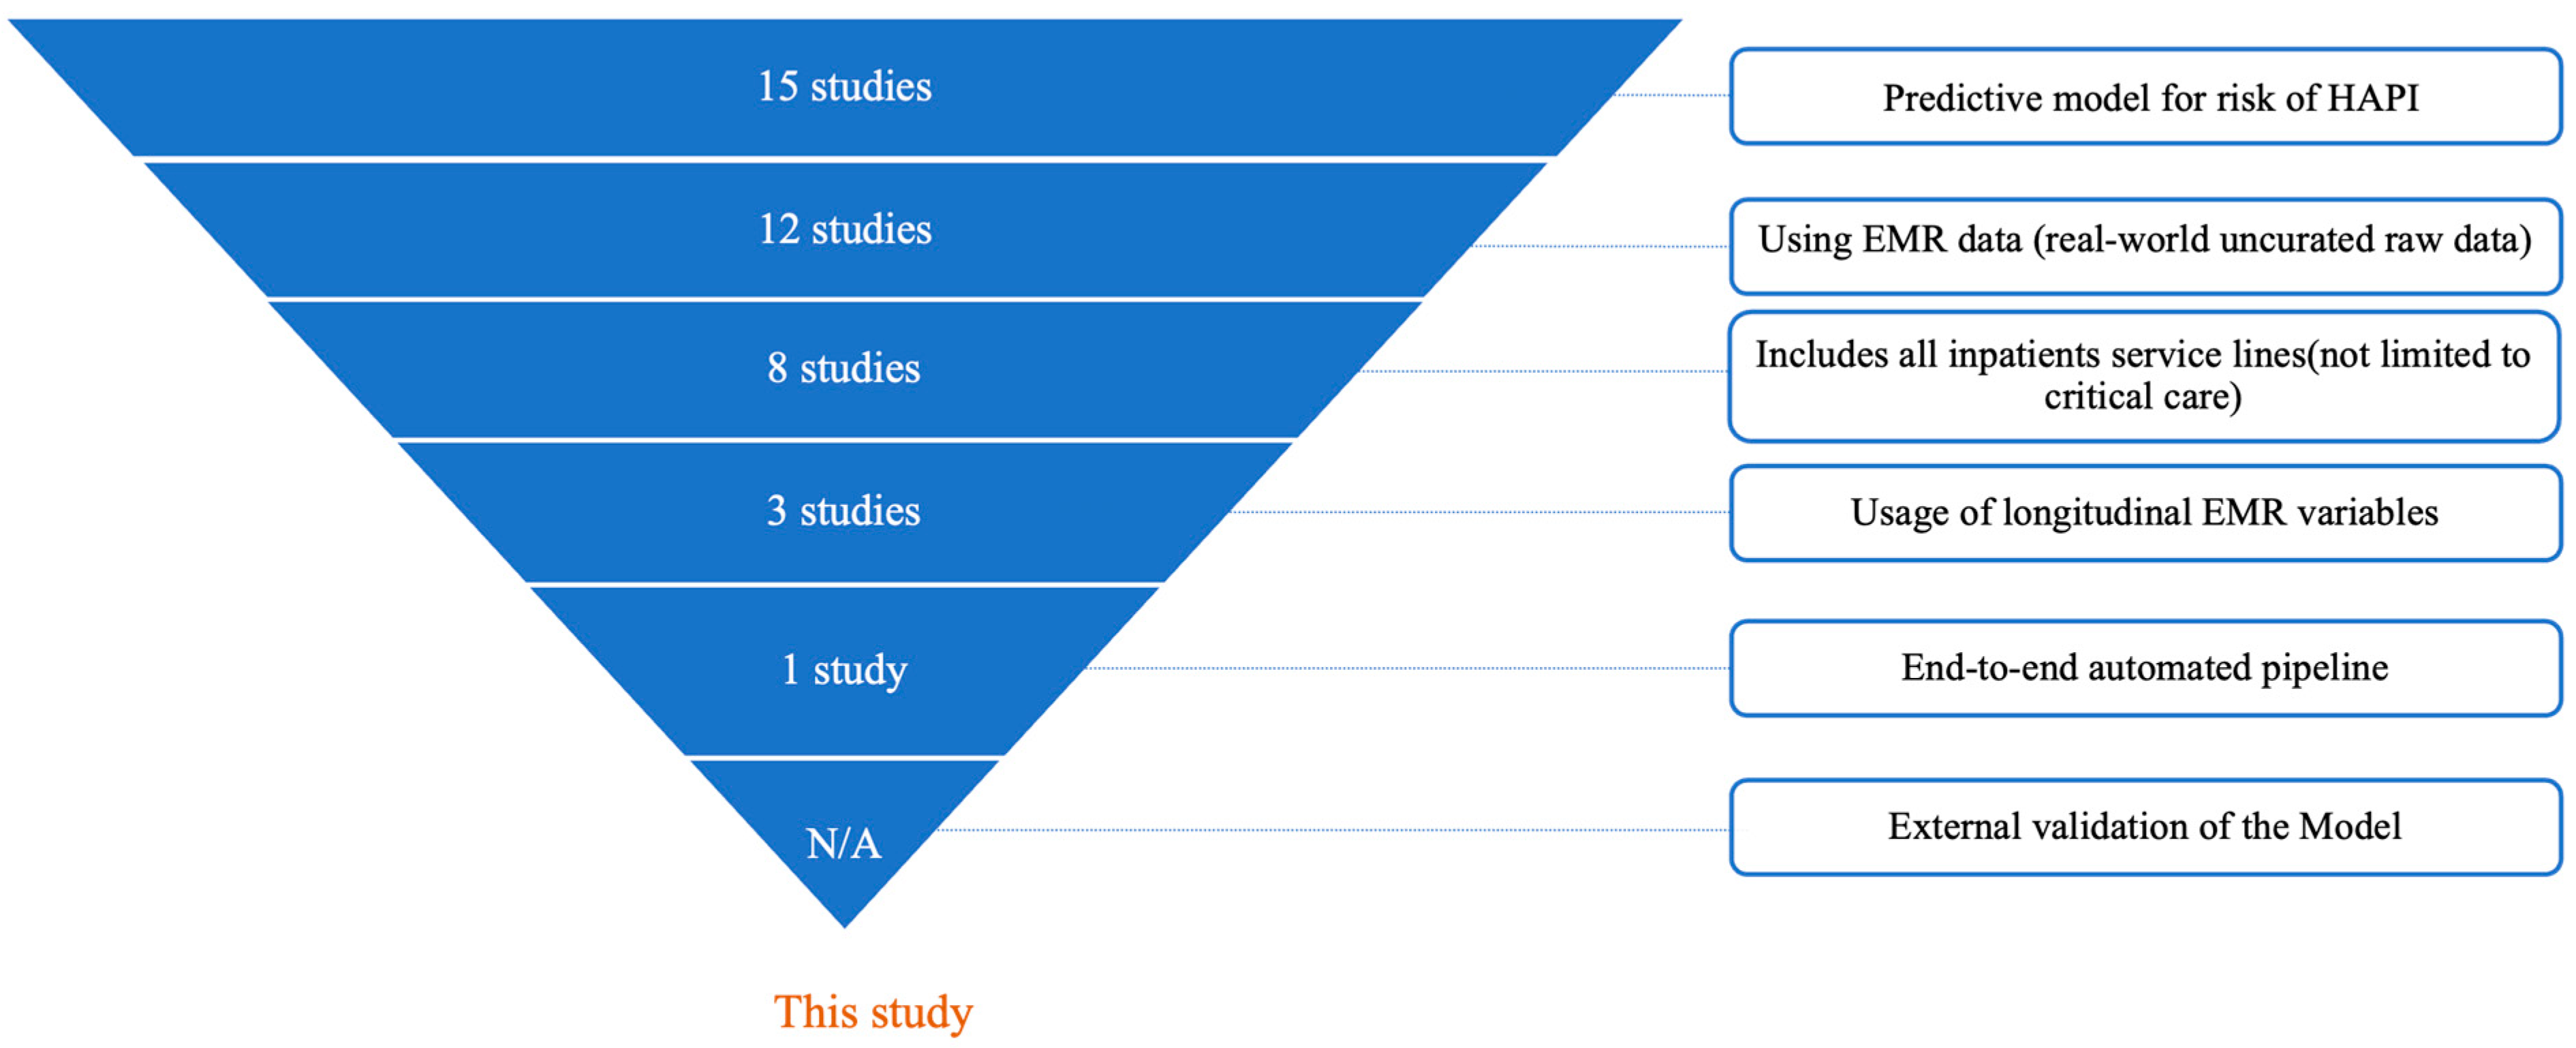
- Development of a predictive model for HAPI risk: This study develops and validates a machine learning model specifically to predict HAPI risk
- -
- Use of raw EMR data: The model directly processes real-world, un-curated EMR data, without pre-standardization or alteration beyond the original clinical observations
- -
- Inclusion of all inpatient service lines: The model predicts HAPI risk across the whole adult inpatient population, without restrictions to specific service lines, conditions, or age brackets (e.g., critical care units only)
- -
- Integration of longitudinal time-series EMR variables: The model incorporates time-series data, i.e., each EMR variable is sampled from different timestamps throughout the patient’s hospitalization, rather than relying solely on static or aggregated observations
- -
- End-to-end automated pipeline: The model is fully integrated into the EMR. It is an end-to-end pipeline that starts with obtaining the real-world EMR data in the raw format, performs transformations (normalization, encoding, null imputation, sampling, and time series), and generates a prediction score
- -
- External multi-hospital validation: The model is externally validated on independent patient cohorts from hospitals not included in the development phase
2. Materials and Methods
2.1. Study Setting, Population, and Data Sources
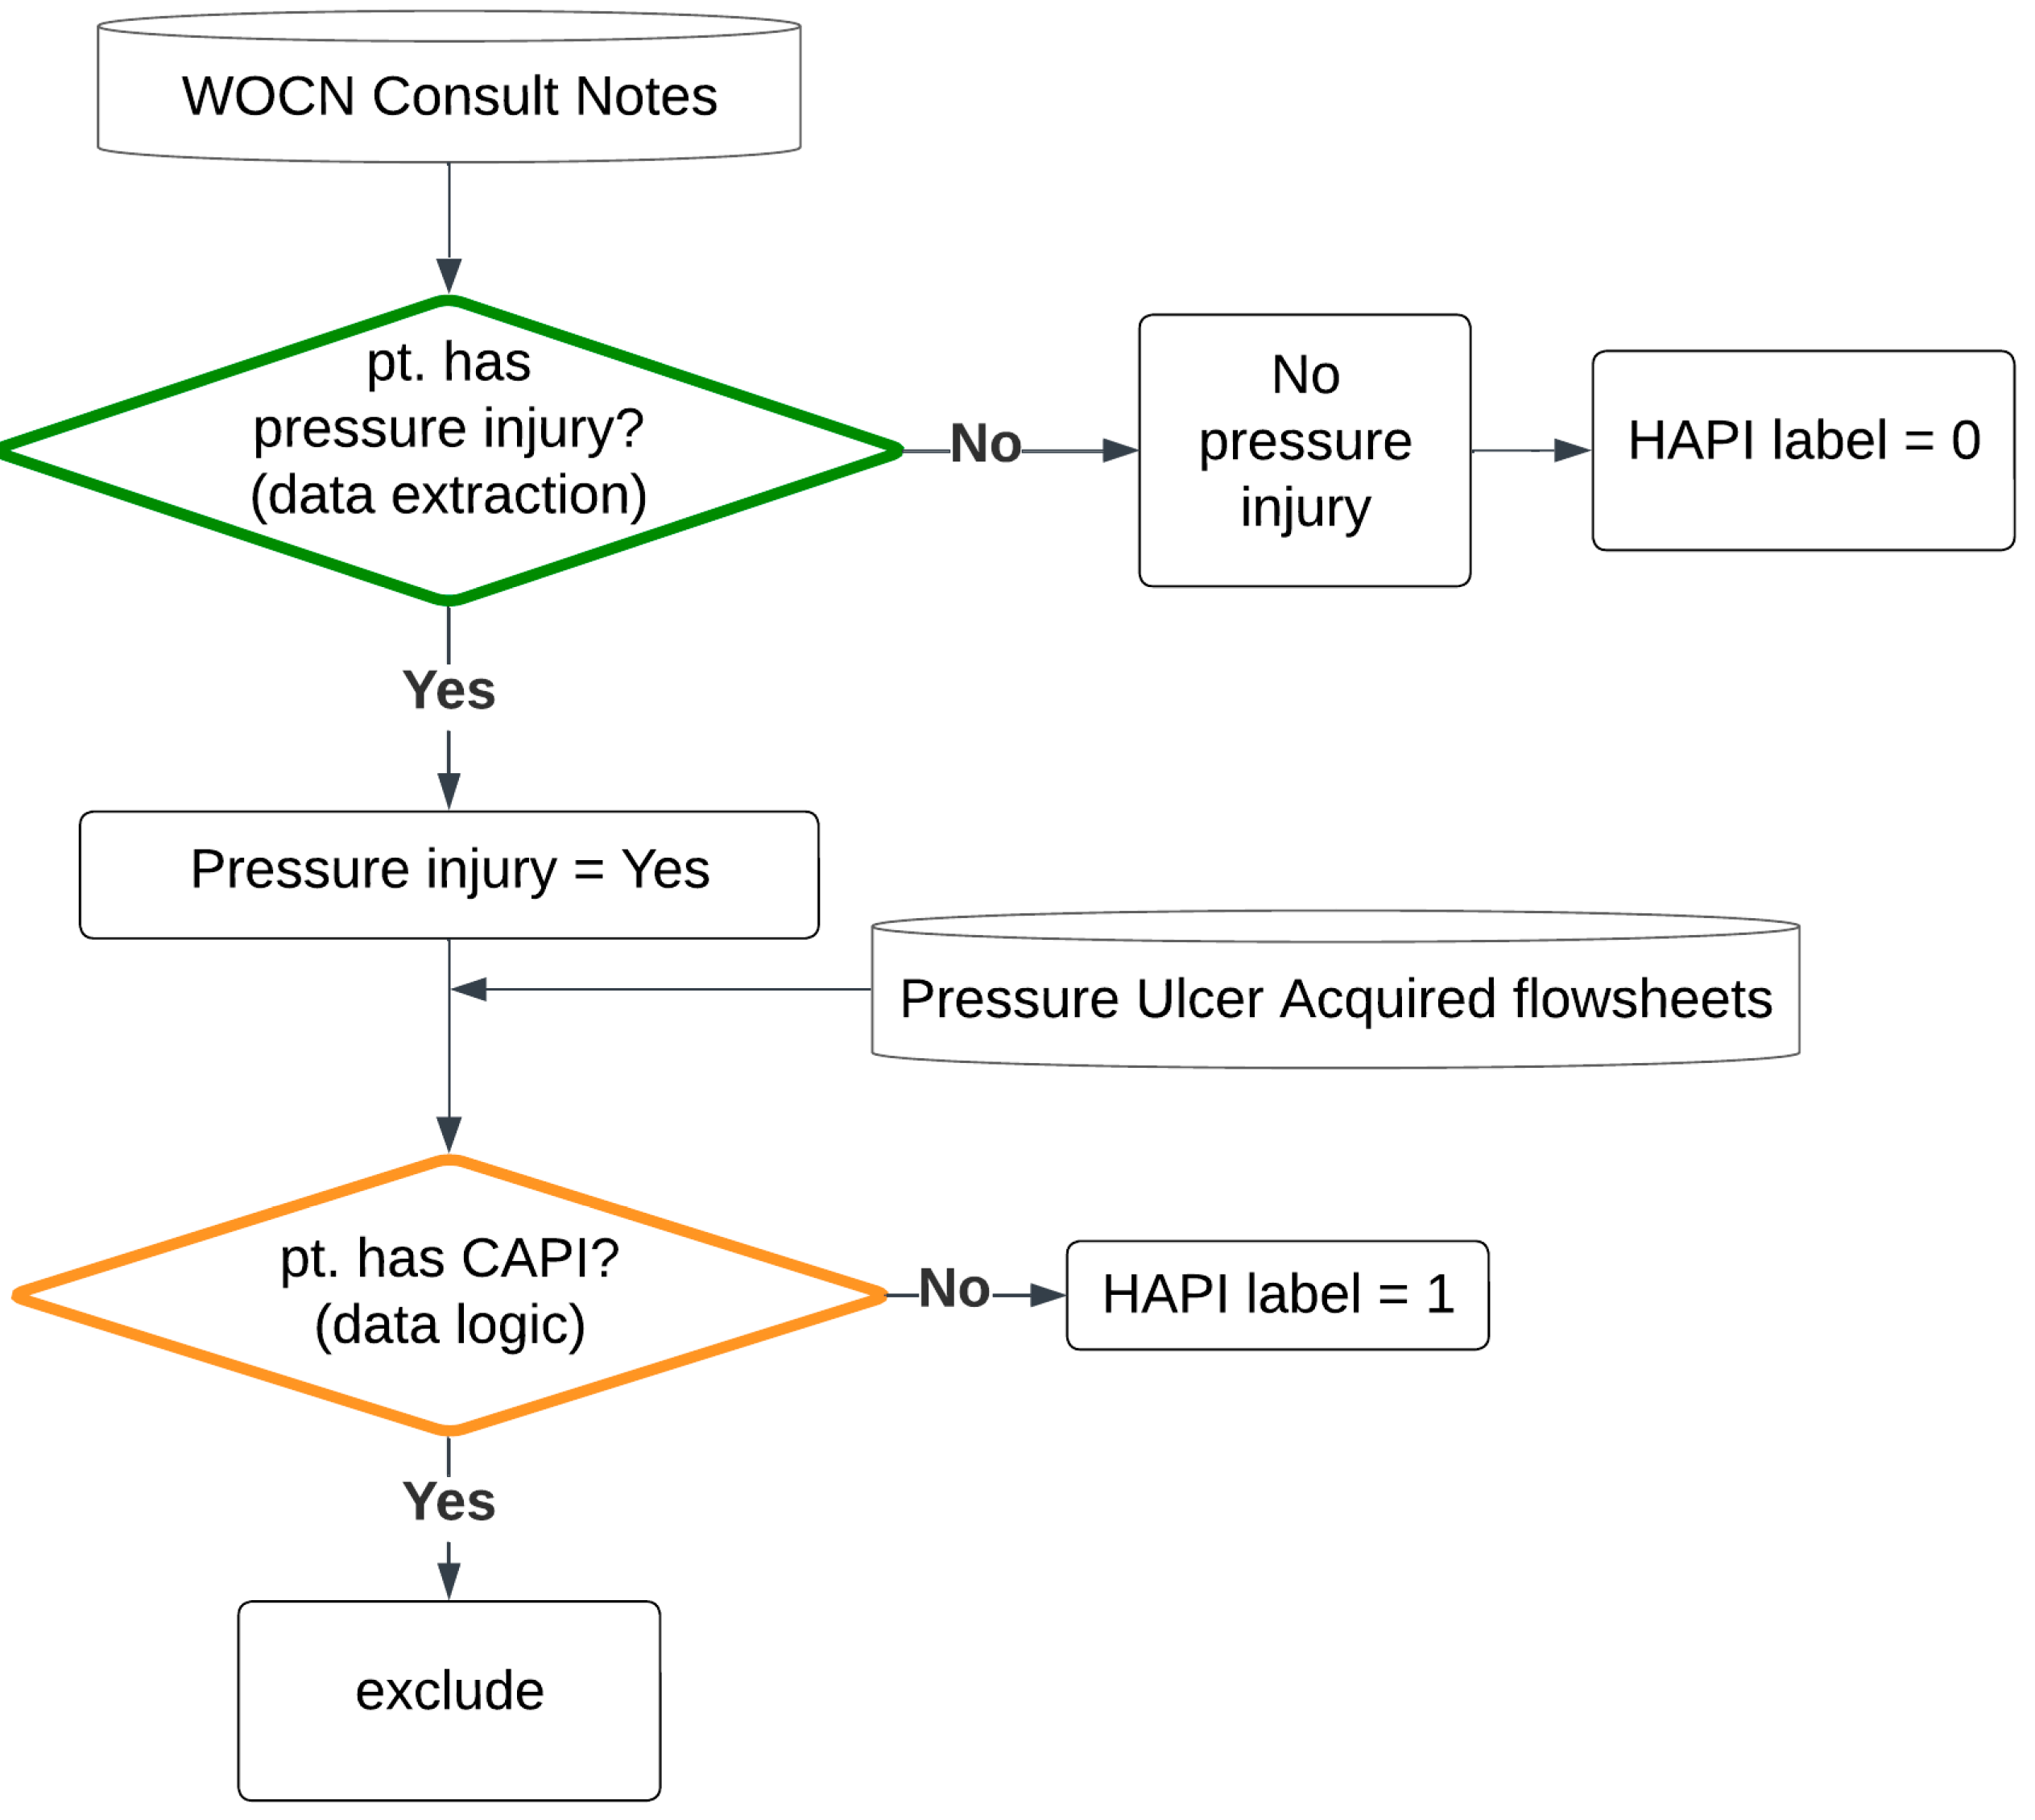
2.2. Labeling Logic
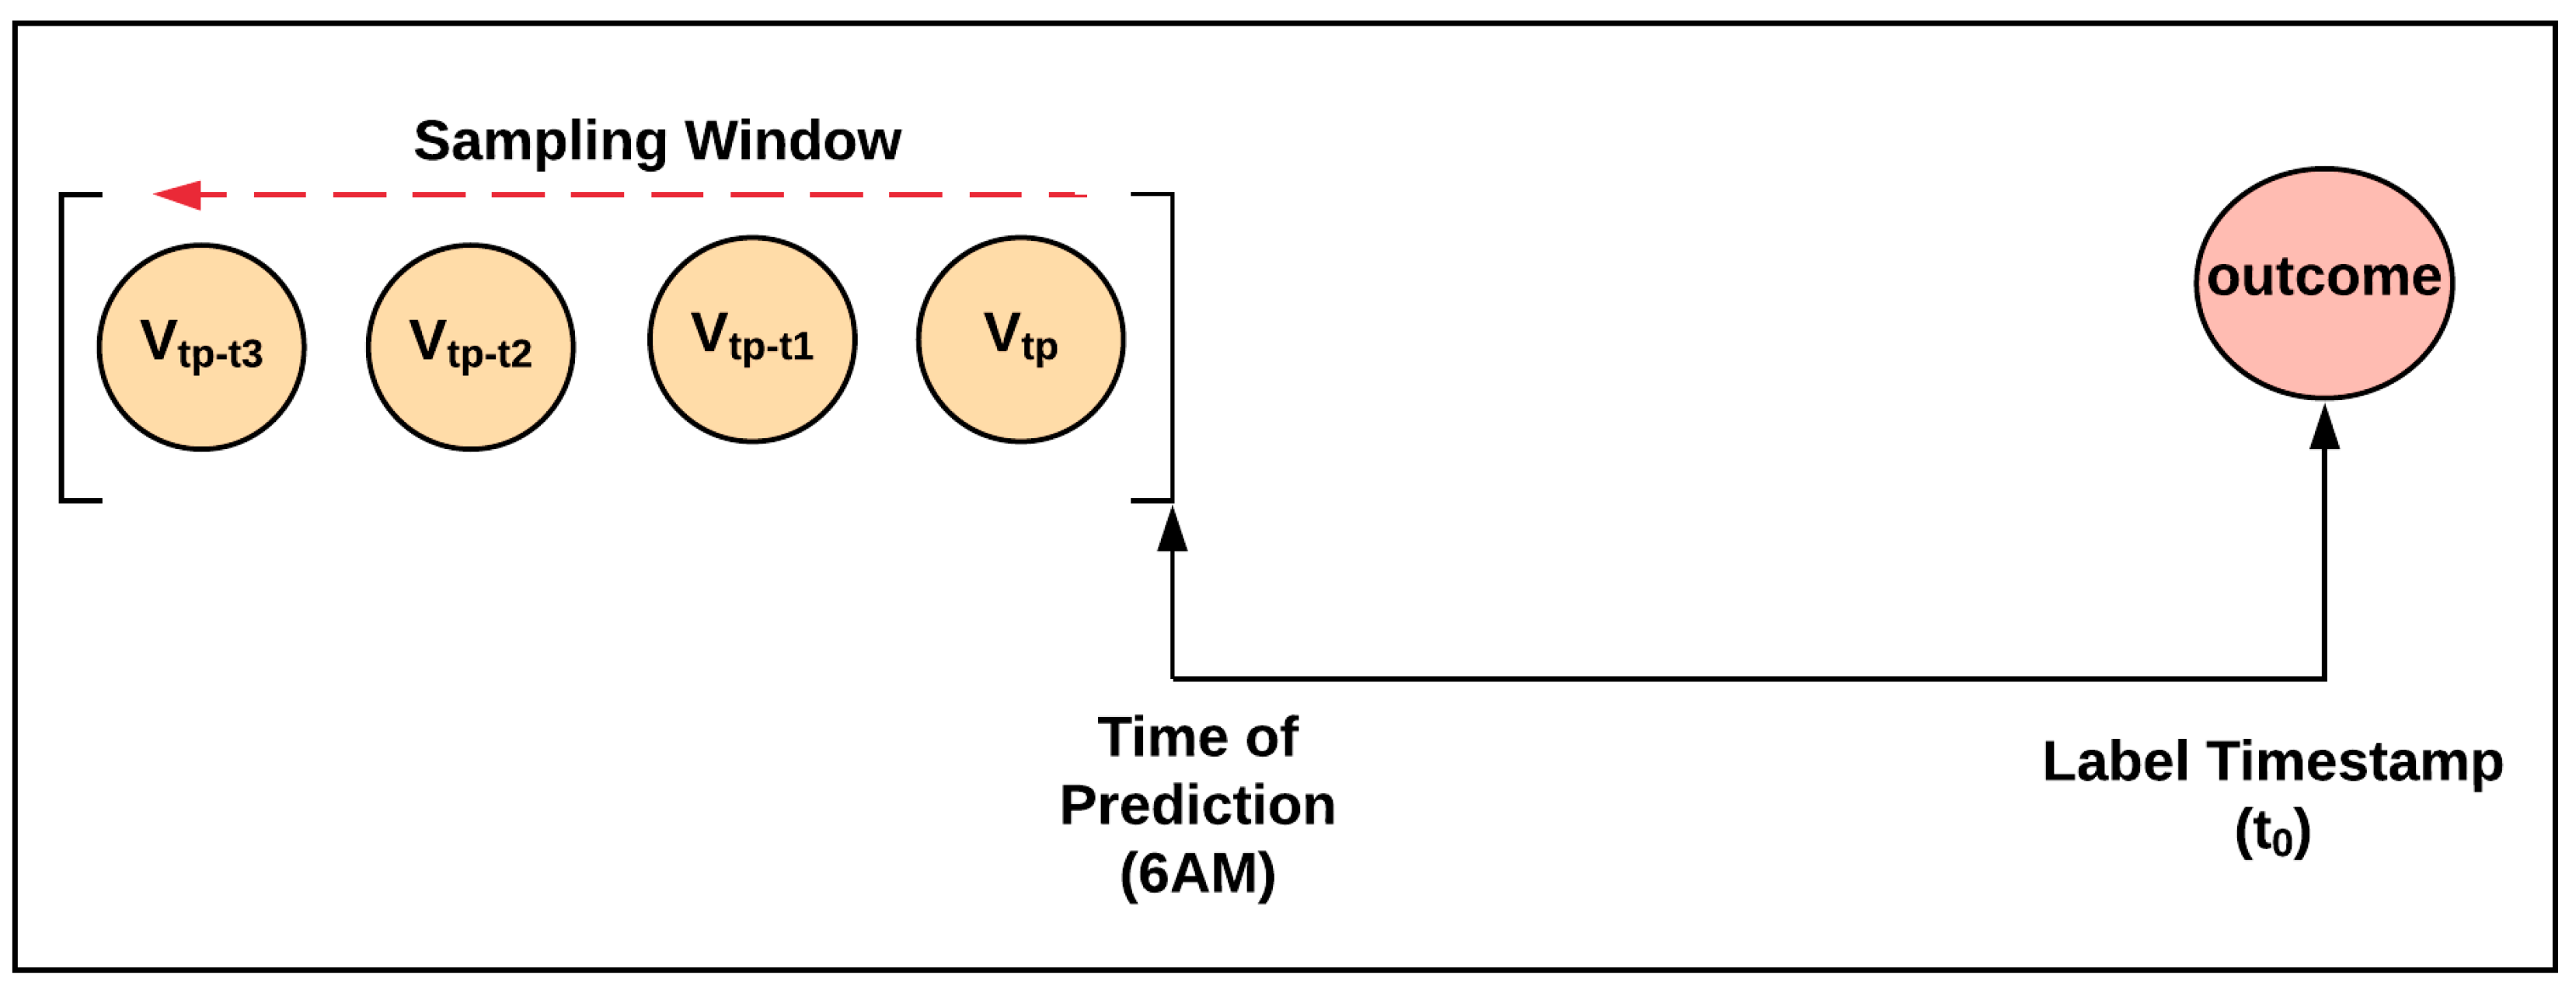
2.3. Label and Clinical Feature Sampling Strategy
- -
- If the HAPI happened within the inpatient hospital length of stay, the label was positive, and the label time stamp was the HAPI timestamp.
- -
- Otherwise, the patient was discharged without a HAPI; therefore, the label was negative, and the label time stamp was the discharge time.
2.4. Clinical Feature Selection
2.5. Internal and External Multi-Center Validation Sets
2.6. Benchmark Model: Braden Scale
2.7. Model Testing and Statistical Methods
3. Results
3.1. Study Population and Outcomes
3.2. Labeling Logic Validation Results
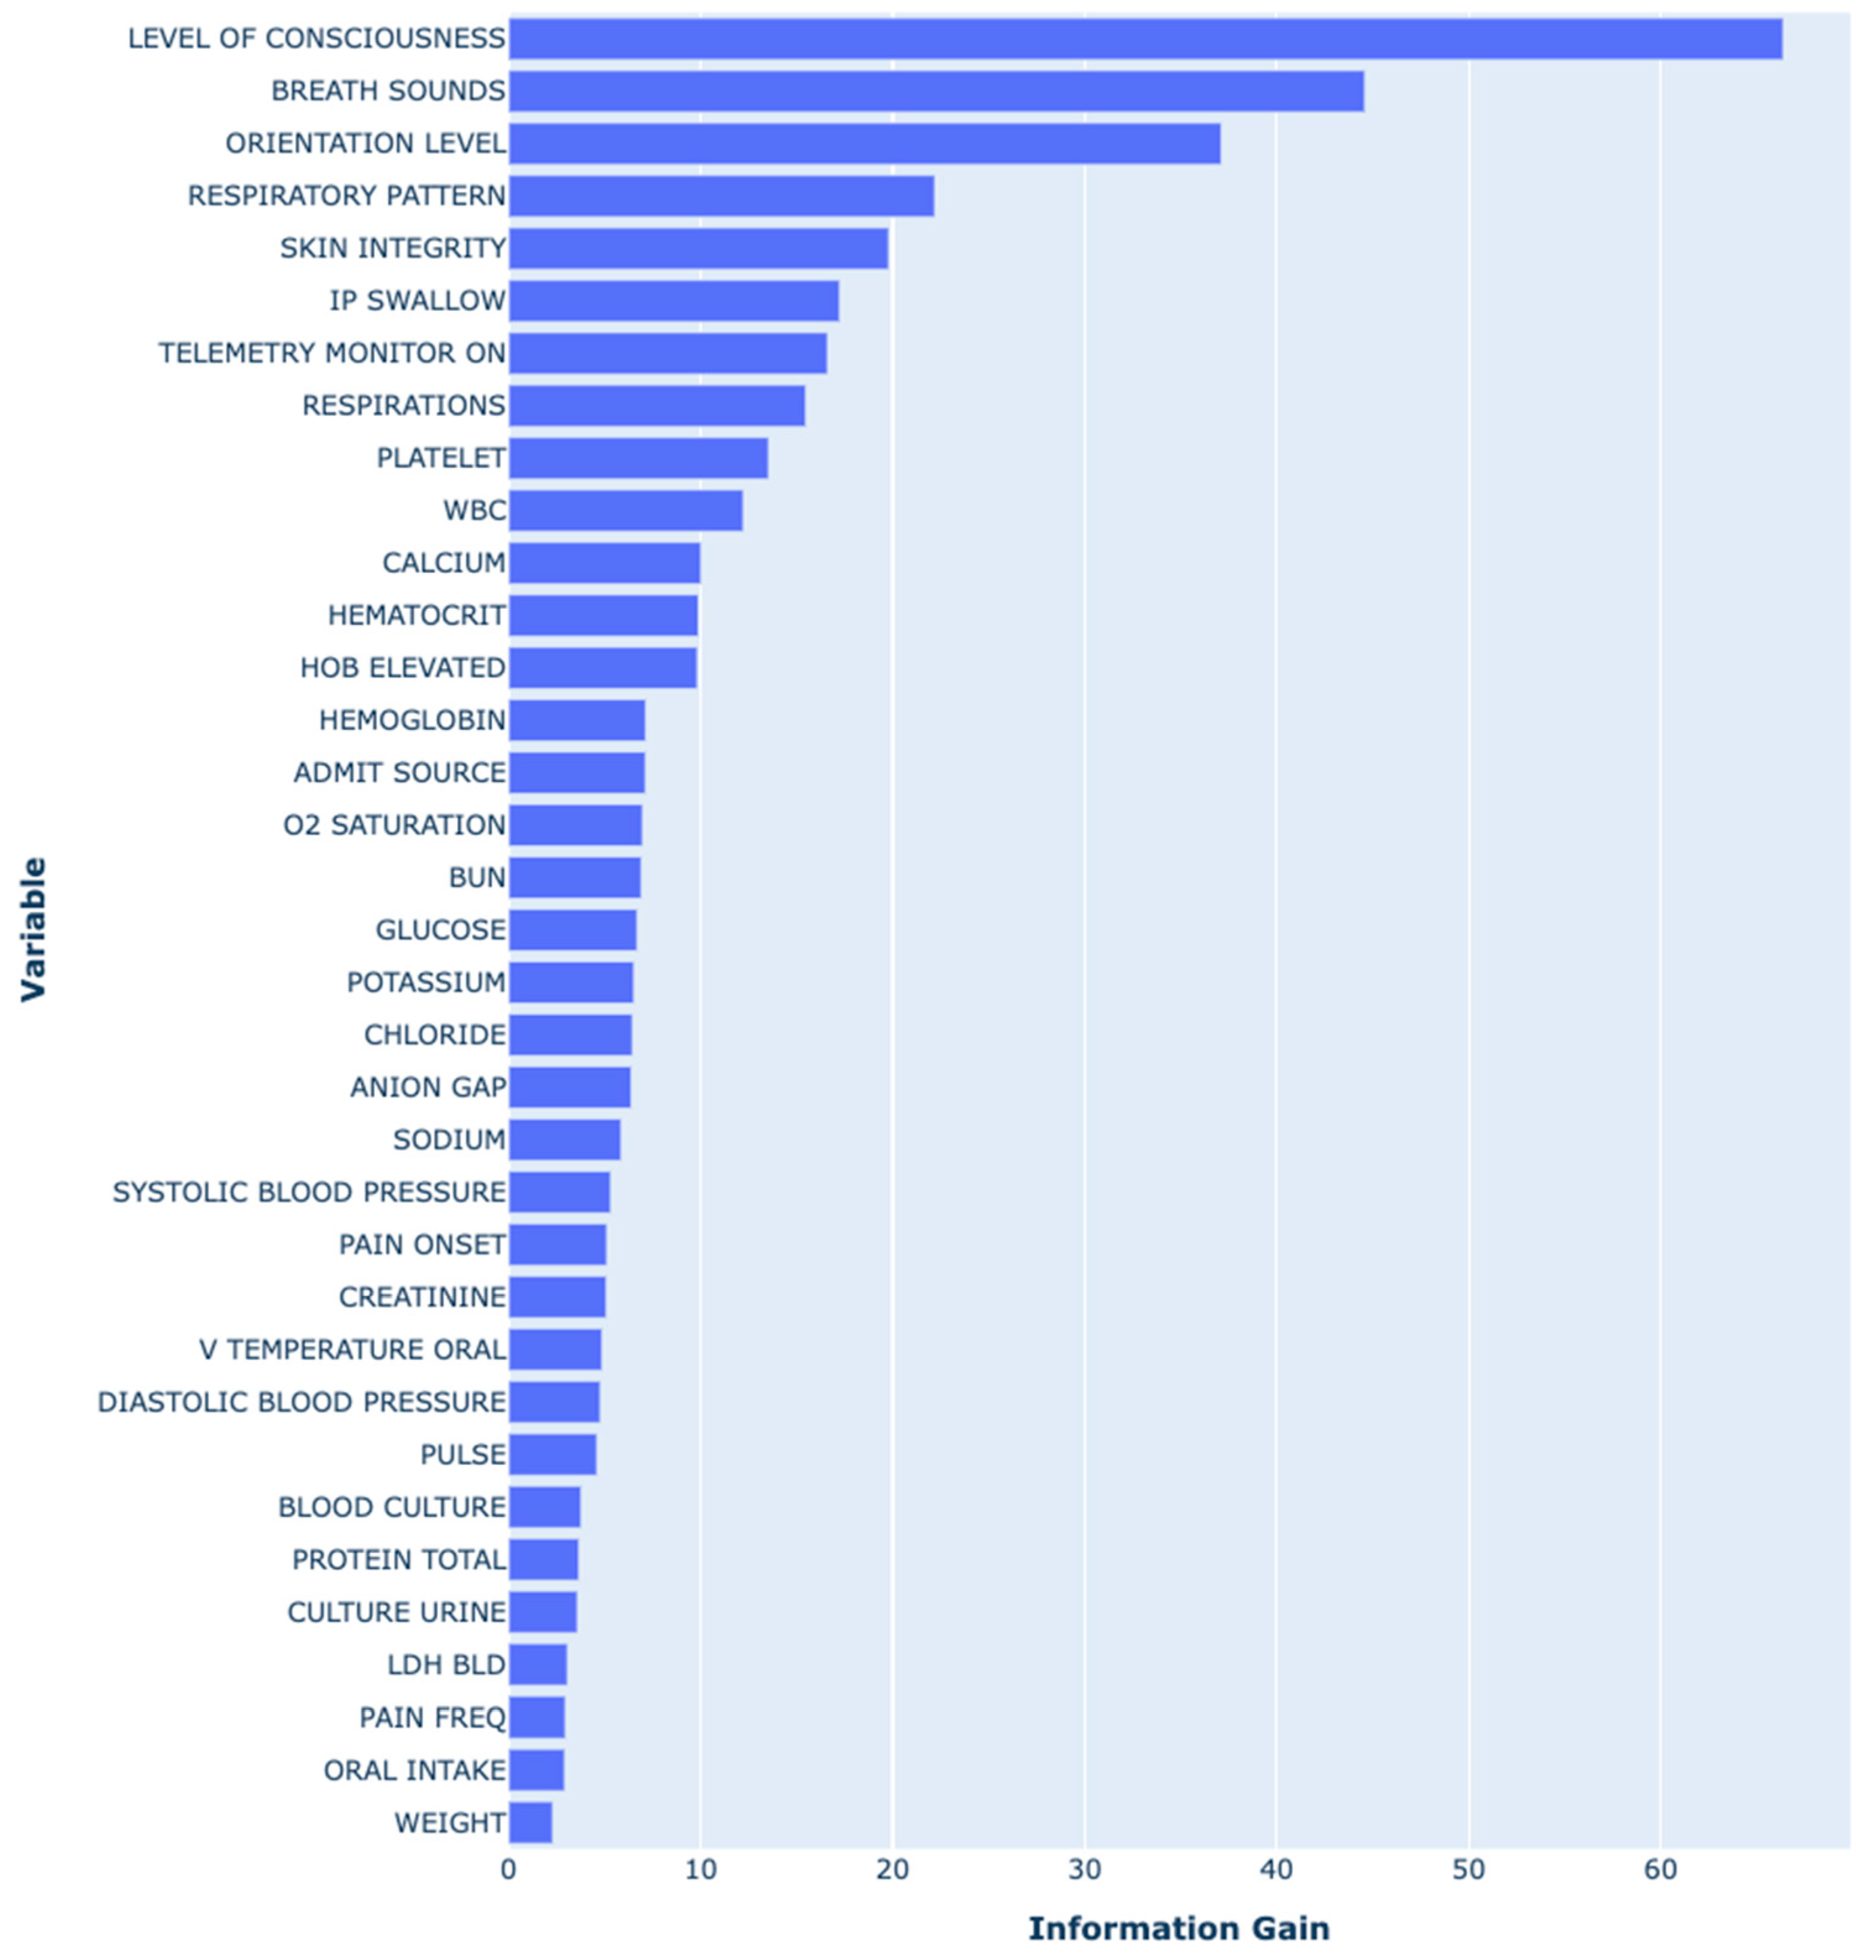
3.3. Predictors in the HAPI Predictive Model
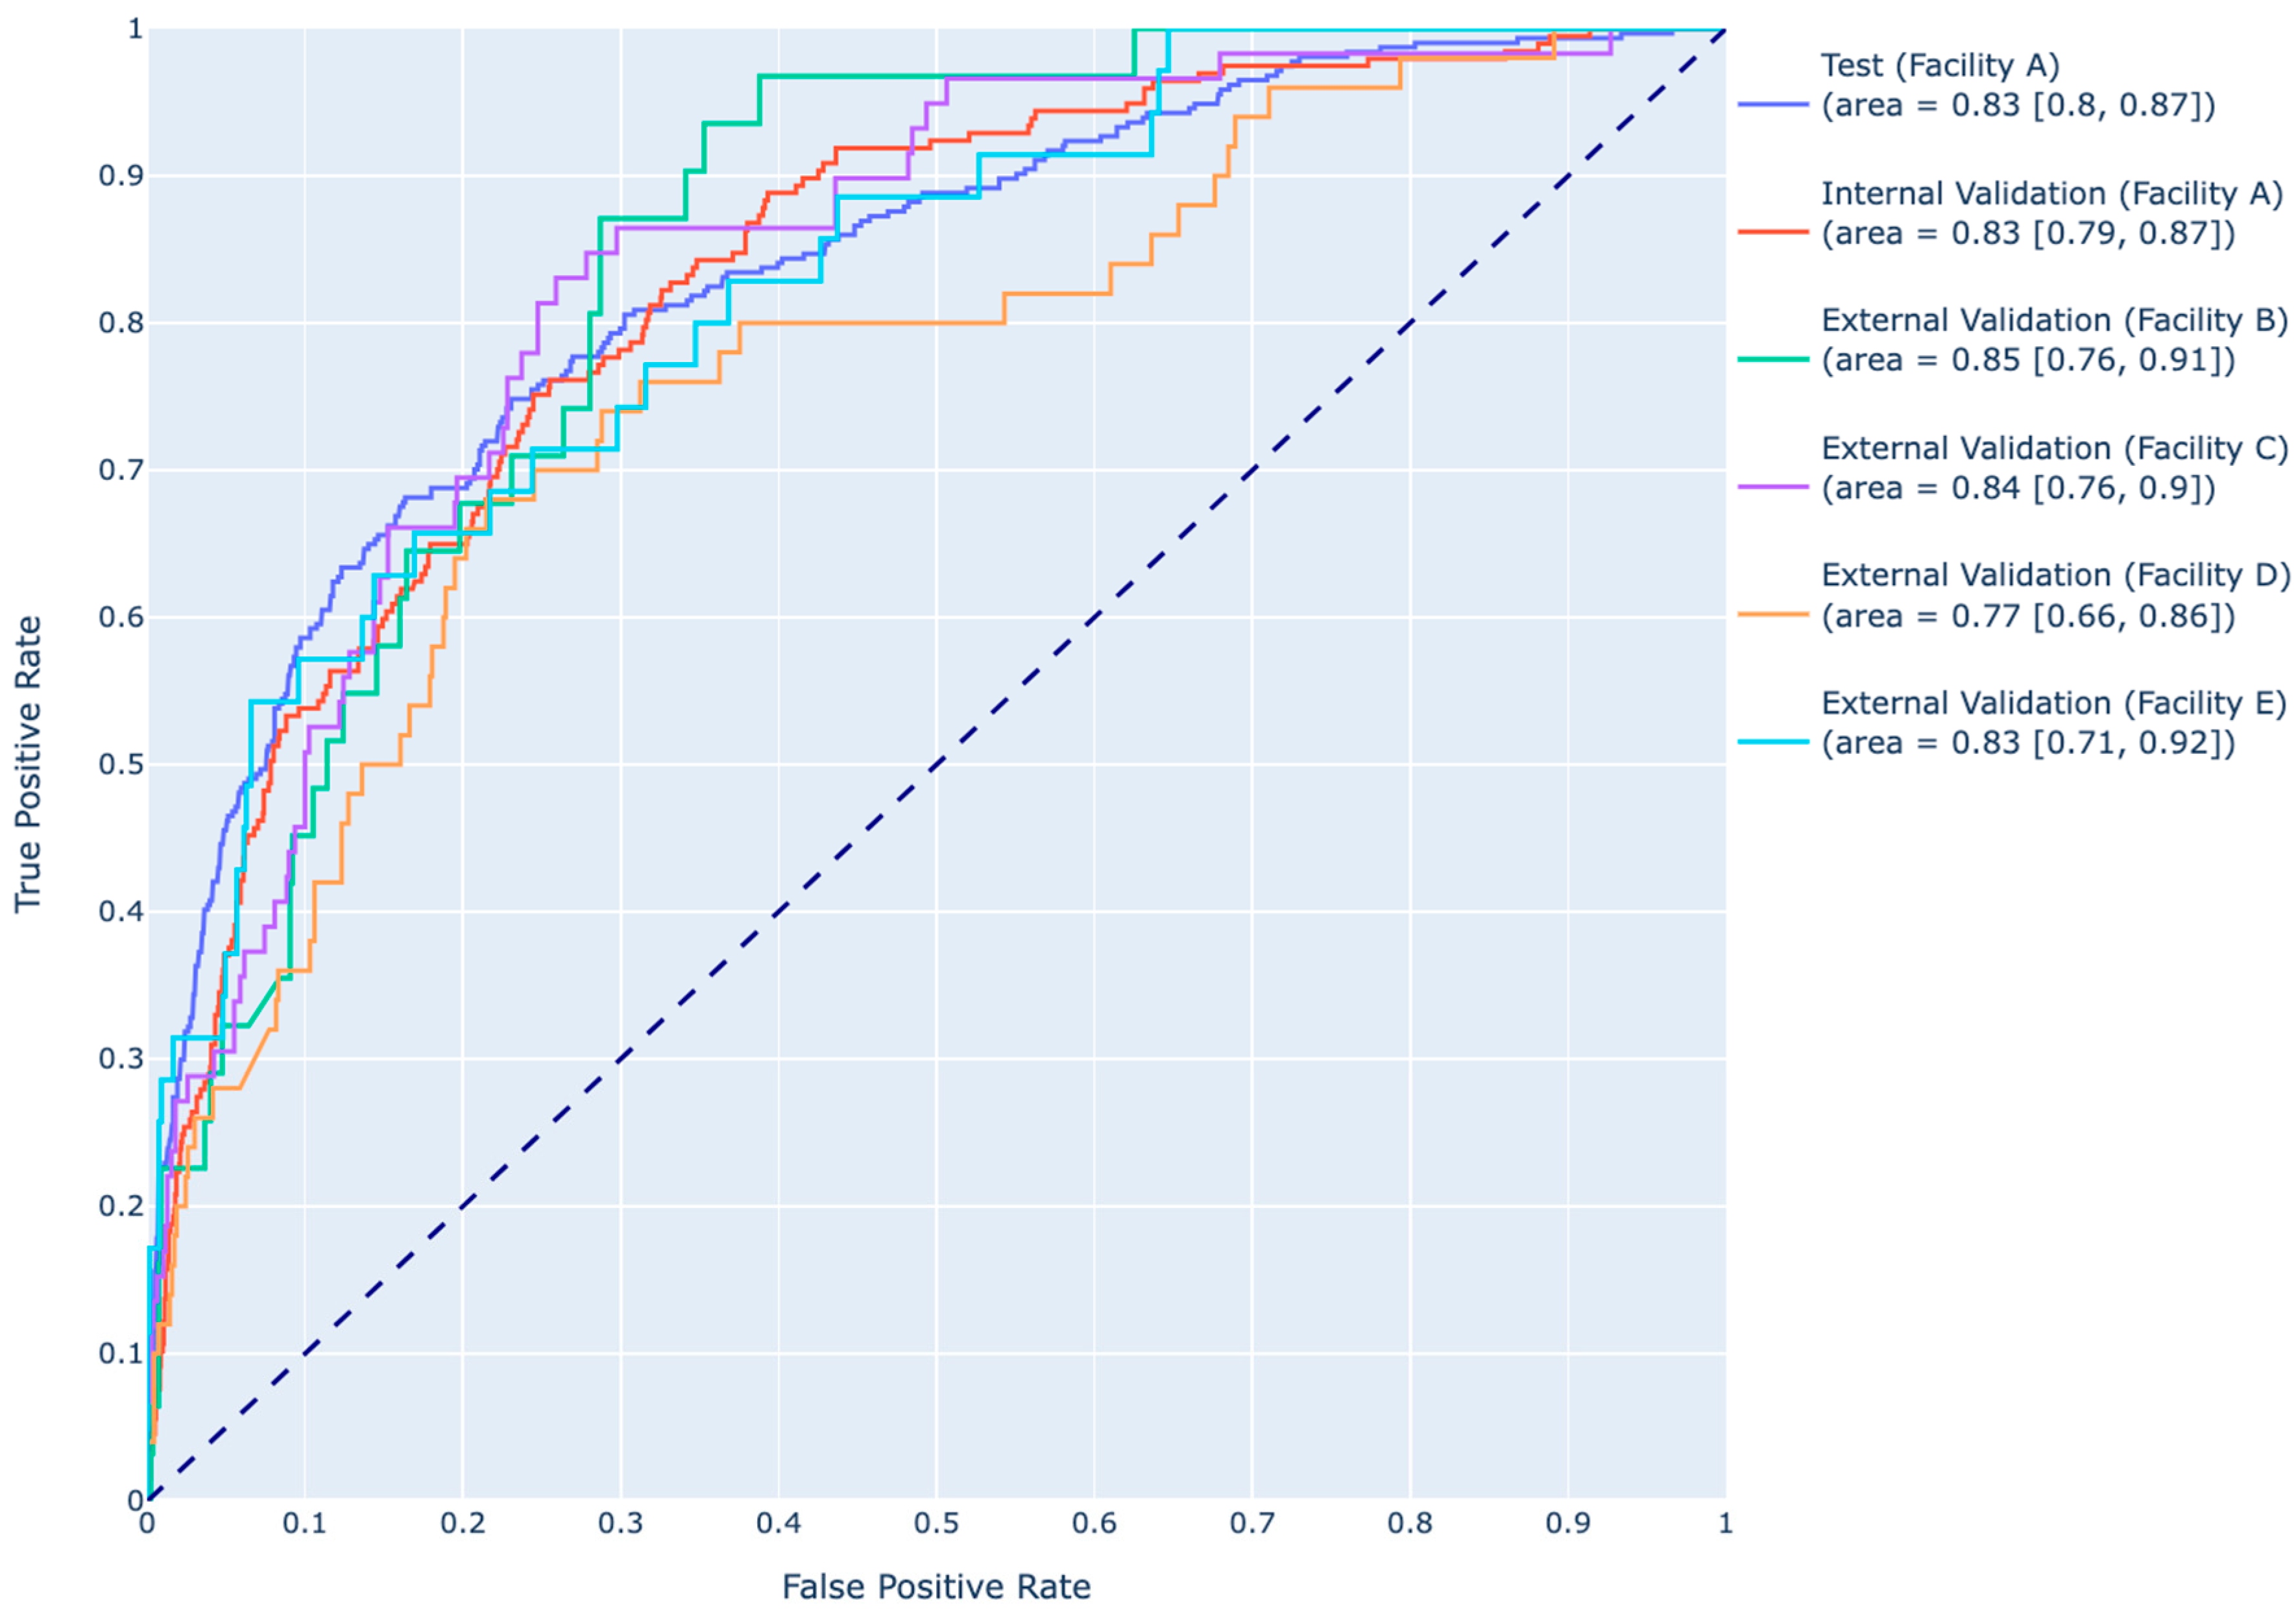
3.4. Predictive Performance of the XGBoost Model
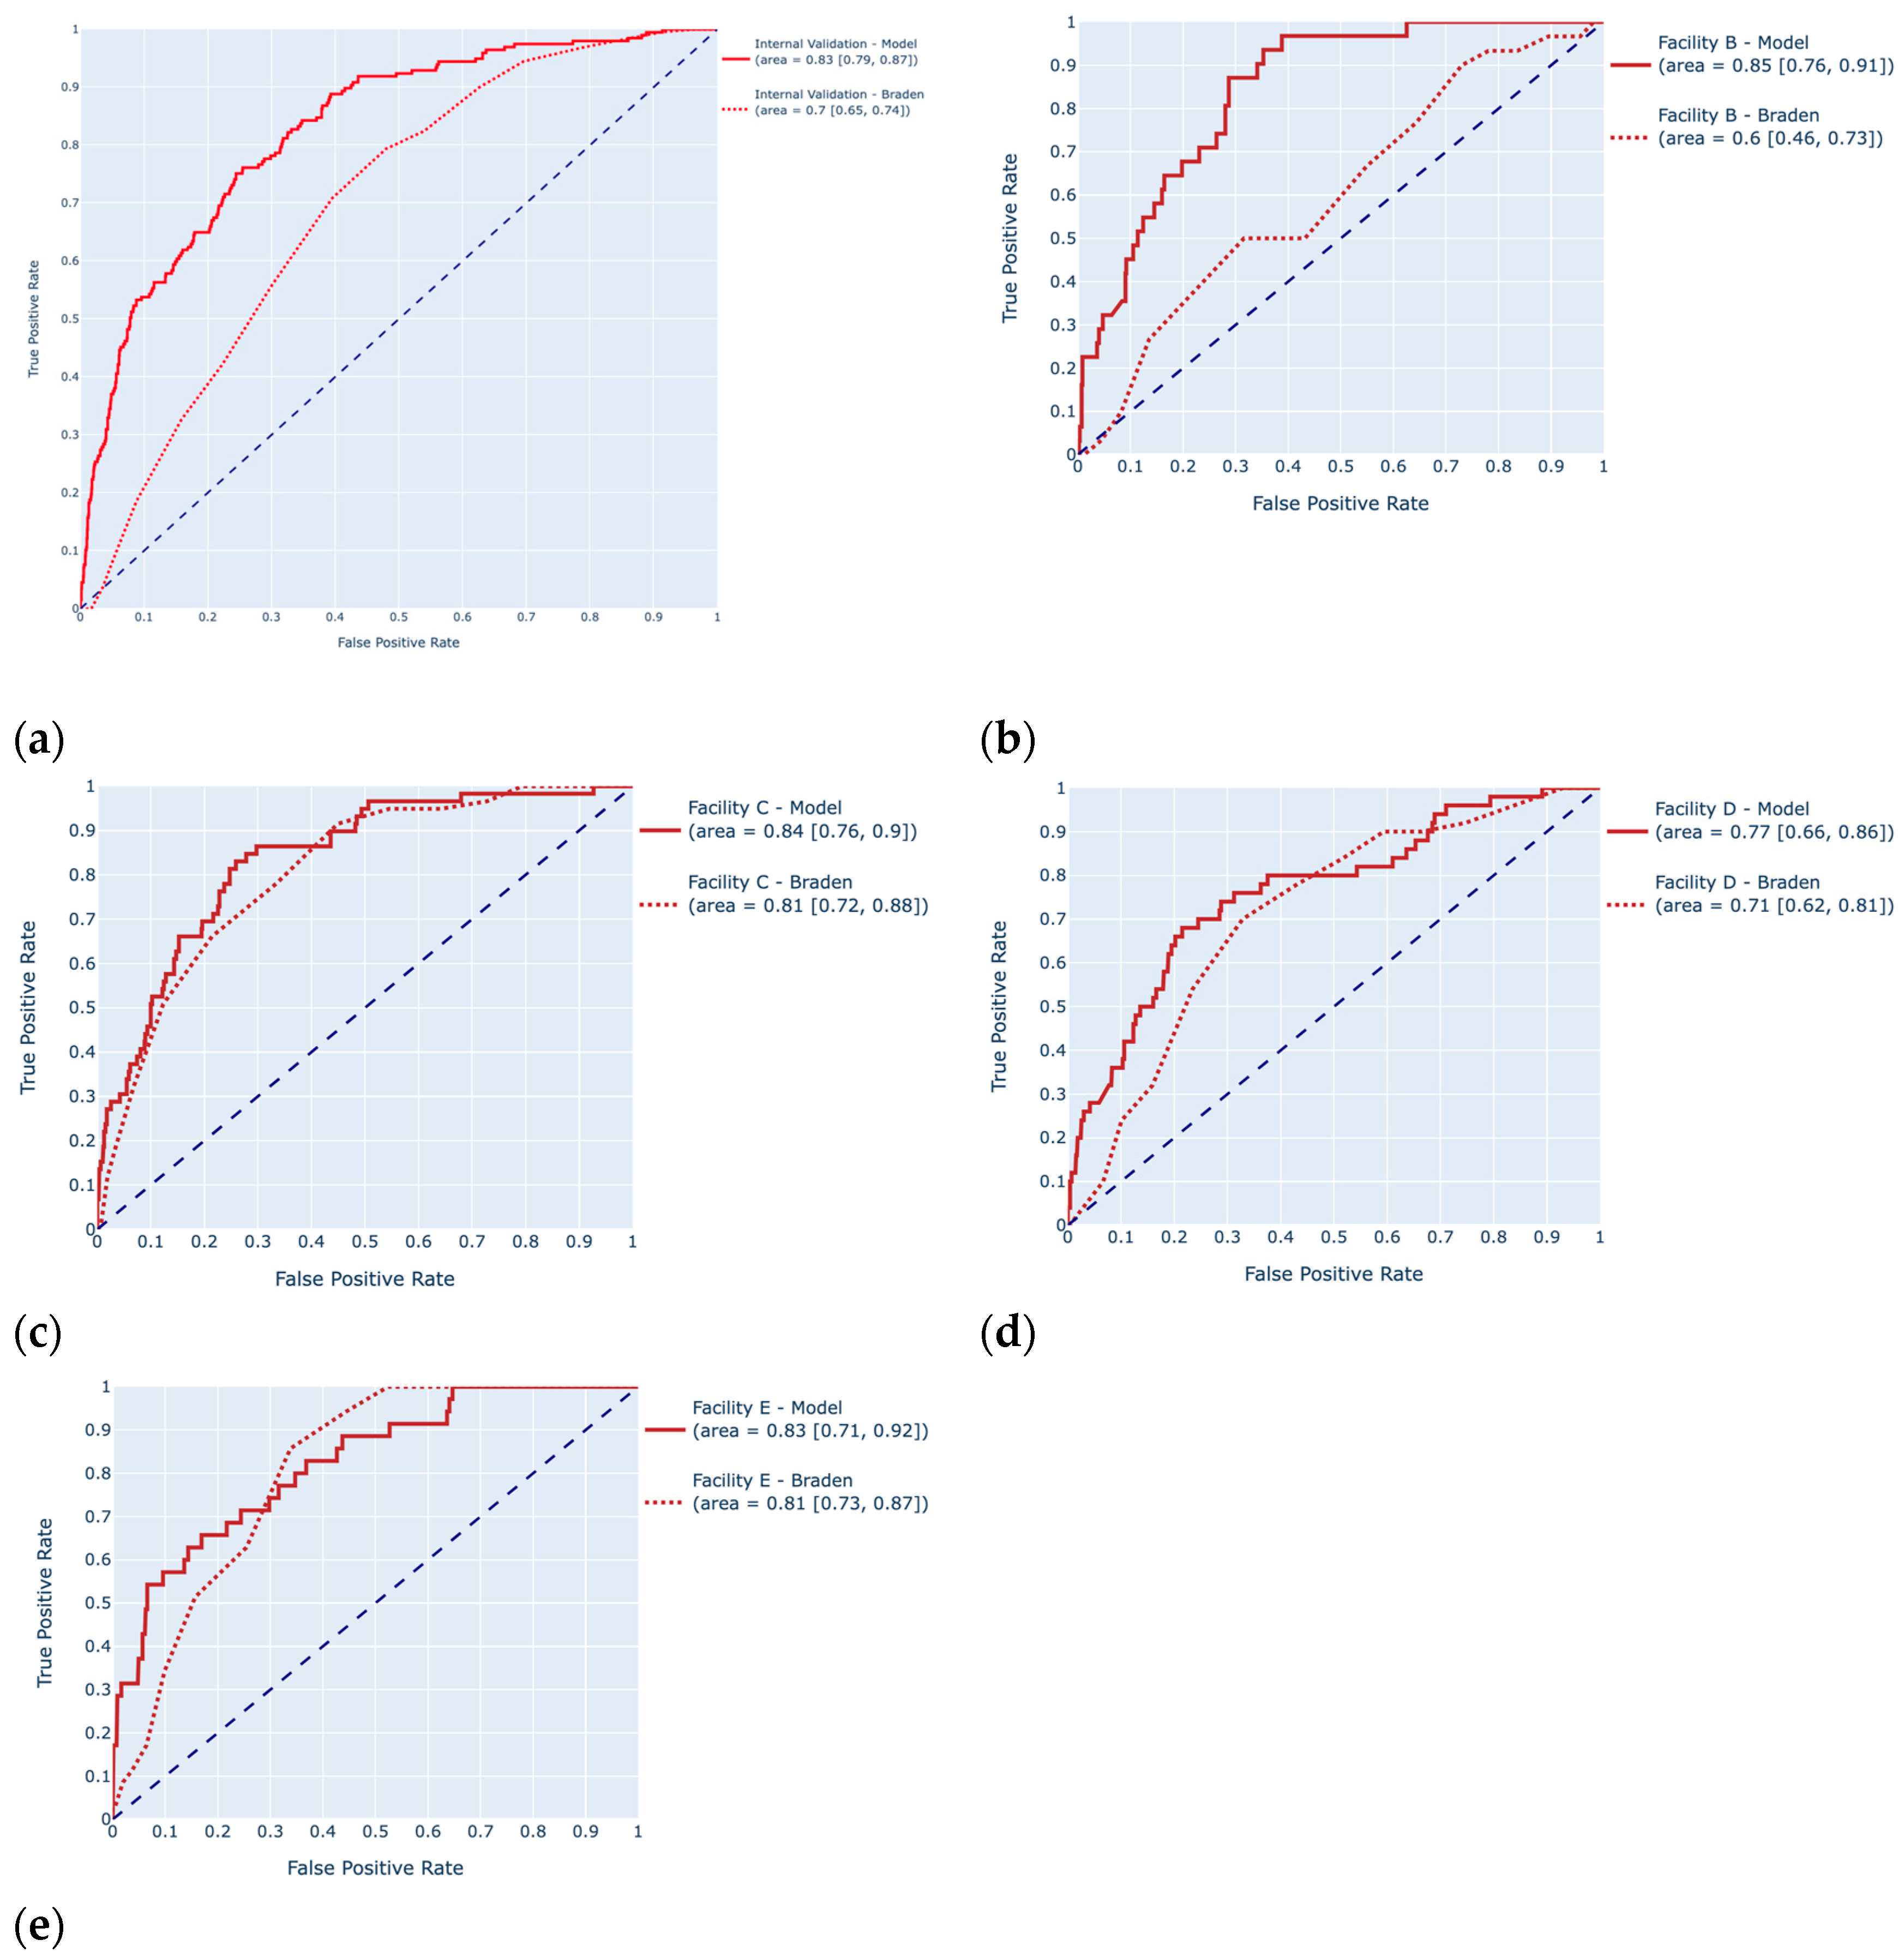
3.5. Comparison of the Predictive Performance of the Model to the Braden Scale Benchmark
4. Discussion
4.1. Labeling Logic and Data Integrity
4.2. Incorporation of Temporal Data and Feature Selection
4.3. Key Predictors and Model Performance
4.4. Practical Implications
4.5. Limitations and Future Directions
5. Conclusions
Author Contributions
Funding
Institutional Review Board Statement
Informed Consent Statement
Data Availability Statement
Conflicts of Interest
Appendix A

| Hyperparameter | Search Space | Optimal Value Used in the Final Model |
|---|---|---|
| eta | [0.005, 0.01, 0.05] | 0.01 |
| gamma | [0.5, 1, 5, 10] | 0.5 |
| max depth | [2, 3, 4, 5] | 3 |
| lambda | [0.5, 1, 5, 10] | 10 |
| alpha | [0.1, 0.05, 1, 5, 10] | 0.1 |
| Full Variable Name | Variable Name | Source of Data | Unit |
|---|---|---|---|
| Admission source | ADMIT SOURCE | Visit | |
| Temperature | V TEMPERATURE ORAL | Vitals Flowsheet | degree Fahrenheit |
| Diastolic blood pressure | DIASTOLIC BLOOD PRESSURE | Vitals Flowsheet | rate per minute |
| Systolic blood pressure | SYSTOLIC BLOOD PRESSURE | Vitals Flowsheet | mmHg |
| Percutaneous oxygen saturation | O2 SATURATION | Vitals Flowsheet | % |
| Pulse | PULSE | Vitals Flowsheet | rate per minute |
| Respiratory rate | RESPIRATIONS | Vitals Flowsheet | rate per minute |
| Weight | WEIGHT | Vitals Flowsheet | lb |
| Anion gap | ANION GAP | Laboratory | mEq/L |
| Blood culture | BLOOD CULTURE | Laboratory | |
| Blood urea nitrogen | BUN | Laboratory | mg/dL |
| Serum calcium | CALCIUM | Laboratory | mg/dL |
| Serum chloride | CHLORIDE | Laboratory | mmol/L |
| Urine culture | CULTURE_URINE | Laboratory | |
| Serum Creatinine | CREATININE | Laboratory | mg/dL |
| Blood glucose | GLUCOSE | Laboratory | mg/dL |
| Hematocrit | HEMATOCRIT | Laboratory | % |
| Hemoglobin | HEMOGLOBIN | Laboratory | g/dL |
| Lactate dehydrogenase | LDH BLD | Laboratory | U/L |
| Platelet count | PLATELET | Laboratory | ×103/μL |
| Serum potassium | POTASSIUM | Laboratory | mEq/L |
| Serum total protein | PROTEIN TOTAL | Laboratory | g/dL |
| Serum sodium | SODIUM | Laboratory | mEq/L |
| WBC count | WBC | Laboratory | ×103/μL |
| Breath sound assessment | BREATH SOUNDS | Nursing Assessment Flowsheet | |
| Head of bed elevation (angle) | HOB ELEVATED | Nursing Assessment Flowsheet | |
| Inpatient swallow screening | IP SWALLOW | Nursing Assessment Flowsheet | |
| Level of consciousness screening | LEVEL OF CONSCIOUSNESS | Nursing Assessment Flowsheet | |
| Oral intake | ORAL INTAKE | Nursing Assessment Flowsheet | |
| Orientation assessment | ORIENTATION LEVEL | Nursing Assessment Flowsheet | |
| Pain frequency assessment | PAIN FREQ | Nursing Assessment Flowsheet | |
| Pain onset | PAIN ONSET | Nursing Assessment Flowsheet | |
| Respiratory pattern assessment | RESPIRATORY PATTERN | Nursing Assessment Flowsheet | |
| Skin integrity assessment | SKIN INTEGRITY | Nursing Assessment Flowsheet | |
| Is the telemetry monitor on? | TELEMETRY MONITOR ON | Nursing Assessment Flowsheet |
References
- Wang, I.; Walker, R.M.; Gillespie, B.M.; Scott, I.; Sugathapala, R.D.U.P.; Chaboyer, W. Risk factors predicting hospital-acquired pressure injury in adult patients: An overview of reviews. Int. J. Nurs. Stud. 2024, 150, 104642. [Google Scholar] [CrossRef] [PubMed]
- Alderden, J.; Pepper, G.A.; Wilson, A.; Whitney, J.D.; Richardson, S.; Butcher, R.; Jo, Y.; Cummins, M.R. Predicting Pressure Injury in Critical Care Patients: A Machine-Learning Model. Am. J. Crit. Care. 2018, 27, 461–468. [Google Scholar] [CrossRef]
- Song, W.; Kang, M.-J.; Zhang, L.; Jung, W.; Song, J.; Bates, D.W.; Dykes, P.C. Predicting pressure injury using nursing assessment phenotypes and machine learning methods. J. Am. Med. Inform. Assoc. 2021, 28, 759–765. [Google Scholar] [CrossRef] [PubMed]
- Anderson, C.; Bekele, Z.; Qiu, Y.; Tschannen, D.; Dinov, I.D. Modeling and prediction of pressure injury in hospitalized patients using artificial intelligence. BMC Med. Inf. Decis. Mak. 2021, 21, 253. [Google Scholar] [CrossRef]
- Nakagami, G.; Yokota, S.; Kitamura, A.; Takahashi, T.; Morita, K.; Noguchi, H.; Ohe, K.; Sanada, H. Supervised machine learning-based prediction for in-hospital pressure injury development using electronic health records: A retrospective observational cohort study in a university hospital in Japan. Int. J. Nurs. Stud. 2021, 119, 103932. [Google Scholar] [CrossRef] [PubMed]
- Song, J.; Gao, Y.; Yin, P.; Li, Y.; Li, Y.; Zhang, J.; Su, Q.; Fu, X.; Pi, H. The Random Forest Model Has the Best Accuracy Among the Four Pressure Ulcer Prediction Models Using Machine Learning Algorithms. Risk Manag. Health Policy 2021, 14, 1175–1187. [Google Scholar] [CrossRef] [PubMed]
- Šín, P.; Hokynková, A.; Marie, N.; Andrea, P.; Krč, R.; Podroužek, J. Machine Learning-Based Pressure Ulcer Prediction in Modular Critical Care Data. Diagnostics 2022, 12, 850. [Google Scholar] [CrossRef] [PubMed]
- Xu, J.; Chen, D.; Deng, X.; Pan, X.; Chen, Y.; Zhuang, X.; Sun, C. Development and validation of a machine learning algorithm–based risk prediction model of pressure injury in the intensive care unit. Int. Wound J. 2022, 19, 1637–1649. [Google Scholar] [CrossRef] [PubMed]
- Dweekat, O.Y.; Lam, S.S.; McGrath, L. A Hybrid System of Braden Scale and Machine Learning to Predict Hospital-Acquired Pressure Injuries (Bedsores): A Retrospective Observational Cohort Study. Diagnostics 2022, 13, 31. [Google Scholar] [CrossRef]
- Luther, S.L.; Thomason, S.S.; Sabharwal, S.; Finch, D.K.; McCart, J.; Toyinbo, P.; Bouayad, L.; Lapcevic, W.; Hahm, B.; Hauser, R.G.; et al. Machine learning to develop a predictive model of pressure injury in persons with spinal cord injury. Spinal Cord. 2023, 61, 513–520. [Google Scholar] [CrossRef]
- Pouzols, S.; Despraz, J.; Mabire, C.; Raisaro, J.L. Development of a Predictive Model for Hospital-Acquired Pressure Injuries. CIN Comput. Inform. Nurs. 2023, 41, 884–891. [Google Scholar] [CrossRef] [PubMed]
- Dweekat, O.Y.; Lam, S.S.; McGrath, L. An Integrated System of Multifaceted Machine Learning Models to Predict If and When Hospital-Acquired Pressure Injuries (Bedsores) Occur. Int. J. Environ. Res. Public Health 2023, 20, 828. [Google Scholar] [CrossRef] [PubMed]
- Padula, W.V.; Armstrong, D.G.; Pronovost, P.J.; Saria, S. Predicting pressure injury risk in hospitalised patients using machine learning with electronic health records: A US multilevel cohort study. BMJ Open 2024, 14, e082540. [Google Scholar] [CrossRef]
- Alderden, J.; Johnny, J.; Brooks, K.R.; Wilson, A.; Yap, T.L.; Zhao, Y.; van der Laan, M.; Kennerly, S. Explainable Artificial Intelligence for Early Prediction of Pressure Injury Risk. Am. J. Crit. Care 2024, 33, 373–381. [Google Scholar] [CrossRef]
- Xu, J.; Chen, T.; Fang, X.; Xia, L.; Pan, X. Prediction model of pressure injury occurrence in diabetic patients during ICU hospitalization—XGBoost machine learning model can be interpreted based on SHAP. Intensive Crit. Care Nurs. 2024, 83, 103715. [Google Scholar] [CrossRef] [PubMed]
- Abi Khalil, C.; Saab, A.; Rahme, J.; Abla, J.; Seroussi, B. Evaluation of Machine Learning Algorithms for Pressure Injury Risk Assessment in a Hospital with Limited IT Resources. In Digital Health and Informatics Innovations for Sustainable Health Care Systems; IOS Press: Amsterdam, The Netherlands, 2024. [Google Scholar]
- Collins, G.S.; Reitsma, J.B.; Altman, D.G.; Moons, K.G. Transparent Reporting of a multivariable prediction model for Individual Prognosis Or Diagnosis (TRIPOD): The TRIPOD Statement. Ann. Intern. Med. 2015, 162, 55–63. [Google Scholar] [CrossRef]
- Timsina, P.; Joshi, H.N.; Cheng, F.-Y.; Kersch, I.; Wilson, S.; Colgan, C.; Freeman, R.; Reich, D.L.; Mechanick, J.; Mazumdar, M.; et al. MUST-Plus: A Machine Learning Classifier That Improves Malnutrition Screening in Acute Care Facilities. J. Am. Coll. Nutr. 2021, 40, 3–12. [Google Scholar] [CrossRef]
- Batista, G.E.A.P.A.; Monard, M.C. An analysis of four missing data treatment methods for supervised learning. Appl. Artif. Intell. 2003, 17, 519–533. [Google Scholar] [CrossRef]
- Japkowicz, N. The class imbalance problem: Significance and strategies. In Proceedings of the International Conference on Artificial Intelligence, Las Vegas, NV, USA, 26–29 June 2000; Volume 56, pp. 111–117. [Google Scholar]
- Chen, T.; Guestrin, C. XGBoost. In Proceedings of the 22nd ACM SIGKDD International Conference on Knowledge Discovery and Data Mining, New York, NY, USA, 13–17 August 2016; pp. 785–794. [Google Scholar]
- MLlib: Main Guide—Spark 3.1.3 Documentation. 2022. Available online: https://archive.apache.org/dist/spark/docs/3.1.3/ml-guide.html (accessed on 17 June 2022).
- Guyon, I.; Weston, J.; Barnhill, S.; Vapnik, V. Gene selection for cancer classification using support vector machines. Mach. Learn. 2002, 46, 389–422. [Google Scholar] [CrossRef]
- Bergstrom, N.; Demuth, P.J.; Braden, B.J. A Clinical Trial of the Braden Scale for Predicting Pressure Sore Risk. Nurs. Clin. N. Am. 1987, 22, 417–428. [Google Scholar] [CrossRef]
- Hu, Y.-H.; Lee, Y.-L.; Kang, M.-F.; Lee, P.-J. Constructing Inpatient Pressure Injury Prediction Models Using Machine Learning Techniques. CIN Comput. Inform. Nurs. 2020, 38, 415–423. [Google Scholar] [CrossRef]
- Jiang, M.; Ma, Y.; Guo, S.; Jin, L.; Lv, L.; Han, L.; An, N. Using Machine Learning Technologies in Pressure Injury Management: Systematic Review. JMIR Med. Inform. 2021, 9, e25704. [Google Scholar] [CrossRef] [PubMed]
- Jin, Y.; Jin, T.; Lee, S.-M. Automated Pressure Injury Risk Assessment System Incorporated Into an Electronic Health Record System. Nurs. Res. 2017, 66, 462–472. [Google Scholar] [CrossRef] [PubMed]
- Park, S.K.; Park, H.-A.; Hwang, H. Development and Comparison of Predictive Models for Pressure Injuries in Surgical Patients. J. Wound Ostomy Cont. Nurs. 2019, 46, 291–297. [Google Scholar] [CrossRef] [PubMed]
- Schultz, M.A.; Walden, R.L.; Cato, K.; Coviak, C.P.; Cruz, C.; D’Agostino, F.; Douthit, B.J.; Forbes, T.; Gao, G.; Lee, M.A.; et al. Data Science Methods for Nursing-Relevant Patient Outcomes and Clinical Processes. CIN Comput. Inform. Nurs. 2021, 39, 654–667. [Google Scholar] [CrossRef] [PubMed]

| Development Cohort (Facility A) | Overall | HAPI | No HAPI | p-Value | ||
|---|---|---|---|---|---|---|
| Admission | Number of hospitalizations | 8855 | 1648 | 7207 | ||
| LOS | Mean (SD) | 17.7 (17.8) | 19.4 (17.4) | 17.3 (17.9) | <0.001 | |
| Median [Min, Max] | 12.3 [0.1, 177] | 14.8 [0.1, 130] | 11.5 [1, 177] | |||
| Demographics | Age | Mean (SD) | 66.4 (16.3) | 67.0 (15.3) | 66.3 (16.5) | 0.12 |
| Median [Min, Max] | 67.9 [18, 106.8] | 68.1 [18, 103] | 67.8 [18, 106.8] | |||
| Gender | Male | 4823 (54.4%) | 980 (59.5%) | 3843 (53.3%) | <0.001 | |
| Female | 4007 (45.3%) | 666 (40.4%) | 3341 (46.4%) | |||
| Other | 25 (0.3%) | 2 (0.1%) | 23 (0.3%) | |||
| Race and Ethnicity | White | 2174 (24.6%) | 472 (28.6%) | 1702 (23.6%) | <0.001 | |
| African American | 1299 (14.7%) | 256 (15.5%) | 1043 (14.5%) | |||
| Hispanic | 1938 (21.9%) | 363 (22.0%) | 1575 (21.9%) | |||
| Asian | 337 (3.8%) | 91 (5.5%) | 246 (3.4%) | |||
| Other | 2780 (31.4%) | 388 (23.5%) | 2392 (33.2%) | |||
| Unspecified | 327 (3.7%) | 78 (4.7%) | 249 (3.5%) | |||
| BMI | Mean (SD) | 27.4 (9.1) | 26.1 (7.1) | 27.8 (9.4) | <0.001 | |
| Median [Min, Max] | 25.9 [8.4, 240.7] | 25.1 [8.4, 89.1] | 26.1 [9.3, 240.7] | |||
| Comorbidities | Elixhauser Score | Mean (SD) | 23.4 (19.9) | 30.5 (19.8) | 21.5 (19.6) | <0.001 |
| Median [Min, Max] | 21 [−33, 106] | 29 [−24, 92] | 20 [−33, 106] | |||
| Diabetes | Yes | 3990 (45.1%) | 740 (44.9%) | 3250 (45.1%) | 0.17 | |
| No | 4802 (54.2%) | 902 (54.7%) | 3900 (54.1%) | |||
| Missing | 63 (0.7%) | 6 (0.4%) | 57 (0.8%) | |||
| Obesity | Yes | 1850 (20.9%) | 286 (17.3%) | 1564 (21.7%) | <0.001 | |
| No | 6942 (78.4%) | 1356 (82.3%) | 5586 (77.5%) | |||
| Missing | 63 (0.7%) | 6 (0.4%) | 57 (0.8%) | |||
| Dementia | Yes | 887 (10.0%) | 174 (10.5%) | 713 (9.9%) | 0.13 | |
| No | 7905 (89.3%) | 1468 (89.1%) | 6437 (89.3%) | |||
| Missing | 63 (0.7%) | 6 (0.4%) | 57 (0.8%) | |||
| Renal Failure | Yes | 3301 (37.3%) | 637 (38.6%) | 2664 (37.0%) | 0.09 | |
| No | 5491 (62.0%) | 1005 (61.0%) | 4486 (62.2%) | |||
| Missing | 63 (0.7%) | 6 (0.4%) | 57 (0.8%) | |||
| Heart Failure | Yes | 3334 (37.7%) | 643 (39.0%) | 2691 (37.3%) | 0.09 | |
| No | 5458 (61.6%) | 999 (60.6%) | 4459 (61.9%) | |||
| Missing | 63 (0.7%) | 6 (0.4%) | 57 (0.8%) | |||
| Liver Disease | Yes | 1615 (18.2%) | 331 (20.1%) | 1284 (17.8%) | 0.02 | |
| No | 7177 (81.1%) | 1311 (79.5%) | 5866 (81.4%) | |||
| Missing | 63 (0.7%) | 6 (0.4%) | 57 (0.8%) | |||
| Autoimmune disease | Yes | 460 (5.2%) | 72 (4.3%) | 388 (5.4%) | 0.05 | |
| No | 8332 (94.1%) | 1570 (95.3%) | 6762 (93.8%) | |||
| Missing | 63 (0.7%) | 6 (0.4%) | 57 (0.8%) | |||
| Braden Scale | Mean (SD) | 15.2 (3.9) | 12.9 (3.0) | 15.7 [3.9] | <0.001 | |
| Median [Min, Max] | 15 [6, 23] | 12 [6, 22] | 16 [6, 23] | |||
| Hospital-Acquired Pressure Injury Outcome | 1648 (18.6%) | |||||
| Validation Cohorts | Internal Validation | External Validation | |||||
|---|---|---|---|---|---|---|---|
| Facility A | Facility B | Facility C | Facility D | Facility E | |||
| Admission | Number of hospitalizations | 1820 | 1400 | 839 | 748 | 703 | |
| LOS | Mean (SD) | 48.6 (16.6) | 16.7 (16.4) | 14.2 (12.3) | 20.5 (22.3) | 12.9 (12.7) | |
| Median [Min, Max] | 12 [2, 176] | 12 [2, 149] | 10 [2, 103] | 13.4 [2, 164] | 8.6 [2, 105] | ||
| Demographics | Age | Mean (SD) | 65.6 (17.5) | 73.4 (15.3) | 75.1 (15.0) | 70.7 (15.8) | 69.4 (16.5) |
| Median [Min, Max] | 67.2 [18, 109] | 75.8 [18, 107] | 76.8 [22, 106] | 72.5 [18, 105] | 70.1 [23.7, 122] | ||
| Gender | Male | 991 (54.4%) | 664 (47.4) | 390 (46.5%) | 328 (43.8%) | 415 (59.0%) | |
| Female | 828 (45.5%) | 719 (51.4%) | 445 (53.0%) | 417 (55.8%) | 284 (40.4%) | ||
| Other | 1 (0.1%) | 17 (1.2%) | 4 (0.5%) | 3 (0.4%) | 4 (0.6%) | ||
| Race and Ethnicity | White | 491 (27.0%) | 203 (14.5%) | 303 (36.1%) | 271 (36.2%) | 156 (22.2%) | |
| African American | 271 (14.9%) | 328 (23.4%) | 217 (25.9%) | 111 (14.8%) | 102 (14.5%) | ||
| Hispanic | 190 (10.4%) | 337 (24.1%) | 28 (3.3%) | 125 (16.7%) | 177 (25.2%) | ||
| Asian | 41 (2.3%) | 27 (1.9%) | 21 (2.5%) | 32 (4.3%) | 45 (6.4%) | ||
| Other | 742 (40.8%) | 473 (33.8%) | 254 (30.3%) | 198 (26.5%) | 189 (26.9%) | ||
| Unspecified | 85 (4.7%) | 32 (2.3%) | 16 (1.9%) | 11 (1.5%) | 34 (4.8%) | ||
| BMI | Mean (SD) | 27.9 (9.9) | 26.2 (9.3) | 28.3 (9.1) | 26.8 (12.0) | 26.9 (13.1) | |
| Median [Min, Max] | 26.0 [9.5, 181.8] | 24.3 [11.8, 154.7] | 26.5 [12.3, 76.1] | 25.1 [11.8, 277.4] | 24.7 [11.9, 281.2] | ||
| Comorbidities | Elixhauser Score | Mean (SD) | 19.1 (19.0) | 22.7 (20.0) | 18.3 (19.5) | 22.5 (20.8) | 17.4 (19.9) |
| Median [Min, Max] | 17 [−24, 95] | 20 [−26, 105] | 16 [−30, 85] | 22 [−23, 95] | 16 [−30, 88] | ||
| Diabetes | Yes | 821 (45.1%) | 619 (44.2%) | 399 (47.6%) | 239 (32.0%) | 294 (41.8%) | |
| No | 978 (53.7%) | 749 (53.5%) | 399 (47.5%) | 479 (64.0%) | 374 (53.2%) | ||
| Missing | 21 (1.2%) | 32 (2.3%) | 41 (4.9%) | 30 (4.0%) | 35 (5.0%) | ||
| Obesity | Yes | 396 (21.7%) | 225 (16.1%) | 233 (27.8%) | 114 (15.2%) | 133 (18.9%) | |
| No | 1403 (77.1%) | 1143 (81.6%) | 565 (67.3%) | 604 (20.8%) | 535 (76.1%) | ||
| Missing | 21 (1.2%) | 32 (2.3%) | 41 (4.9%) | 30 (4.0%) | 35 (5.0%) | ||
| Dementia | Yes | 199 (10.9%) | 335 (23.9%) | 205 (24.4%) | 84 (11.2%) | 105 (14.9%) | |
| No | 1600 (87.9%) | 1033 (73.8%) | 593 (70.7%) | 634 (84.8%) | 563 (80.1%) | ||
| Missing | 21 (1.2%) | 32 (2.3%) | 41 (4.9%) | 30 (4.0%) | 35 (5.0%) | ||
| Renal Failure | Yes | 699 (38.4%) | 457 (32.6%) | 263 (31.3%) | 188 (25.1%) | 225 (32.0%) | |
| No | 1100 (60.4%) | 911 (65.1%) | 535 (63.8%) | 530 (70.9%) | 443 (63.0%) | ||
| Missing | 21 (1.2%) | 32 (2.3%) | 41 (4.9%) | 30 (4.0%) | 35 (5.0%) | ||
| Heart Failure | Yes | 593 (32.6%) | 505 (36.1%) | 277 (33.0%) | 212 (28.3%) | 226 (32.1%) | |
| No | 1206 (66.2%) | 863 (61.6%) | 521 (62.1%) | 506 (37.7%) | 442 (62.9%) | ||
| Missing | 21 (1.2%) | 32 (2.3%) | 41 (4.9%) | 30 (4.0%) | 35 (5.0%) | ||
| Liver Disease | Yes | 320 (17.6%) | 112 (8.0%) | 70 (8.3%) | 78 (10.4%) | 89 (12.7%) | |
| No | 1479 (81.2%) | 1256 (89.7%) | 728 (86.8%) | 640 (85.6%) | 579 (82.3%) | ||
| Missing | 21 (1.2%) | 32 (2.3%) | 41 (4.9%) | 30 (4.0%) | 35 (5.0%) | ||
| Autoimmune disease | Yes | 93 (5.1%) | 63 (4.5%) | 20 (2.4%) | 26 (3.5%) | 35 (5.0%) | |
| No | 1706 (93.7%) | 1305 (93.2%) | 778 (92.7%) | 692 (92.5%) | 633 (90.5%) | ||
| Missing | 21 (1.2%) | 32 (2.3%) | 41 (4.9%) | 30 (4.0%) | 35 (5.0%) | ||
| Braden Scale | Mean (SD) | 15.4 (3.8) | 14.4 [3.6] | 15.0 (3.4) | 15.2 (3.7) | 15.9 (3.5) | |
| Median [Min, Max] | 15 [6, 23] | 14 [6, 23] | 15 [6, 23] | 15 [6, 23] | 16 [3, 23] | ||
| Hospital-Acquired Pressure Injury Outcome | 197 (10.8%) | 31 (2.2%) | 59 (7.0%) | 50 (6.7%) | 35 (5.0%) | ||
| Dataset | Model | Accuracy (95% CI) | Sensitivity (95% CI) | Specificity (95% CI) | Precision (95% CI) | AUROC (95% CI) | F1-Score (95% CI) |
|---|---|---|---|---|---|---|---|
| Test (Facility A) | Braden Scale | 0.72 (0.68, 0.74) | 0.50 (0.42, 0.57) | 0.76 [0.73, 0.80) | 0.31 (0.26, 0.36) | 0.70 (0.66, 0.74) | 0.38 (0.32, 0.44) |
| HAPI model | 0.74 (0.71, 0.77) | 0.76 (0.69, 0.82) | 0.74 (0.71, 0.77) | 0.39 (0.33, 0.44) | 0.83 (0.79, 0.87) | 0.51 (0.46, 0.56) | |
| Internal Validation (Facility A) | Braden Scale | 0.74 (0.71, 0.77) | 0.42 (0.33, 0.52) | 0.78 (0.75, 0.81) | 0.18 (0.14, 0.23) | 0.70 (0.65, 0.74) | 0.26 (0.19, 0.32) |
| HAPI model | 0.75 (0.73, 0.78) | 0.74 (0.65, 0.83) | 0.76 (0.73, 0.79) | 0.27 (0.22, 0.32) | 0.83 (0.90, 0.87) | 0.39 (0.33, 0.45) | |
| External Validation (Facility B) | Braden Scale | 0.68 (0.65, 0.72) | 0.5 (0.25, 0.73) | 0.68 (0.65, 0.72) | 0.03 (0.01, 0.06) | 0.61 (0.47, 0.75) | 0.07 (0.03, 0.11) |
| HAPI model | 0.87 (0.84, 0.89) | 0.54 (0.29, 0.79) | 0.88 (0.85, 0.9) | 0.09 (0.04, 0.15) | 0.85 (0.76, 0.91) | 0.16 (0.07, 0.25) | |
| External Validation (Facility C) | Braden Scale | 0.78 (0.74, 0.82) | 0.65 (0.47, 0.82) | 0.79 (0.74, 0.82) | 0.19 (0.12, 0.27) | 0.81 (0.73, 0.87) | 0.30 (0.20, 0.40) |
| HAPI model | 0.90 (0.86, 0.92) | 0.38 (0.19, 0.54) | 0.93 (0.90, 0.96) | 0.29 (0.16, 0.46) | 0.84 (0.76, 0.90) | 0.33 (0.18, 0.47) | |
| External Validation (Facility D) | Braden Scale | 0.75 (0.71, 0.79) | 0.54 (0.35, 0.74) | 0.77 (0.72, 0.81) | 0.14 (0.08, 0.22) | 0.71 (0.61, 0.81) | 0.23 (0.11, 0.32) |
| HAPI model | 0.85 (0.81, 0.88) | 0.42 (0.24, 0.62) | 0.88 (0.84, 0.91) | 0.2 (0.10, 0.34) | 0.77 (0.66, 0.86) | 0.27 (0.14, 0.39) | |
| External Validation (Facility E) | Braden Scale | 0.83 (0.79, 0.87) | 0.52 (0.28, 0.77) | 0.84 (0.80, 0.88) | 0.14 (0.06, 0.23) | 0.81 (0.73, 0.88) | 0.23 (0.10, 0.35) |
| HAPI model | 0.87 (0.84, 0.91) | 0.56 (0.31, 0.82) | 0.89 (0.85, 0.92) | 0.21 (0.10, 0.34) | 0.83 (0.71, 0.92) | 0.31 (0.17, 0.44) |
Disclaimer/Publisher’s Note: The statements, opinions and data contained in all publications are solely those of the individual author(s) and contributor(s) and not of MDPI and/or the editor(s). MDPI and/or the editor(s) disclaim responsibility for any injury to people or property resulting from any ideas, methods, instructions or products referred to in the content. |
© 2025 by the authors. Licensee MDPI, Basel, Switzerland. This article is an open access article distributed under the terms and conditions of the Creative Commons Attribution (CC BY) license (https://creativecommons.org/licenses/by/4.0/).
Share and Cite
Nguyen, K.-A.-N.; Patel, D.; Edalati, M.; Sevillano, M.; Timsina, P.; Freeman, R.; Levin, M.A.; Reich, D.L.; Kia, A. Electronic-Medical-Record-Driven Machine Learning Predictive Model for Hospital-Acquired Pressure Injuries: Development and External Validation. J. Clin. Med. 2025, 14, 1175. https://doi.org/10.3390/jcm14041175
Nguyen K-A-N, Patel D, Edalati M, Sevillano M, Timsina P, Freeman R, Levin MA, Reich DL, Kia A. Electronic-Medical-Record-Driven Machine Learning Predictive Model for Hospital-Acquired Pressure Injuries: Development and External Validation. Journal of Clinical Medicine. 2025; 14(4):1175. https://doi.org/10.3390/jcm14041175
Chicago/Turabian StyleNguyen, Kim-Anh-Nhi, Dhavalkumar Patel, Masoud Edalati, Maria Sevillano, Prem Timsina, Robert Freeman, Matthew A. Levin, David L. Reich, and Arash Kia. 2025. "Electronic-Medical-Record-Driven Machine Learning Predictive Model for Hospital-Acquired Pressure Injuries: Development and External Validation" Journal of Clinical Medicine 14, no. 4: 1175. https://doi.org/10.3390/jcm14041175
APA StyleNguyen, K.-A.-N., Patel, D., Edalati, M., Sevillano, M., Timsina, P., Freeman, R., Levin, M. A., Reich, D. L., & Kia, A. (2025). Electronic-Medical-Record-Driven Machine Learning Predictive Model for Hospital-Acquired Pressure Injuries: Development and External Validation. Journal of Clinical Medicine, 14(4), 1175. https://doi.org/10.3390/jcm14041175