Article

Study on the Hydraulic and Energy Loss Characteristics of the Agricultural Pumping Station Caused by Hydraulic Structures

College of Hydraulic Science and Engineering, Yangzhou University, Yangzhou 214000, China
*
Author to whom correspondence should be addressed.
Agriculture 2022, 12(11), 1770; https://doi.org/10.3390/agriculture12111770
Submission received: 27 September 2022 / Revised: 20 October 2022 / Accepted: 22 October 2022 / Published: 25 October 2022
(This article belongs to the Special Issue Advances in Agricultural Engineering Technologies and Application)

Abstract

:
The pumping station is an important part of the agricultural irrigation and drainage system. The sump is one of the common water inlet types of agricultural pumping stations. In the sump, to facilitate the installation and maintenance of equipment, some hydraulic structures, such as pump beams, maintenance platforms and chest walls, are added to the sump. At present, the impact of hydraulic structures in the sump on the hydraulic performance of the pump device is not clear, so this paper focused on the impact of hydraulic structures on the hydraulic characteristics and entropy generation characteristics of the pump device by using numerical simulation methods. The results showed that the installation of hydraulic structures in the sump has the greatest impact on the efficiency of the pump device. The efficiency coefficient increased after adding a pump beam in the sump and decreased by about 2% after adding a maintenance platform and a water retaining chest wall. Results also showed that the installation of hydraulic structures in the sump will lead to uneven distribution of entropy generation in the sump, especially in the vicinity of the hydraulic structures. The installation of the maintenance platform and chest wall will lead to the increase of the total entropy generation in the sump, which also means that the hydraulic loss in the sump will increase accordingly. Hence, in addition to the pump beam, other structures should be avoided in the sump.

1. Introduction

Irrigation and drainage system refers to the farmland water conservancy facilities that transport water from the irrigation water source to the field through irrigation channels (pipes) and buildings at all levels and drain the surplus water from the field through drainage ditches at all levels. When the water level of the irrigation water source is lower than the farmland surface, a pumping station needs to be built for water-lifting irrigation. Therefore, the pumping station is an important part of farmland irrigation and drainage systems. With the continuous acceleration of China’s modernization, pumping station engineering in China has been dramatically developed. Small- and medium-sized irrigation and drainage pumping stations are widely used in agricultural irrigation and water drainage and have contributed significantly to the improvement of agricultural production conditions and China’s modernization.
An open sump is a pumping station inlet building with a free water surface suction pipe to directly absorb water, which is the most common form of inlet in small and medium-sized pumping stations. The main function of the pumping station sump is to regulate the flow pattern in the sump and provide better inlet conditions for the pump inlet. Uneven flow distribution in the sump, or the emergence of a vortex sump, will not only significantly increase energy loss, affecting the device’s efficiency, but also may lead to vibration of the pump device, so that it cannot work correctly. Only good inlet conditions can ensure the safe and efficient operation of the pump. Therefore, in order to improve the operation efficiency of the agricultural irrigation pumping station and achieve the goal of energy saving and consumption reduction, it is necessary to study the hydraulic characteristics of the sump of the irrigation pumping station.
The sump in the actual project is widely used, so many experts and scholars on the open type into the sump have carried out a significant amount of experimental research, accessing many valuable results, and applied these to engineering practices. In 1998, Constantinescu et al. [1] simulated the flow field in a rectangular sump and accurately obtained the length and position of the vortex. Wang et al. [2] used the CFD method to simulate the three-dimensional turbulent flow in the coupled half-elbow sump of a large diameter axial flow pump, and found that there were increases in an obvious reflux phenomenon in the half-elbow sump and strong flow inhomogeneity at the outlet of the sump. Based on Reynolds shear stress distribution, a simplified Navier–Stokes equation, and a turbulent kinetic energy transport equation, Xi et al. [3] analyzed the formation mechanism of asymmetrically attached vortices in the side pump sump. Padmanabhan et al. [4] analyzed the scale effect of the experimental model of inflow flow. Denny et al. [5] systematically studied the vortex problem in the sump. Ansar et al. [6] analyzed in detail the flow patterns of the pump in the rectangular sump, with and without tangential reflux. With the emergence of modern flow testing technologies such as PIV and LDV, visualization of the flow field in pimps and pump devices has become the development direction of experimental research [7,8]. To sum up, experts and scholars have conducted a significant amount of research on the flow characteristics of the sump in pumping stations using numerical simulations and experimental methods, and research results have significantly guided practical projects. However, the actual engineering design often increases part of the structure in the sump to facilitate the installation and maintenance of equipment. After these structures are arranged, their influence on the flow pattern of the sump and the performance of the pump device is still unclear.
Helios et al. [9] presented an implementation of entropy generation analysis in the main flow field of a water jet pump via the CFD method. Yang et al. [10] obtained the result that the entropy production rate in the impeller is the highest among the components in the pump. With the increase in flow rate, the proportion of entropy generation of the impeller to the total value of the pump device increases continuously. Pei et al. [11] used the entropy generation method based on numerical results to assess the impact of distance on the internal flow loss distribution and overall power loss to gain a better understanding of the hydraulic loss mechanism. Fabian et al. [12] systematically analyzed the entropy generation of incompressible turbulent shear flows in Newtonian fluids and incorporated it into computational fluid dynamics programs. Zhou et al. [13] reviewed entropy generation in the pump flow, including energy loss analysis, design optimization, cavitation analysis, and fault diagnosis. Different perspectives were presented for future works and introduced to other methods such as kinetic energy dissipation theory to obtain procedures that reveal energy loss to improve the pump performance and try to understand the causes of pump failure. This review provided theoretical guidance for optimal design and assessment of the operational conditions in terms of irreversible flow losses in the pumps. Hou et al. [14] used the Reynolds stress turbulence model and energy equation model to numerically simulate 3D steady-state flow and calculate entropy generation through user-defined function codes. The range analysis was made to identify the optimal case indicating that a combination of local entropy production and orthogonal design is feasible for pump optimization. Using the results of direct numerical simulations, Donald M. McCeligot et al. [15] studied the entropy generated by friction in turbulent viscous layers with significant flow pressure gradients, including boundary layers and channels. About two-thirds or more of the entropy production per device surface area occurred there. Increasing the pressure gradient increased the direct dissipation and decreased the turbulent dissipation (in wall coordinates). Ghasemi et al. [16] studied the process of entropy generation in the by-pass transition scenario of a plate boundary layer. Here, transition occurred prematurely due to strong levels of free-stream turbulence. Reynolds-Averaged Navier–Stokes (RANS) models and direct numerical simulations (DNS) were implemented to comprehensively study the local entropy generation and energy dissipation in pre-transitional and transitional regions. Guan et al. [17] analyzed the energy loss of double-suction centrifugal pumps by entropy generation theory. The numerical simulation results, verified by experiments, indicated that the difference in total entropy production under different flow rates is mainly affected by the entropy production in the central flow region. To explore the energy loss mechanism of PAT under different flow conditions, Lin et al. [18] used the entropy dissipation method to calculate the energy loss of each part of PAT, which could not only accurately calculate the energy loss but also diagnose the location and way of hydraulic loss. An et al. [19] applied the theory of entropy generation to the flow of a turbine and quantitatively analyzed the hydraulic loss characteristics of the turbine. Based on numerical simulation, Li et al. [20] introduced entropy generation theory to determine the flow loss of the whole passage. The variation of entropy production under different guide vane openings is presented. Zhang et al. [21] analyzed the energy dissipation mechanism of axial flow pump stations under reverse power generation using by entropy production method. In order to demonstrate the internal energy loss mechanism of the axial-flow pump, Yang et al. [22] calculated the energy loss of the total conduit of the pump device using the entropy generation method, and clarified the internal energy loss mechanism of the pump device. It can be seen that entropy generation theory has been widely used in the energy loss of hydraulic machinery. However, there are few studies on the entropy generation characteristics of the sump in the pumping station. In particular, the influence of the increase of hydraulic structures on the entropy generation characteristics of the sump is not clear.
At present, experts and scholars mainly focus on the analysis of internal flow characteristics, optimization of geometric parameters, and vortex control in the sump of the pumping station. Research on the common hydraulic structures in the sump is scarce. Because there are many different hydraulic structures in the sumps of actual pumping station projects, their influence on the flow characteristics in the sump and the hydraulic performance of the pump device cannot be ignored. Hence, this paper studied the influence of different hydraulic structures on the hydraulic characteristics and energy characteristics of the sump based on the steady control equations of incompressible fluid and the RNG k-ε turbulence model. The main contents include the following aspects: (1) The hydraulic performance curves of pump devices under different structure forms were obtained by calculation, the reasons for the formation of different curves were analyzed, and relevant suggestions are put forward; (2) Through numerical simulation of the pump device under different structure forms, the causes of the formation of different flow states were analyzed and combined with the weighted average angle and the velocity uniformity of further analysis, and a reasonable layout of the structure was proposed for engineering design reference; (3) Based on the entropy generation theory, a flow loss analysis of the sump with additional structures was carried out to obtain the structure layout plan with the minimum loss, the reason for the change of entropy generation, and the variation amplitude and proportion of different entropy generation were analyzed. This study can provide a reference for choosing different forms of hydraulic structures in practical engineering.

2. Numerical Calculation

2.1. Modeling case and Research Content

In this paper, a typical axial flow pumping station with ω-shaped back wall form was used as a model, and a sump with the pump was used as the research object. The design flow rate of the axial flow pump station is 2.6 m³/s, and two 700ZLB-125 axial flow pumps are installed in the pumping station. The sump inside the pumping station is symmetrically distributed, the unilateral sump is 2.5 m wide and 2.0 m deep. The pump and suction pipe are placed in the sump, as shown in Figure 1a. This case is the prototype case. Because of the actual needs of the project, the pump beam is often added to the sump. The cross section of the pump beam is a rectangle of 0.35 m × 0.45 m, as shown in Figure 1b. To facilitate the installation and maintenance of equipment, the pump beam will generally be widened to build a maintenance platform. The side length of the overhaul platform is 1.9 m and the height is 0.4 m, as shown in Figure 1c, as shown in Figure 1c. Some will set up a retaining parapet at the inlet of the sump, and the cross section of the chest wall is a rectangle of 0.32 m × 0.35 m, as shown in Figure 1d.

2.2. Governing Equation

The water flow in the open sump is in a complex three-dimensional turbulent state. This paper uses the continuity equation based on incompressible fluid and the time-averaged Reynolds equation (RANS equation), and the RNG k-ε model was used for the turbulence model. Several studies [23,24] have revealed that the RNG k-ε model can predict the swirling flow and vortex flow very well, and has good applicability in the flow field of the axial flow pump.

2.3. Generation of the Computational Grid

As shown in Figure 2, the entire computational domain was generated with hexahedral elements. The grid of the sump and impeller is presented in Figure 2. ICEM CFD software was utilized to mesh the sump, impeller, guide vanes, pipes, and outlet sump. When meshing the computational domain, the minimum angle of the grid was maintained with a degree not less than 12°. The guide vane, the impeller, and the clearance meshed periodically. The poor-quality mesh was eliminated in this study through mesh refinement and Y-type mesh generation to ensure the grid quality of the pump device. In order to ensure the calculation accuracy, the mesh density of impeller and guide vane is encrypted. Since different turbulence models have different requirements on the grid y+ input value, the RNG k-ε model adopted in this paper requires the y+ leaf value to be between 30 and 100. Since the calculation model includes the impeller, the mesh quality at the impeller has a great influence on the calculation results. The y+ appreciation of the grid at the impeller was analyzed, and the y+ value of the grid at the impeller was between 36.5 and 81.3. The y+ value in the overall calculation domain is between 30 and 100, which meets the requirements of RNG k-ε model.

2.4. Grid Independence Analysis

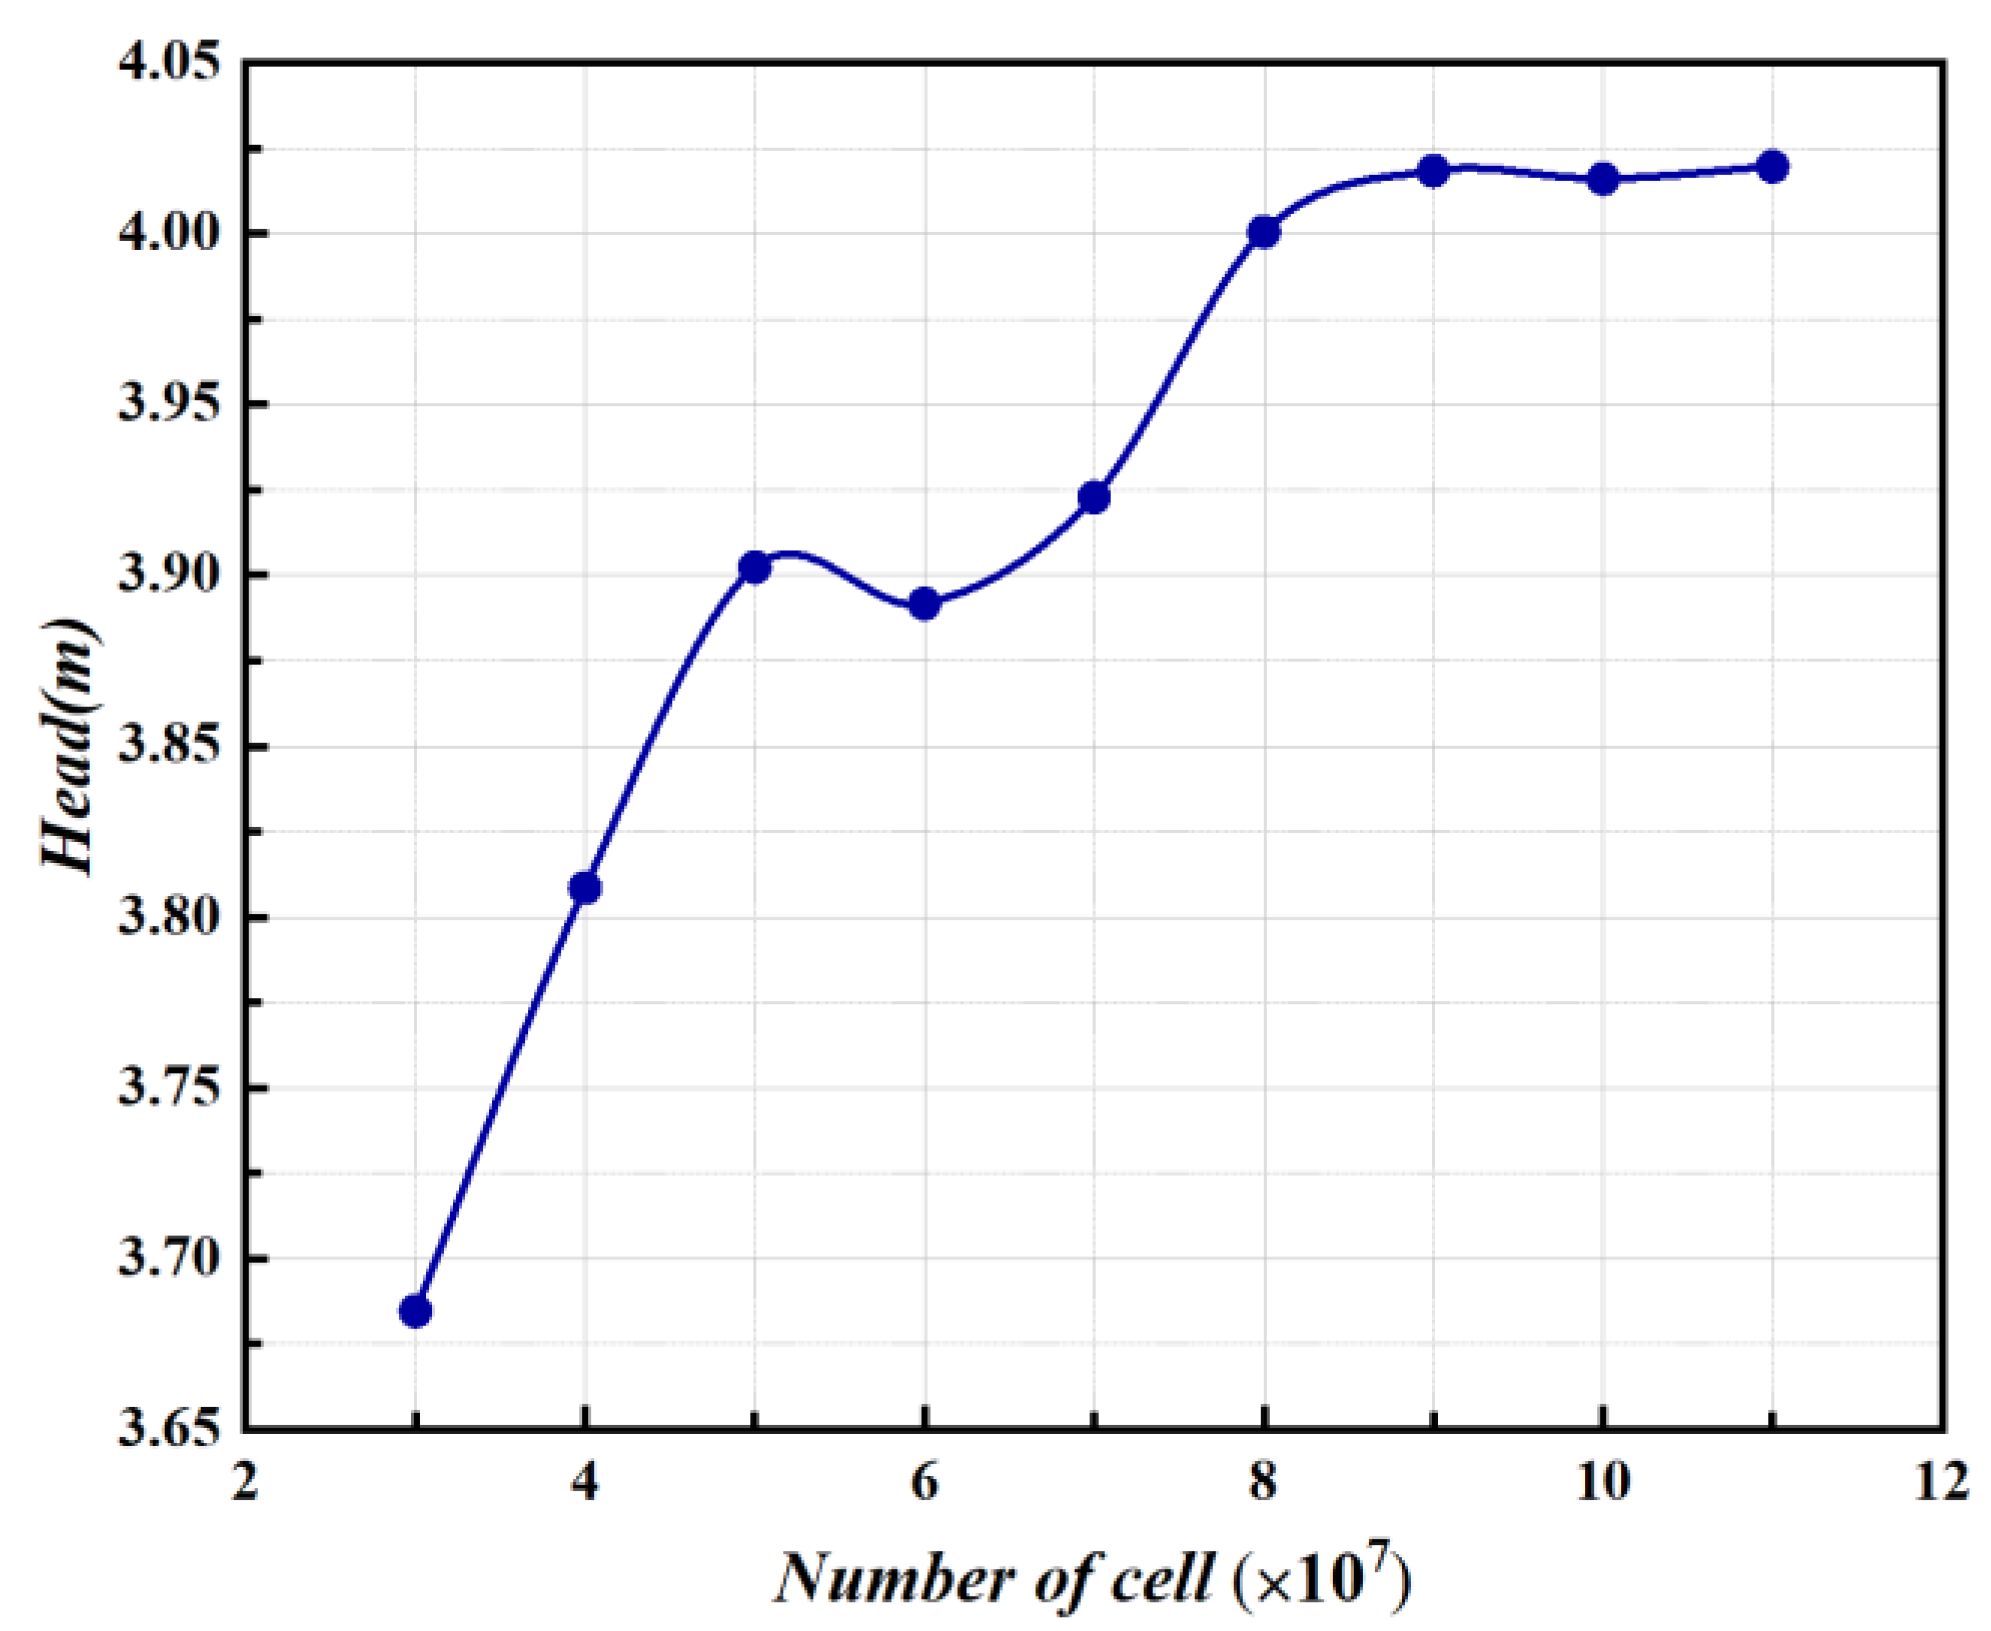
The grid independence of the pump device is analyzed under the design flow condition. The numerical simulation was carried out under 9 cases of 3 million, 4 million, 5 million, 6 million, 7 million, 8 million, 9 million, 10 million, and 11 million respectively. As shown in Figure 3, the head is selected as the grid independence analysis index. It can be seen from the figure that with the increase in the number of grids, the head of the pump device shows a dynamic increasing trend, and tends to be stable after the number of grids reaches 9 million. Too many grids will consume computing resources, and too few grids cannot guarantee the accuracy of computing. Therefore, the number of grids for the pump device is finally determined to be 9 million.

2.5. Boundary Condition Setting

The inlet is set at the upstream of the sump, and the incoming flow is considered to be uniform. The inlet of the forebay is set as the inlet boundary of the entire computational domain, and mass flow rate is adopted as the inlet boundary condition. The nominal turbulence intensities (with a value equal to 5%) are used at the inlet boundary. The outlet of the outlet sump is set as the outlet boundary. An average static pressure outlet boundary condition is applied with 1 atm at the outlet. No-slip condition was applied at solid boundaries. The interfaces between the rotational impeller and static domain are set as the frozen stage condition. A multi-reference frame model is used to deal with the dynamic and static interface to ensure the continuity of the interface. The surface of the sump and outlet sump is a free water surface. The free surface remained almost unchanged, so the rigid-lid (RL) assumption method was used to process the free surface, and it was set as a symmetrical surface. The convergence precision is set to 10−5.

3. Entropy production theory

To analyze the energy loss after the addition of structures in the sump, the entropy production calculation is performed in this paper. Entropy production is a phenomenon caused by the inevitable irreversibility of the actual fluid mechanical operation, mainly consisting of heat transfer entropy production and dissipation entropy production because the temperature remains almost constant throughout the flow process, so only the entropy production changes caused by dissipation are considered here. Zhang et al. [25] used the following entropy production theory in their study of flow loss in vertical shaft cross-flow pumps. In the general turbulent motion, dissipative entropy production mainly has three parts, the following are recorded S , S , S , one for the turbulent direct dissipative entropy production S , the average velocity primarily causes this part of the entropy production; two for the turbulent energy dissipation caused by the entropy production S , this part is mainly caused by the pulsation velocity; the first two are collectively referred to as the mainstream area entropy production S ; three is generated by the water flow and wall friction and wall entropy production S ; the sum of the three is the total dissipative entropy production S .
The entropy production S · is defined as (1):
S · = Q · t
where Q · is the energy dissipation rate ( W / m 3 ), t is the temperature, and its value is taken as 298.15 K, i.e., 25 °C, for the calculation.
The direct dissipation entropy production S · generated by the time-averaged velocity can be found by the following Equation (2):
S · = 2 μ t [ ( u ¯ x ) 2 + ( v ¯ y ) 2 + ( w ¯ z ) 2 ] + μ t [ ( v ¯ x + u ¯ y ) 2 + ( w ¯ x + u ¯ z ) 2 + ( v ¯ z + w ¯ y ) 2 ]
where, μ is the kinematic viscosity (Pa·s); u ¯ , v ¯ , w ¯ is the component of the time-averaged velocity in the x, y, and z directions (m/s).
The entropy production S · is integrated into the requested region, which leads to the direct dissipation of entropy production as (3):
S = V S · d V
where, V is the volume of the calculation domain (m³).
The entropy production resulting from turbulent dissipation S · due to pulsating velocity is calculated as follows (4):
S · = ρ ε t
where: ε is the turbulent kinetic energy dissipation rate (m2/s3).
Integrating the entropy production S · over the desired region gives the direct dissipative entropy production as (5):
S = V S · d V
The wall entropy production S · generated by wall friction is calculated as follows (6):
S · = τ · v t
where, τ is the wall shear stress, Pa; v is the relative velocity vector at the center of the first grid layer in the wall area (m/s).
The entropy production is integrated into the requested region. Thus the wall entropy production is obtained as (7):
S = A S · d A
where: A is the calculated domain surface area (m²).

4. Results and Discussion

4.1. External Characteristics

The impact of the structure in the open sump on the pump device is reflected in the influence on the efficiency and head. In different cases, the structure’s influence on the pump device’s performance is obtained through the comparison and analysis of the head ~ flow curve and efficiency ~ flow curve of the pump device in different cases.
In this paper, the influence of different structures on the performance of the pump device in the open sump is studied by numerical simulation. To facilitate comparison with the test results, the flow coefficient KQ, head coefficient KHS and efficiency Kη were used to analyze the calculation results with the following equations.
K Q = Q N D 3
where: Q is the volume flow rate in (m3/s); N is the pump speed (rad/s); D is the impeller inlet diameter (m).
H S = ( P i n s P o u t s ) / ρ g
where: HS is the pump head (m); Pins and Pouts are the inlet and outlet static pressures (Pa); ρ is the density of water, taken as 103 kg/m3; g is the acceleration of gravity, taken as 9.81 m/s2.
K H S = g H S ( N D ) 2
H T = ( P i n t P o u t ) / ρ g
where: HT is the total head (m; Pint is the total pump inlet pressure (Pa); Pout is the total pump outlet pressure (Pa).
P s h a f t = 2 π T N 1000 60
η = ρ g Q H T P
η = 9550 ρ g Q H T T N
K η = g η N 3 D 5
where Pint is the total pump inlet pressure (Pa); Pout is the total pump outlet pressure (Pa); η is the pump efficiency; T is the torque on the impeller in N·m; Pshaft is the shaft power (kW).
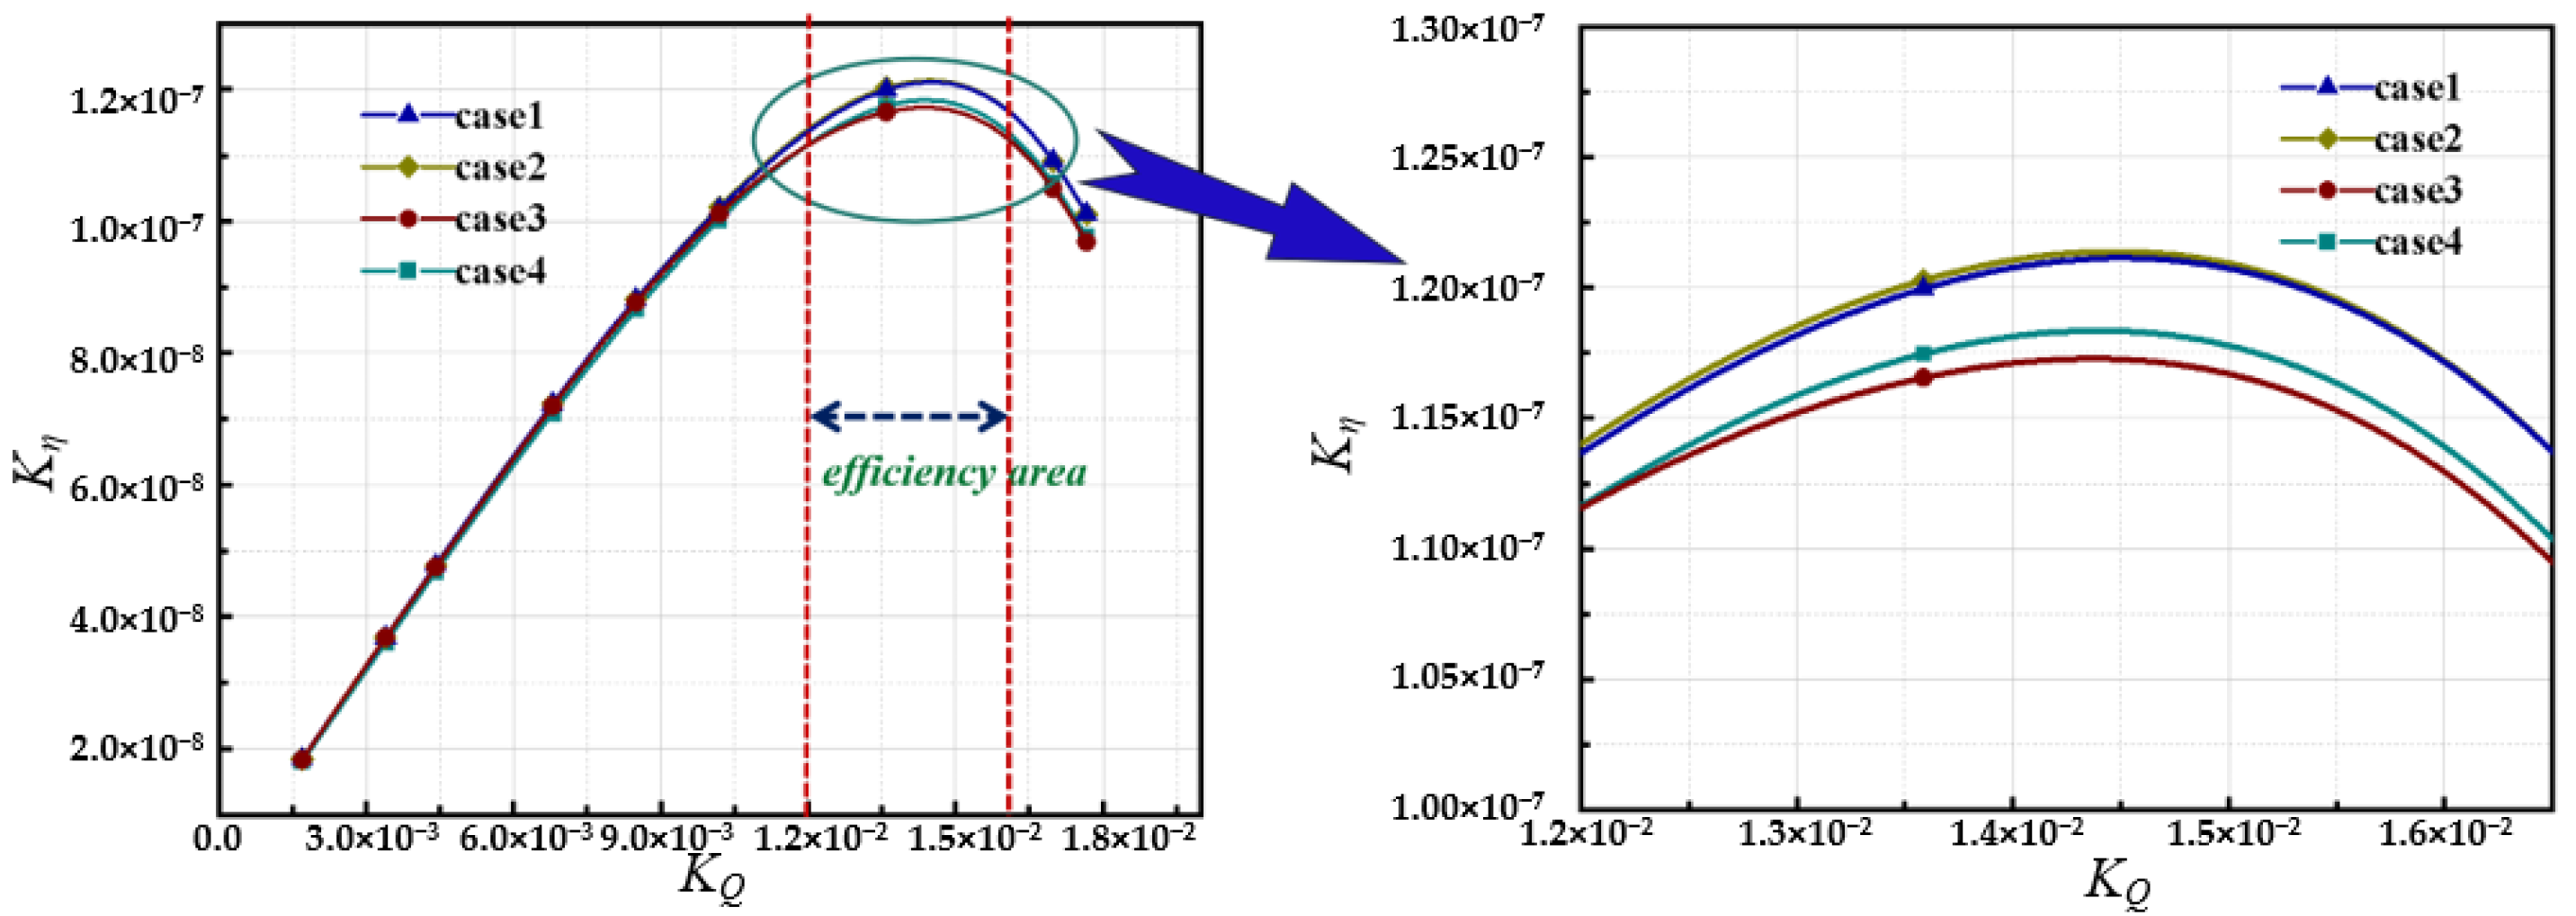
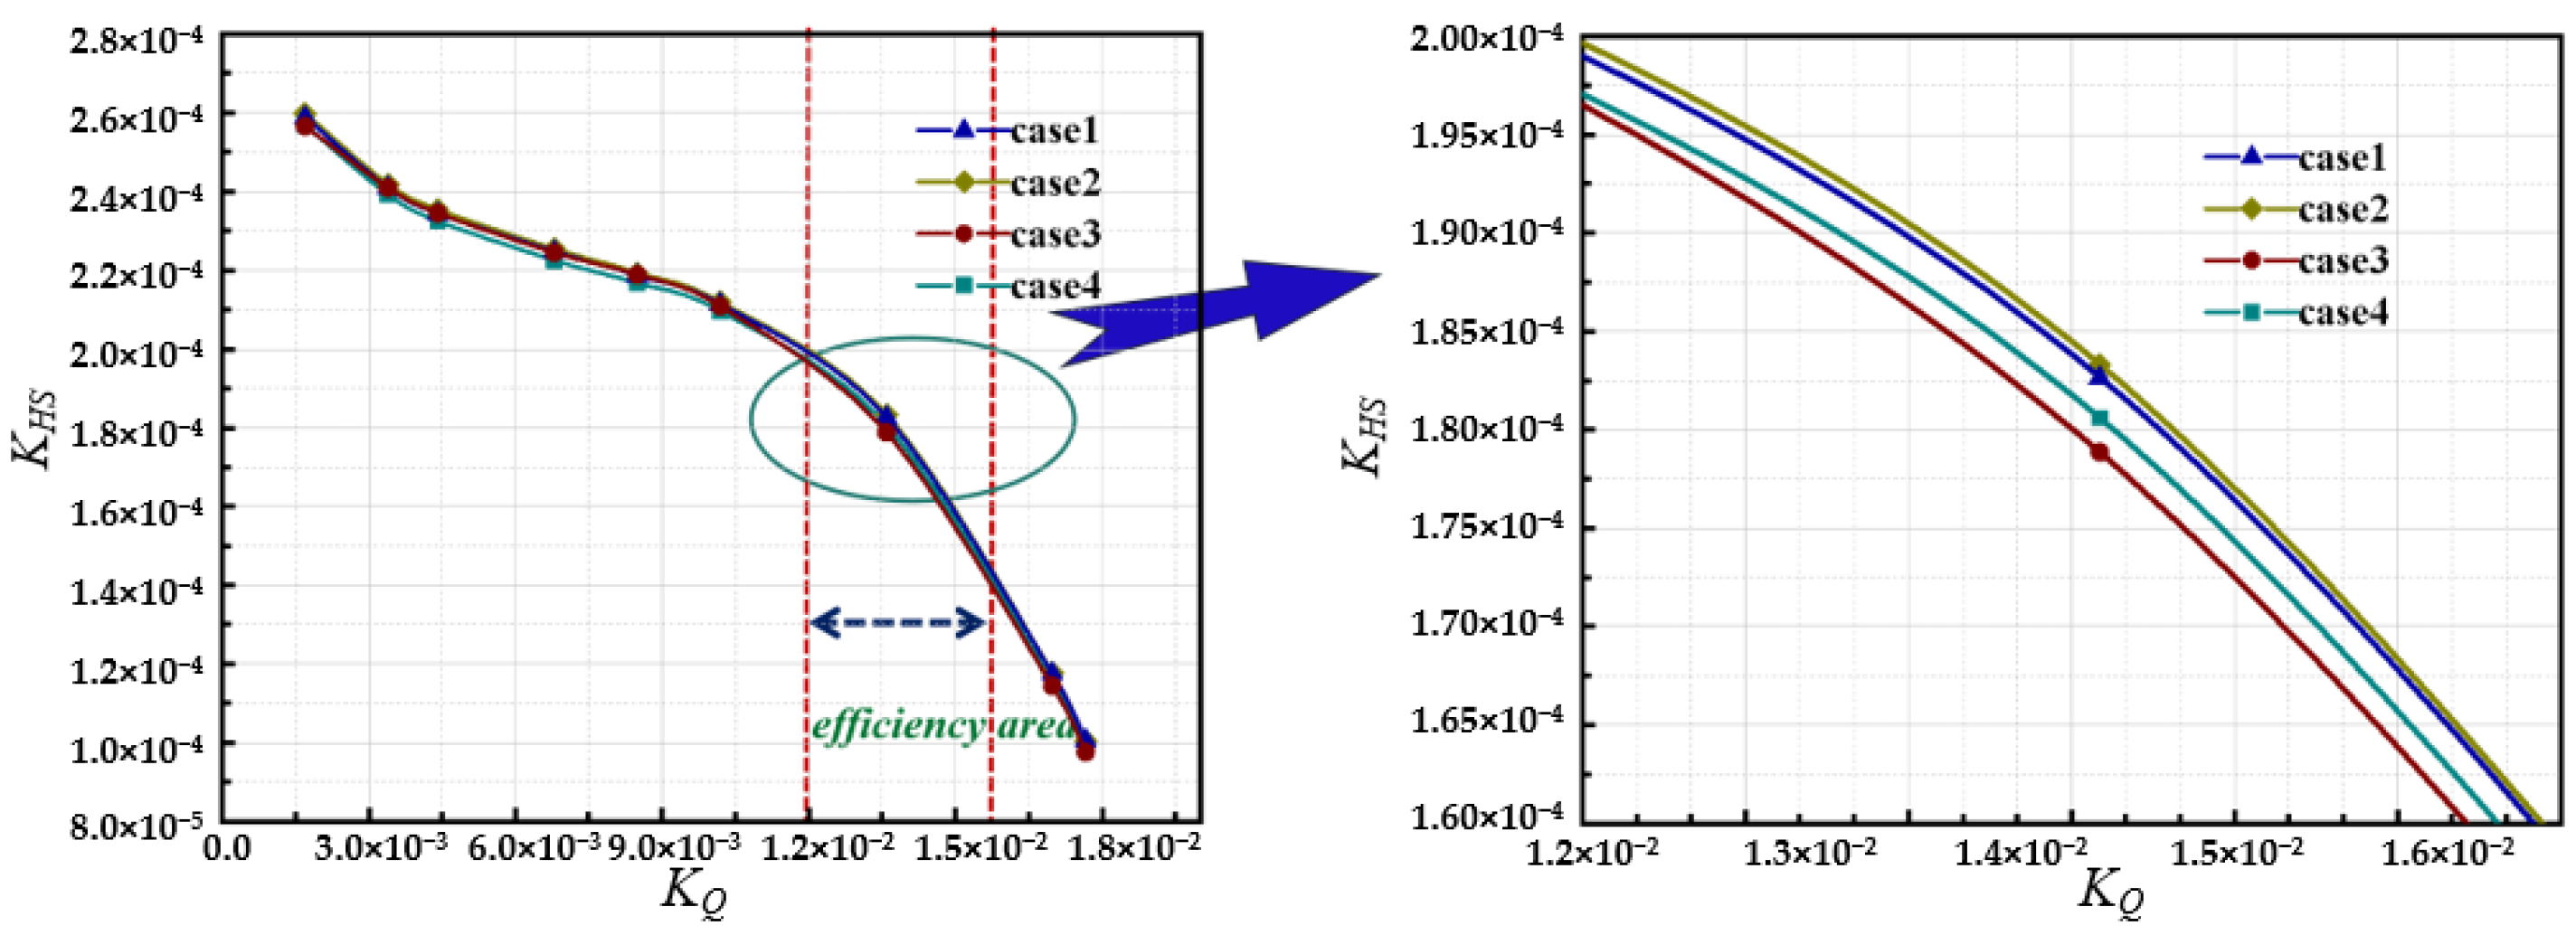
Figure 4 and Figure 5 show the performance curves of pump devices with different structure cases. According to the KQ~ KHS curves of the four cases in Figure 4, the head coefficient increases with the flow rate decreases. When reduced to a certain flow rate, the head increases slowly, but beyond this area, the head rises sharply again. To further explore the influence of different structures on the performance of the pump device, the KQ~ KHS and KQ~Kη curves of different cases are compared.
It can be seen from the Figure 4, the KQ~Kη curves of the pump device are approximately the same under different construction conditions, and the efficiency coefficient increases and then decreases with the rise of the flow coefficient. The highest efficiency point is reached around the design flow rate. In the case of the design flow coefficient, the efficiency coefficients of case 1 and case 2 are similar. The efficiency coefficients of case 3 are slightly lower than those of the prototype. By comparing the four sets of data, it is easy to find that the installation of a maintenance platform in the sump has the greatest impact on the hydraulic performance of the pump device. The efficiency coefficient increased after adding a pump beam in the sump and decreased by about 2% after adding a maintenance platform and a water retaining chest wall.
It can be seen from Figure 5 that the KQ~KHS curves of the pump device are roughly the same under different construction conditions. Under large flow, the head coefficient KHS is small. When the flow rate is small, the head coefficient is significant. Case 1 is close to case 2, and case 3 and case 4 have slightly lower head coefficients than the prototype. To sum up, the structure of the sump affects the efficiency of the pump device, and the impact on the head is negligible.

4.2. Internal Characteristics

The sump is the installation of a water pump inlet pipe building, general requirements into the sump hydraulic design should meet two conditions: one is the sump water flow smooth, the hydraulic loss is slight, no harmful vortex, to ensure that the pump device does not produce performance deterioration and mechanical vibration; Second, the velocity distribution of inlet section of pump impeller chamber is uniform and perpendicular to the area to ensure that the pump device reaches its best operating condition. For this reason, in this paper, the flow analysis is carried out mainly at the longitudinal section of the sump, and the axial velocity analysis at the pump inlet through numerical simulation.

4.2.1. Longitudinal Profile Flow Analysis

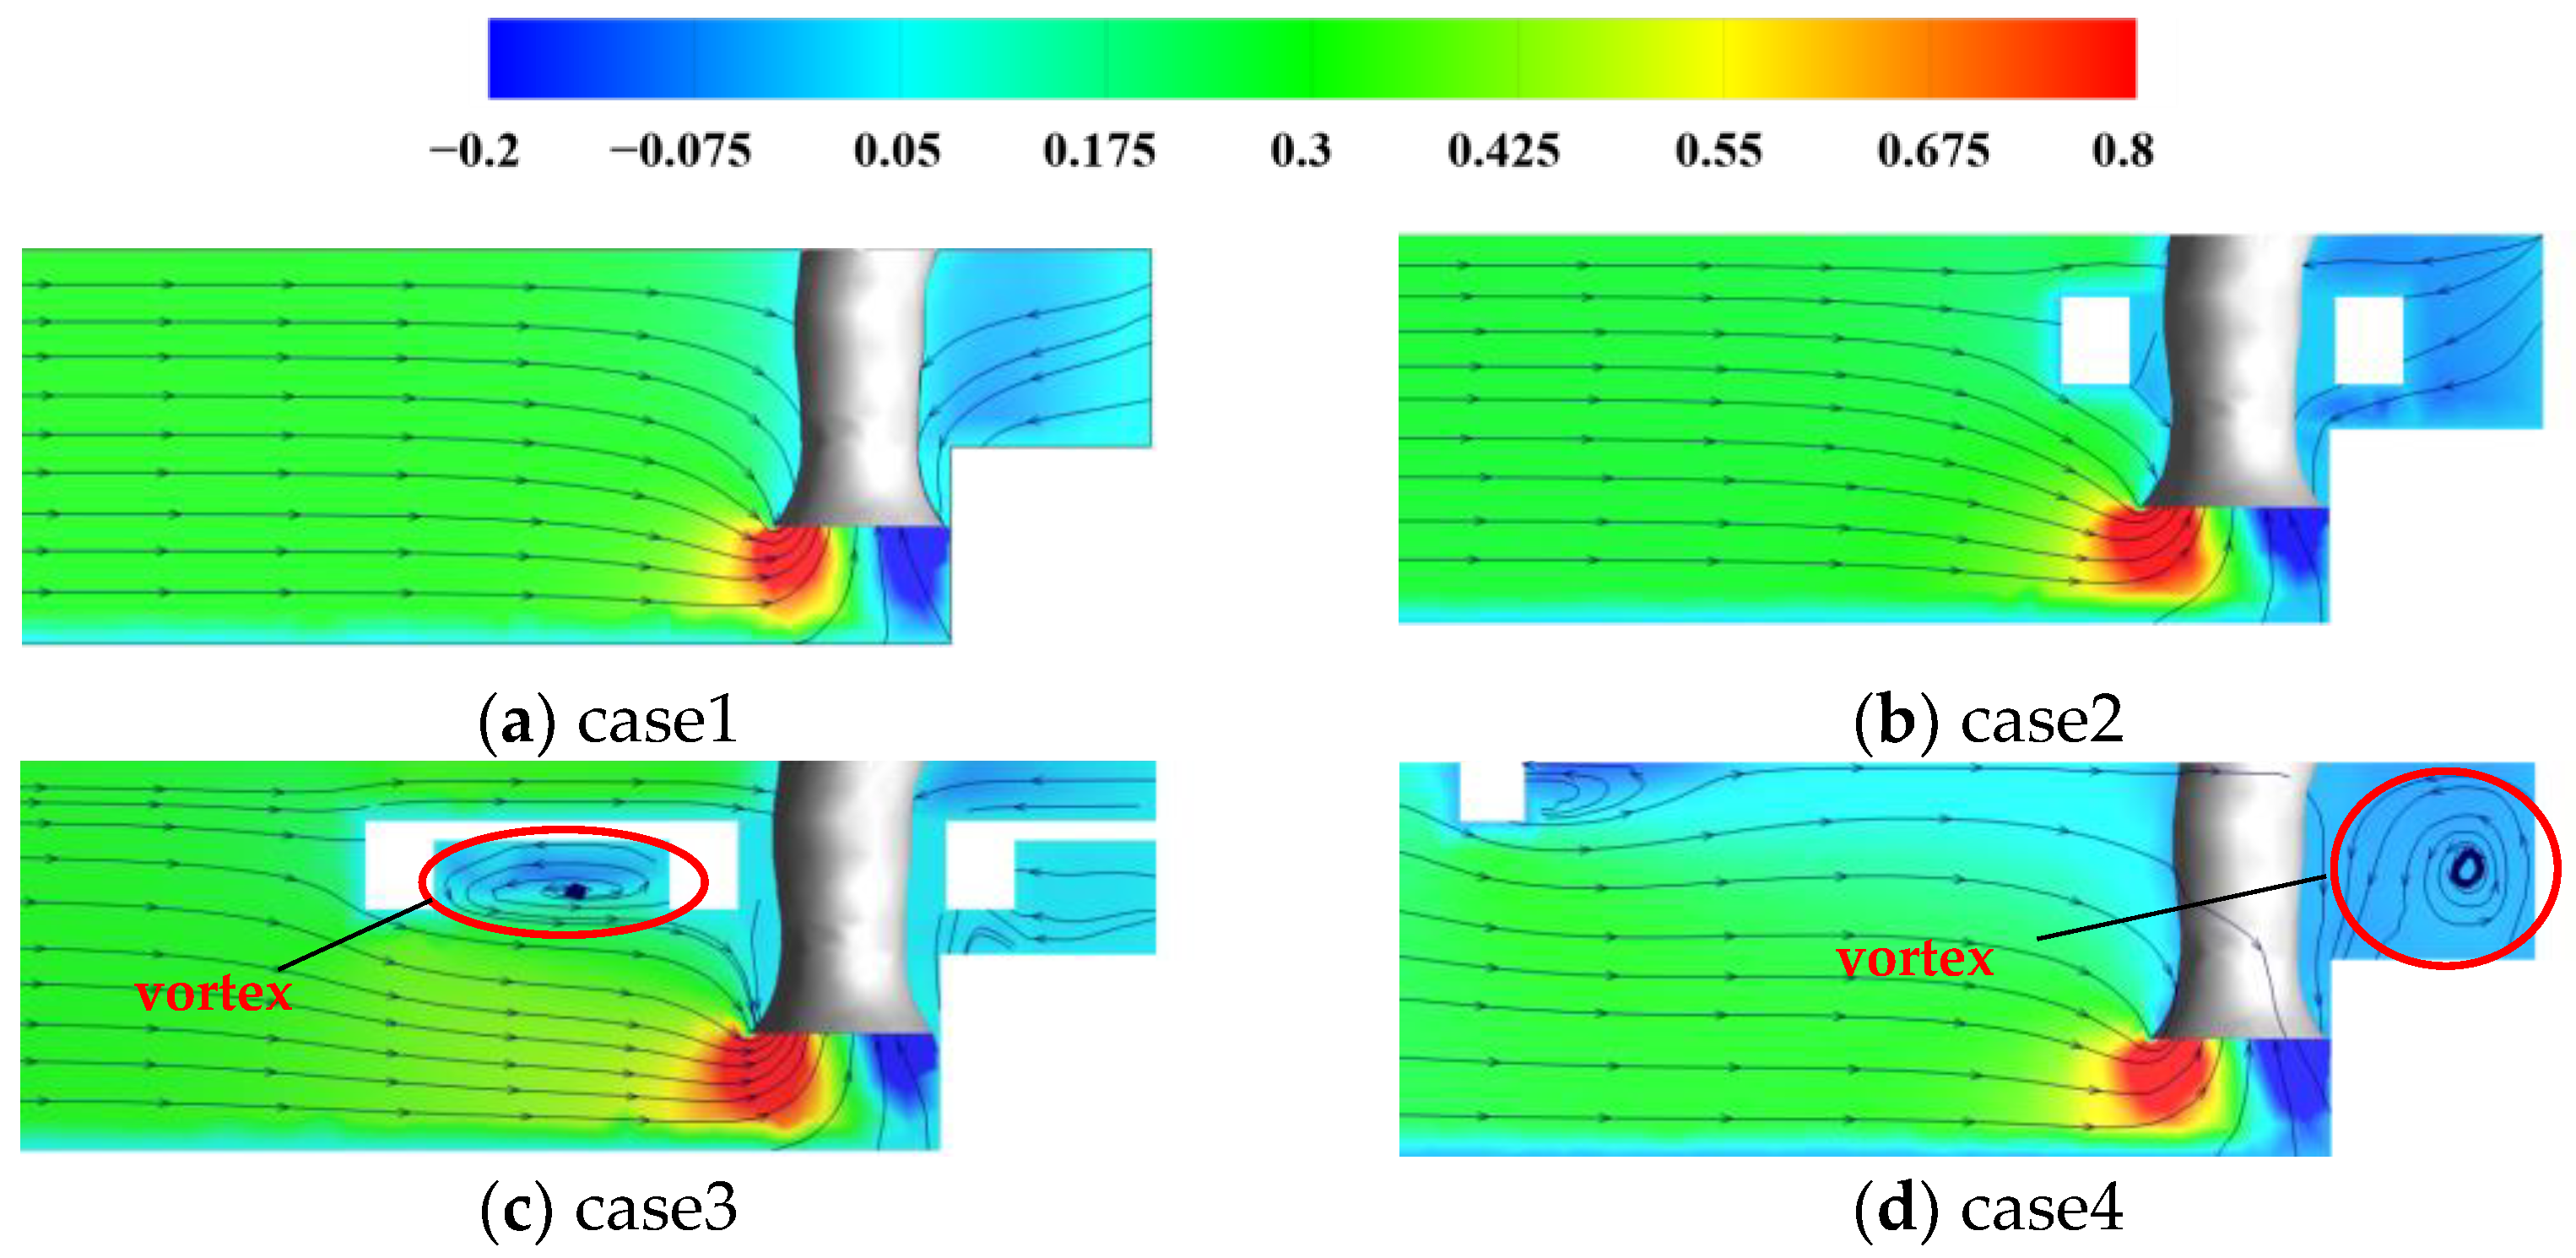
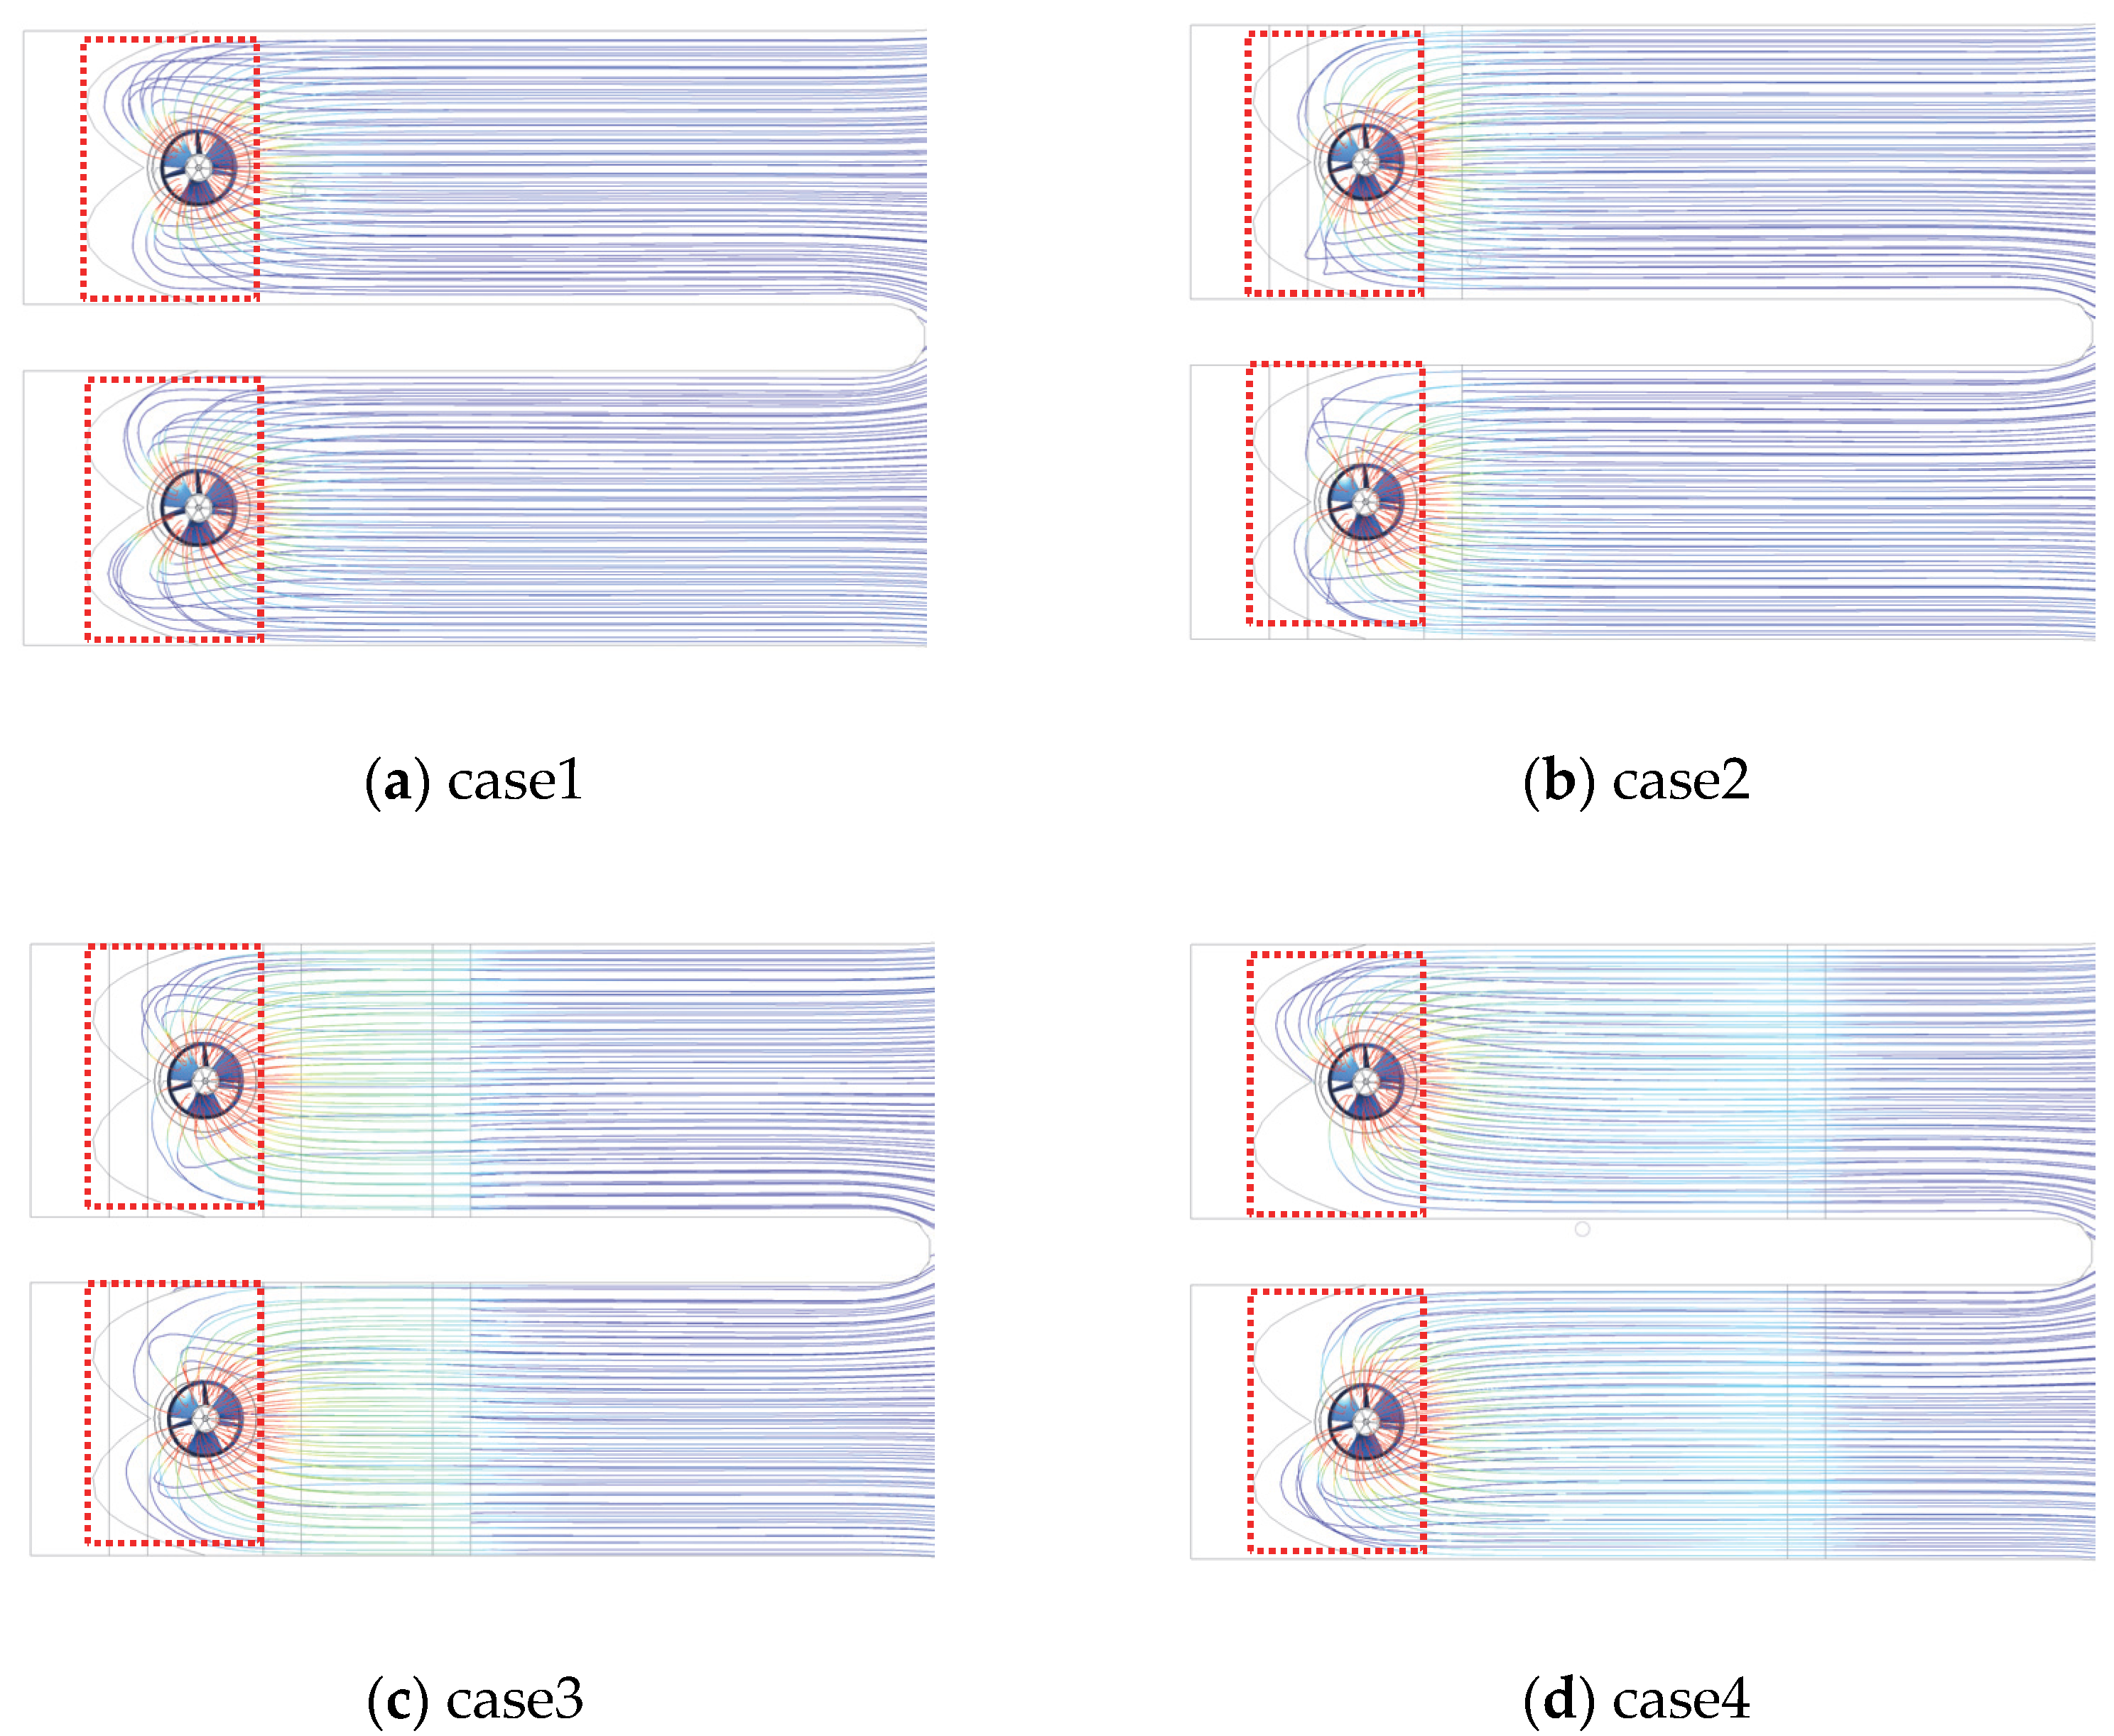
As seen from Figure 6a, when the sump is without the hydraulic structures, the flow pattern in the sump is stable and the streamline is smooth. However, due to the barrier effect of the wall at the back wall, it is easy to form backflow at the back wall.
As seen from Figure 6b, when the pump beam is added to the sump, the influence of the pump beam on the streamline and velocity distribution in the sump can be almost ignored. Since the water space at the ω-shaped back wall is squeezed, and the original water structure is broken after the pump beam is added, the backflow at the back wall is difficult to form and the velocity distribution is more uniform.
As seen from Figure 6c, when the maintenance platform is added to the sump, the velocity distribution in the sump becomes uneven, and the transverse vortex is easy to form under the maintenance platform at the inlet side. Since the vortex occurs close to the inlet of the pump, it is very easy to be sucked in by the pump, thus aggravating the cavitation of the pump and affecting the safe operation of the pump. After the maintenance platform is installed at the ω-shaped rear wall, although the maintenance platform also breaks the original water structure, it also blocks the flow of water, leading to more chaotic flow patterns.
As seen from Figure 6d, after the additional chest wall, there is a vortex after the chest wall, affected by the vertical extrusion of the chest wall, the water flow in the middle of the sump can only enter the flapper pipe from the front half of the inlet pipe together with the lower water flow, and the water flow in the near-wall area goes around to the back of the inlet pipe and forms a backflow in the platform above the ω-shaped back wall after the inlet pipe, which affects the stable operation of the pump.

4.2.2. Flow state analysis of bell mouth

The bell mouth is the only channel for water flow into the pump in the sump, so the flow state at the bell mouth directly affects the performance of the pump. Figure 7 shows the distribution of streamline at the bottom of the sump. It can be seen from Figure 7a that the water flow at the bottom of the sump enters the bell mouth evenly from around the bell mouth. The streamline distribution is relatively uniform. The overall water flow in the sump is stable without an adverse flow pattern. As shown in Figure 7b, when the pump beam is added to the sump, the flow pattern in the sump is almost unaffected. At this time, the water at the bell mouth is still evenly flowing into the bell mouth from around, but the streamline at the bell mouth is slightly disordered. As shown in Figure 7c, when the maintenance platform is added to the sump, the flow pattern distribution in the sump starts to become uneven, and the streamline at the inlet of the bell mouth starts to become disordered. As shown in Figure 7c, when the chest wall is added to the sump, the upper water flow in the sump will be disturbed greatly and the flow pattern will be uneven due to the water blocking of the chest wall. In particular, the water inlet state at the bell mouth changes from uniform water inlet in four directions to water inlet in three directions.
The uniformity of the velocity distribution and weighted velocity average swirl angle are important indexes to describe the flow pattern at the inlet of the bell mouth. The uniformity of the velocity distribution at the impeller inlet section is represented by the axial velocity distribution coefficient V u . The axial velocity distribution is best when its coefficient is closer to 100%. The following formula is used to calculate V u :
V u = [ 1 1 v a ¯ ( v a i v a ¯ ) 2 m ] × 100 %
where v a i is the axial velocity of each element of the calculated section (m/s), v a ¯ is the averaged axial velocity of the calculated section (m/s), and m is the number of cells of the calculated section.
The weighted velocity average swirl angle θ ¯ is used to measure the inflow conditions of the impeller. The flow angle perpendicular to the impeller inlet section is better when θ ¯ is closer to 90°. The following formula is used to calculate θ ¯ :
θ ¯ = i = 1 n [ v a i ( 90 arctan v t i v a i ) ] i = 1 n v a i
where v t i is the tangential velocity of each element of the calculated section (m/s).
Figure 8 shows the uniformity of the velocity distribution and the weighted velocity average swirl angle of the bell mouth inlet for different cases at design flow rates, from which it can be seen that:
The addition of structures in the sump has an obvious influence on the weighted average angle at the inlet of the bell mouth, but has little influence on the velocity distribution at the inlet of the bell mouth. This is also consistent with the previous research results. Compared with the prototype case, the weighted average angle of the other three cases has a significant decrease, which indicates that the addition of the structure will have a certain impact on flow pattern of the sump, which may cause some hydraulic losses. Unlike flow uniformity, adding structures in the sump will affect the weighted average angle of the bell mouth inlet. The weighted average angle of 86.80° for the prototype case, 73.30° for case 2e, 73.19° for case 3, and 73.17° for case 4. The installation of structures in the sump has little impact on the velocity distribution, but has a greater impact on the angle of the pumped water flow. This is mainly because the installation of structures will break the original water structure, hinder the flow of water, and cause the angle of the pumped water flow to deflect.

4.3. Entropy Production

4.3.1. Entropy Production Distribution Characteristic

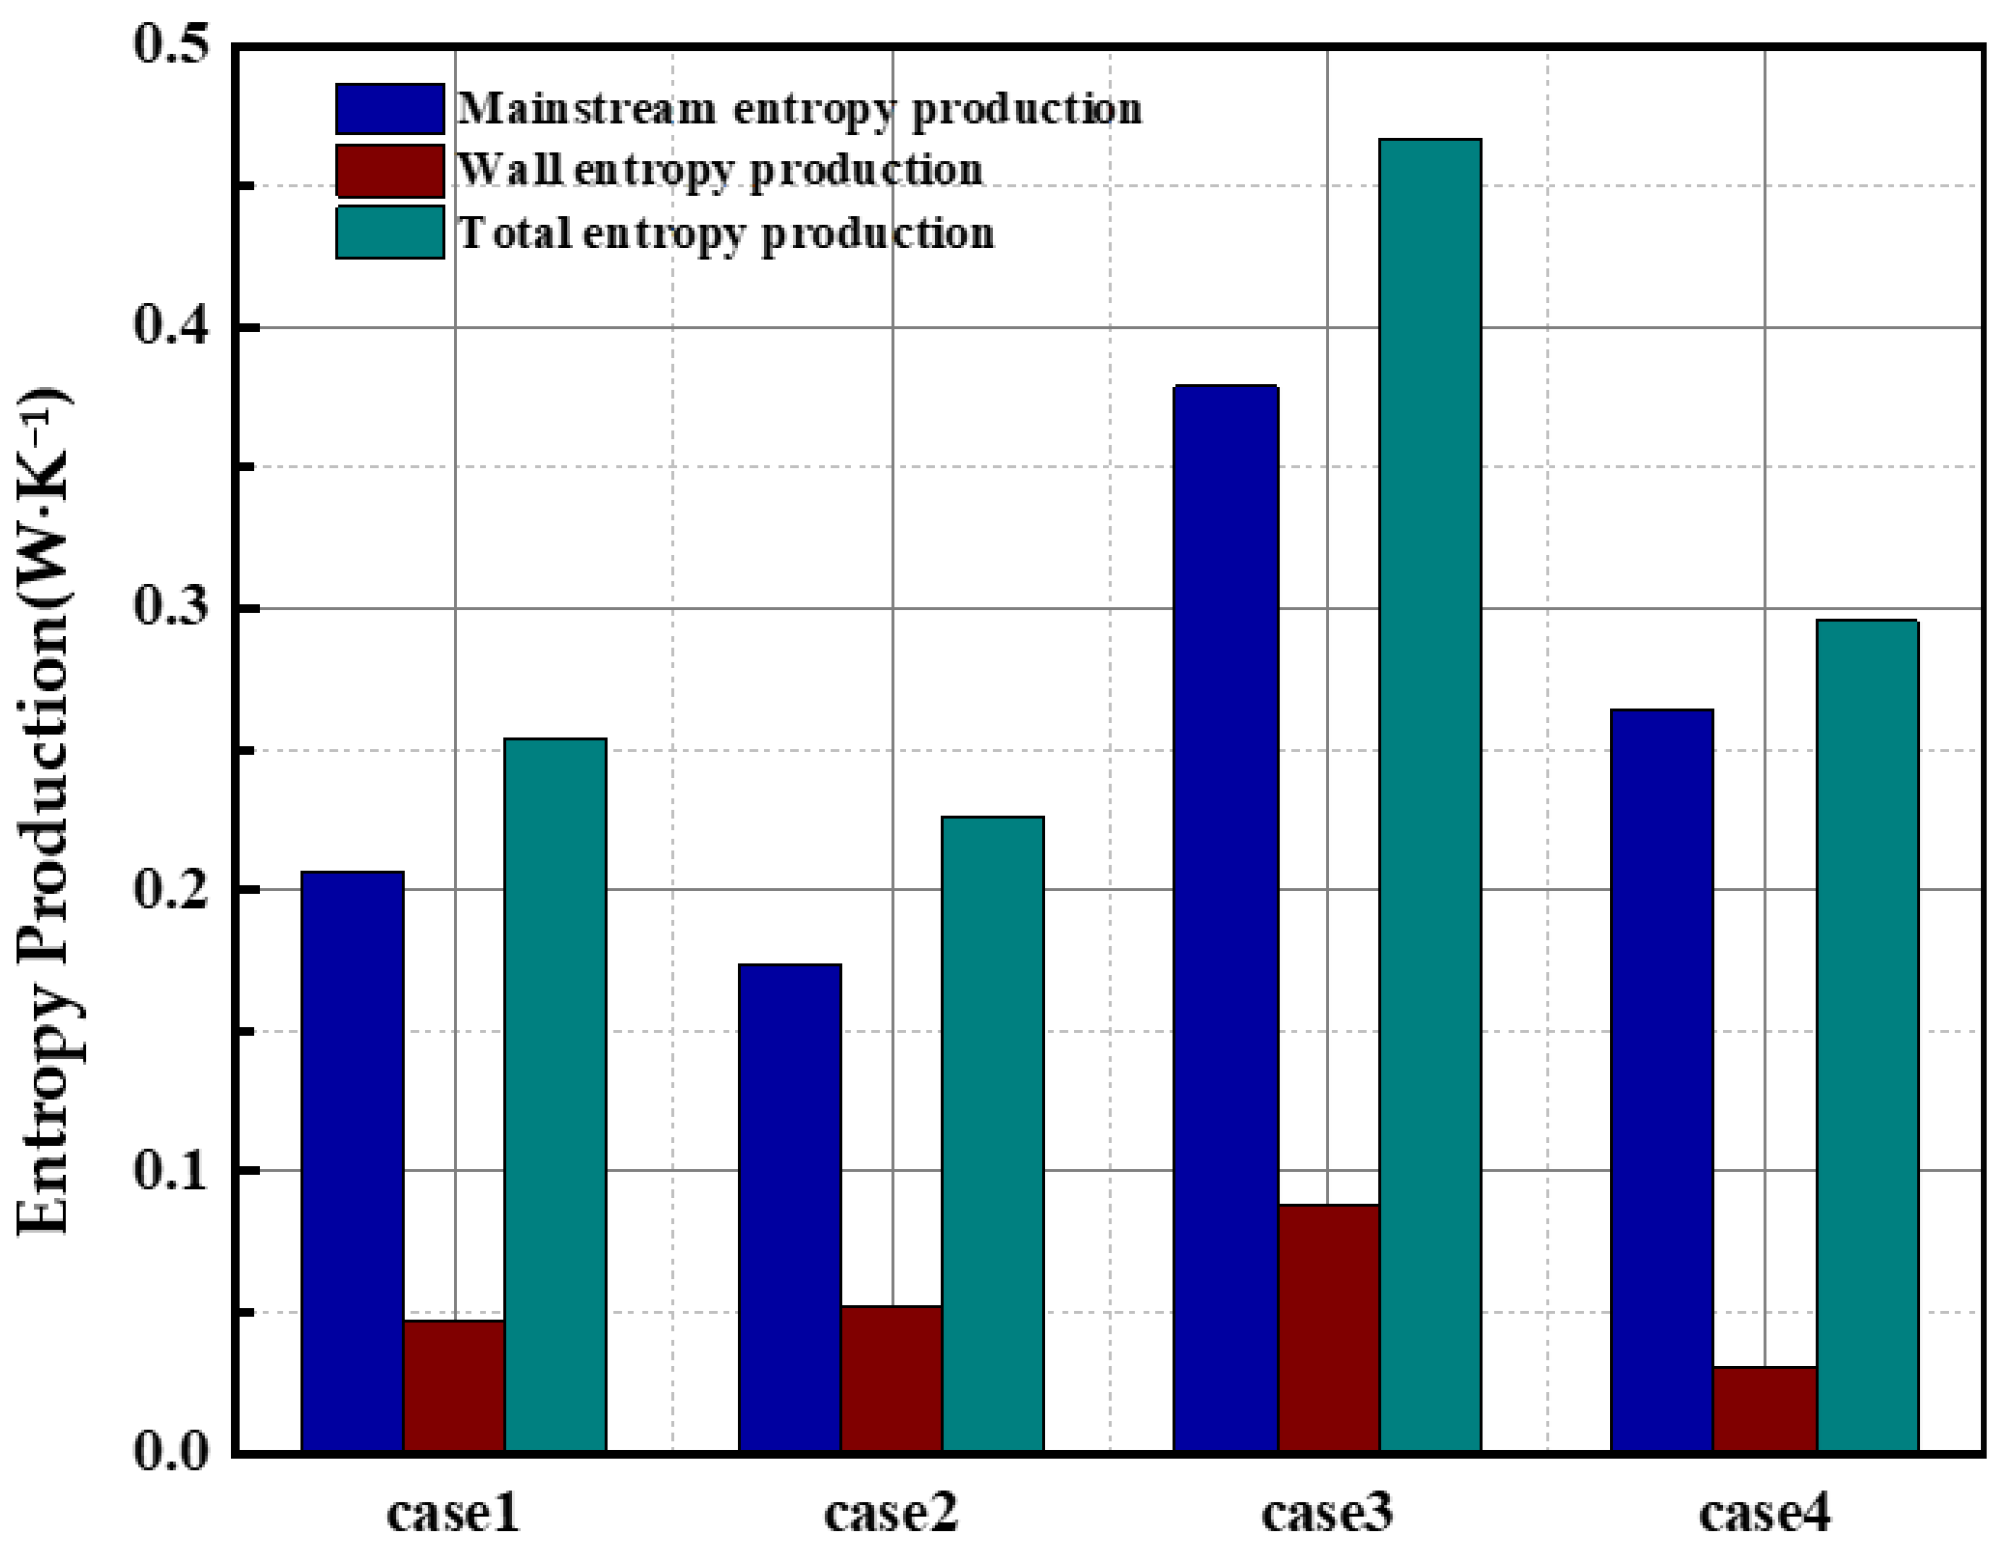
Figure 9 shows the entropy production of various cases in the sump under the designed flow rate. From Figure 9, it can be seen that the total entropy production of case 2 is slightly smaller than that of the prototype, the total entropy production of case 3 is significantly larger than that of the prototype, and the total entropy production of case 4 is slightly increased compared with that of the prototype. It indicates that adding pump beams in the sump will reduce the energy loss in the sump, while adding maintenance platforms and water retaining chest walls in the sump will increase the energy loss in the sump.
The reasons for the change in entropy production are further analyzed according to Table 1. The total entropy production value of case 2 is 0.28 W·K−1 lower than that of the prototype case, in which the direct dissipation entropy production and turbulent energy dissipation entropy production are slightly reduced compared to the prototype case, but the wall dissipation entropy production increases compared to the prototype case. With the addition of the pump beam, the turbulent flow losses in the sump are reduced, but the entropy production from the friction between the water flow and the wall surface is increased. The entropy production of all parts of case 3 increased significantly compared to the prototype case, which indicates that the addition of an access platform in the sump has a greater impact on the energy loss in the sump. The total entropy production value of case 4 is slightly greater than the prototype case, in which the direct dissipation entropy production is smaller than the prototype case, and the turbulent motion entropy production and wall entropy production are greater than the prototype case, which indicates that the additional water retaining chest wall in the sump has a certain effect on the flow loss in the sump.
In order to further explore the energy loss under the design flow, the entropy production ratio of each category in the sump under the four cases of prototype cases, additional pump beam, additional maintenance platform, and additional water retaining chest wall pump were analyzed respectively. It can be seen from Figure 10 that the direct dissipation entropy production ratio of all four cases is the lowest, below 1%, and the turbulent dissipation entropy production ratio is the largest, above 75%. The direct dissipation percentage of the prototype case is 0.71%, which is larger than 0.68% of case 2, 0.41% of case 3 and 0.42% of case 4. The wall entropy production ratio varies widely, with the largest wall entropy production ratio of 23.09% for case 2, close to that of case 3 and the prototype case, and the smallest wall entropy production ratio of 10.49% for case 4. The turbulent dissipative entropy production of case 4 is the largest, 8.52% higher than that of the prototype case, the dissipative entropy production of cases 1 and 3 are similar, and the turbulent dissipative entropy production of case 2 is 76.23%, which is 4.34% less than that of the prototype case.

4.3.2. Internal Flow Characteristics

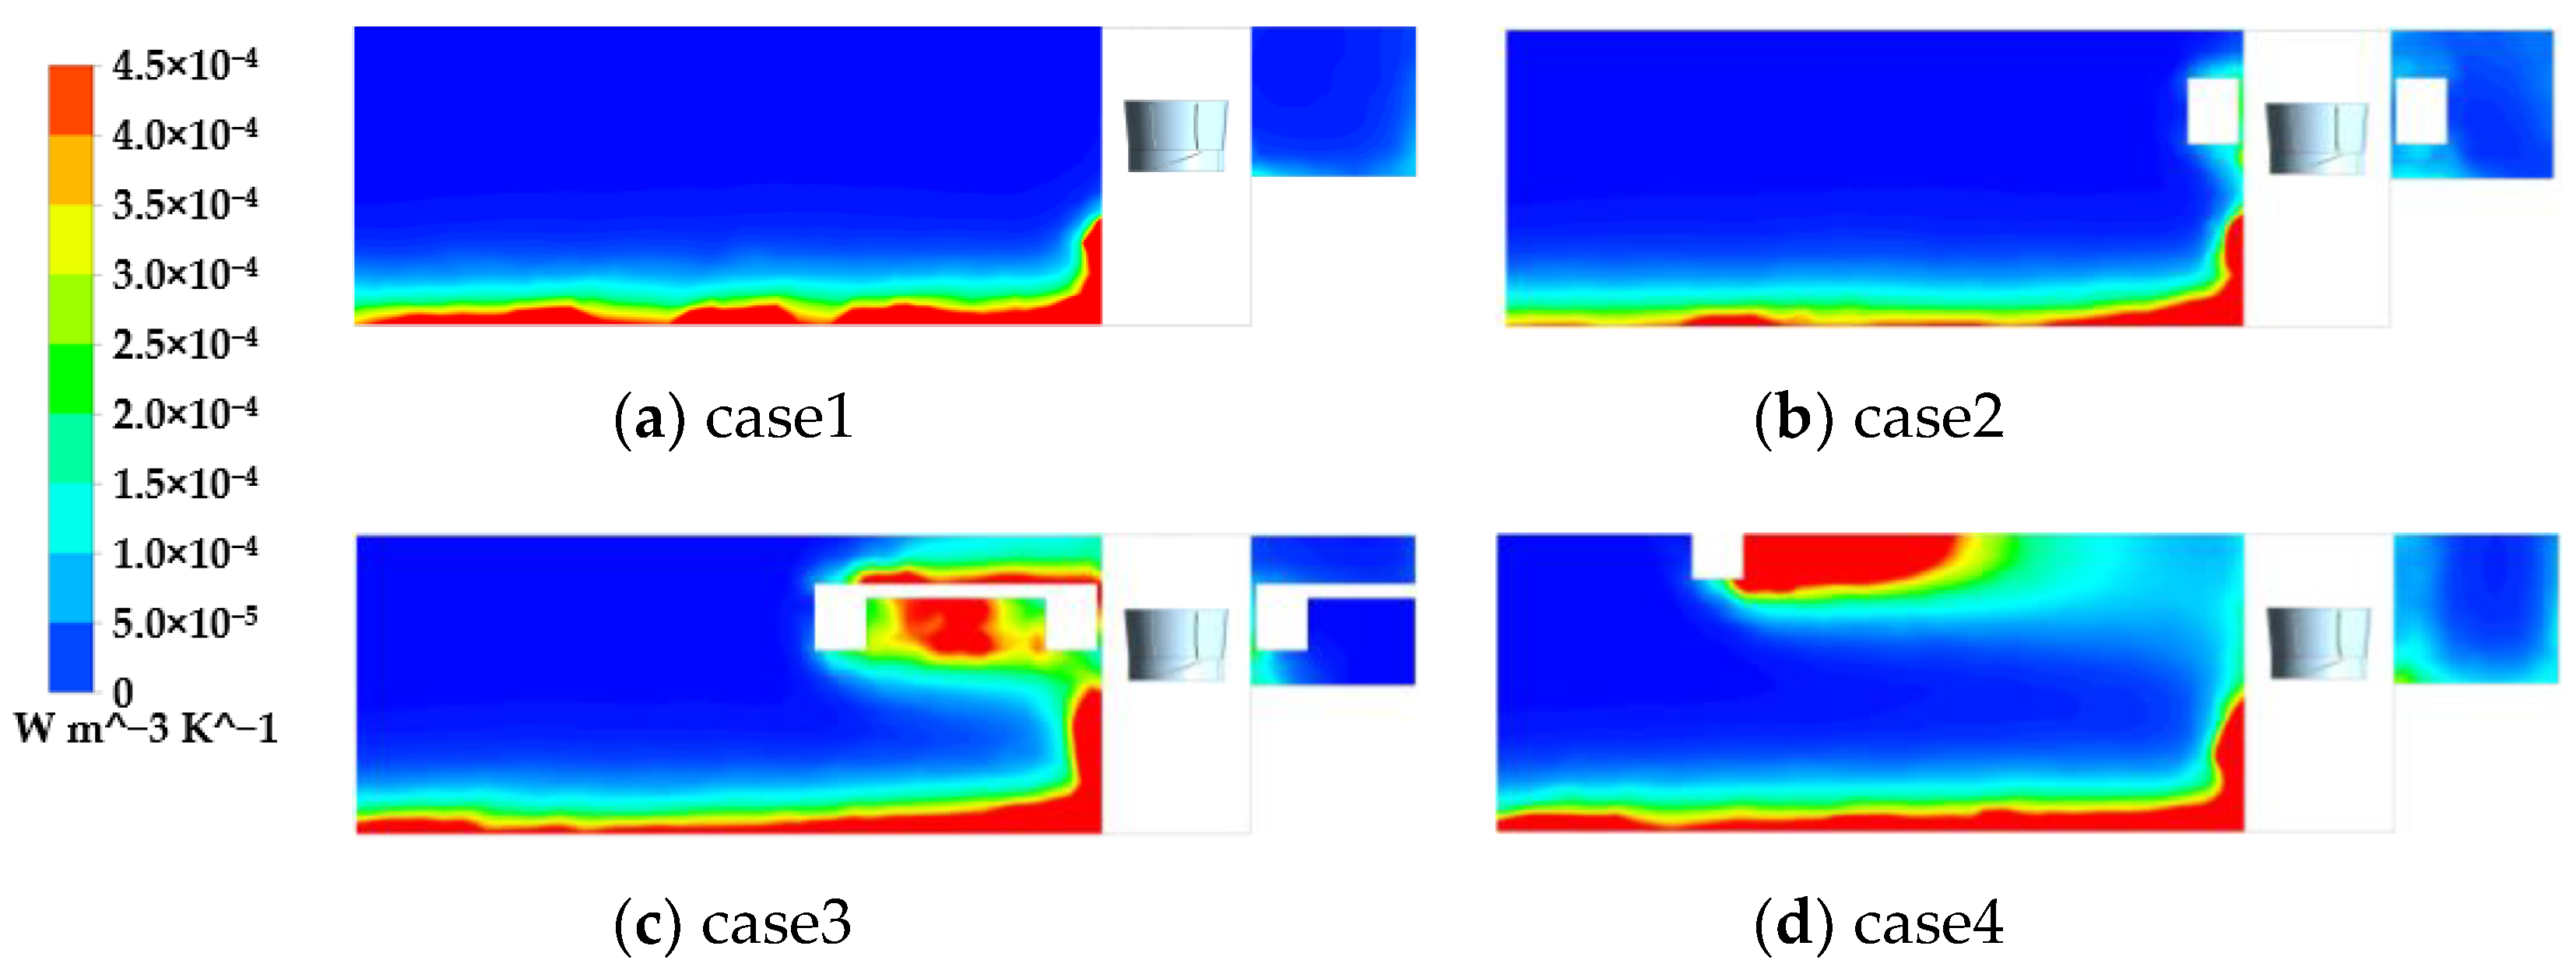
To further investigate the entropy production distribution inside the sump, the entropy production inside the sump and impeller of the four cases were further analyzed under the design working conditions. From Figure 11a, the entropy production distribution inside the sump is more uniform when the structures inside the sump are not increased, and the location of the local high entropy production area is mainly concentrated in the bottom location of the sump. From Figure 11b, it can be seen that after adding the pump beam, a local high entropy production region appears behind the pump beam on the inlet side, in addition to a local increase in entropy production at the pump beam at the ω-shaped back wall. As can be seen in Figure 11c, after the addition of the access platform, localized high entropy production regions appear above and below the access platform on the inlet side. As shown in Figure 11d, after adding the water retaining chest wall in the sump, a more regular localized high entropy production area appears after the chest wall by the extrusion of the water retaining chest wall. As seen above, adding structures to the sump will impact the entropy production distribution in the sump, and the high entropy production area is mainly concentrated in the front and rear of the structures.
Figure 12 and Figure 13 shows the entropy production at the hub and rim of the impeller under the design working condition. The figure shows that the high entropy production area at the hub is mainly concentrated in the front and middle of the suction surface, and the high entropy production area at the wheel rim is consistent with that at the hub. The distribution of entropy production at the wheel rim and the wheel hub is approximately the same for cases 1 to 4, which indicates that the addition of structures in the sump has no effect on the distribution of entropy production at the impeller, and the entropy production at the impeller is mainly related to the rotation of the impeller itself.

5. Conclusions

The sump is one of the common types of agricultural irrigation pumping stations. In this paper, the numerical simulation method is used to study the influence of hydraulic structures on the hydraulic characteristics and entropy generation characteristics of the pump device. The conclusions are summarized as follows:
(1) The installation of hydraulic structures in the sump of the pumping station has a certain impact on the hydraulic performance of the pump device. The pump beam installed in the sump plays a role of rectification to a certain extent, and the size of the pump beam is relatively small, so its impact on the hydraulic performance of the pump device can be ignored. However, the maintenance platform and chest wall have a great impact on the flow pattern in the sump and the hydraulic performance of the pump device;
(2) The installation of hydraulic structures in the sump of the pumping station has obvious effect on the flow pattern in the sump. The installation of hydraulic structures will have adverse effects on the velocity uniformity and weighted average angle of flow at the bell mouth in the sump. Moreover, the installation of the maintenance platform and chest wall will directly affect the inlet flow pattern of the bell mouth;
(3) The installation of hydraulic structures in the sump will lead to uneven distribution of entropy generation in the sump, especially in the vicinity of hydraulic structures. The installation of the maintenance platform and chest wall will lead to the increase of the total entropy generation in the sump, which also means that the hydraulic loss in the sump will increase accordingly.
Therefore, comprehensive consideration of the impact mentioned above, in addition to the arrangement of the necessary pump beam indicates that the set-up of a maintenance platform and chest wall in the sump should be avoided.

Author Contributions

Software, Z.L and W.J.; validation, Y.W. and W.J.; formal analysis, Z.L., B.Z. and W.J.; data curation, B.Z. and L.C.; writing—original draft preparation, Z.L. and W.J.; Funding acquisition, L.C.; writing—review and editing, L.C. and W.J. All authors have read and agreed to the published version of the manuscript.

Funding

This research was supported by the National Natural Science Foundation of China (Grant No: 52279091).

Institutional Review Board Statement

Not applicable.

Data Availability Statement

Not applicable.

Conflicts of Interest

The authors declare no conflict of interest.

References

  1. Constantinescu, S.G.; Patel, V.C. Numerical model for simulation of pump-intake flow and vortices. J. Hydraul. Eng. 1998, 125, 123–134. [Google Scholar] [CrossRef]
  2. Wang, F.J.; Li, Y.J.; Cong, G.H. CFD simulation of 3D flow in large-bore axial-flow pump with half-elbow suction sump. J. Hydrodyn. Ser. B 2006, 18, 243–247. [Google Scholar]
  3. Xi, W.; Lu, W.G. Formation mechanism of an adherent vortex in the side pump sump of a pumping station. Int. J. Simul. Model. 2021, 20, 327–338. [Google Scholar] [CrossRef]
  4. Padmanabhan, M.; Hecker, G.E. Scale effects in pump summodels. J. Hydraul. Eng. ASCE 1984, 110, 1540–1556. [Google Scholar] [CrossRef]
  5. Denny, D.F. An experimental study of air-entraining vortices in pump sumps∥IMechE. Proc. Inst. Mech. Eng. 1956, 170, 106–116. [Google Scholar] [CrossRef]
  6. Ansar, M.; Tatsuaki, N. Experimental study of 3D pump intake flows with and without cross flow. J. Hydraul. Eng. 2001, 127, 825–834. [Google Scholar] [CrossRef]
  7. Liu, C.; Li, D.; Zhou, J.; Tang, F. Application of 3D-PIV to the flow measurements in pump sump. In Proceedings of the ASME/JSME 2007 5th Joint ASME/JSME Fluids Engineering Conference, San Diego, CA, USA, 30 July–2 August 2007. [Google Scholar]
  8. Jiao, W.X.; Chen, H.J.; Cheng, L.; Zhang, B.W.; Yang, Y.; Luo, C. Experimental study on flow evolution and pressure fluctuation characteristics of the underwater suction vortex of water jet propulsion pump unit in shallow water. Ocean Eng. 2022, 266, 112569. [Google Scholar] [CrossRef]
  9. Helios, M.P.; Asvapoositkul, W. Numerical studies for effect of geometrical parameters on water jet pump performance via entropy generation analysis. J. Mech. Eng. Sci. 2021, 15, 8319–8331. [Google Scholar] [CrossRef]
  10. Yang, F.; Li, Z.; Hu, W.; Liu, C.; Jiang, D.; Liu, D.; Nasr, A. Analysis of flow loss characteristics of slanted axial-flow pump device based on entropy production theory. R. Soc. Open Sci. 2022, 9, 208–211. [Google Scholar] [CrossRef]
  11. Pei, J.; Meng, F.; Li, Y.J.; Yuan, S.Q.; Chen, J. Effects of distance between impeller and guide vane on losses in a low head pump by entropy production analysis. Adv. Mech. Eng. 2016, 8, 2071837044. [Google Scholar] [CrossRef] [Green Version]
  12. Kock, F.; Herwig, H. Local entropy production in turbulent shear flows a high-Reynolds number model with wall functions. Int. J. Heat Mass Transf. 2004, 47, 2205–2215. [Google Scholar] [CrossRef]
  13. Zhou, L.; Hang, J.; Bai, L.; Krzemianowski, Z.; El-Emam, M.A.; Yasser, E.; Agarwal, R. Application of entropy production theory for energy losses and other investigation in pumps and turbines: A review. Appl. Energy 2022, 318, 119211. [Google Scholar] [CrossRef]
  14. Hou, H.; Zhang, Y.; Zhou, X.; Zuo, Z.; Chen, H. Optimal hydraulic design of an ultra-low specific speed centrifugal pump based on the local entropy production theory. Proceedings of the Institution of Mechanical Engineers, Part A. J. Power Energy 2019, 233, 715–726. [Google Scholar] [CrossRef]
  15. McEligot, D.M.; Nolan, K.P.; Walsh, E.J.; Laurien, E. Effects of pressure gradients on entropy generation in the viscous layers of turbulent wall flows. Int. J. Heat Mass Transf. 2008, 51, 1104–1114. [Google Scholar] [CrossRef]
  16. Ghasemi, E.; McEligot, D.M.; Nolan, K.P.; Crepeau, J. Entropy generation in a transitional boundary layer region under the influence of freestream turbulence using transitional RANS models and DNS. Int. Commun. Heat Mass Transf. 2013, 41, 10–16. [Google Scholar] [CrossRef]
  17. Guan, H.; Jiang, W.; Yang, J.; Wang, Y.; Zhao, X.; Wang, J. Energy loss analysis of the double-suction centrifugal pump under different flow rates based on entropy production theory. Proceedings of the Institution of Mechanical Engineers, Part C. J. Mech. Eng. Sci. 2020, 234, 4009–4023. [Google Scholar] [CrossRef]
  18. Lin, T.; Li, X.; Zhu, Z.; Xie, J.; Li, Y.; Yang, H. Application of enstrophy dissipation to analyze energy loss in a centrifugal pump as turbine. Renew. Energy 2021, 163, 41–55. [Google Scholar] [CrossRef]
  19. Yu, A.; Tang, Y.; Tang, Q.; Cai, J.; Zhao, L.; Ge, X. Energy analysis of Francis turbine for various mass flow rate conditions based on entropy production theory. Renew. Energy 2022, 183, 447–458. [Google Scholar] [CrossRef]
  20. Li, D.; Gong, R.; Wang, H.; Xiang, G.; Wei, X.; Qin, D. Entropy production analysis for hump characteristics of a pump turbine model. Chin. J. Mech. Eng. 2016, 29, 803–812. [Google Scholar] [CrossRef]
  21. Zhang, D.; Katayama, Y.; Watanabe, S.; Tsuda, S.I.; Furukawa, A. Numerical study on loss mechanism in rear rotor of contra-rotating axial flow pump. Int. J. Fluid Mach. Syst. 2020, 13, 241–252. [Google Scholar] [CrossRef]
  22. Yang, F.; Chang, P.; Cai, Y.; Lin, Z.; Tang, F.; Lv, Y. Analysis of Energy Loss Characteristics of Vertical Axial Flow Pump Based on Entropy Production Method under Partial Conditions. Entropy 2022, 24, 1200. [Google Scholar] [CrossRef] [PubMed]
  23. Cheng, X.; Wang, P.; Zhang, S. Investigation on matching characteristics of nuclear main pump guide vanes and annular casing. J. Braz. Soc. Mech. Sci. Eng. 2019, 41, 353. [Google Scholar] [CrossRef] [Green Version]
  24. Ji, Q.; Wu, G.; Liao, W.; Fan, H. Flow Deflection between Guide Vanes in a Pump Turbine Operating in Pump Mode with a Slight Opening. Energies 2022, 15, 1548. [Google Scholar] [CrossRef]
  25. Zhang, R.; Tan, S.; Ding, X.; Xu, H.; Feng, J.; Mou, T.; Fei, Z. Flow loss characteristics of vertical shaft cross-flow pump based on entropy production theory. Adv. Sci. Technol. Water 2022, 3, 9–11. [Google Scholar]
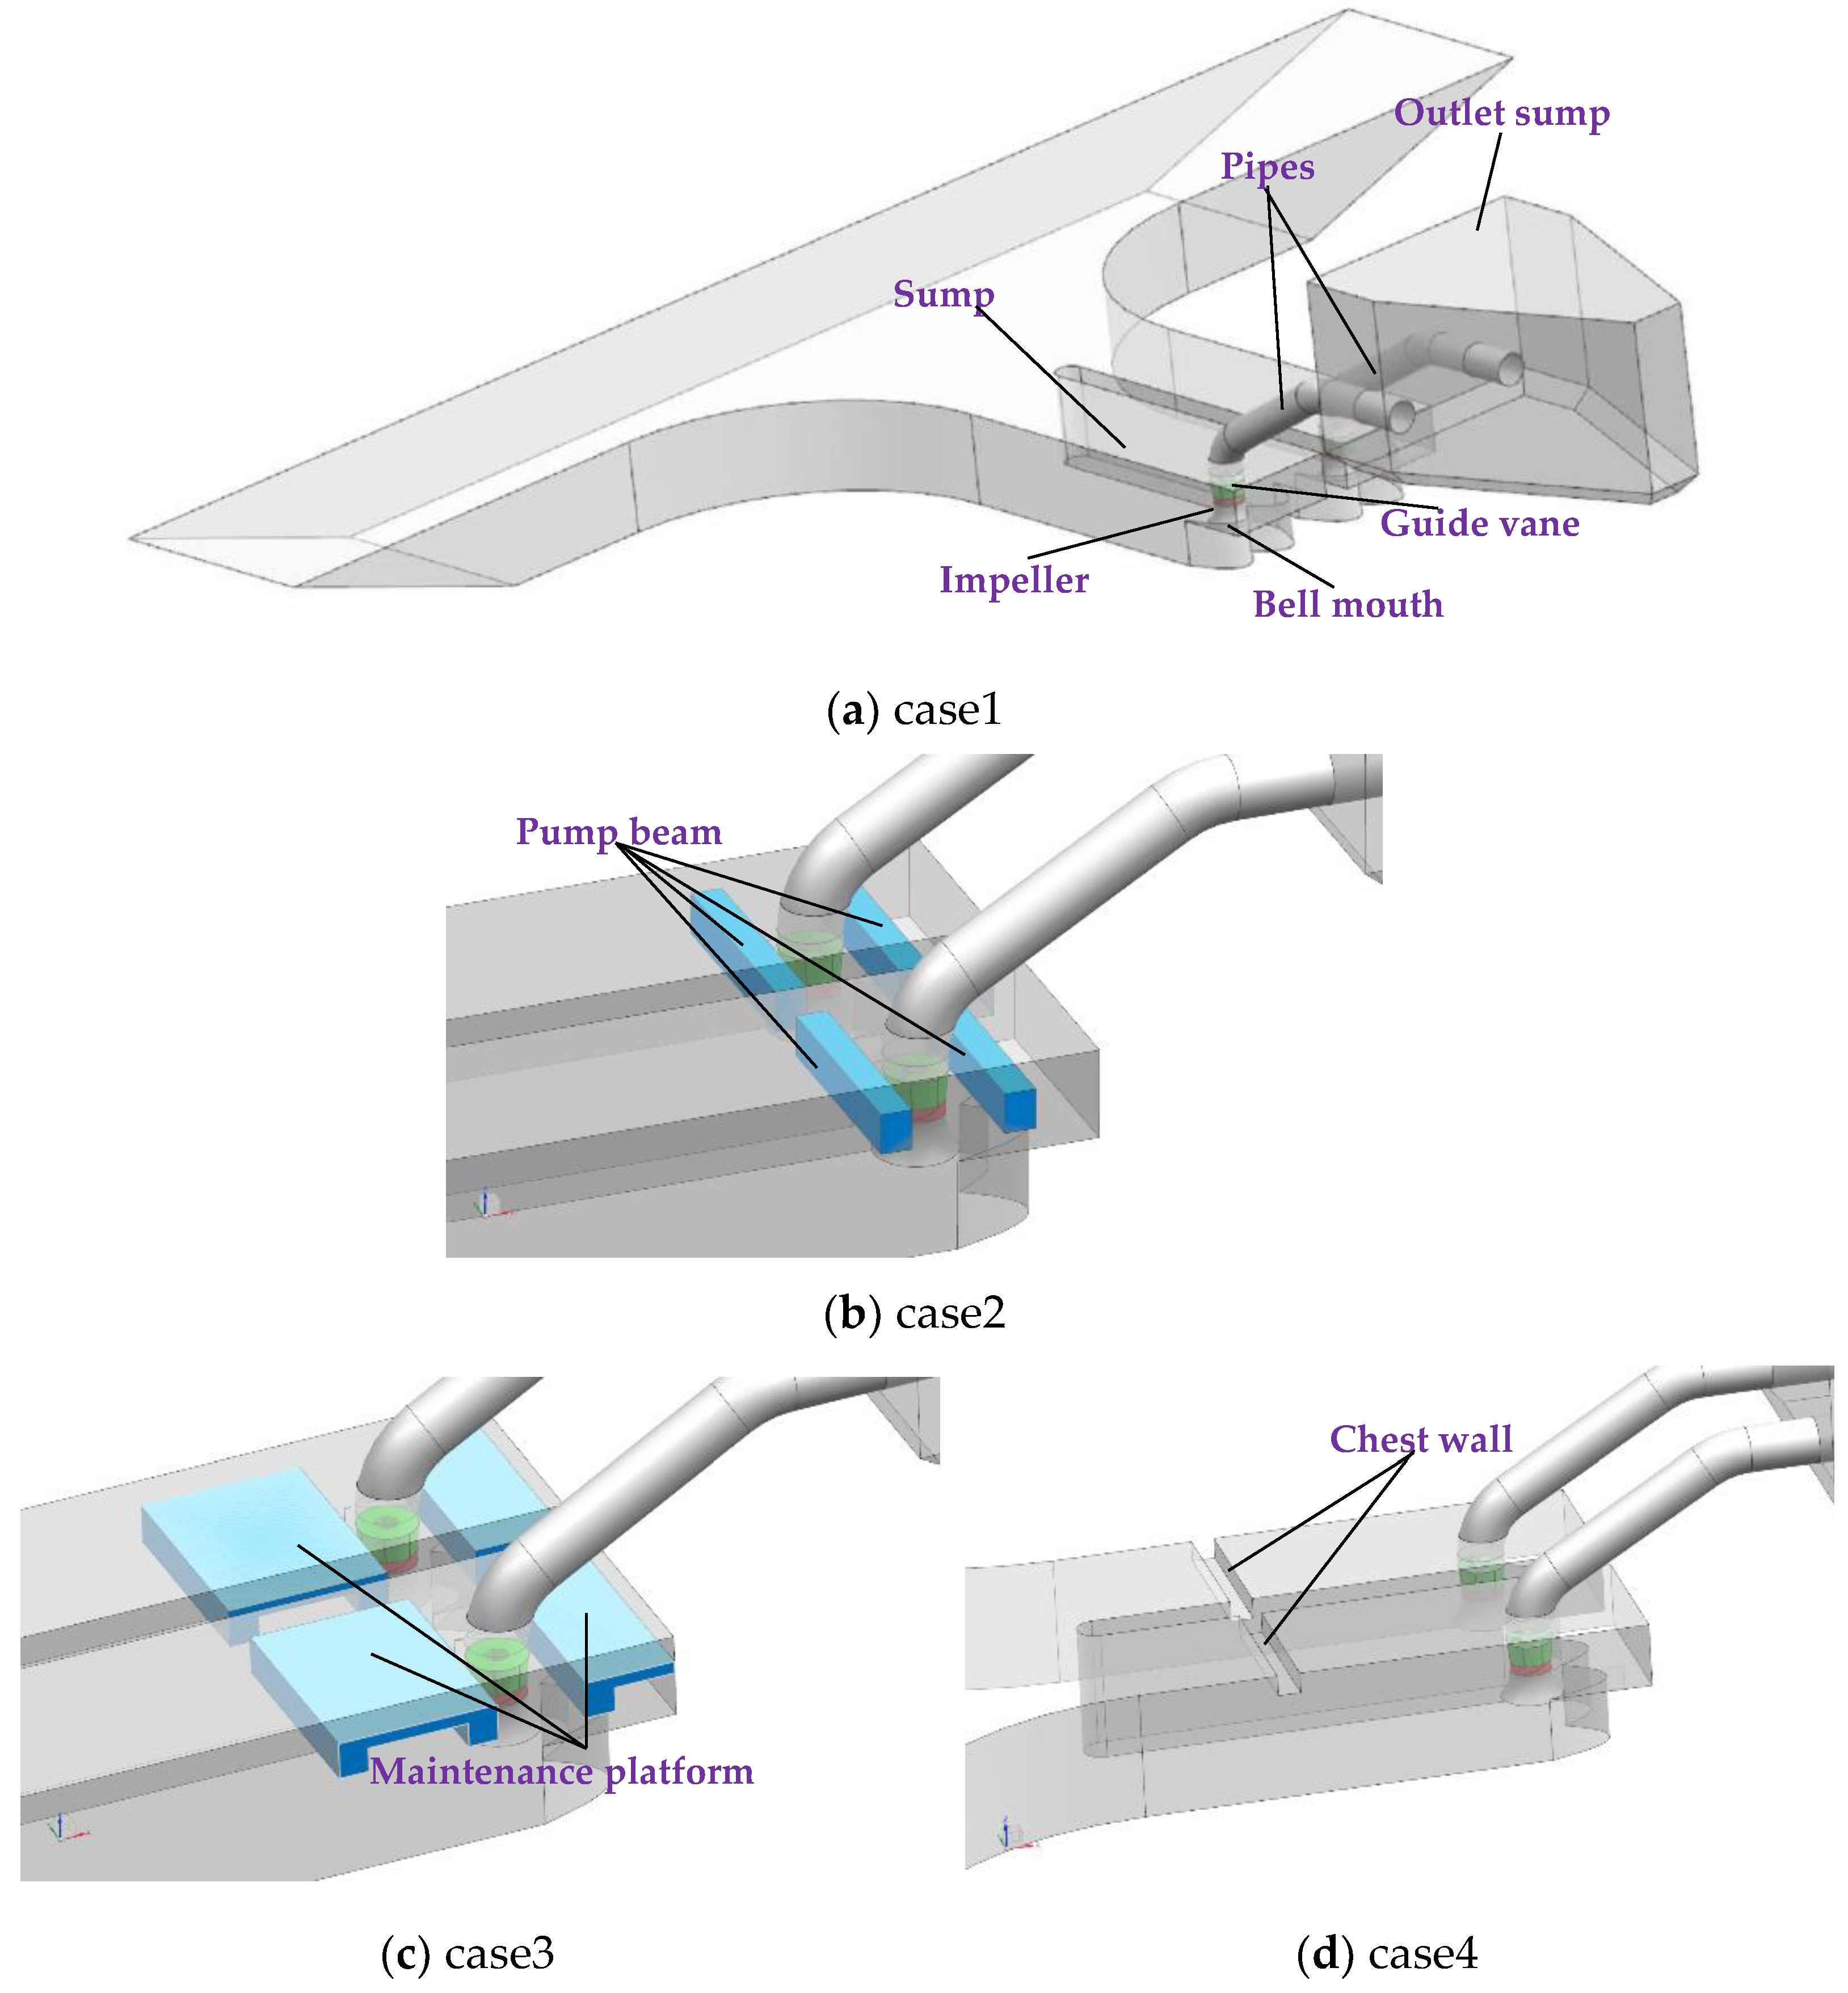
Figure 1. Design case of entering sump structure.
Agriculture 12 01770 g001
Figure 2. Grid division.
Agriculture 12 01770 g002
Figure 3. Grid independence analysis.
Agriculture 12 01770 g003
Figure 4. Efficiency ~ flow rate curves.
Agriculture 12 01770 g004
Figure 5. Head ~ flow rate curves.
Agriculture 12 01770 g005
Figure 6. Contour of velocity distribution in longitudinal profile of the sump.
Agriculture 12 01770 g006
Figure 7. Streamlines distribution in the sump under different cases.
Agriculture 12 01770 g007aAgriculture 12 01770 g007b
Figure 8. The uniformity of the velocity distribution and weighted velocity average swirl angle at the bell mouth inlet.
Agriculture 12 01770 g008
Figure 9. Dissipation entropy production value of each case.
Agriculture 12 01770 g009
Figure 10. Percentage of entropy production by type.
Agriculture 12 01770 g010
Figure 11. Contour of entropy production distribution in longitudinal section.
Agriculture 12 01770 g011
Figure 12. Entropy production contour at the hub.
Agriculture 12 01770 g012
Figure 13. Entropy production contour at the rim.
Agriculture 12 01770 g013
Table 1. Dissipation entropy production of each case.
CaseEntropy Production Value (W·K−1)
Direct Dissipation Entropy
Production S
Turbulent Energy Dissipation
Entropy
Production S
Wall Dissipation Entropy
Production S
Total Entropy
Production
11.81 × 10−30.205 0.048 0.254
21.54 × 10−30.172 0.052 0.226
31.92 × 10−30.377 0.088 0.467
41.23 × 10−30.263 0.031 0.295
Publisher’s Note: MDPI stays neutral with regard to jurisdictional claims in published maps and institutional affiliations.