Article

Technical Efficiency and Economic Analysis of Rice Crop in Khyber Pakhtunkhwa: A Stochastic Frontier Approach

1
Department of Agricultural & Applied Economics, The University of Agriculture, Peshawar 25120, Pakistan
2
Paul Engler College of Agriculture & Natural Sciences, West Texas A&M University, Canyon, TX 79015, USA
3
International Institute of Islamic Economics (IIIE), International Islamic University, Islamabad 44000, Pakistan
*
Author to whom correspondence should be addressed.
Agriculture 2022, 12(4), 503; https://doi.org/10.3390/agriculture12040503
Submission received: 21 January 2022 / Revised: 24 March 2022 / Accepted: 30 March 2022 / Published: 2 April 2022
(This article belongs to the Special Issue Agricultural Food Security and Economic Analysis)

Abstract

:
Pakistan is one of the world’s leading producers, exporters, and consumers of rice. This study analyzes the technical efficiency of rice growing farmers in the Swat district of the Khyber Pakhtunkhwa province of Pakistan. A three-stage sampling procedure was used to interview 204 rice growers through a well-structured and pretested interview schedule. The maximum likelihood function results showed that chemicals, urea, diammonium phosphate (DAP), labor, and farmyard manure (FYM-dummy) were positive and had a statistically significant effect on rice yield; this implies that a 1% increase in chemicals, urea, DAP, labor, and FYM leads to an increase in rice production by 0.22%, 0.25%, 0.02%, 0.03%, and 0.01%, respectively. The estimated results of model 2 reported that respondents’ age had a positive significant effect on inefficiency, showing that with a rise in farmers’ age, the farmers’ inefficiency significantly increased. The education and experience of farmers were negative and significant, implying that these variables significantly decreased the farmers’ inefficiency. Furthermore, the results showed the mean technical efficiency as 87%, with a minimum of 66% and a maximum of 99%. The study recommends that the extension department needs to arrange training programs for the rice growers in this specific area to boost rice yield, enhance agronomic skills, and facilitate these farmers with the technical knowledge for efficient production.

1. Introduction

Agriculture is a vital economic sector that provides food to human beings, which is required for their survival on earth. Besides food, it provides raw material to different industries, and thus plays a crucial role in the economic growth and development of a country. Pakistan is an agricultural country, and therefore agriculture contributes about 19.3% to its GDP (gross domestic product) and most of its exported commodities are agricultural products [1].
Pakistan has two cropping seasons, Rabi and Kharif. In Kharif season, generally, sowing starts in the last few days of April and early May, and ends in late October and early November. In Rabi season, sowing usually starts in late November and early December, and ends in the months of March and April. Cotton, maize, sugarcane and rice are the main Kharif crops, while wheat, tobacco, mustard and barley are Rabi season crops [2].
Rice with the botanical name Oryza sativa L. is one of the major Kharif crops in Pakistan. It belongs to the grass family “Graminae”, and after corn is the second most important staple food for the world population. One hundred grams of rice contains 130 calories, 69% water, 2.4 g of proteins, and 28.7 g of carbohydrates. It also provides necessary vitamins including thiamin, riboflavin, and niacin [3,4].
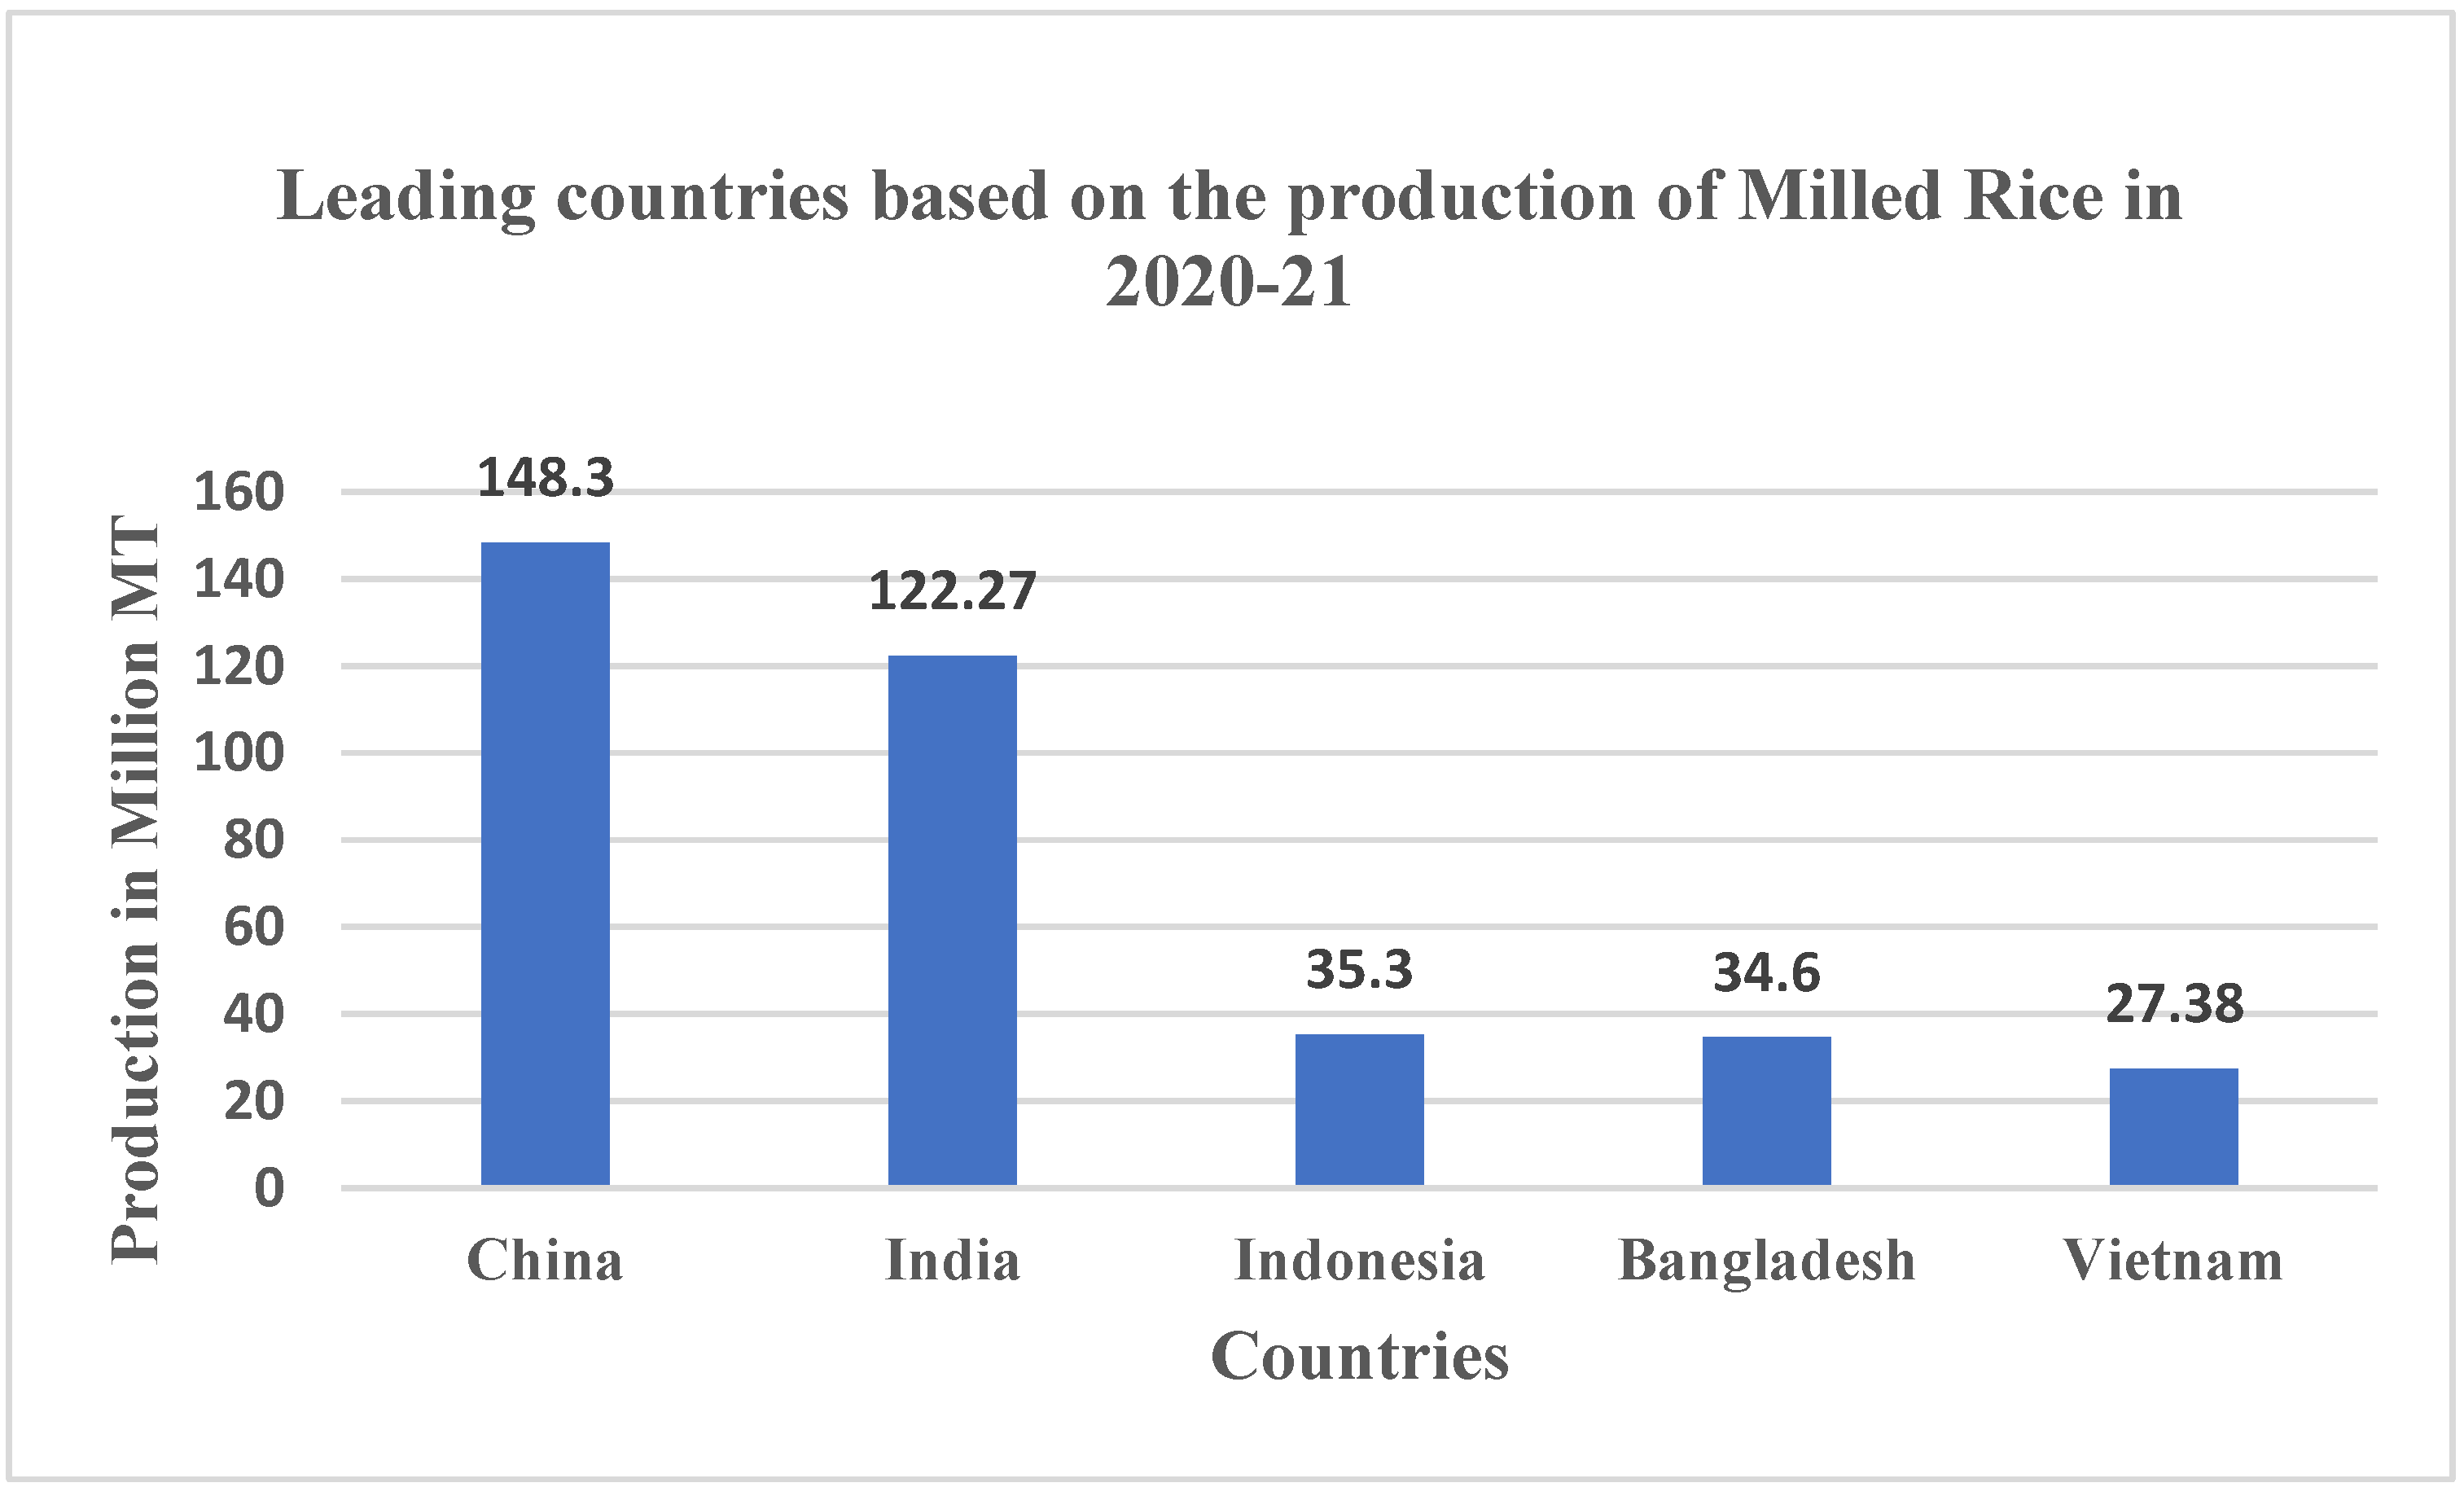
World rice production was estimated at 496.40 million tons in 2020. China is the world’s largest rice producer, accounting for up to 30% of global rice production. Its production is the highest in Asia, with an average of 6.5 tonnes per hectare [1]. The five largest rice producers, as well as rice consuming countries, are Vietnam, Bangladesh, India, China, and Indonesia. In 2020–2021, milled rice production amounted to 34.6 million metric tonnes (MT) in Bangladesh, 122.27 million MT in India, 148.3 million MT in China, 35.3 million MT in Indonesia, and 27.38 million MT in Vietnam (See Figure 1).
Pakistan comes 10th in the ranking of rice production. In Pakistan, rice was grown on a total of 3.034 million hectares of land with an overall production of 7.410 tons (millions) and an average yield of 2442 kg per hectare [3]. Punjab is the top rice-producing province of Pakistan. In the period 2017–2018, its production was 3475.0 thousand tons on an area of 1840.9 thousand hectares with an average yield of 1888 kg per hectare. In terms of yield per hectare, Sindh (3441 kg/Ha) and Baluchistan (3262 kg/Ha) were ranked first and second, respectively. In Khyber Pakhtunkhwa, the overall production (147.5 thousand tons) and yield (2394 kg per hectare) for rice are low, despite having fertile soil and plenty of freshwater for irrigation [2]. Lower production in the province may be somewhat due to the decrease in the agricultural lands because of growing population or due to use of traditional farming practices instead of modern technology. The majority of farming societies in the province are unable to implement modern and up-to-date agricultural resources due to their higher prices and lack of sufficient funds to finance agriculture. Hence, to increase rice productivity in such areas, it is essential that farmers are able to utilize their existing farm resources efficiently by improving their technicality and efficiency (technical efficiency) in farming.
The concept of technical efficiency was first time proposed by [5]. This method was introduced for the first time to measure and enlighten the technical efficiency of individuals in a production process. According to [5,6,7], technical efficiency simply measures the deviation of a farm on isoquant from the best producer of a group and generally reflects a farm’s ability and expertise to accomplish the maximum output using the available resources and technology, without discussing the relative market prices of the input or output. Technical efficiency does not consider market prices, but only the amount of used resources and gained output. Its performance is related to the socioeconomic features of the farm, such as age, experience, education, etc. Therefore, these factors make an individual aware of all the necessary elements that are required in a production process [8,9,10]. Improving these characteristics improves technical efficiency and ultimately leads to higher productivity [11].
In the Swat district of the Khyber Pakhtunkhwa province, the potential for increasing the yield of rice is optimistic; however, the current low rice yield and ultimate production in this district needs to be investigated. This specific study was, therefore, conducted in the Swat district of Khyber Pakhtunkhwa. This district is endowed with plenty of freshwater resources and fertile lands that are quite suitable for the cultivation of rice. The hardworking farming community of the district have the potential to enhance yield of rice, but low yield might be due to traditional farming practices, poor-technology, lack of farming information, and the over or under utilization of available resources.
Little research work has been conducted on the technical efficiency (TE) of rice in the Swat district, KPK, with the exception of one study [12], which were conducted on cost benefit analysis of different rice varieties and the economic analysis of rice crop cultivation in the Swat district. Thus, to fill this gap, there is a dire need to investigate the factors responsible for the low yield and production of rice in the Swat district. Therefore, this study was designed to unveil the factors responsible for low rice yield and to analyze the rice farmers’ technical efficiency (TE) in the Swat district, KPK. This study aimed to analyze the following objectives: (i) to analyze the inefficiency of rice farmers and identify the key determinants triggering this inefficiency; (ii) to investigate the key determinants of rice yield in the Swat district and to estimate the cost-benefit analysis of rice production in the Swat district.
The study was carried out to estimate the technical efficiency of rice farmers in the Swat district of Khyber Pakhtunkhwa. Area wise, Swat is the 15th largest district of KPK and is one of the most beautiful and tourist-intensive areas of Pakistan. It is located in the foothills of the Hindu Kush mountain range. Its capital is Saidu Sharif, and its largest city is Mingora; its population is recorded as 2.309 million with a total area of about 5337 square kilometers. Tourism and agriculture are the main sectors of the district’s economy [13,14]. The district is famous for the production of great quality rice, and its local variety “Beghami” is in high demand in the district as well as in all other parts of the country, due to its taste (See Figure 2.)

2. Materials and Methods

This part of the study delivers some comprehensive information regarding the study area, size of the sample taken, procedure, and the analytical and conceptual framework of the model.

2.1. Sampling Procedure

A multi-stage random sampling procedure was used to interview a total of 204 rice growers in the Swat valley [15,16,17,18,19,20]. At the first stage, three tehsils were selected randomly from seven tehsils. At the second stage, the required number of rice growers were randomly selected from the chosen tehsils using the formula from [21], as used by the authors of [17,19,22,23,24], given as:
n = N 1 + N ( e ) ²
  • n is the size of sample for rice growers;
  • N shows the total no. of rice farmers in chosen tehsils;
  • e shows the accuracy’s level.
After deciding the total sample size, a proportional allocating sampling technique [25] was used to interview the rice growers from each and every chosen tehsil following [10,16,22,23,26,27,28]:
n i = ( n N ) × N i
  • ni is the amount of rice farmers in the selected ith tehsil;
  • n shows the size of sample calculated by Yamane’s formula;
  • N is the aggregate of rice farmers in all the chosen tehsils;
  • Ni is number of rice farmers in the ith tehsil.
Table 1 explain the sample design and sample size of the study. The data is collected from the four tehsils of district swat. Number of sample rice growers for each tehsil is given in below Table 1.

2.2. Data Types and Collection

In this study, we employed both secondary and primary data. Secondary data were taken from FAO, Pakistan Bureau of statistics and the local extension department. The primary data were collected from rice growers during the rice crop season of 2020, using an interview schedule that was designed well after pre-testing it in the field. All the respondents were interviewed directly using their local languages at their farms and homes.

2.2.1. Data Analysis

Net revenue/profit: according to [29], the profit gained by an individual is equal to the difference of gross margin and fixed cost, while the gross margin is referred to as the total revenue minus the total cost experienced on variable inputs. It can also be defined as the total market value of the output produced minus the total cost experienced in a production process [30] given by the following formula:
  π = T R T C
T R = P Q i × Q i
T C = P x i × X i
  • where π is the net revenue gained minus total costs or simply the profit;
  • TR is the total or gross revenue gained from the output;
  • TC shows the amount of cost incurred;
  • PQ is the price per unit of output;
  • Qi shows the total amount of output produced;
  • Pxi is the price per unit of input;
  • Xi shows the inputs’ quantity.

2.2.2. Conceptual Framework

The term efficiency was first introduced by [5]; he divided this term into three categories of technical, allocative, and economic efficiency. Economic efficiency is when a farm produces a given and required maximum level of output at the least possible cost; allocative efficiency is the level of output where the marginal value product of additional output and marginal cost becomes equal to each other. Technical efficiency is to produce the maximum possible amount of output from the given available inputs. Measuring the technical efficiency of individuals in a production process was first introduced by [5]. According to [5,6,7], technical efficiency, in simple terms, is the deviation of an individual farm on an isoquant curve from the best performer of a particular group, and generally reflects a farm’s ability and expertise to achieve the maximum output by dealing with the available resources and technology, without discussing the relative market prices of both the inputs and output.
While estimating the efficiency of individuals, generally there are two approaches: the Stochastic Frontier Production approach (SFA) and the Data Envelopment Analysis approach (DEA). The important feature of the Stochastic Frontier model (SFM) technique is the uniqueness in its error term that is special and composed of a further two error terms—the random error and the technical inefficiency of individuals involved in a production process [31]. According to [6,32], both the terms are quite independent of each other; the random error term shows the factors that are not under the control of any individual producer, such as natural disasters, while the other term captures the inefficiency of individuals in terms of productivity, regarding the available resources. For simplicity regarding the unique error term and consistency in the SFM approach, this study also used this approach, following [10,12,15,19,26,27,33,34,35,36,37,38,39,40,41]. The general form of the SFM approach is given as:
  Y i = f ( X j i   ,   ) + ε
  • where Y i is the output gained by ith individual;
  • X j i shows the jth input being used by the ith individual;
  • represents all the unknown parameters of the model;
  • ε is the composed error term.
The specified form of the SFM is given as:
L n Y i = β 0 + β 1 l n S e e d + β 2 l n U r e a + β 3 l n D A P + β 4 l n C h e m + β 5 l n T r c t o r + β 6 l n L a b o r + D i F Y M + V i U i
  • where Ln = napierian (natural) log;
  • Yi = rice yield acre−1 (kg);
  • β 0 = model (SFM) parameters;
  • Seed = seeds used in kg acre1;
  • Urea = urea application in kg acre−1;
  • DAP = diammonium phosphate application in kg acre−1;
  • Chem = chemicals (pesticides, weedicides, insecticides) application acre−1 (in bottles);
  • Tractor = number of tractor hours per acre;
  • Labor = number of labor days per acre;
  • DiFYM = farmyard manure dummy (1 = FYM application; 0 = otherwise);
  • Vi = random error component which is not in the control of farmers;
  • Ui = technical inefficiency ranging from 0 to 1. It is a non-negative random variable supposed to accumulate for technical inefficiency in output function and supposed to be iid N (0, δ2u);
  • ViUi = error that shows the difference of technical inefficiency and random error term; Vi shows symmetrical random variables that carry the random effects which are outside of farmers control, such climate, disaster, luck, etc.;
  • Ui: one-sided (Ui ≥ 0) efficiency factor and non-negative which measures the technical inefficiency of the rice growers.

2.2.3. Technical Efficiency Analysis

According to [32], the technical efficiency of the farmers can be expressed as:
T E i = Y i Y i * = exp ( U i )
T I E i = 1 T E i = exp ( U i )    
  • where TEi shows the technical efficiency of ith respondent;
  • TIEi reveals the technical inefficiency of ith rice farmer;
  • Yi indicates the actual rice yield achieved by ith respondent;
  • Y i * shows the predicted rice yield achieved by ith respondent (yield obtained by ith growers).
The efficiency (TE) ranges from 0 to 1. Whereas 1 shows the fully efficient farms, 0 shows the fully inefficient farms in a production process. To estimate efficiency, some authors recommend a two-stage procedure. The first step consists of the technical efficiency estimate using an SFA approach; the second step involves the condition of the OLS model that estimates the technical efficiency with some independent variables.

2.2.4. Technical Inefficiency Estimation

Following [26,31,38,41], the second Stochastic Frontier model (SFM-2) was used to estimate the inefficiency of rice growers:
T I E i = α 0 + α 1 Age + α 2 Edu + α 3 FarmExp + α 4 TenSt + ω i
  • where TIEi = technical inefficiency of the ith rice growers;
  • α i = parameters of the model;
  • Age = farmer’s age in years;
  • Edu = rice growers’ education in years;
  • FarmExp = experience of the respondents in rice farming, measured in years;
  • TenSt = tenure status of the respondents (1 for the owner; otherwise 0);
  • ω i = model’s error term.

2.2.5. Model Diagnostic Tests

Different diagnostic tests for normality, heteroscedasticity, and multicollinearity were conducted to check the problems that usually exist in primary data. A normality test was conducted with a histogram, and a correlation matrix was used to check the multicollinearity. However, to check the problem of heteroscedasticity, the Breusch–Pagan test was used.

3. Results and Discussion

This section explains the socioeconomic characteristics of rice growers, including age, education, experience, tenancy status, and area of rice, along with the major factors that affect the rice production and inefficiency of rice farmers in the Swat district.

3.1. Socio-Economic Characteristics of the Farmers

Socio-economic characteristics such as age, experience regarding a specific crop, literacy, and tenancy status of the farmers always have a great impact on the production of crops. The greater the age of the farmers, the less technically efficient they are at producing crops; younger farmers are typically more hardworking. Similarly, educated and experienced farmers are more efficient as compared to illiterate and less experienced individuals. Table 2 shows that the mean age of the farmers was recorded as 44.15 years with a max of 64, min of 25, and std. deviation of 7.10 years. The mean education level of the growers was recorded as 8.31 schooling years with a standard deviation of 2.90 ranging between 0 and 16 schooling years. Experience improves sowing and harvesting practices and increases farmers’ familiarity with innovations in farming. The average length of farming experience, measured in years, was 26.21 with a maximum, minimum, and standard deviation of 46, 7, and 7.17 years, respectively. The total number of owners in the study area was 99, with a percentage of 48.52, while the total number of tenants in the study area was 105 with a percentage of 51.47. The results are given in Table 2 below.

3.2. Cost of Production of Rice per Acre

Table 3 portrays the costs of production of rice, including fixed costs and flexible costs (variable). Land rent was taken as fixed, while variable costs include tractor cost, FYM cost, urea cost, DAP cost, seed cost, labor cost, chemical cost, threshing cost, machine cost, and miscellaneous costs. Fixed costs are the charges which are made by the producer on fixed factors of production, and which the producer is unable to change during the process of production. In the production of rice, land rent was taken as the only fixed cost. The average land cost in the study area was calculated as PKR 19,324.73. Variable costs were the expenditures made by the producer on variable factors during the process of production. The brief to each cost is explained below.
Costs of tractors include the cost of deep-ploughing, farm levelling, ploughing, and planking. The per hour tractor’s cost varied in all three tehsils. In the study area, the mean cost of tractor hours was estimated as PKR 4752.99 per acre. Seed is essential input in a production process, as their proper usage increases production. The mean cost incurred on seeds was calculated as PKR 1707.85, while the average cost on FYM was recorded as PKR 2476.28. Fertilizer cost includes the cost of urea and DAP; DAP enhances the production of rice and provides essential nourishment to plants, whereas urea is a stable organic fertilizer that can improve the quality of soil. The average cost of urea was found to be PKR 4634.60, while DAP contributed, on average, PKR 3584.31 to the total cost. Pesticide and weedicide are important as they help farmers to grow more food on less land by protecting crops from pests, disease, and weeds. The mean cost of chemicals in the study area was calculated as PKR 2500. Thresher is a farm machine that threshes grain, and was first invented in the year 1786 by Andrew Meikle in Scotland. The mean threshing cost was calculated as PKR 6875.07, while the average cost incurred using a rice huller (usually used to separate husk from grains) was recorded as PKR 14,040.31. Miscellaneous costs included transportation charges and price of bags in the study area. The mean cost for miscellaneous items was recorded as PKR 3390.10.

3.3. Gross and Net Revenue from Rice (PKR/Acre)

Table 4 shows that, on average, rice farmers gained a yield of 2096.49 kg/acre. Gross revenue, the sum of the market value of the main product and the byproduct, was recoded as PKR 167,712. The total amount of cost incurred by the sampled farmers was recorded as PKR 73,407.87, and the net revenue was recorded as PKR 94,304.13.
Table 5 displays the variables’ summary statistics used in the model. The average yield recorded was 2100.32 kg/acre with a standard deviation of 153.54. Average seed sown in a one-acre rice field was recorded as 21.2 kg, with a standard deviation of 3.29 kg.
On average, a tractor was used for 3.95 h per acre, while the average urea and DAP applied in a one-acre rice field were calculated as 120.71 kg and 44.24 kg, respectively. The average application of chemicals was recorded as 1.52 L/acre, while the average age, education, and experience were found to be 44.15, 8.18, and 26.21, respectively, in years.

3.4. MLE Estimates of SFA Model

Table 6 shows that coefficients of urea, DAP, chemicals, labor, and FYM were estimated as 0.25, 0.02, 0.22, 0.03, and 0.01, respectively. The results of the Stochastic Frontier model disclosed that urea, DAP, weedicides and pesticides (chemicals), labor, and farmyard manure (FYM) were positive and statistically significant at five and one percent levels. This implies that the rise in the usage of the aforementioned variables enhanced the rice yield significantly in the study area [20,42,43]. The coefficient of seed and tractor were found to be positive, but not significant statistically; this might be due to the unsuitable use of both of these variables. Some positive but insignificant results were found by [41].
Furthermore, the results of the study indicated that the estimated coefficient for chemicals was significantly positive, divulging that one percent increase in the use of chemicals such as pesticides and weedicides, etc., raised the rice yield by 0.22 percent. The results correspond to that of [29,44].
The estimated coefficients of variables such as urea, DAP, and FYM had positive and quite significant effects on rice yield, and their estimated values showed that rice yield increased by 0.25%, 0.23%, and 0.01% with one percent in these inputs, respectively. The same results for these variables were estimated by [10,33,45,46,47]. The estimated value of labor with a positive effect and statistical significance disclosed that a 1% rise in working hours could enhance the rice yield by 0.03 percent, and the results are in accordance with [20,43,48]. Furthermore, the coefficient for tractor hours in the study was found positive and statistically insignificant, with the estimated value of 0.01, implying that a unit increase in the use of a tractor had no significant effect on rice yield, and farmers should focus more on puddling instead of plowing. The same insignificant results for tractors were estimated by [42,49]. The coefficient of seed was found positive and statistically insignificant in the study area; this may be due to the late sowing or inappropriate amount of seeds sown, and the results are consistent with that of [50]. The variance parameter Gamma (γ), through the estimated value of (γ) = σu22v, which is 0.729, revealed that 72.9% of the difference between the observed and frontier level rice output was because of technical inefficiency, while the remaining 28 percent of the variation was caused by some arbitrary reasons that were not in the farmers’ control.

3.5. Technical Inefficiency Factors and Estimated Values

To analyze the inefficiency (technical) of the sampled farmers, the Stochastic Frontier model 2 was employed. The coefficients for age, education, farming experience, and tenancy status were estimated as 0.022, −0.007, −0.023 and −0.002, respectively. The results of Table 7 reveal that age had a positive and statistically significant influence on the rice growers’ inefficiency at a 5% significance level, showing that one percent increase in individuals’ age could increase their inefficiency by 0.022 percent. This may be because younger farmers possess a lower ability and are comparatively weak, and therefore unable to perform all the farm practices in the way that elder farmers can; the results are in accordance to [31,48]. The statistically significant and negative value for education level revealed that inefficiency of the farmers decreased by 0.007, with an increase in education years by one percent. The reason is that education plays a vigorous role in farmers’ efficiency, and educated farmers always utilize inputs in an appropriate manner, as compared to illiterate farmers, because they have proper knowledge regarding agronomic practices and new technology; these results are in line with that of [10,51]. The coefficient of farming experience was estimated as −0.023 negative and statistically significant at a 1% of confidence interval, showing that one percent increase in experience would decrease the farmer’s inefficiency by 0.023 percent. These findings implied that farming experience has an adverse impact on farmer’s inefficiency because experienced farmers have more knowledge about a specific crop. These results are similar to [43,52,53]. The dummy coefficient for tenancy status was found to be negative but highly insignificant, indicating that tenancy status does have a negative relationship with inefficiency, but the result was insignificant, corresponding to [10].

3.6. Frequency Distribution of Technical Efficiency

Table 8 shows the frequency distribution, mean, maximum, and minimum efficiency level of the sampled rice cultivators in the Swat district. The results showed that the mean technical efficiency in rice production was 0.87, with a minimum of 0.66 and a maximum of 0.99, which means that the sampled growers had the ability to enhance their efficiency by 13 percent with the available resources. The estimated mean technical efficiency of this study was almost the same as that of [43,54,55]. Similarly, the mean efficiency as compared to [15,56,57] was greater, and lower compared to [58].
Among all the sampled individuals, 17 farmers (8.33%) had an efficiency level between 60 and 80, 158 farmers (77.4%) had an efficiency score ranging from 81 to 90, and 29 (29%) farmers had an efficiency score above 90.

3.7. Diagnostic Tests

3.7.1. Normality

The normality plot of residuals given in Figure 3. The normality problem was checked in the study through a histogram which showed that the data had no such problem, and was normally distributed with zero mean and constant variance.

3.7.2. Heteroscedasticity

The Breusch–Pagan test was used to check the problem of heteroscedasticity and the result of the test revealed that the data was homoscedastic.

3.7.3. Multicollinearity

To check the multicollinearity in the estimated model, the given correlation matrix was constructed for the explanatory variables used in the regression analysis, which showed that the there was no strong association among the explanatory variables, suggesting that the dataset had no multicollinearity problem.
Next, Table 9. shows the correlation matrix of the explanatory variables of study. All of the variables are directly related to each other except tractor is inversely correlated to DAP.

3.8. Discussion

The investigation of input and technology usage in rice production at national as well as provincial and regional levels is very important for policy makers and planners. They need to analyze the current status of farmer’s efficiency in terms of input utilization for maximum possible yield, and to identify determinants of inefficiency in order to meet the growing demand for rice consumption in the country. The current study was conducted in Khyber Pakhtunkhwa (Pakistan) with the main objective of measuring the technical efficiency of rice production and identifying factors responsible for inefficiency, if any. The results from the estimation of Stochastic Frontier Model (SFA) on a primary dataset from rice farmers revealed that urea, diammonium phosphate (DAP), chemicals (pesticides and weedicides), labor, and farmyard manure had positive significant effects on rice yield. The inefficiency analysis identified education and farming experience as negatively associated significant factors. This implies that growers’ yield can be increased with education and experience. These results are in line with findings of [59,60]. Quality education enhances farmers’ ability to seek, interpret, and make good use of available information and inputs. The coefficient of age was positive and significant, which indicates that with an increase in rice grower’s age, technical efficiency decreases. The results of the study for age are supported by [12,61]. They reported that older farmers are less willing to adopt new technology and inputs. Moreover, they have less contact with extension workers.
The studies conducted by [54,62] on technical efficiency rice crop in Bangladesh, primary data were collected from 115 rice growers. Labor days, fertilizer, pesticides, seed, irrigation and farm size were considered independent variables. Except farm size, all the pre-mentioned variables were found to significantly contribute to rice production. Mean technical efficiency score was found to be 89.5%. They reported that, in the study area, yield could be increased by giving awareness to rice growers on the recommended levels of these inputs.
In another study conducted by [43] on the technical efficiency of rice crop in Punjab province (Pakistan), the primary data of 300 rice growers on area of rice crop, seed, labor per season, numbers of irrigation, fertilizer (both chemical and farmyard) and tractor hours were considered as explanatory variables in production function. It was revealed that area, seed, fertilizer and irrigation significantly contributed to rice production. In inefficiency model education, relevant experience, access to market, and credit were considered. These variables were found to be negatively correlated with the technical inefficiency of rice growers in study area. Mean technical efficiency was reported as 86%.
A study was conducted by [49] on the technical efficiency of rice crop in major rice growing districts of Punjab, Pakistan. In their study, explanatory variables were area of rice crop, plowing hours, irrigation hours, labor days, plan protection (pesticides, weedicides) and plant nutrients (chemical fertilizer). The coefficient of seed was positive and non-significant. A possible reason reported was that seed sown without treatment with chemicals would increase the chances of disease, and effect technical efficiency. Moreover, [49] found that seed dressing with chemicals had a yield significance and positive relationship with the technical efficiency of rice crop. Seed dressing with chemicals reduced the probability of disease and appeared in terms of higher output. Our results for seed dressing are supported by [49].
A study was conducted by [61] on the technical efficiency of rice crop in Uttar Pradesh State of India. Cross sectional data from 800 rice growers was analyzed. It was reported that labor, irrigation and hybrid seed yield had a constructive impact on the technical efficiency of rice production. Timely access to credit and information via extension services showed a positive impact on technical efficiency, while tenurial status and experience yield had a negative impact on the technical efficiency of rice growers in the study area. Mean technical efficiency score was noted as 72%.

4. Conclusions and Policy Recommendations

This study analyzed the technical efficiency of rice growing farmers in the Swat district of the KPK province. The study showed that cost incurred by the rice farmers in the study area was about PKR 73,407.87, and the net revenue was recorded as PKR 94,304.13 with an average yield of almost 2096 kg/acre. The estimated coefficients of urea, DAP, chemicals, labor, and FYM were highly significant and positive with the estimated values of 0.25, 0.02, 0.22, 0.03, and 0.01, respectively. The gamma (γ) was estimated as 0.729, revealing that 72.9% of the difference between the observed and frontier level rice output was because of technical inefficiency. The estimates of Stochastic Frontier model 2 showed that age, education, and farming experience had a significant effect on farmers’ efficiency with the values of 0.022, −0.007, −0.023, respectively, whereas tenancy status had no significant effect on their efficiency. The mean technical efficiency in rice production was 0.87, with a minimum of 0.66 and a maximum of 0.99. Whereas 17 farmers (8.3%) had an efficiency level between 60 and 80, 158 farmers (77.4%) had an efficiency score ranging from 81 to 90, and 29 (29%) farmers had an efficiency score above 90.
This was the first attempted study in the area and was limited to a single crop; therefore, generalization of our results should be handled carefully. Technical efficiency guides the scientist to reconsider inputs level and technology.
Based on these findings, this study recommends the local extension department arrange training programs for rice growers to develop their agronomic skills and facilitate them with the technical knowledge for efficient resource allocation. Urea and DAP, being essential inputs in rice production, should be provided at subsidized prices to encourage local farmers and improve production in the study area. Furthermore, with rice being the second most important staple food in Pakistan, researchers need to focus on this specific crop in other major ecological zones of KPK to spread awareness regarding the problems faced by rice growers, and improve its production.

Author Contributions

This research work titled “Analysis of Technical Efficiency of Rice Crop in Khyber Pakhtunkhwa: A Stochastic Frontier Approach” was carried out in collaboration among all authors; S.A. developed the main idea of this study, and wrote the title, abstract, objectives and interview schedule; S.K. reviewed the literature, wrote the conceptual framework and wrote the results and discussion. He also collected data and conducted the excel sheet; S.A.S. estimated the model and interpreted the results; A.A. wrote introduction, specified the model, and helped in developing an interview schedule and writing the conclusion and recommendations; L.K.A. supervised the overall write up throughout and S.S. corrected, edited and formatted this manuscript. All authors have read and agreed to the published version of the manuscript.

Funding

This research received no external funding.

Institutional Review Board Statement

Not Applicable.

Informed Consent Statement

Not Applicable.

Data Availability Statement

Not Applicable.

Acknowledgments

We acknowledge the technical support of the department of Agricultural and Applied Economics, The University of Agriculture, Peshawar-Pakistan for providing access to materials pertaining to this research work. We are also grateful to the sampled rice growers of district Swat for providing information on rice crop production processes. Authors also acknowledge support from the Department of Agricultural Sciences, Paul Engler College of Agriculture and Natural Sciences, West Texas A&M University and is greatly appreciated.

Conflicts of Interest

The authors declare no conflict of interest.

References

  1. Economic Survey of Pakistan 2019–2020. Economic Advisor’s Wing, Finance Division, Government of Pakistan (GOP). Available online: https://www.finance.gov.pk/survey_1920.html (accessed on 20 January 2022).
  2. Hussain, N.; Ali, S.; Miraj, N.; Sajjad, M. An estimation of technical efficiency of garlic production in Khyber Pakhtunkhwa. J. Agric. Res. 2014, 2, 169–178. [Google Scholar]
  3. FAO. Food and Agriculture Organization of the United Nations, Corporate Statistical Database (FAOSTAT). 2018. Available online: http://www.factfish.com/statistic/rice%2C%20paddy%2C%20production%20quantity (accessed on 11 October 2019).
  4. FAOSTAT. Food and Agriculture Organization of the United Nations Org. 2018. Available online: http://www.fao.org/faostat/en/#data/QC (accessed on 1 March 2022).
  5. Farrell, M.J. The Measurement of productivity efficiency. J. R. Stat. Soc. 1957, 120, 252–281. [Google Scholar]
  6. Coelli, T.; Rao, J.; Donnell, D.S.P.; Battese, C.J. An Introduction to Efficiency and Productivity Analysis, 2nd ed.; Springer: New York, NY, USA, 2005. [Google Scholar]
  7. Shapiro, K.H. Sources of technical efficiency, The Roles of Modernization and Information. Econ. Dev. Cult. Change 1977, 25, 293–310. [Google Scholar] [CrossRef]
  8. Idiong, I.C. Estimation of Farm level technical efficiency in small scale swamp rice production in Cross River State of Nigeria: A Stochastic Frontier Approach. World J. Agric. Sci. 2007, 3, 653–658. [Google Scholar]
  9. Kadiri, F.A.; Eze, C.C.; Orebiyi, J.S.; Lemchi, J.I.; Ohajianya, D.O.; Nwaiwu, I.U. Technical efficiency in paddy rice production in the Niger Delta Region of Nigeria. Glob. J. Agric. Res. 2014, 2, 33–43. [Google Scholar]
  10. Shah, S.A.; Ali, S.; Ali, A.; Baig, A. Economic analysis of maize production in central Khyber Pakhtunkhwa, Pakistan. Sarhad J. Agric. 2020, 36, 966–973. [Google Scholar]
  11. Reddy, A.R.; Sen, C. Technical inefficiency in rice production and its relationship with farm-specific socio-economic characteristics. Ind. J. Agric. Econ. 2004, 59, 259–267. [Google Scholar]
  12. Hussain, A. Economic analysis of rice crop cultivation in district Swat. J. Agric. Res. 2013, 51, 175–187. [Google Scholar]
  13. Pakistan Statistical Year Book 2018–2019; Bureau of Statistics, Statistical Division: Islamabad, Pakistan, 2019. Available online: http://www.finance.gov.pk/survey/chapters_19/2-Agriculture (accessed on 31 July 2019).
  14. Pakistan Statistical Year Book; Bureau of Statistic, Statistical Division: Islamabad, Pakistan. Available online: www.pbs.gov.pk (accessed on 31 July 2017).
  15. Ali, S.; Khan, M. Technical efficiency of wheat production in District Peshawar, Khyber Pakhtunkhwa, Pakistan. Sarhad J. Agric. 2014, 30, 433–441. [Google Scholar]
  16. Ali, G.; Shah, S.M.A.; Jan, D.; Jan, A.; Fayaz, M.; Ullah, I. Technical efficiency of sugarcane production in district Dera-Ismail Khan. Sarhad J. Agric. 2013, 29, 585–590. [Google Scholar]
  17. Khan, A. Technical efficiency of onion production in Pakistan, Khyber Pakhtunkhwa province, district Malakand. J. Dev. Econ. 2015, 4, 24–36. [Google Scholar] [CrossRef] [Green Version]
  18. Ghalib, H.H.; Shah, S.A.; Jan, A.U.; Ali, G. Impact of climate change on wheat growers’ net return in Khyber Pakhtunkhwa. Sarhad J. Agric. 2017, 33, 591–597. [Google Scholar]
  19. Ali, A.; Jan, A.U. Analysis of the technical efficiency of sugar crop in Khyber Pakhtunkhwa. Sarhad J. Agric. 2017, 33, 69–79. [Google Scholar] [CrossRef]
  20. Lema, T.Z.; Tessema, S.A.; Abebe, F.A. Analysis of the Technical Efficiency of Rice Production in Fogera District of Ethiopia: A Stochastic Frontier Approach. Ethiop. J. Econ. 2017, 26, 90–107. [Google Scholar]
  21. Yamane, T. Sampling Formula. 1967. Available online: http://www.albookez.com (accessed on 15 November 2020).
  22. Khan, A.; Ali, S.; Khan, A.; Waqas, M.; Khan, S.U. Technical efficiency of maize in district Lakki Marwat of Khyber Pakhtunkhwa, Pakistan. Sarhad J. Agric. 2020, 36, 402–410. [Google Scholar] [CrossRef]
  23. Khan, S.; Ullah, I.; Murtaza, S.A. Profitability and determinants of potato growers in district Swat of Khyber Pakhtunkhwa, Pakistan. Sarhad J. Agric. 2020, 36, 748–753. [Google Scholar]
  24. Ali, S.; Khan, A.; Shah, S.A.; Khan, S.U. Economic appraisal of transformative climate change on potential variations in wellbeing of wheat growers across various ecological zones. Environ. Sci. Pollut. Res. 2021, 28, 10077–10091. [Google Scholar]
  25. Cochran, W.G. Sampling Techniques, 3rd ed.; John Wiley & Sons: New York, NY, USA, 1977; pp. 37–45. [Google Scholar]
  26. Zaman, R.; Ali, S.; Ullah, I. Technical efficiency of broiler farms in District Mansehra, Pakistan: A stochastic frontier trans-log production approach. Sarhad J. Agric. 2018, 34, 158–167. [Google Scholar] [CrossRef]
  27. Ali, S.; Khan, A.; Khan, A.; Riaz, B. Determinants of technical efficiency of tomato farms in district Peshawar, Khyber Pakhtunkhwa. Sarhad J. Agric. 2019, 35, 572–578. [Google Scholar] [CrossRef]
  28. Ali, S.; Andaleeb, N.; Ali, A. Technical efficiency of wheat growers in district Swabi of Khyber Pakhtunkhwa, Pakistan. Sarhad J. Agric. 2019, 35, 1336–1343. [Google Scholar] [CrossRef]
  29. David, B.; Fischer, S. Economics, 6th ed.; British Library, Cataloguing in Publication Data: London, UK, 2000. [Google Scholar]
  30. Debertin, D.L. Agriculture Production Economics, 2nd ed.; Macmillan Publishing Company: New York, NY, USA, 2012. [Google Scholar]
  31. Heriqbaldi, U.; Purwono, R.; Haryanto, T.; Primanthi, M.R. An analysis of technical efficiency of rice production in Indonesia. Asian Soc. Sci. 2015, 11, 91–102. [Google Scholar] [CrossRef]
  32. Aigner, D.; Lovell, C.K.; Schmidt, P. Formulation and estimation of stochastic frontier production function models. J. Econom. 1977, 6, 21–37. [Google Scholar] [CrossRef]
  33. Abedullah, S.K.; Mushtaq, K. Environmental efficiency analysis of basmati rice production in Punjab, Pakistan: Implications for sustainable agricultural development. Pak. Dev. Rev. 2010, 49, 57–72. [Google Scholar] [CrossRef] [Green Version]
  34. Ahmad, M.; Muhammad, R.; Ali, A. An analysis of technical efficiency of rice farmers in Pakistani Punjab. Bangladesh. J. Agric. Econ. 1999, 22, 79–86. [Google Scholar]
  35. Ahmed, M.H.; Melesse, K.A. Impact of off-farm activities on technical efficiency: Evidence from maize producers of eastern Ethiopia. Agric. Food Econ. 2018, 6, 3. [Google Scholar] [CrossRef] [Green Version]
  36. Saddozai, K.N.; Saboor, A.; Khan, M.A.; Jan, D.; Ali, G. Analyzing the impact of Farmer Field School on technical efficiency of cotton growers in southern districts of Punjab-Pakistan: Stochastic Production Frontier Approach. Sarhad J. Agric. 2013, 29, 291–298. [Google Scholar]
  37. Saddozai, K.N.; Nasrullah, M.; Khan, N.P. Stochastic frontier production analysis of tobacco growers in district Mardan, Pakistan. J. Agric. Res. 2015, 28, 346–353. [Google Scholar]
  38. Sajjad, M.; Khan, M.; Zulfiqar, M.; Ali, S.; Nazir, M.; Ali, A. Technical efficiency analysis of milk production in Khyber Pakhtunkhwa province: A stochastic frontier approach. Pak. J. Life Soc. Sci. 2013, 11, 36–41. [Google Scholar]
  39. Wahid, U.; Ali, S.; Hadi, N.A. Estimation of technical efficiency of tomato growers in Malakand, Pakistan. Sarhad J. Agric. 2017, 33, 357–365. [Google Scholar] [CrossRef]
  40. Ullah, I.; Ali, S.; Khan, S.U.; Sajjad, M. Assessment of technical efficiency of open shed broiler farms: The case study of Khyber Pakhtunkhwa province Pakistan. Saudi J. Agric. Sci. 2019, 18, 361–366. [Google Scholar] [CrossRef]
  41. Ali, A.; Almas, L.; Shah, S.A.; Fatima, H.; Khan, A. Technical efficiency of growing sugarcane crop in Khyber Pakhtunkhwa, Pakistan. Sarhad J. Agric. 2020, 36, 499–506. [Google Scholar] [CrossRef]
  42. Narala, A.; Zala, Y.C. Technical efficiency of rice farms under irrigated condition in central Gujarat. Agric. Econ. Res. Rev. 2010, 23, 375–381. [Google Scholar]
  43. Shaheen, S.H.; Fatima, M.A.; Khan. Technical efficiency Analysis of Rice production under dry and puddle conditions in selected district of Punjab province, Pakistan. Sarhad J. Agric. 2017, 33, 447–458. [Google Scholar] [CrossRef]
  44. Dey, M.M.; Paraguas, F.J.; Bimbao, G.B.; Regaspi, P.B. Technical efficiency of tilapia grow out pond operations in the Philippines. Aquacult. Econom. Manag. 2000, 4, 33–47. [Google Scholar] [CrossRef]
  45. Kea, S.; Li, H.; Pich, L. Technical Efficiency Analysis of Cambodian Household’s Rice Production. Glob. J. Hum. Soc. Sci. Econ. 2016, 16, 33–44. [Google Scholar]
  46. Yu, B.; Diao, X. Cambodia’s Agricultural Strategy: Future Development Options for the Rice Sector; A Policy Discussion Paper of Cambodia Development Resource Institute (CDRI); CDRI: Phnom Penh, Cambodia, 2011; Available online: http://takkagri.weebly.com/uploads/3/0/3/1/30319257/cambodia_policy_rice_and_export.pdf (accessed on 1 March 2011).
  47. Hassan, S.; Ahmad, B. Technical efficiency of wheat farmers in mixed farming system of the Punjab, Pakistan. Int. J. Agric. Biol. 2005, 7, 431–435. [Google Scholar]
  48. Ahmadu, J.; Erhabor, P.O. Determination of technical efficiency of rice farmers in Taraba state Nigeria. Niger. J. Agric. Food Environ. 2012, 8, 78–84. [Google Scholar]
  49. Abedullah; Kouser, S.; Mushtaq, K. Analysis of technical efficiency of rice production in Punjab (Pakistan): Implications for future investment strategies. Pak. Econ. Soc. Rev. 2007, 45, 231–244. [Google Scholar]
  50. Kerdsriserm, C.; Suwanmaneepong, S.; Mankeb, P. Comparative analysis of the technical efficiency of different production systems for rice farming in Eastern Thailand. Asian J. Sci. Res. 2018, 11, 480–488. [Google Scholar] [CrossRef]
  51. Balde, B.S.; Kobayashi, H.; Nohmi, M.; Ishida, A.; Esham, M.; Tolno, E. An analysis of technical efficiency of mangrove rice production in the Guinean Coastal area. J. Agric. Sci. 2014, 6, 179–196. [Google Scholar] [CrossRef] [Green Version]
  52. Etim, N.A.A.; Thompson, D.; Onyenweaku, C.E. Measuring efficiency of yam production among resources poor farmers in rural Nigeria. Discourse J. Agric. Food Sci. 2013, 1, 42–47. [Google Scholar]
  53. Backman, S.; Islam, K.Z.; Sumelius, J. Determinants of technical efficiency of rice farms in North-Central and North-Western Regions in Bangladesh. J. Dev. Areas 2011, 45, 73–94. [Google Scholar] [CrossRef]
  54. Hasan, M.K.; Islam, S.F. Technical inefficiency of wheat production in some selected areas of Bangladesh. Bangladesh J. Agric. Res. 2010, 35, 101–112. [Google Scholar] [CrossRef]
  55. Nchare, N. Analysis of factors affecting technical efficiency of Arabica coffee in Camroon. Afr. Econ. Consort. Nairobi AERC 2007, 163, 1–32. [Google Scholar]
  56. Kolawole, O.; Ojo, S.O. Economic efficiency of small-scale food crop production in Nigeria: A stochastic frontier approach. J. Soc. Sci. 2007, 14, 123–130. [Google Scholar] [CrossRef]
  57. Hossain, M.A.; Hasan, M.K.; Naher, Q. Assessment of technical efficiency of potato producers in some selected areas of Bangladesh. J. Agric. Rural Dev. 2008, 6, 113–118. [Google Scholar] [CrossRef]
  58. Khan, A.; Huda, F.A.; Alam, A. Farm household technical efficiency: A study on rice producers in selected areas of Jamalpur District in Bangladesh. Eur. J. Soc. Sci. 2010, 14, 262–271. [Google Scholar]
  59. Devi, L.G.; Singh, Y.C. Resource use and technical efficiency of rice production in Manipur. Int. J. Dev. Res. 2014, 59, 823–835. [Google Scholar]
  60. Liu, K.; Zhuang, J. Determinants of technical efficiency in post-collective Chinese agriculture: Evidence from farm-level data. J. Comp. Econ. 2000, 28, 545–564. [Google Scholar] [CrossRef]
  61. Chandel, R.B.S.; Aftab, K.; Xiaojing, L.; Xianli, X. Farm-level technical efficiency and its determinants of rice production in Indo-Ganetic Plains: A stochastic frontier approach. Sustainability 2022, 14, 2267. [Google Scholar] [CrossRef]
  62. Hasnain, N.; Elias, H.; Khairul, I. Technical Efficiency of Boro Rice Production in Meherpur District of Bangladesh: A Stochastic Frontier Approach. Am. J. Agric. For. 2015, 3, 31–37. [Google Scholar] [CrossRef] [Green Version]
Figure 1. Largest five rice-producing countries. Source: Authors own creation. Data source: US Department of Agriculture—Statista 2022.
Agriculture 12 00503 g001
Figure 2. Map of the study area. Source: Pakimage.com.
Agriculture 12 00503 g002
Figure 3. Histogram of residuals. Source: Author’s own estimation for rice crop in Swat (2020).
Agriculture 12 00503 g003
Table 1. Sampling design and sample size.
DistrictTehsilRice GrowersSampled Growers
SwatBabuzai17282
Kabal8542
Matta16880
Total425204
Source: Extension Department Swat, 2019.
Table 2. Socio-economic characteristics of the respondents.
TehsilMeanStd. DevMinMax
Age44.157.102564
Education8.312.90016
Farm Exp.26.217.17746
Tenancy statusOwners99Percentage48.52%
Tenants10551.47%
Source: Author’s calculation for rice growers in Swat (2020).
Table 3. Cost of production of rice (PKR/acre).
ParticularsUnitUnit’s CostQty.TC (PKR)
Tractor costHours12003.954747.05
SeedKg8021.451713.72
FYMTrolley2445.20.952322.94
UreaBag20002.384769.60
DAPBag40000.903588.03
ChemicalsBottle961.532.62500
Labor costDay70014.8910,424.99
Threshing6875.07
Machine14,070
Miscellaneous3390.10
119,006.37
Source: Author’s calculation for rice growers in Swat (2020). Note: USD 1 = PKR 161.83 (2020).
Table 4. Gross and net revenue of rice growers (per acre) improves.
ParticularsYield (kg)GR (PKR)TC (PKR)NR (PKR)
Rice product2096.40167,71273,407.8794,304.13
Source: Author’s calculation for rice growers in Swat (2020).
Table 5. Summary statistics of variables.
VariablesUnitMeanStd. DevMinMax
Yieldkg2096.40153.5416002400
Seedkg21.23.291530
Ureakg120.7117.8050150
DAPkg44.2420.5325100
Chemicalslitres1.520.6814
Tractorhours3.950.572.55
Ageyears44.157.102564
Educationyears8.182.65012
Experienceyears26.217.17746
Source: Author’s own estimation for rice crop in Swat (2020).
Table 6. MLE estimates of SFA model.
Explanatory VariablesCoefficientsStd. ErrorT-Ratio
Ln Seed0.0230.1891.26
Ln Urea0.2550.01615.6 **
Ln Dap0.0230.0063.33 **
Ln Chem.0.2210.0072.98 *
Ln Tract0.010.1741.12
Ln Labor0.0390.0152.49 *
FYM (Dummy)0.0160.0052.79 *
Constant6.1740.07284.96 **
Variance Parameters
σv0.030.007
σu0.0270.025
σ20.0010.000
λ0.870.033
Gamma = σu220.729……
Source: Author’s own estimation for rice crop in Swat (2020). * and ** indicate significance at 0.05 and 0.01 levels, respectively.
Table 7. Technical inefficiency factors and estimated values.
VariablesEstimatesStd. Err.T-Ratiop-Values
Age0.0220.0082.600.001
Education−0.0070.001−5.090.000
Farming Experience−0.0230.008−2.640.009
Tenancy Status−0.0020.007−0.370.710
Cons−0.2200.161−1.360.174
Source: Author’s own estimation for rice crop in Swat (2020).
Table 8. Frequency distribution of technical efficiency.
RangePercentageFrequency
60—808.3317
81—9077.45158
Above 9014.2129
Mean0.87
Maximum0.99
Minimum0.66
Source: Author’s own estimation for rice crop in the Swat district (2020).
Table 9. Correlation matrix.
Pairwise CorrelationLn SeedLn UreaLn DAPLn ChemLn TractorLn LaborFYM
Ln Seed1.000
Ln Urea0.4961.000
Ln DAP0.2590.3831.000
Ln Pest0.1910.3380.3931.000
Ln Tractor0.0860.023−0.0750.0071.000
Ln Labor0.2960.4460.2850.2860.0561.000
FYM 0.2120.2850.3070.194−0.0220.1491.000
Source: Author’s own estimation for rice crop in Swat (2020).
Publisher’s Note: MDPI stays neutral with regard to jurisdictional claims in published maps and institutional affiliations.

