Article

Adaptation to Climate Change and Impact on Smallholder Farmers’ Food Security in South Africa

by
Abiodun A. Ogundeji
Disaster Management Training and Education Centre for Africa, University of the Free State, Bloemfontein 9300, South Africa
Agriculture 2022, 12(5), 589; https://doi.org/10.3390/agriculture12050589
Submission received: 16 March 2022 / Revised: 16 April 2022 / Accepted: 16 April 2022 / Published: 22 April 2022
(This article belongs to the Section Agricultural Economics, Policies and Rural Management)

Abstract

:
If not adequately managed, climate change is predicted to have a large negative impact on smallholder subsistence farmers, posing a significant danger to household food security. However, the role of adaptive techniques used by farming households to reduce these negative effects and, as a result, their food insecurity status has not been sufficiently evaluated. This study explores the factors that influence smallholder farmers’ adoption of climate change adaptation measures, as well as their impact on household food security. Using an endogenous treatment-effect ordered probit model, agricultural households’ food security status is likely to significantly improve when they employ measures to adapt to adverse climatic conditions. The empirical findings also show that the gender makeup of the household, age, tropical livestock unit, and access to climatic information improve the likelihood of smallholder farmers adopting climate change adaptation measures. Based on the findings, this study advocates that governments and non-governmental organizations (NGOs) support smallholder farmers’ Indigenous adaptation options with various institutional, regulatory, and technological assistance, with a particular emphasis on female-headed households.

1. Introduction

Climate change continues to be a threat to global economic development, and it may have an impact on different aspects of domestic life, such as agricultural productivity and food security [1,2,3]. Between 2004 and 2014, the risks and costs connected with the consequences of climate change on agricultural output, such as crop and animal losses, due to flooding and droughts, totaled more than a hundred billion USD globally [4]. Despite the recorded losses, other empirical studies reveal a further projected increase in future extreme weather events such as droughts, storms, precipitation variations, and temperature variations, with Africa reported to be more prone to destructive consequences [5,6]. Sub-Saharan African countries, such as South Africa, have suffered seasonal and yearly unpredictability in rainfall and temperature in recent years, resulting in a number of negative effects on the agricultural sector’s sustainability [7]. As a result, South Africa’s food security remains jeopardized; for example, a reduction in crop yields and livestock production translated to low farm earnings and a decrease in food availability in many provinces [2,8].
In South Africa, the food security of rural households is inextricably linked to the sustainability of the country’s agriculture industry, which supplies food, income, and employment to more than 70% of the population [9]. Sustaining rural households’ food security in the face of climate change becomes a critical challenge, as climate change offers a terrible danger to rural areas where agricultural production is largely practiced by smallholder farmers who rely heavily on rainfall for water [10]. Relying on rainwater may be more difficult for smallholder farmers because South Africa is regarded as a water-scarce country, reducing agricultural production and contributing to food security [11]. Smallholder farmers are particularly vulnerable to climate change due to their reliance on rain-fed agriculture, insufficient access to land, high poverty, and poor education levels, limited access to extension training, and lack of financial support to adopt adaptive measures [12,13]. Therefore, a study that focuses on understanding the factors that influence smallholder farmers’ decision to adopt climate change adaptation strategies (CCAS) is important for mitigating the risks and eliminating the negative effects on agricultural production and food security [14,15].
Smallholder farmers’ resilience to climate change could be directly linked to various adaptation strategies and smallholder farmers’ adaptive capacity (typically seen as low in comparison to commercial farmers) as documented in the literature [15,16,17,18]. Farmers who respond to climate change through various adaptation measures, according to [19], are more likely to boost agricultural productivity and improve their livelihood. Furthermore, adaptation to climate change contributes to improved household food security and, in general, farm household welfare [20]. Adaptation strategies such as improved crop variety and early maturing crops, agrochemical application, livelihood diversification, irrigation, and livestock reduction were found to have significantly reduced the impact of climate change, increased smallholder farmers’ net income, and improved farmers’ food security [15,21,22]. While climate change adaptation has proven to be an effective strategy to manage climate change threats, smallholder farmers face several challenges when deciding whether or not to adapt. Several factors, such as inadequate credit access, inadequate education training, infrequent extension visits, and so on, have been reported in the literature as contributing to a decrease in the likelihood of farmers adapting, which in turn has a negative impact on agricultural output and food security in rural areas [15,17]. Given that the smallholder agricultural sector in South Africa is one of the main livelihood options for most rural households [23], more rigorous research is needed to investigate how decisions to adopt CCAS are made and how they affect the food security of smallholder farmers’ households.
Previous empirical studies, e.g., [24,25,26,27,28,29,30], examined farmers’ adaptation strategies for mitigating the negative consequences of changing climatic conditions, as well as their repercussions on food security in many parts of the world. However, empirical work on how climate change affects smallholder farmers’ food security in South Africa has been underexplored. As a result, this study adds to existing information by examining the factors influencing climate change adaptation techniques and how they affect food security. The study also focused on identifying and recommending applicable policies that could increase climate change adaptation in order to improve the welfare of smallholder farmers in South Africa’s rural areas.

2. Methodology

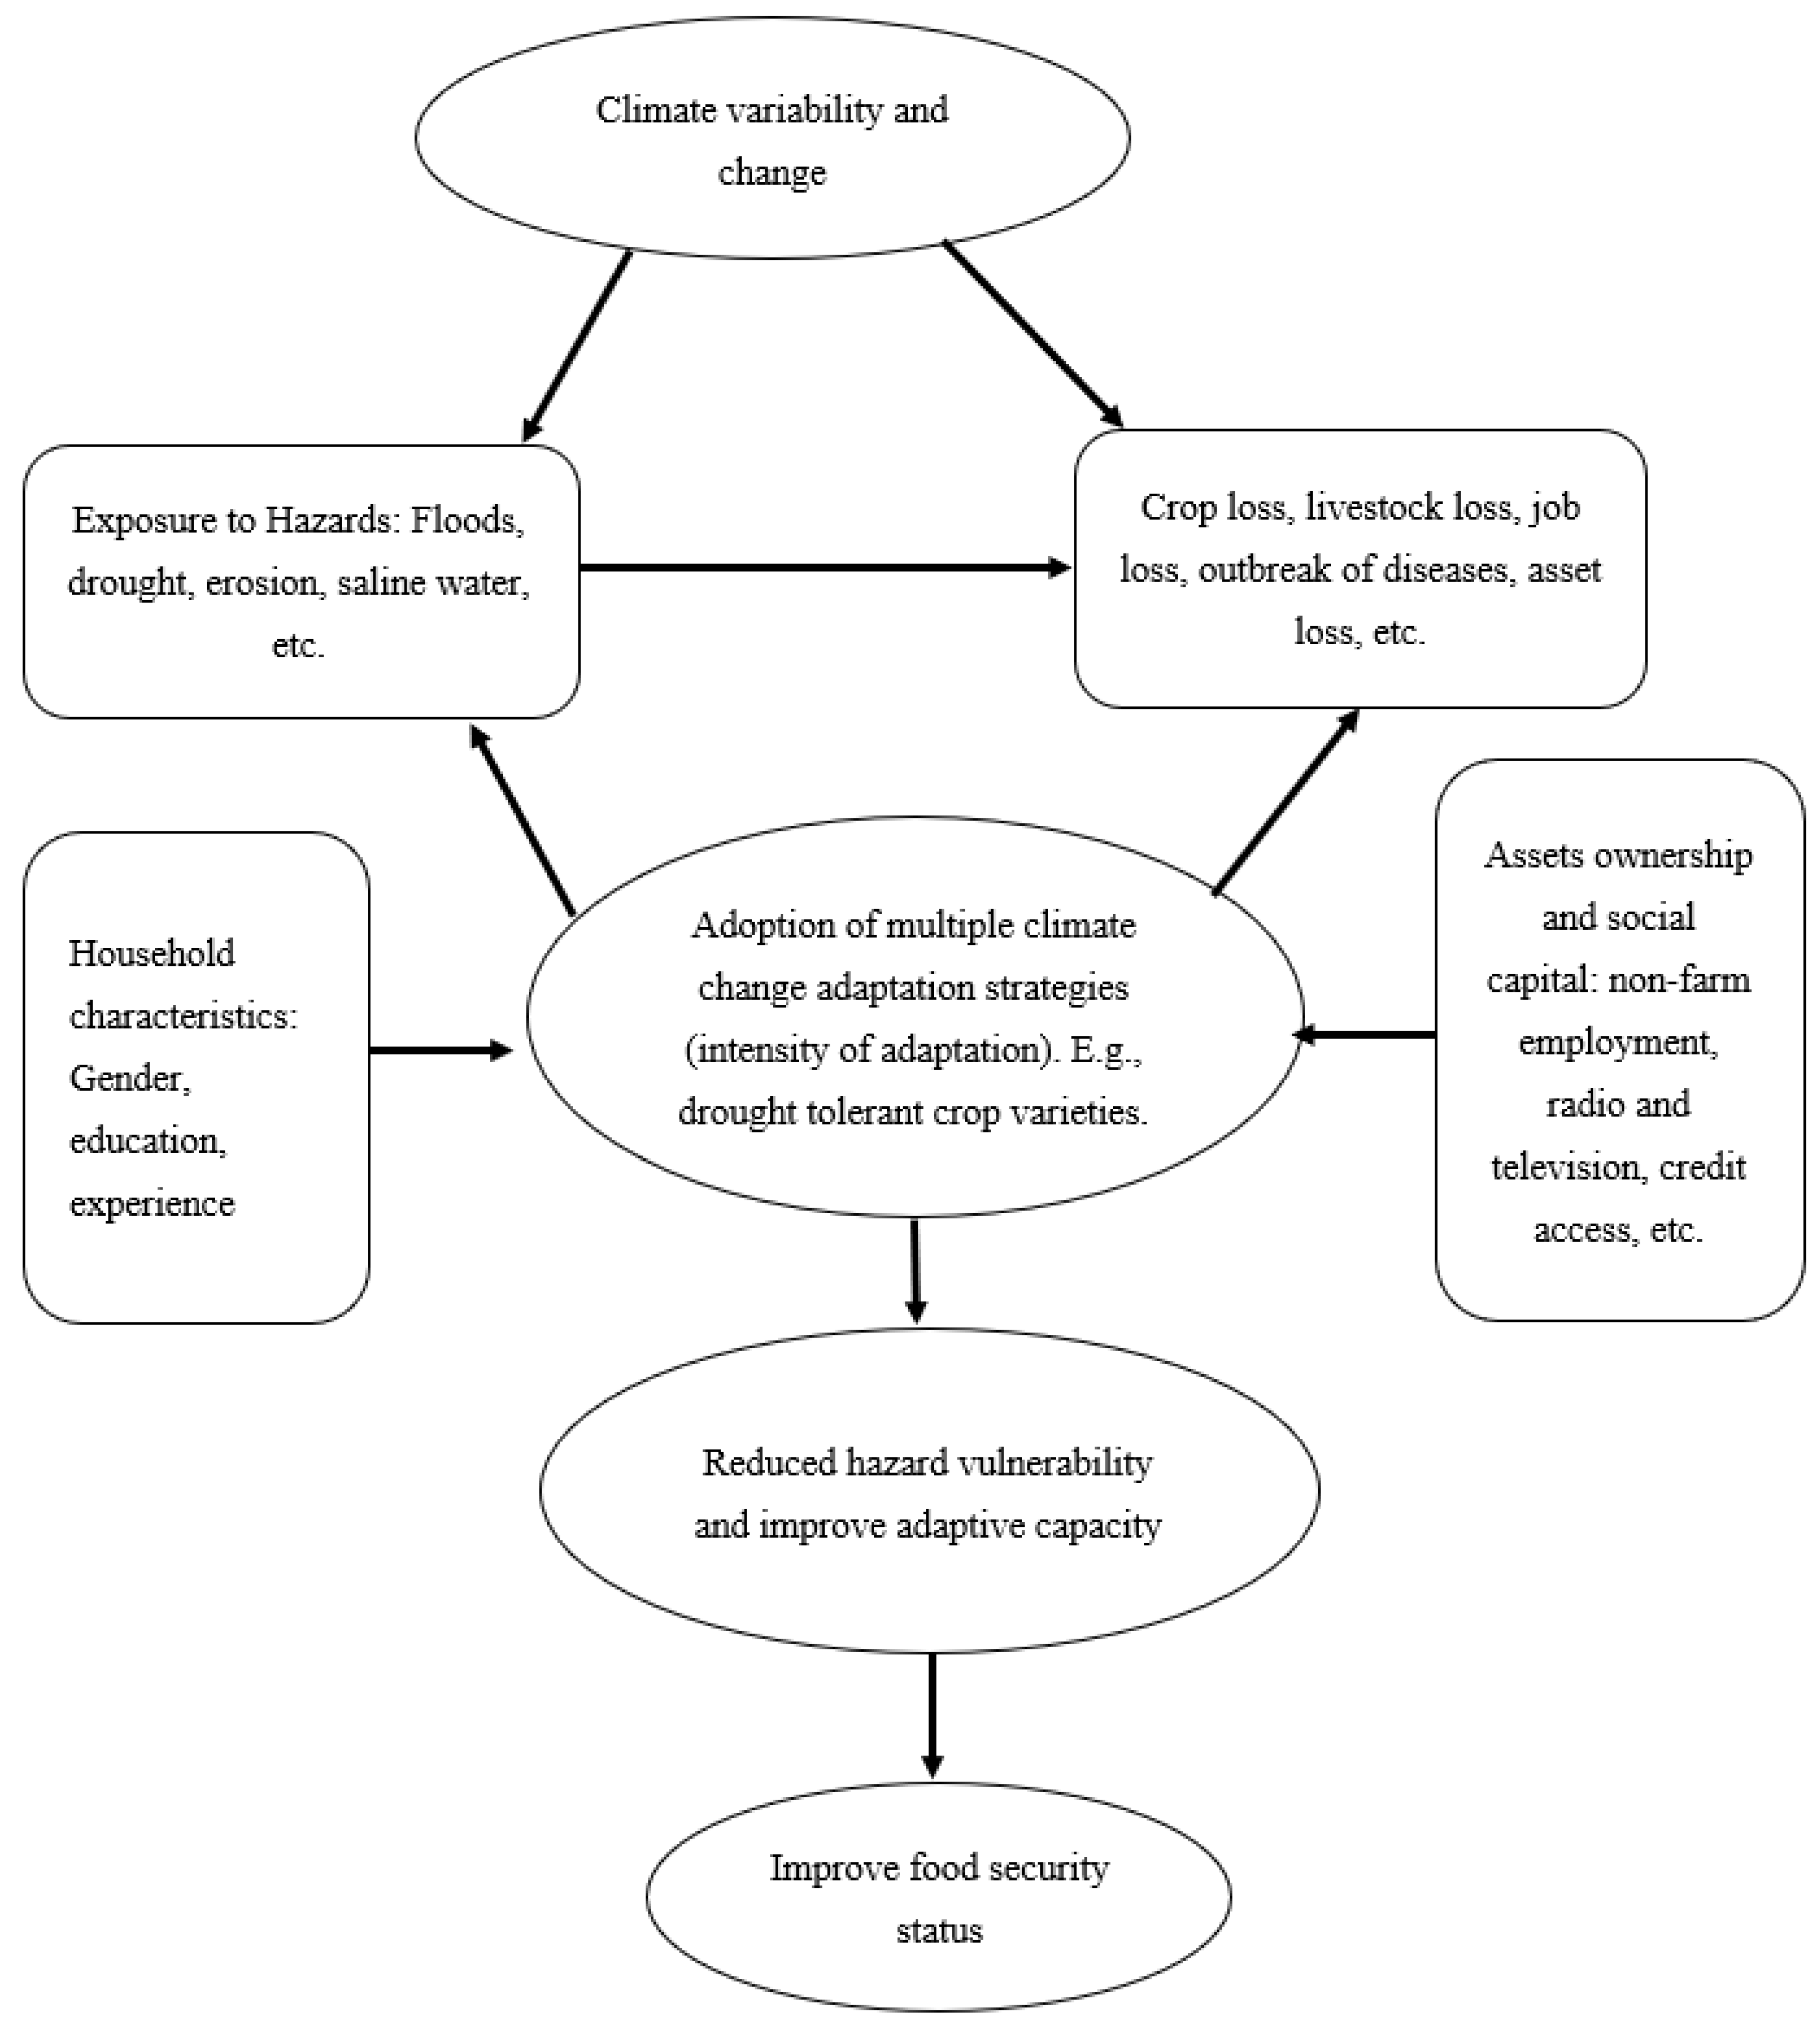
2.1. Conceptual Framework

For decades, the governmental and private sectors, as well as farmers themselves, have ignored natural resource management in rainfed-dependent areas [31]. Due to the high exposure to environmental risks and the little accumulated capital of the majority of rainfed-dependent farmers, most developing countries, particularly in Africa, have weak and uncertain farm incomes [32]. Farmers also face social and psychological challenges such as inequities, alienation, and economic misery [33]. Figure 1 depicts the relationship between climate variability and change, exposure to climate hazards, adaptation techniques, and the food security status of households. Changes in climate factors may expose households to a variety of dangers, including floods, droughts, land degradation, water salinity, and casualties. These exposures may have several repercussions on household livelihood indicators, such as crop productivity loss, livestock death, employment and income loss, asset loss, and the outbreak of pests and diseases, which may cause illnesses among household members. Households frequently employ a variety of adaptation tactics to protect themselves from these threats.
These adaptation strategies include improved crop variety (e.g., early maturing, drought-tolerant, etc.), varying planting dates, soil and water conservation, herd size reduction, tree planting, organic fertilizer/mulching application, livelihood diversification, and crop diversification insurance purchase, affect their food security status. According to the focus group discussion, these are the most often used climate change adaptation strategies in the study areas. Household decisions to implement multiple adaptation measures may be influenced by demographic characteristics such as age, educational attainment, experience, and so on, as well as assets and social capital such as ownership of information gadgets (radio and television), engagement in non-farm employment, access to credit, and access to extension services, among others. The study hypothesized that implementing many adaptation methods at the same time (intensity of adaptation strategies) would reduce households’ vulnerability to hazards and protect their livelihood indicators, hence improving their adaptive capacity. Thus, household food security is contingent on agricultural productivity, which is vulnerable to climate change. Thereby, with a proper reaction to climate change’s unfavorable consequences, smallholder farmers can produce their own food and earn a higher farm income from the surplus, enabling them to purchase food and thus enhance their food security status. Increased productivity results in a more consistent supply of food and greater revenues, which results in access to food and, thus, food security.

2.2. Food Security Measurement

Having adequate food for a healthy and active lifestyle is what is meant by the term “food security” [34]. Food security, or the ability of households and people to obtain food, is one of the most essential characteristics of well-being, yet its measurement has considerable difficulties. However complex it may be, ensuring that everyone has access to enough food is still critical for global food security. There are numerous indicators used to determine the food security status of households. Among these are the food consumption score (FCS), the household dietary diversity score (HDDS), the household coping strategy index (HCSI), the household hunger scale (HHS), and the household food insecurity and access scale (HFIAS). According to [35], no food security proxy can capture all of the many different aspects of food security. However, a comprehensive indicator of food security is legitimate, dependable, and comparable through time and space and covers many different aspects [36].
This study, therefore, adopts HFIAS as a food security indicator to evaluate the food security status of households in the study area. Food and Nutrition Technical Assistance II (FANTA) sponsored the development of the HFIAS between 2001 and 2006 in partnership with Tufts and Cornell universities and other collaborators. The HFIAS, like some of the other experience-based metrics, is based on a short questionnaire that captures the behavioral and psychological aspects of insecure food access, including having to decrease the number of meals taken or cut back on the quality of the food owing to a lack of resources. When it comes to assessing food insecurity, the HFIAS metric is unique because it may identify both the physical and psychological aspects of food insecurity, which can impair health and well-being [37]. According to [38], it can be applied in both urban and rural settings. Additionally, it is a brief survey that can be incorporated simply into other household questionnaires. HFIAS is based on nine questions aimed to assess whether households have experienced problems accessing food during the last 30 days. Questions were ordered in a way that they represent a generally increasing level of severity of food insecurity and can be divided into three domains: anxiety (question 1), inadequate quality (questions 2–4), and insufficient intake (questions 5–9) [39]. Respondents were asked about frequency, i.e., if the situation had never occurred or occurred rarely (once or twice in the past month), sometimes (three to ten times in the past month), or often (more than ten times in the past month). A continuous or discrete food security index can be derived from the responses. HFIAS is calculated as a continuous indicator by calculating a score for every one of the nine questions from 0–3, where 3 is the maximum frequency of occurrence. The total HFIAS might vary from 0 to 27, described as the level of insecurity in food availability that an individual is experiencing. Thus, the higher the HFIAS score, the more food insecurity a household can experience, and vice-versa. To categorize households (as in this study), the study utilizes the categorical variables “food-secure”, “mildly food-insecure”, “moderately food-insecure”, and “severely food-insecure” [39].

2.3. Empirical Specification

Estimating the impact of the adoption of CCAS on household food security of smallholder farmers entails using an econometric model outside the binary model. This study is based on the evaluation models, which use non-observational or non-experimental data. The problem one is likely to run into with such data is sample selection bias [40]. It is imperative to deal with the problem of sample selection bias, as intrinsic characteristics do not provide the excessive advantage of some households to be food-secure regardless of whether they adopt CCAS or not. It is also necessary to take into account the possibility that the adoption of CCAS is endogenous when assessing its impact on food security [41] as another methodological concern. There is a risk that CCAS estimations may be skewed by the presence of endogeneity. Reverse causality (simultaneity bias), omitted variables, and measurement mistakes are also potential sources of endogeneity [42].
Many research studies have found statistically significant links between the adoption and well-being of CCASs. In order to offset the negative effects of climate change on livelihoods, adopters may employ CCAS as a control approach [43]. In dealing with such issues, Heckman sample correction, propensity score matching (PSM), endogenous switching regression model, and generalized propensity score (GPS) matching in continuous treatment framework and treatment effects are mostly used to circumvent selectivity bias [40,44]. However, these models are suitable for unordered outcome variables. Since the outcome variable (i.e., food insecurity level) is ordered, this study employed treatment-effect ordered probit regression model as developed by [45] and applied [46]. Following [45], the selection equation, which represents the treatment model measuring the factors influencing the adoption of CCAS among smallholder farmers, as is specified in Equation (1):
C C A S i = { 1     i f     C C A S i * = Z i δ + ε i > 0 0     i f     C C A S i * = Z i δ + ε i 0
In Equation (1), C C A S i represents the individual adoption status of CCAS, Z i is a vector of explanatory variables, δ and ε i are estimated parameters and the error term, respectively.
The outcome of the treatment (adoption of CCAS) could be explained by the ordered discrete food security (FS) levels in ascending order from food-secure to severe food-insecure, and the equation can be specified as:
F S = { 1       i f     < X i β + υ i μ 1 2         i f     μ 1 < X i β + υ i μ 2   J 1     i f     μ J 1 < X i β + υ i μ J J     i f     μ J < X i β + υ i            
where μ 1 ,   μ 2 , ,     μ J denote cut parameters to be estimated, j = 1 ,   2 ,   ,   J represent possible food security categories, and F S i * is the latent food security variable for the ith household. X i is a set of variables explaining variation in household food security status and β is a parameter to be estimated. υ i is the error term for the outcome equations. In addition to the vector of explanatory variables in the CCAS equation (Equation (1)), access to climatic information was used as an instrument for the treatment variable (CCAS). The fundamental assumption is that farmers’ access to climatic information (e.g., through an early warning system) can directly influence farmers’ decision to employ CCAS but have no direct effect on food security. Thus, access to climatic information was included in the CCAS equation but not the outcome food security equation. As mentioned, in this study, we used a treatment estimator with ordered probit outcomes. In this case, a latent factor framework is used to handle any joint normality violations in the error terms, ε i and υ i which are formed by a factor structure in the treatment and outcome equations [46]. The underlying assumption of this model is that the factors determining the ordered outcome differ between the treated and the untreated groups. Nevertheless, this underlying assumption can yield inconsistent estimates if it is not entirely the case. To overcome this, Halton-based sequences, as posited by [47], drawn from the distributions of latent factors, were used (factors that are unobserved but affect the adoption of CCAS and food insecurity levels). As recommended by [48,49], the advantages of Halton sequences cover the domain of distribution, reduction of the variances, and reduction of the computational time. The estimators of the two Equations (1) and (2) were estimated through likelihood simulation techniques.

Average Treatments: ATE and ATT

An outcome’s response to treatment is expressed in terms of its treatment effects. The average treatment impact determines how much better-off and how much worse-off households would have been (in terms of food security) if they had not adopted any of the CCAS. Like many impact evaluation studies, this study estimated two treatment effects: average treatment effects (ATE), and the probability difference between observing an outcome with and without treatment. Similarly, the average effect of treatment on the treated (ATT) parameter can be defined as the treatment on those households who adopted any of the CCAS. Thus, ATT is the difference in the response variable (food security outcomes) of the treated group (Adopters of CCAS) with and without treatment.
Following [45], ATE specification with treatment-effect ordered probit structured is given as:
A T E j C C A S = 1 N 1 S i = 1 N   S = 1 S   [ Φ { μ k ( X i β + ϕ + λ η i s ) } Φ { μ k 1 ( X i β + ϕ + λ η i s } ] [ Φ { μ k ( X i β + λ η i s ) } Φ { μ k 1 ( X i β + λ η i s ) } ]
For ATT, it can be specified as:
A T T j C C A S = 1 N 1 S   1 E { Φ ( Z i δ ) } S = 1 S Φ ( Z i δ + η i s ) × [ Φ { μ k ( X i β + ϕ + λ η i s ) } Φ { μ k 1 ( X i β + ϕ + λ η i s } ] [ Φ { μ k ( X i β + λ η i s ) } Φ { μ k 1 ( X i β + λ η i s ) } ]  
In this case, k = 1 ,   k ,   k = J + 1 , and J is the number of outcome categories (food security). μ 0 = and μ k = ,   Φ is the standard normal cumulative distribution.

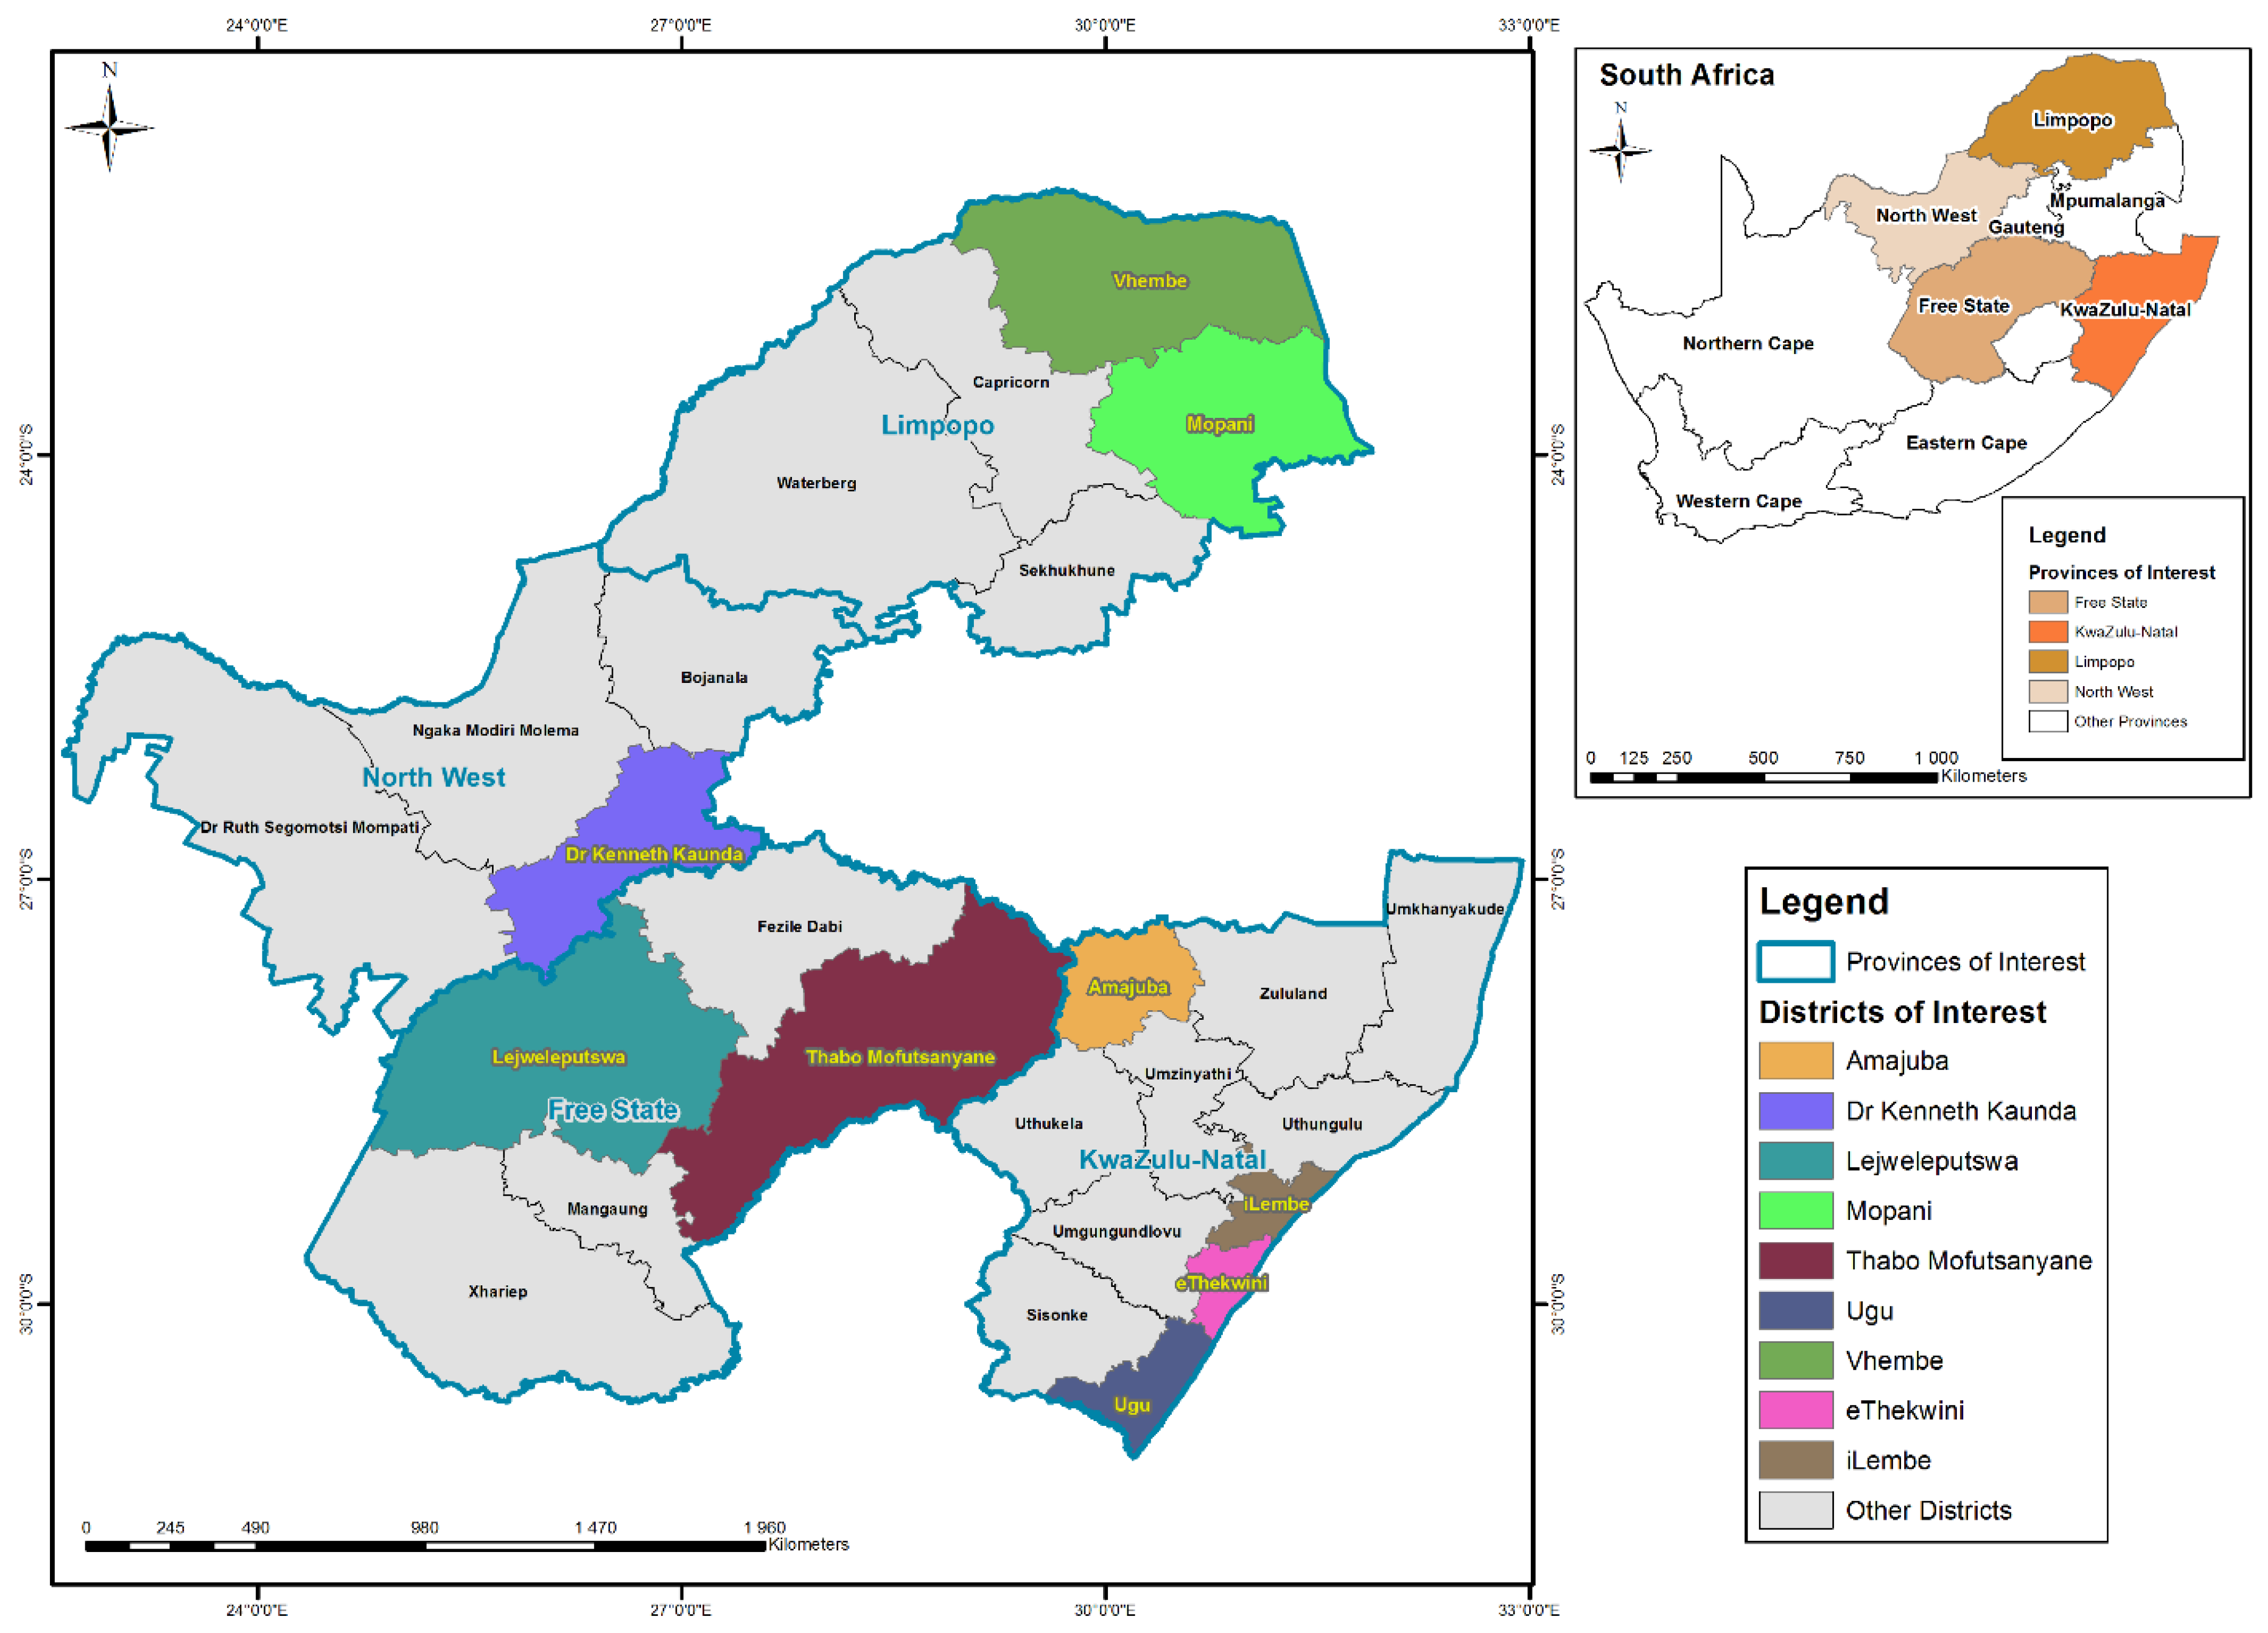
2.4. The Study Areas, Sampling and Data Collection Techniques

The study was conducted between November 2017 and June 2018 in nine districts within four provinces: KwaZulu-Natal, Limpopo, Free State, and North West. The nine (9) district municipalities included eThekwini, uGu, Amajuba, and Ilembe in the KwaZulu-Natal, and Mopani and Vhembe in the Limpopo Provinces. The remaining district municipalities are Lejweleputswa, Thabo-Mofutsanyane in the Free State, and Dr. Kenneth Kaunda situated in the mid-highlands (semi-arid) areas of North West province. These areas are within the Comprehensive Rural Development Programme (CRDP) sites. They were selected because they are situated in the core of rural extents with high climate and weather variations, particularly in droughts, flooding, and bush encroachment [50]. The choice of the study areas was also motivated by different demography and typological zones and linked to the priority municipalities for the implementation of the CRDP framework, which is a departmental strategy to implement projects and programmes within the prioritized poor districts [50].
Moreover, the provinces and districts were selected based on their incidence and vulnerability to climate-related issues and their recent designation as drought disaster regions. The study areas have only one major rainy season (September to February). Given this, the yearly precipitation distribution is imbalanced as there are more below-average than over-average precipitation years and the median is more expressive than the mean. Soil and water conservation practices are extensively used in the research areas. Figure 2 shows the map of the study areas.
A combination of three different approaches was used for the data collection. These are key informant interviews (KIIs), Focus Group Discussions (FGDs), and household surveys. Experts such as agricultural extension agents were interviewed to understand the climate change situation in the study areas and some adaptation strategies the farming households have been adopting, according to their opinion. One FGD was conducted for each district, with each FGD consisting of 9–12 farmers, including both men and women. An informal semi-structured questionnaire format was used for the FGDs. Village characteristics, perceptions of climate change, and ways of coping with climate change were gathered through the FGDs. The FGDs asked three different questions to make sure that farmers’ adaptation strategies were a direct result of climate change rather than being the result of other external influences: (1) is there any evidence that the local climate has shifted in the last 15–20 years? If so, describe them; (2) how have these changes affected your agricultural activities; and (3) what have been your strategies to deal with these changes? Describe them in detail. The adaptation strategies were then incorporated into a questionnaire for a household survey to assess how the households in the sampled population actually dealt with these issues.
Following the conclusion of the key informant interviews and FGDs, household surveys were conducted. A pre-test with non-sampled households was conducted to determine the questionnaire’s applicability before it was administered. As a result of pre-testing, KII and FGDs, the survey questionnaire was refined. Although the survey questionnaire was written in English, it was translated into the various local languages (IsiZulu, Setswana, South Sotho, and Tshivenda) so that the field workers could obtain accurate information from the farmers, as these languages are spoken by all of the residents and farming communities in these areas.
The study was designed in a multi-stage stratified random sampling procedure where a combination of purposive and random sampling procedures was used to identify and select a sample of the districts and smallholder farmers, respectively. Nine (9) districts in the four provinces were purposively selected in the first stage since the districts are frequently susceptible to climate-related problems and were recently declared drought disaster areas. Second, the farmers were selected from district municipalities proportionally using a systematic sampling method. In this case, the lists of the farmers were collected first from the field workers. An element of randomness was introduced in the systematic sampling method by using random numbers to pick with which to start. This sampling procedure is useful when a sampling frame is available (i.e., in the form of a list). In such a design, the selection process starts by picking some random points in the list, and then every nth element is selected until the desired number is secured. The participants were randomly selected according to their availability and to balanced coverage of the socioeconomic diversity of the farms in the study villages. In each district municipality, an average of twenty (20) farmers (head of household) was surveyed. Based on a formula suggested by [51], the sample sizes needed a 95 percent confidence level, 5 percent variability, and 8 percent precision. As a result, 183 of the 200 households surveyed were included in the study. In this study, households that adopted at least one strategy in response to climate change are termed as “adapters”, and those adopting none were described as “non-adapters”. In all, 53 farming households (29%) were non-adapters while the remaining were adapters.

3. Results and Discussion

3.1. Descriptive Statistics

This section describes both dependent variables (severity of food security and adaptation strategies) and the socioeconomic characteristics of the respondents. The study classified households into those that adopted and those who did not adopt CCAS in order to assess how these measures affected the food security of the farming households. The results in Table 1 showed that adapters were more food-secure and mildly food-insecure than non-adapters (13.9 and 48.9%, respectively) (6.6 and 43.0%, respectively). Non-adapters were also more likely than adapters to experience moderate or severe food insecurity (25.8 and 24.4%, respectively) (20.0 and 17.2%). According to the t-test results, there were no significant differences between the groups. However, the econometric analysis carefully tested these descriptive results in Section 3.3.
As a result of climate change, agricultural households adopted a wide range of adaptation measures. These adaptation strategies are viewed as normal [52]. However, farmers in the study area adopted eight common adaptation methods, as depicted in Figure 3. Farmers’ adaptation techniques to climate change often differ from household to household because they are based on their own unique requirements and capacities. Using improved crop varieties as an adaptation method is the most extensively utilized adaptation measure, as shown in Figure 3, with approximately 47% of agricultural households adopting it. This is due to the fact that enhanced cultivars may contain some characteristics that battle climate change, such as drought tolerance, early maturity, and high yield. Farmers also change their planting date to coincide with the changes in the pattern of climatic variables, particularly rainfall and temperature, and they usually rely on their long-standing experience, information from metrological agencies, or agricultural extension agents.
Similarly, [53,54] observed that changing the planting and harvesting dates of crops is one of the key adaptation measures practiced by smallholder farmers in Ethiopia and Nigeria, respectively. In addition to planting trees to protect crops from storms, about 12% of the smallholder farmers use this approach to provide shade for their crops in response to high temperatures. Drought or high temperatures dehydrate the soil, which reduces water retention, kills soil pathogens, and renders the soil infertile. However, only approximately 8% of smallholder farmers use mulching or inorganic fertilizer to boost soil moisture content in response to soil infertility. Soil and water conservation measures like watershed management, irrigation, or terracing on the slope are used by around a third (33%) of farmers in order to cope with the harsh climatic conditions. A number of other studies, such as [17,22], found that farmers in Nigeria exploited soil and water conservation as an adaptation strategy.
Only 6% of farmers get crop insurance to protect their crops from adverse weather events such as floods and droughts. Some farmers also use livelihood diversification to mitigate climate-related concerns. It is common for farmers to diversify their agricultural and non-agricultural occupations by cultivating crops and livestock and petty trading. One of the most important long-term adaptation measures is herd management, which is typically accomplished through destocking or a reduction in the size of the herd. In the event of bad weather, farmers can sell some of their livestock and accumulate purchasing power to buy food and engage in other activities, such as crop cultivation, through destocking. There were still just 12% of farmers that adopted this strategy.
A comparison of the socioeconomic characteristics of adapters and non-adapters is also shown in Table 1. These variables have been hypothesized to influence households’ decision to adopt CCAS and food security status. The male-headed households were significantly more than the female-headed households, and the average age of the farming household was 44 years. On average, household heads attained at least primary education and had about 10 years of experience in crop production. For engagement in non-agricultural economic activities, climate change adapters are considerably more (51%) than non-adapters, as indicated by the t-test value. In addition, about 25% and 48% of the respondents owned television and radio, respectively. These two assets could serve as key sources of information on climate change to the households. There is also a statistically significant difference in mobile phone use between adapters and non-adapters. Moreover, about 48%, 64%, 33% and 45% had received training on agricultural practices, including climate change, are FBO members, and had access to extension services and agricultural credit, respectively.

3.2. Determinants of Climate Change Adaptation

The first output from the treatment-effect ordered probit regression model, which identified factors influencing farmers’ decision to take measures to fight the negative consequences of climate change, is presented in Table 2. From the econometric output, age, gender, TLU, and access to climatic information through early warning system contributed to farmers’ decision to adapt.
The empirical result shows that the age of smallholder farmers is statistically significant and negatively influenced the adoption of CCAS in the study areas. This implies that as smallholder farmers grow older, they may be less interested in investing in CCAS, perhaps due to more family responsibilities. Therefore, the result indicates that the younger farmers are more likely to adopt the CCAS compared to the older farmers. The result agrees with that of [17,55], who found that age negatively influenced the adoption of CCAS. Similarly, the gender variable is a negatively signed and statistically significant variable, indicating that the adoption of climate change adaptation is more likely to be practiced by the female farmers as compared to the male farmers. This could be ascribed to the fact that women are risk-averse and therefore find interest in adopting strategies that could help to avoid the risks associated with climate change. These findings correspond with the reports from the literature where women have been found to be risk-averse [56,57]. In addition, the perspectives and significant interest of women to adopt climate change strategies could be linked to the fact that they are more vulnerable to the consequences of climate change risks such as floods, droughts, and storms. Most importantly, women have been reported to have inadequate access to resources, limited rights, and insufficient mobility and voice in household decision-making [58].
Livestock is one of the primary means of livelihood and income generation by smallholder farmers. The income generated from livestock is usually used to combat the negative effects of climate change through the purchase of inputs such as drought-tolerant crop varieties. TLU is one of the critical factors contributing to the probability of adopting the CCAS by the smallholder farmers. It was estimated to be positively and significantly influenced by the likelihood of adopting the CCAS. Thus, farmers who owned a large stock of livestock measured by TLU had a higher probability of employing measures to combat the negative effect of climate change. The study results further established that farmers who had access to climatic information or were made aware of changes in the weather pattern through an early warning system had a higher probability of employing climate change measures. This early warning system probably helps prepare farmers physically and psychologically for future changes in climatic conditions. The pivotal role of access to climatic information through early warning systems confirms previous studies by [59,60].

3.3. Determinants of Household Food Insecurity

The empirical results in Table 3 show the factors that influence households’ food insecurity in relation to the adoption of CCAS in the study areas. The empirical results show a positive and statistically significant relationship between the ownership of a radio and a television with household food security in the study areas. Farming practices and technologies, including climate change measures, are frequently discussed on radio and television. Farming households who own these devices will have easier access to information on how to boost farm output and diversify their livelihoods, and consequently, improve their food security status. Similar to this study, communication devices such as radio and television have a positive role in many empirical studies such as [61]. The results further indicate that TLU had a positive and significant influence on household food security. Higher TLU lowered the likelihood of food insecurity and raised the likelihood of food security. Households with livestock, such as cattle, small ruminants (such as pigs, sheep, and goats), and poultry are less likely to suffer from food insecurity. Studies conducted by [61,62] show that livestock can help alleviate food insecurity by increasing household cash income as well as improving household diets.
Farmers’ access to agricultural credit contributes positively to the food security status of the rural household in the study area. Farmers’ access to rural financing is seen as a critical instrument for reducing poverty and improved food security. With financial access, crop types that are better able to withstand extreme weather conditions can be purchased by farmers in order to offset the effects of climate change and consequently reduce the probability of being food insecure. An earlier study observed that agricultural financing has a higher probability of increasing food production to ensure food security among farming households in Pakistan [63].
The study showed that the variable adaptation of climate change strategies is statistically significant and positively affected household food security. This implies that the more the household adapts to climate change, the more they can produce more food, which translates to improved food security. Farmers who adapt to climate change using various adaptation strategies such as soil and water conservation, new crop varieties, livestock vaccination, etc., are protected against the climate change hazards and enhance their food security. Climate change effects, such as the changes in temperature, precipitation patterns, and the variation in the length of the growing season, are well managed with the mentioned adaptation strategies and play a key role in avoiding the food insecurity issues in the rural household. This study agrees with the investigations of [60,61], who found that adapting to climate change is vital for protecting farmers from climate shift and securing food for rural households.

3.4. Impact of Climate Change Adaptation on Food Security

The descriptive results in Table 1 show no significant influence between adopters and non-adopters of CCAS in all the four categories of food security: food-secure, mild food-insecure, and severe food-insecure. This is probably because the issue of selection bias, endogeneity, and missing data cannot be accounted for using a simple t-test. Table 4 presents the results of the treatment effects (ATE and ATT) from the treatment-effect ordered probit model using the maximum likelihood estimator. The ATE results indicate that adopting at least one of the adaptation strategies increases the food security and mild food insecurity status of the entire study population by 10.9% and 12.9%, respectively. However, adopting adaptation strategies reduces the probability of entire study households being moderately and severely food-insecure by 6.5% and 17.2%, respectively.
Similarly, the mean value of the ATT suggests that adopters of CCAS have the possibility of increasing their food security status by 12.5% and mild food insecurity status by 23.9% more than their food (in)security situation if they had not adopted any of the CCAS. In addition, adopters of CCAS have a probability of reducing their moderate and severe food insecurity status by 7.5% and 28.9%, respectively, which is better than if they had not adopted any of the CCAS. According to these findings, households in drought-pruned areas (like those under study) are more likely to be resilient to the harsh conditions of the areas through climate adaptation measures. In addition, the results confirm those of a previous study by [60] about the effect of climate change on the food security of pastoral farmers in Kenya.

4. Conclusions

Climate change is expected to have a significant negative impact on smallholder subsistence farmers, posing a substantial threat to household food security. This study analyzed farmers’ adaptation strategies to climate change among smallholder farmers and further analyzed the adoption impact on the food security of the farming households, based on a cross-sectional survey data collected from the provinces of KwaZulu-Natal, Free State, North West, and Limpopo, South Africa. Key adaptation measures most farmers employ include improved crop varieties, varying planting dates, soil and water conservation practices, and livelihood diversification. The econometric results suggest that household socioeconomic factors, particularly non-farm income, access to credit, and access to media devices such as TVs, radios, and mobile phones, increase smallholder farmers’ likelihood of adopting CCAS. The results further show that farmers who adapted climate change strategies have access to extension support, non-farm income, and communication devices such as mobile phones had a greater tendency of decreasing their food insecurity status. Moreover, climate change adaptation had a probability of significantly increasing households’ food security by about 12% while reducing severe food insecurity by about 29%. Thus, farming households that employed strategies to counteract the adverse effects of climatic conditions were better off in terms of their food security status than those that did not adapt.
The study’s findings have some implications for farm-level policy decisions and implementations. First, the study recommends that governments and non-governmental organizations (NGOs) must support smallholder farmers’ Indigenous adaptation options with a wide range of institutional, regulatory, and technology support, with part of it focusing on female-headed family households. Farm-level policy decisions should prioritize training farmers to enhance climate change information and raising climate change awareness. Second, facilitating funding and market access, particularly for adaptable technology, could also help smallholder farmers spread their adaptation methods across various adaptation portfolios and levels of adaptation measures. Third, due to the variable and uncertain rainy season in South Africa in general, rainfed agriculture is less possible; hence policy-driven activities are critical to improve farmers’ irrigation participation and develop surface water irrigation infrastructure. Fourth, income diversification should be prioritized, focusing on non-farm income streams that are less vulnerable to climate change, as the results suggest that farmers with non-farm income are more likely to be food-secured. Thus, government and other stakeholders like non-governmental organizations should prioritize the strengthening and training of small enterprises where women and youth are encouraged to engage in the cottage industry where farm waste materials are used.
Finally, the results reveal that farmers use more than a single adaptation measure, which suggests a combination of possible measures farmers can choose. Therefore, an analysis of the best combination of strategies that will give the best economic returns to farmers is important for farm-level policy design and implementation. Beyond climate change adaptation strategies, future studies should consider internal and external factors that can lead to farmers’ distress and vulnerability by developing a farmer distress index (FDI). According to the literature, a FDI goes beyond adaptation and mitigation and includes risk exposure, adaptive capacity, sensitivity, and socio-psychological factors, among others.

Funding

This research received no external funding.

Institutional Review Board Statement

Not applicable.

Informed Consent Statement

Informed consent was obtained from all subjects involved in the study.

Data Availability Statement

Data will be available on request from the author.

Conflicts of Interest

The author declares no conflict of interest.

References

  1. Bhuiyan, C.; Saha, A.K.; Bandyopadhyay, N.; Kogan, F.N. Analyzing the impact of thermal stress on vegetation health and agricultural drought–a case study from Gujarat, India. GIScience Remote Sens. 2017, 54, 678–699. [Google Scholar] [CrossRef]
  2. Masipa, T. The impact of climate change on food security in South Africa: Current realities and challenges ahead. Jàmbá J. Disaster Risk Stud. 2017, 9, 1–7. [Google Scholar] [CrossRef] [PubMed] [Green Version]
  3. Bakht, S.; Safdar, K.; Khair, K.U.; Fatima, A.; Fayyaz, A.; Ali, S.M.; Munir, H.; Farid, M. The Response of Major Food Crops to Drought Stress: Physiological and Biochemical Responses. In Agronomic Crops; Springer: Singapore, 2020; pp. 93–115. [Google Scholar]
  4. Food and Agriculture Organization of the United Nations. The Impact of Natural Hazards and Disasters on Agriculture and Food Security and Nutrition: A Call for Action to Build Resilient Livelihoods; Food and Agriculture Organization of the United Nations: Rome, Italy, 2015. [Google Scholar]
  5. Bwalya, M. Comprehensive Africa Agriculture Development Programme (CAADP) to Reduce Food Security Emergencies in Africa; NEPAD Planning and Coordinating Agency: Johannesburg, South Africa, 2013. [Google Scholar]
  6. Nangombe, S.; Zhou, T.; Zhang, W.; Wu, B.; Hu, S.; Zou, L.; Li, D. Record-breaking climate extremes in Africa under stabilized 1.5 C and 2 C global warming scenarios. Nat. Clim. Change 2018, 8, 375–380. [Google Scholar] [CrossRef]
  7. Sousa, P.M.; Blamey, R.C.; Reason, C.J.; Ramos, A.M.; Trigo, R.M. The ‘Day Zero’Cape Town drought and the poleward migration of moisture corridors. Environ. Res. Lett. 2018, 13, 124025. [Google Scholar] [CrossRef] [Green Version]
  8. Mugambiwa, S.S.; Tirivangasi, H.M. Climate change: A threat towards achieving ‘Sustainable Development Goal number two’ (end hunger, achieve food security and improved nutrition and promote sustainable agriculture) in South Africa. Jàmbá J. Disaster Risk Stud. 2017, 9, 1–6. [Google Scholar] [CrossRef] [Green Version]
  9. Cammarano, D.; Valdivia, R.O.; Beletse, Y.G.; Durand, W.; Crespo, O.; Tesfuhuney, W.A.; Antle, J. Integrated assessment of climate change impacts on crop productivity and income of commercial maize farms in northeast South Africa. Food Secur. 2020, 12, 659–678. [Google Scholar] [CrossRef]
  10. Shisanya, S.; Mafongoya, P. Adaptation to climate change and the impacts on household food security among rural farmers in uMzinyathi District of Kwazulu-Natal, South Africa. Food Secur. 2016, 8, 597–608. [Google Scholar] [CrossRef]
  11. Adetoro, A.A.; Abraham, S.; Paraskevopoulos, A.L.; Owusu-Sekyere, E.; Jordaan, H.; Orimoloye, I.R. Alleviating water shortages by decreasing water footprint in sugarcane production: The impacts of different soil mulching and irrigation systems in South Africa. Groundw. Sustain. Dev. 2020, 11, 100464. [Google Scholar] [CrossRef]
  12. Morton, J.F. The impact of climate change on smallholder and subsistence agriculture. Proc. Natl. Acad. Sci. USA 2007, 104, 19680–19685. [Google Scholar] [CrossRef] [Green Version]
  13. Harvey, C.A.; Viguera, B.; Vignola, R.; Viguera, B.; Chain-Guadarrama, A.; Vignola, R.; Alpizar, F. Climate change impacts and adaptation among smallholder farmers in Central America. Agric. Food Security 2018, 7, 1–20. [Google Scholar] [CrossRef]
  14. Wiebe, K.; Robinson, S.; Cattaneo, A. Climate change, agriculture and food security: Impacts and the potential for adaptation and mitigation. Sustain. Food Agric. 2019, 55–74. [Google Scholar] [CrossRef]
  15. Ojo, T.O.; Adetoro, A.A.; Ogundeji, A.A.; Belle, J.A. Quantifying the determinants of climate change adaptation strategies and farmers’ access to credit in South Africa. Sci. Total Environ. 2021, 792, 148499. [Google Scholar] [CrossRef] [PubMed]
  16. Owen, G. What makes climate change adaptation effective? A systematic review of the literature. Glob. Environ. Change 2020, 62, 102071. [Google Scholar] [CrossRef]
  17. Adeagbo, O.A.; Ojo, T.O.; Adetoro, A.A. Understanding the determinants of climate change adaptation strategies among smallholder maize farmers in South-west, Nigeria. Heliyon 2021, 7, e06231. [Google Scholar] [CrossRef]
  18. Akanbi, R.T.; Davis, N.; Ndarana, T. Climate change and maize production in the Vaal catchment of South Africa: Assessment of farmers’ awareness, perceptions and adaptation strategies. Clim. Res. 2021, 82, 191–209. [Google Scholar] [CrossRef]
  19. Fadina, A.M.R.; Barjolle, D. Farmers’ adaptation strategies to climate change and their implications in the Zou department of South Benin. Environments 2018, 5, 15. [Google Scholar] [CrossRef] [Green Version]
  20. Kogo, B.K.; Kumar, L.; Koech, R. Climate change and variability in Kenya: A review of impacts on agriculture and food security. Environ. Dev. Sustain. 2021, 23, 23–43. [Google Scholar] [CrossRef]
  21. Asare-Nuamah, P.; Mandaza, M.S. Climate change adaptation strategies and food security of smallholder farmers in the rural Adansi North District of Ghana. In Handbook of Climate Change Management: Research, Leadership, Transformation; Springer International Publishing: Berlin/Heidelberg, Germany, 2020; pp. 1–20. [Google Scholar]
  22. Ojo, T.O.; Baiyegunhi, L.J.S. Determinants of climate change adaptation strategies and its impact on the net farm income of rice farmers in south-west Nigeria. Land Use Policy 2020, 95, 103946. [Google Scholar] [CrossRef]
  23. Oluwatayo, I.B. Towards assuring food security in South Africa: Smallholder farmers as drivers. AIMS Agric. Food 2019, 4, 485–500. [Google Scholar] [CrossRef]
  24. Di Falco, S.; Veronesi, M.; Yesuf, M. Does adaptation to climate change provide food security? A micro-perspective from Ethiopia. Am. J. Agric. Econ. 2011, 93, 829–846. [Google Scholar] [CrossRef] [Green Version]
  25. Webber, H.; Gaiser, T.; Ewert, F. What role can crop models play in supporting climate change adaptation decisions to enhance food security in Sub-Saharan Africa? Agric. Syst. 2014, 127, 161–177. [Google Scholar] [CrossRef]
  26. Below, T.B.; Schmid, J.C.; Sieber, S. Farmers’ knowledge and perception of climatic risks and options for climate change adaptation: A case study from two Tanzanian villages. Reg. Environ. Change 2015, 15, 1169–1180. [Google Scholar] [CrossRef]
  27. Douxchamps, S.; Van Wijk, M.T.; Silvestri, S.; Moussa, A.S.; Quiros, C.; Ndour, N.Y.B.; Buah, S.; Somé, L.; Herrero, M.; Kristjanson, P.; et al. Linking agricultural adaptation strategies, food security and vulnerability: Evidence from West Africa. Reg. Environ. Change 2016, 16, 1305–1317. [Google Scholar] [CrossRef] [Green Version]
  28. Donkor, E.; Owusu, V.; Owusu-Sekyere, E.; Ogundeji, A.A. The adoption of farm innovations among rice producers in Northern Ghana: Implications for sustainable rice supply. Agriculture 2018, 8, 121. [Google Scholar] [CrossRef] [Green Version]
  29. Asfaw, A.; Simane, B.; Bantider, A.; Hassen, A. Determinants in the adoption of climate change adaptation strategies: Evidence from rainfed-dependent smallholder farmers in north-central Ethiopia (Woleka sub-basin). Environ. Dev. Sustain. 2019, 21, 2535–2565. [Google Scholar] [CrossRef]
  30. Soglo, Y.Y.; Nonvide, G.M.A. Climate change perceptions and responsive strategies in Benin: The case of maize farmers. Clim. Change 2019, 155, 245–256. [Google Scholar] [CrossRef]
  31. Montana, E.; Diaz, H.P.; Hurlbert, M. Development, local livelihoods, and vulnerabilities to global environmental change in the South American Dry Andes. Reg. Environ. Chang. 2016, 16, 2215–2228. [Google Scholar] [CrossRef]
  32. Reddy, A.A.; Bhattacharya, A.; Reddy, S.V.; Ricart, S. Farmers’ Distress Index: An Approach for an Action Plan to Reduce Vulnerability in the Drylands of India. Land 2021, 10, 1236. [Google Scholar] [CrossRef]
  33. Guerrero Lara, L.; Pereira, L.M.; Ravera, F.; Jiménez-Aceituno, A. Flipping the Tortilla: Social-ecological innovations and traditional ecological knowledge for more sustainable agri-food systems in Spain. Sustainability 2019, 11, 1222. [Google Scholar] [CrossRef] [Green Version]
  34. Cafiero, C.; Viviani, S.; Nord, M. Food security measurement in a global context: The food insecurity experience scale. Measurement 2018, 116, 146–152. [Google Scholar] [CrossRef]
  35. Maxwell, D.; Coates, J. Reaching for the Stars? Identifying Universal Measures of Food Insecurity; Paper presented at the Presentation at the FAO International Scientific Symposium; Food and Agriculture Organization: Rome, Italy, 2012. [Google Scholar]
  36. Maxwell, D.; Coates, J.; Vaitla, B. How Do Different Indicators of Household Food Security Compare? Empirical Evidence from Tigray; Feinstein International Center, Tufts University: Medford, MA, USA, 2013; p. 26. [Google Scholar]
  37. Ballard, T.J.; Kepple, A.W.; Carfielo, C. Food Insecurity Experience Scale: Development of Global Standard for Monitoring Hunger Worldwide; FAO Technical Paper Version 1.1; Food and Agriculture Organization: Rome, Italy, 2013. [Google Scholar]
  38. Mohammadi, F.; Omidvar, N.; Houshiar-Red, A.; Mohammad-Reza, K.; Abdollahi, M.; Mehrabi, Y. Validity of an adapted household food insecurity experience access scale in urban households in Iran. Public Health Nutr. 2012, 15, 149–157. [Google Scholar] [CrossRef] [PubMed] [Green Version]
  39. Coates, J.; Swindale, A.; Bilinsky, P. Household Food Insecurity Access Scale (HFIAS) for Measurement of Food Access: Indicator Guide (Version 3); Food and Nutrition Technical Assistance Project (FANTA); Academy for Educational Development: Washington, DC, USA, 2007. [Google Scholar]
  40. Heckman, J.J. Sample Selection Bias as a Specification Error. Econometrica 1979, 47, 153–161. [Google Scholar] [CrossRef]
  41. Fang, H.; Ali, M.M.; Rizzo, J.A. Does smoking affect body weight and obesity in China? Econ. Hum. Biol. 2009, 7, 334–350. [Google Scholar] [CrossRef] [PubMed]
  42. Wooldridge, J.M. Econometric Analysis of Cross Section and Panel Data, 2nd ed.; MIT Press: Cambridge, MA, USA, 2010. [Google Scholar]
  43. Copeland, A.L.; McVay, M.A.; Martin, P.D.; Rash, C.J.; Kendzor, D.E.; Baillie, L.E.; Spearsg, C.A.; Geiselmanab, P.J. Smoking relapse and weight gain prevention program for postmenopausal weight-concerned women: A pilot study. Eat. Behav. 2015, 18, 107–114. [Google Scholar] [CrossRef] [Green Version]
  44. Asfaw, S.; Di Battistab, F.; Lipper, L. Agricultural Technology Adoption under Climate Change in the Sahel: Micro-evidence from Niger. J. Afr. Econ. 2016, 25, 1–33. [Google Scholar] [CrossRef]
  45. Gregory, C.A. Estimating treatment effects for ordered outcomes using maximum simulated likelihood. Stata J. 2015, 15, 756–774. [Google Scholar] [CrossRef] [Green Version]
  46. Mabe, F.N.; Mumuni, E.; Sulemana, N. Does smallholder farmers’ awareness of sustainable development goal 2 improve household food security in the Northern Region of Ghana? Agric. Food Secur. 2021, 10, 9. [Google Scholar] [CrossRef]
  47. Jaworowska, A.; Blackham, T.; Davies, I.G.; Stevenson, L. Nutritional challenges and health implications of takeaway and fast food. Nutr. Rev. 2013, 71, 310–318. [Google Scholar] [CrossRef]
  48. Drukker, D.M.; Gates, R. Generating Halton sequences using Mata. Stata J. 2006, 6, 214–228. [Google Scholar] [CrossRef] [Green Version]
  49. Deb, P.; Trivedi, P.K. Maximum simulated likelihood estimation of a negative binomial regression model with multinomial endogenous treatment. Stata J. 2006, 6, 246–255. [Google Scholar] [CrossRef] [Green Version]
  50. Department of Rural Development and Land Reform (DRDLR). Land Reform News. 2015. Available online: http://www.ruraldevelopment.gov.za/ (accessed on 20 March 2015).
  51. Cochran, W.G. Sampling Techniques, 3rd ed.; John Wiley & Sons: New York, NY, USA, 1977. [Google Scholar]
  52. Abid, M.; Ali, A.; Rahut, D.B.; Raza, M. Ex-ante and Ex-post coping strategies for climatic shocks and adaptation determinants in rural Malawi. Clim. Risk Manag. 2020, 27, 100200. [Google Scholar] [CrossRef]
  53. Asfaw, E.; Suryabhagavan, K.V.; Argaw, M. Soil salinity modeling and mapping using remote sensing and GIS: The case of Wonji sugar cane irrigation farm, Ethiopia. J. Saudi Soc. Agric. Sci. 2018, 17, 250–258. [Google Scholar] [CrossRef] [Green Version]
  54. Danso-Abbeam, G.; Ojo, T.O.; Baiyegunhi, L.J.S.; Ogundeji, A.A. Climate change adaptation strategies by smallholder farmers in Nigeria: Does non-farm employment play any role? Heliyon 2021, 7, e07162. [Google Scholar] [CrossRef] [PubMed]
  55. Islam, A.R.M.T.; Shill, B.K.; Salam, R.; Siddik, M.N.A.; Patwary, M.A. Insight into farmers’ agricultural adaptive strategy to climate change in northern Bangladesh. Environ. Dev. Sustain. 2021, 23, 2439–2464. [Google Scholar] [CrossRef]
  56. Fosu-Mensah, B.Y.; Vlek, P.L.; MacCarthy, D.S. Farmers’ perception and adaptation to climate change: A case study of Sekyedumase district in Ghana. Environ. Dev. Sustain. 2012, 14, 495–505. [Google Scholar] [CrossRef]
  57. Jianjun, J.; Yiwei, G.; Xiaomin, W.; Nam, P.K. Farmers’ risk preferences and their climate change adaptation strategies in the Yongqiao District, China. Land Use Policy 2015, 47, 365–372. [Google Scholar] [CrossRef]
  58. Jin, J.; Wang, X.; Gao, Y. Gender differences in farmers’ responses to climate change adaptation in Yongqiao District, China. Sci. Total Environ. 2015, 538, 942–948. [Google Scholar] [CrossRef]
  59. Getachew, S.; Tilahun, T.; Teshager, M. Determinants of agro-pastoralist climate change adaptation strategies: Case of Rayitu Woredas, Oromiya Region, Ethiopia. Res. J. Environ. Sci. 2014, 8, 300–317. [Google Scholar] [CrossRef] [Green Version]
  60. Ndiritu, S.W.; Muricho, G. Impact of climate change adaptation on food security: Evidence from semi-arid lands, Kenya. Clim. Change 2021, 167, 1–20. [Google Scholar] [CrossRef]
  61. Danso-Abbeam, G.; Baiyegunhi, L.J.S.; Laing, M.D.; Hussein, S. Understanding the determinants of food security among rural households in Rwanda. Ecol. Food Nutr. 2022, 61, 1–19. [Google Scholar] [CrossRef]
  62. Tefera, T.; Tefera, F. Determinants of households food security and coping strategies for food shortfall in mareko district, guraghe zone southern ethiopia. J. Food Secur. 2014, 2, 92–99. [Google Scholar]
  63. Asghar, N.; Salman, A. Impact of agriculture credit on food production and food security in Pakistan. Parkistan J. Commer. Social Sci. 2018, 12, 851–864. [Google Scholar]
Figure 1. Conceptual framework showing climate change, exposure to hazards, adoption of climate change adaptation strategies, and households’ food security status. The arrows indicate the expected direction of effect on the corresponding variables.
Agriculture 12 00589 g001
Figure 2. Map of the selected district municipalities. Source [15].
Agriculture 12 00589 g002
Figure 3. Distribution of adaptation strategies used by farmers in the study area.
Agriculture 12 00589 g003
Table 1. Descriptive statistics of the farming households.
Variables Pooled SampleAdoptersNon-Adopterst-Values
DescriptionMean (SD)Mean (SD)Mean (SD)
Food insecurity severity
Food secureYes = 1; otherwise 00.10380.13980.06661.62
Mild food insecurityYes = 1; otherwise 00.4590.48880.43010.79
Moderate food insecurityYes = 1; otherwise 00.230.200.2580.93
Severe food insecurityYes = 1; otherwise 00.2080.1720.2441.21
Independent variables
AgeAge of respondent in years43.83 (12.68)42.19 (12.50)45.52 (12.60)1.72 ***
GenderMale = 1; otherwise 00.61 (0.49)0.55 (0.49)0.66 (0.47)1.41
EducationYears in formal education3.95 (1.54)4.08 (1.58)3.83 (1.49)1.17
Experience Years in crop production10.54 (4.75)10.15 (4.49)10.94 (4.91)1.14
Non-farm incomeYes = 1; otherwise 00.38 (0.49)0.51 (0.50)0.24 (0.43)3.93 *
Own TelevisionYes = 1; otherwise 00.65 (0.43)0.63 (0.42)0.62 (0.48)0.42
Own RadioYes = 1; otherwise 00.48 (0.50)0.56 (0.49)0.55 (0.49)0.19
Own mobile phoneYes = 1; otherwise 00.36 (0.48)0.79 (0.40)0.30 (0.49)7.71 *
Received trainingYes = 1; otherwise 00.48 (0.50)0.47(0.58)0.47 (0.50)0.06
Membership of FBOYes = 1; otherwise 00.64 (0.42)0.69 (0.41)0.58 (0.38)1.67 ***
Access to extensionYes = 1; otherwise 00.33 (0.47)0.31 (0.46)0.35 (0.48)0.62
Access to creditYes = 1; otherwise 00.45 (0.50)0.44 (0.49)0.46 (0.50)0.34
KwaZulu-NatalYes = 1; otherwise 00.20
Free StateYes = 1; otherwise 00.19
LimpopoYes = 1; otherwise 00.39
North WestYes = 1; otherwise 00.22
Note: * & *** represent significance level at 1% & 10%, respectively.
Table 2. Factors influencing the adoption of CCAS.
VariablesCoef.Std. Err.p-Value
Age of the respondent−0.01870.00920.042 **
Gender of the respondent−0.41110.22280.065 *
Educational attainment0.04280.07440.565
Experience −0.01730.02290.451
Owned television0.050070.13130.703
Owned radio0.04270.24750.598
Tropical livestock unit (TLU)0.11210.05860.056 *
Accessed extension services0.11200.11280.321
Accessed agricultural credit0.08360.26750.753
Access to climatic information1.43330.21800.000 ***
KwaZulu-Natal0.25490.36640.474
Free State0.07370.33080.824
Limpopo0.15290.27920.689
Constant0.11790.62440.850
*, ** & *** represent significance level at 1%, 5% & 10%, respectively.
Table 3. Factors influencing households’ food insecurity.
VariablesCoef.Std. Err.p-Value
Age of the respondent0.00890.00730.222
Gender of the respondent−0.00620.17810.972
Educational attainment−0.07110.05600.204
Experience−0.00810.01810.654
Owned television0.26860.13600.048 **
Owned radio0.40940.20580.047 **
Tropical livestock unit (TLU)0.14130.04400.000 ***
Accessed extension services−0.21410.14190.131
Accessed agricultural credit0.82910.23080.000 ***
KwaZulu-Natal−0.16170.24480.509
Free State−0.17510.23510.456
Limpopo −0.23130.22480.304
Adoption of Adaptation strategies0.60930.31010.049 **
Cut 1−0.8050.2560.001
Cut 20.4870.1420.001
Cut 31.1110.1820.000
Atanh_rho−1.7510.5910.003
rho−0.9410.0670.000
Wald chi2(13)63.06
Prob > chi20.0000
Note: ** & *** represent significance level at 5% & 10%, respectively.
Table 4. ATE and ATT of adaptation strategies on the severity of food insecurity.
Food Security StatusATEATT
MeanSDMeanSD
Food secure0.1090.0460.1250.089
Mild food insecurity0.1290.0660.2390.12
Moderate food insecurity−0.0650.035−0.0750.072
Severe food insecurity−0.1720.047−0.2890.112
Publisher’s Note: MDPI stays neutral with regard to jurisdictional claims in published maps and institutional affiliations.

