Article

Heat Stress Characterization in a Dairy Cattle Intensive Production Cluster under Arid Land Conditions: An Annual, Seasonal, Daily, and Minute-To-Minute, Big Data Approach

by
Rafael Rodriguez-Venegas
1,
Cesar A. Meza-Herrera
2,
Pedro A. Robles-Trillo
1,
Oscar Angel-Garcia
1,
Jesus S. Rivas-Madero
3 and
Rafael Rodriguez-Martínez
1,*
1
Unidad Laguna, Universidad Autónoma Agraria Antonio Narro, Torreón 27054, Mexico
2
Unidad Regional Universitaria de Zonas Áridas, Universidad Autónoma Chapingo, Bermejillo 35230, Mexico
3
DiGiTH & DiGiSKY Technologies, Torreón 27100, Mexico
*
Author to whom correspondence should be addressed.
Agriculture 2022, 12(6), 760; https://doi.org/10.3390/agriculture12060760
Submission received: 18 April 2022 / Revised: 21 May 2022 / Accepted: 23 May 2022 / Published: 26 May 2022

Abstract

:
This study characterized the environmental–climatic trends occurring in the largest dairy cattle intensive production cluster under arid land conditions in northern Mexico. The study was based on the Temperature Humidity Index (THI); it aimed to identify the number of days with THI values ≥68 as a bio-marker of heat stress (HS) and evaluate the possible HS effect upon the milk production of dairy cows. Climate data were obtained every 10 min in five farms across years (i.e., 2015–2020). THI was divided into four HS subclasses, 68–71, 72–76, 77–79, and ≥80, according to the circadian HS occurrence (i.e., 1, 4, 8, 12, 16, 20, 24 h), and analyzed across seasons–years. Thus, a total of 1,475,319 THI across different time-scale subclasses was analyzed. The observed results supported our working hypothesis in that yearling-average periods with more than 300 d, HS was confirmed. A yearly average of 31.2 d with THI ≥ 80 with similar (p > 0.05) trends across dairy farms and a slight annual variation (p < 0.05) were also witnessed. Moreover, the highest days with THI levels ≥68 occurred in summer and autumn (p < 0.05), while the in the subclasses 68–71, 72–76, and 77–79, THI occurred in any hour-scale subclass (i.e., 1, 4, 8, and 12 h). Furthermore, a trend to observe THI-HS increases either among years or within an hour-scale basis were also observed. On average, HS engendered a reduction of up to 11.8% in milk production. These research outcomes highlight the need to identify and quantify the negative impacts that HS may generate at a productive and reproductive level in order to delineate mitigation strategies that may lessen the environmental impact upon the dairy cattle industry.

1. Introduction

Heat stress (HS) affects the ability of animals to thermoregulate, causing an increase in body temperature with significant while adverse implications for livestock productivity [1] with reductions in feed intake, fertility and milk production [2,3,4,5,6,7,8]. Moreover, impairments on well-being have also been described, such as resting time, which is a behavioral characteristic that indicates the physiological and health status of cows [9]. Certainly, when avoiding such adverse scenarios, not only hoof diseases but lameness are reduced, observing an enhanced feed intake while an augmented ruminal activity [10]. Thus, the resting time of cows is an important marker of their well-being [11]; a longer nightly resting time is observed once the HS decreases [12]. Additionally, in dairy cows, an increased HS upon commensal microbes of the normal gut microbiota may trigger pathogenic events leading to mastitis [13]. Similarly, the biological adaptation of dairy cows to high temperatures is associated with reductions in milk production and body skin temperature increases [14], mainly in the middle and at the end of the lactation [15]. The use of bioclimatic indices as a measure or predictor of HS was first investigated in the 1940s; however, it was not until the early 1960s that a specific dairy cow HS-marker was developed [16]. Since then, the Temperature Humidity Index (THI) has been a useful tool to measure the productive and reproductive response as a function of climate differences [14,17,18,19,20], based on air temperature and relative humidity. The THI as served as a bioclimatic marker of the sum of external forces on animals that act to displace body temperature from its homeostatic point [20]. Although it was common to place the THI threshold at 72 as the point where milk synthesis begins to decline, later on, it was proposed that high-yielding dairy cows reduce their milk production with a THI around 68 [21]; at such value, dairy cattle become more sensitive to HS as milk production declines [3].
The Comarca Lagunera located in northern arid Mexico concentrates 21% of the national dairy cow inventory. This region is characterized by an annual average rainfall of 200 mm and monthly average temperatures that fluctuate between 12.7 °C in January and 28.5 °C in June, with extremes of −5 °C and 41.5 °C, as well as high sun radiation. These conditions have been shown to create an adverse environment for dairy cattle while representing a challenge for dairy cows for their acclimatization; such HS conditions lessen the maximum expression of their productive potential. Certainly, while decreases in milk production and fertility occur, an increased rate of mastitis alongside reductions in feed intake and resting time are also generated by HS. Reiczigel et al. [22] reported an increase in the number of HS days per year (THI ≥ 68) from 5 to 17 days during the last 30 years, while Dunn et al. [23] suggest that by the year 2100, the number of days exceeding the THI threshold may increase from a yearly average of 1–2 to more than 20. Hempel et al. [24] posit that the impacts of future increases in heat stress risk will depict different severities among diverse locations, and there is expected to be an overall increasing trend in the number and duration of heat stress events. Centered in such evidence, we hypothesize an increase in the number of days reaching THI values ≥ 68 in the Comarca Lagunera, Mexico. We aimed to characterize the thermic scenario across years in five representative dairy farms based on the THI to quantify the magnitude of such climatic insult upon milk yield. Thus, an annual, seasonal, daily, and minute-to-minute, THI-big data approach was considered.

2. Materials and Methods

2.1. Location of the Area of Study and Selected Representative Dairy Farms

The Comarca Lagunera (CLAG; 102° 22′, 104° 47‘ WL; 24° 22′, 26° 23′ NL, at 1139 m) is located in a semi-arid ecotype, with an average temperature of 22 °C, lows of 0 °C (winter) and highs of 40 °C (summer). While the rainy season extends from June to October, the mean annual rainfall and temperature are 225 mm and 24 °C, correspondingly. Relative humidity ranges from 26.1% to 60.6%, while the photoperiod ranges from 13 h, 41 min (summer solstice, Jun) to 10 h, 19 min (winter solstice, Dec). In Mexico, the CLAG is a major agrifood region; while it has the largest national dairy cow cluster with more than 420,000 Holstein dairy cows, it also owns large agricultural areas devoted to forage production (i.e., alfalfa, sorghum forage, corn forage). A total of five representative intensive dairy farms were selected; they were distributed in five geographical points in the CLAG: Campanario, 25°50′, 103°15′ WL; Gilio, 25°61′ NL, 103°55′ WL; Lucero, 25°90′ NL, 103°39′ WL; Madero, 25°51′ NL, 103°60′ WL, and Noacan, 25°40′ NL, 103°31′ WL. The polygon formed by these farms corresponds to the area where most of the dairy farms are placed.

2.2. Climate Data and THI

The climatic data considered ambient temperature (T; °C) and relative humidity (RH; %) and were obtained in each dairy farm using the DiGiTH™ application (DiGiTH Technologies, Torreón, Coauila, Mexico). This application allows obtaining climate data in any place worldwide because of its satellite connectivity. With such information, the THI was calculated as (1.8·T + 32) − [(0.55 − (0.0055 × RH) ((1.8 × T) − 26)] [25]. THI values were obtained daily at 10 min frequency intervals, along 2015–2020 in each dairy farm; the Noacan farm has no available data in 2015. Thus, a total of 1,475,319 THI data were obtained to accomplish our research targets.

2.3. Days with Heat Stress Based on THI

The time of the day at which THI ≥ 68 units occurred, considered as those in which dairy cattle experienced HS, were registered. The observed THI values were divided into 4 heat stress subclasses: 68–71 THI (light); 72–76 THI (moderate); 77–79 THI (intense), and THI ≥ 80 (extreme). Based on this information, 29 images of THI levels were generated along with farms and years. From each of the 29 images, a total of 5 images per dairy farm was generated across years, except for Noacan, due to the lack of data in 2015. Although such images are not all presented, the chromatic THI diagram of the representative dairy farm in the CLAG, based on the number of HS days in relation to the observed THI values, were generated. Figure 1 and Figure 2 considering the THI level causing HS across month, days, and minutes of exposure to heat stress (i.e., Time of Exposure to HS; TOE-HS: 1, 4, 8, 12, 16, 20 and 24 h) were generated. Furthermore, the average, maximum, and minimum values for THI, temperature air, and relative humidity within season were also considered.

2.4. Dynamic of the THI ≥ 68 Units according to Geographic Site, Year and Season

The effects of the geographical site (i.e., dairy farm), the year (i.e., 2016–2020), and the season of the year with respect to the number of THI days ≥ 68, divided according to the previously mentioned subclasses, were registered. The seasons included winter (January–March), spring (April–June), summer (July–September) and fall (October–December). Additionally, the number of days for each described THI level was subdivided based on the number TOE-HS level reached every day.

2.5. Relationship among the Daily Number of THI-Hours Causing Heat Stress across Years

Based on the above information, the average of HS days was generated considering a THI ≥ 68 as well as for each THI subclass. Subsequently, regressions analyses were performed among the HS days per THI subclass and across years to evaluate the THI dynamics across time.

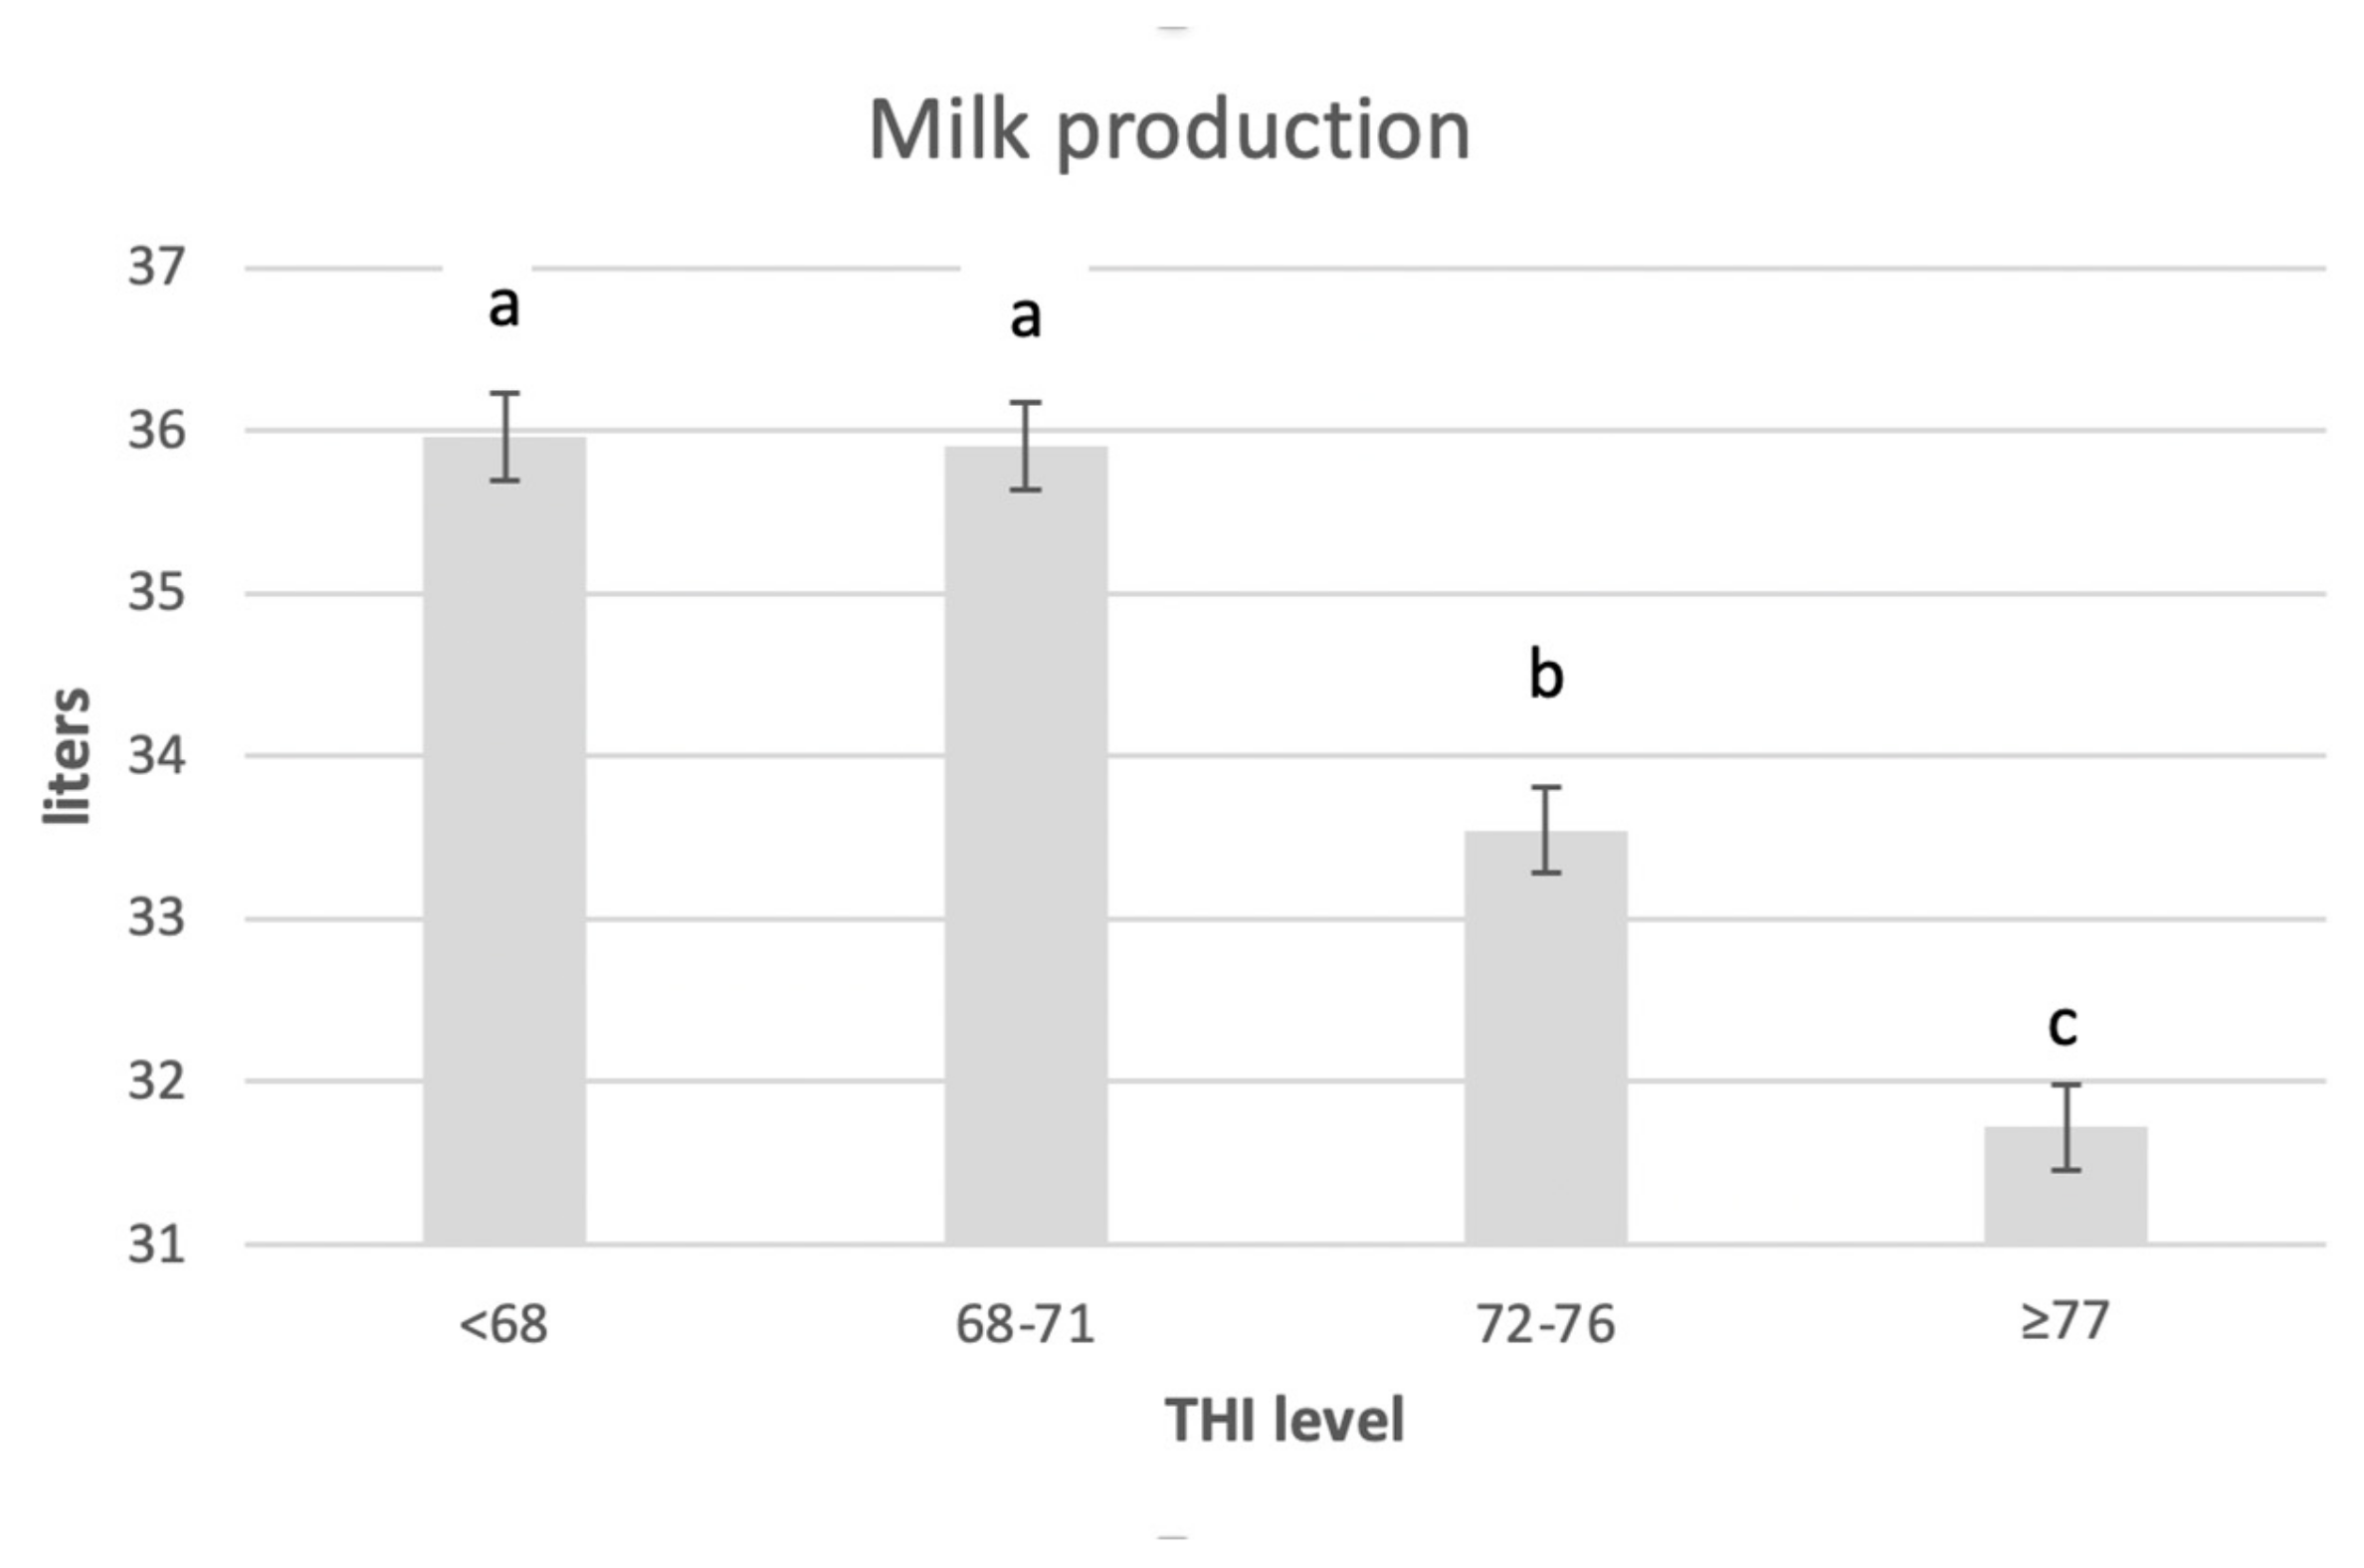
2.6. Effect of THI Level on Milk Production

To identify the HS effect based on the different levels of THI, data from a typical dairy farm of the region, located at 25°89′ NL and 103°22′ WL, were used. The THI values according to the levels established in this study, except for the level ≥ 80, which were grouped with those of the THI level of 77–79, were also used to quantify the effect of HS on milk production on a monthly basis. The period of data analyzed was 2016–2018, and the cow’s average population included during the evaluated period considered a total of 2467 dairy cows.

2.7. Statistical Analyses

Analyses considering the annual THI values across dairy farms, the estimation of the number of HS days based on the THI value, the regression analyses among the number of days with THI values ≥ 68, and those regarding each of the THI subclasses across years, were performed by means of the Excel software (Microsoft 2021, Jones Chicago, IL, USA). The effects of geographic site, year and season regarding the number of days with THI values ≥ 68 as well as regarding each THI subclass, and their possible effect upon milk production, considered the PROC GLM. The regression analysis between the number of days with THI ≥ 68 and each THI subclass within a year considered the PROC REG [26]. Statistical analyses were performed using the procedures of SAS (SAS Inst. Inc., Version 9.4, 2016, Cary, NC, USA). A statistical difference was considered when a value of p < 0.05 occurred.

3. Results

3.1. Days with Heat Stress Based on THI

The days with THI ≥ 68 and THI subclasses across farms years are shown in Table 1. Regarding the THI ≥ 68, the lowest record (291 d) occurred in Lucero 2018, while the highest values (327 d) occurred in 2017 in Gilio, Madero, and Noacan. At the levels that represent a greater risk to the health and productivity of cows (THI 77–79 and THI ≥ 80), the largest values occurred in Lucero 2016 (i.e., 156 d for THI 77–79, and 64 d for THI ≥ 80), while the lowest values for these THI levels were registered in 2020: Noacan (i.e., 96 d for the THI 77–79), as well as Noacan and Madero (i.e., 4 days for THI ≥ 80). Considering all farms and years, the average period with HS was 312 days. Because the farm and year with the nearest value to this average was Lucero in 2016, this farm year was used as the representative standard to graph the average THI of the CLAG (Figure 1). Even in winter, there were days with THI ≥ 68 values, although January had the most of the observed THI values around 68–71. In addition, in early November, a total of 3 h with THI 77–79 occurred. During June, July, and August, THI levels ≥ 68 were registered all day long yet with levels of 77–79 and ≥80 during most of the day.
When analyzing data with HS ≥ 68 according to month and day at the 1 h TOE-HS (Figure 2), from April to October, this level of THI occurred on a daily basis. In contrast, January and February registered the lowest TOE-HS, with 12 h and 8 h, respectively. Figure 3 shows the dynamics of the different THI levels causing HS; the number of day–hours with HS decreased as the THI level increased. Interestingly, at levels 77–79 and ≥80, the period from April to October was especially risky for dairy cattle based on such THI values.
Table 2 shows the average day–month and average month–year collected in five farms across years in which a THI ≥ 68 was reached, as well in which the different levels of THI were recorded.

3.2. Difference in THI ≥ 68 by Geographical Site, Year and Season

The analysis of the differences by geographical sites, year and season on the levels of THI ≥ 68, and their subdivisions are presented based on the different levels of exposure.

3.2.1. Differences according to Geographical Site (Farm)

The different sites showed a great similarity in relation to the THI (Figure 4), observing differences (p < 0.05) only for the 4 h time of exposure and only for the THI level ≥ 80, with Campanario, Gilio and Lucero showing the largest number of days.

3.2.2. Differences across Years

The THI values differed (p < 0.05) across years (Figure 5), especially for the TOE-HS1h, 8 h, 20 h and 24 h during 2017 and a THI ≥ 68. In addition, the TOE-HS24h in 2016 and 2017 had the largest number of days (p < 0.05), with a risk of HS.

3.2.3. Differences across Seasons

The THI values across seasons differed (p < 0.05) at any TOE-HS (Figure 6), especially at THI ≥ 68. While spring and summer had the largest HS period (i.e., days), both fall and winter had fewer HS days. Interestingly, all the THI subclasses exerted HS when considering the TOE-HS1h; spring and summer are highlighted because of the recorded day number.

3.2.4. Representative Farm–Year Environmental Values in the Comarca Lagunera

Lucero 2016 showed the more representative environmental values as per site and year for the region along the study period. The average, maximum and minimum values of THI (units), air temperature (°C) and relative humidity (%) are shown by season (Table 3).
The percentages of annual hours with HS, showing their highest value at TOE-HS1h (84.1%), a middle value at TOE-HS12h (64.2%), and the lowest one at TOE-HS 24h (50.3%) are presented in Table 4. In turn, the percentages of annual hours with HS, with their highest value at THI ≥ 68 (84.1%) and the lowest one at THI ≥ 80 (16.3%), are concentrated in Table 5. Interestingly, the percentages of annual days with dangerous levels of HS 72–79 and ≥80 are respectively, 36.5% and 16.3%.

3.3. Effect of THI Level on Milk Production

Milk production was affected by HS (Figure 7). The highest (p < 0.05) milk production was registered at THI < 68, and 68–71, with resultant milk values of 35.96 l and 35.90 l. In contrast, THI values of 72–76 and ≥77 decreased (p < 0.05) milk production, with respective values of 33.55 l and 31.72 l. Considering that the maximum milk production threshold (100%) occurs at THI < 68 points, we quantified that at 72–76 THI and ≥77 THI, the milk production sloped 6.7% and 11.80%, respectively (i.e., 2.4 l and 4.2 l).

3.4. Relationship of Days with THI Levels with Heat Stress and the Year

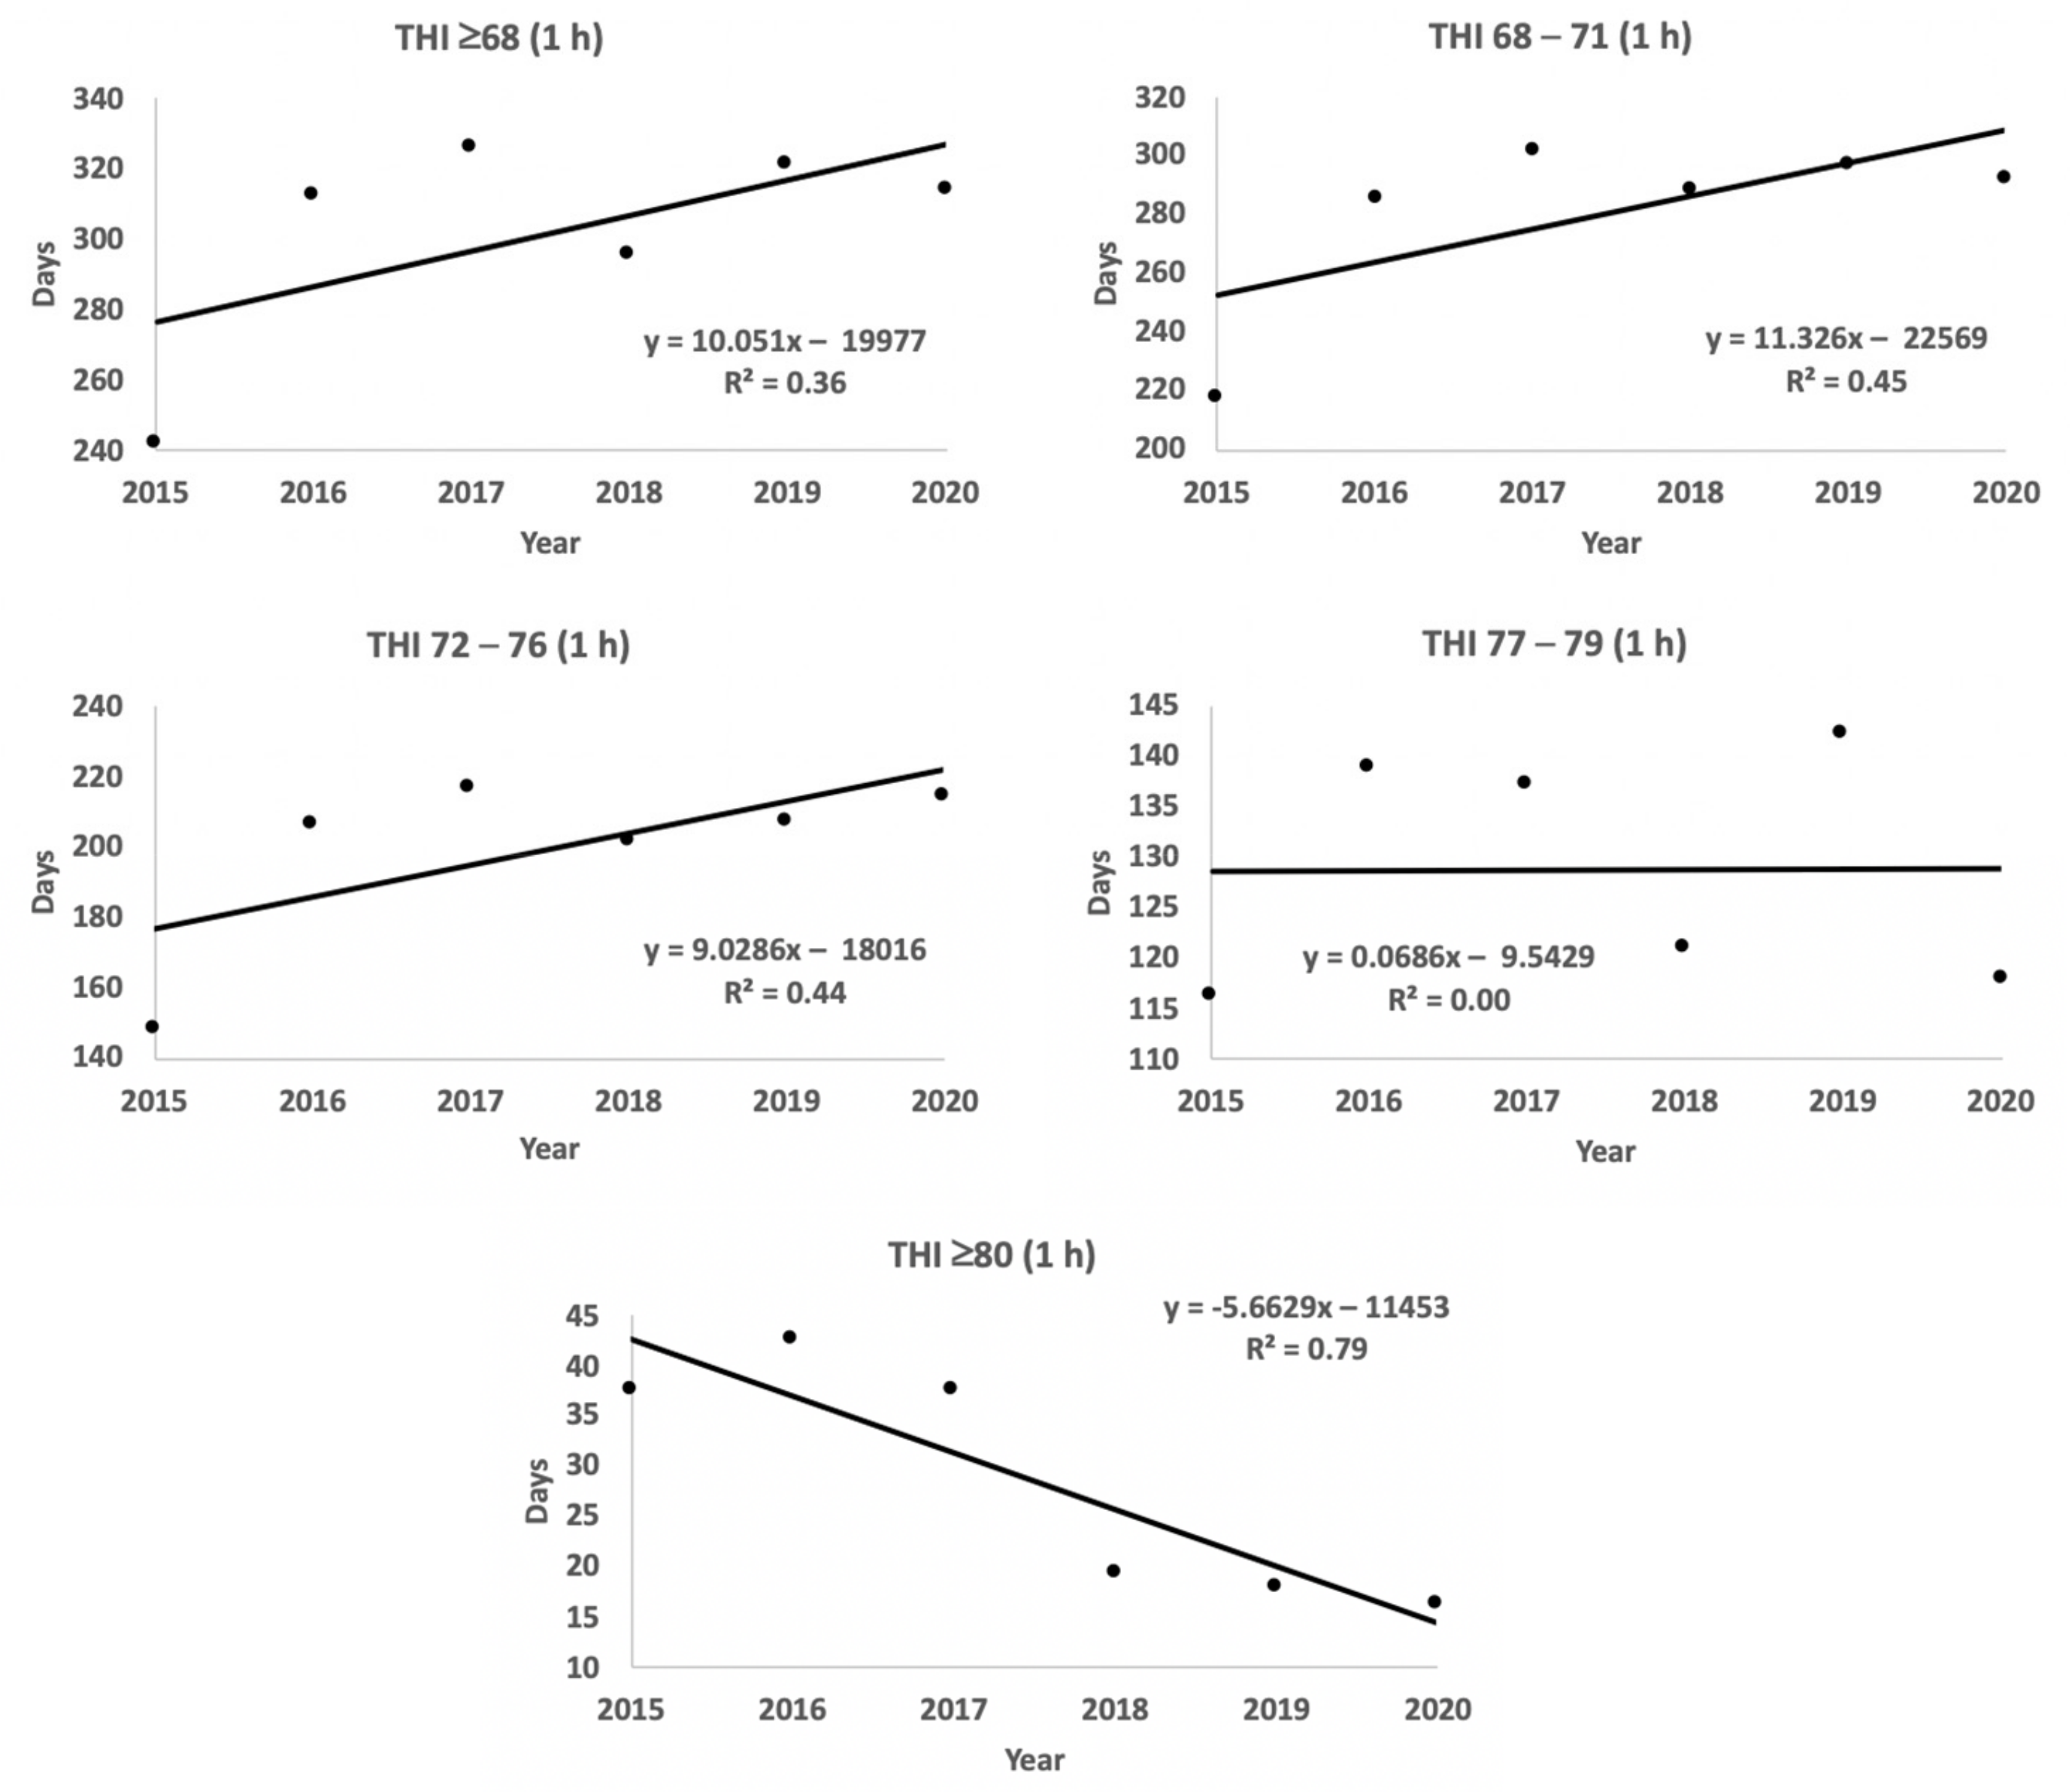
3.4.1. Relationship among Years and the THI—TOE-HS1h Subclass

When considering the subclass TOE-HS1h (Figure 8), at THI ≥ 68, we observed a trend (p > 0.05) of increases in the HS days (i.e., 10.05 d per year; R2 = 0.37). The same was true when considering the different THI subclasses. However, THI ≥ 80 generated an annual decrease of 5.66 d regarding the number of HS days.

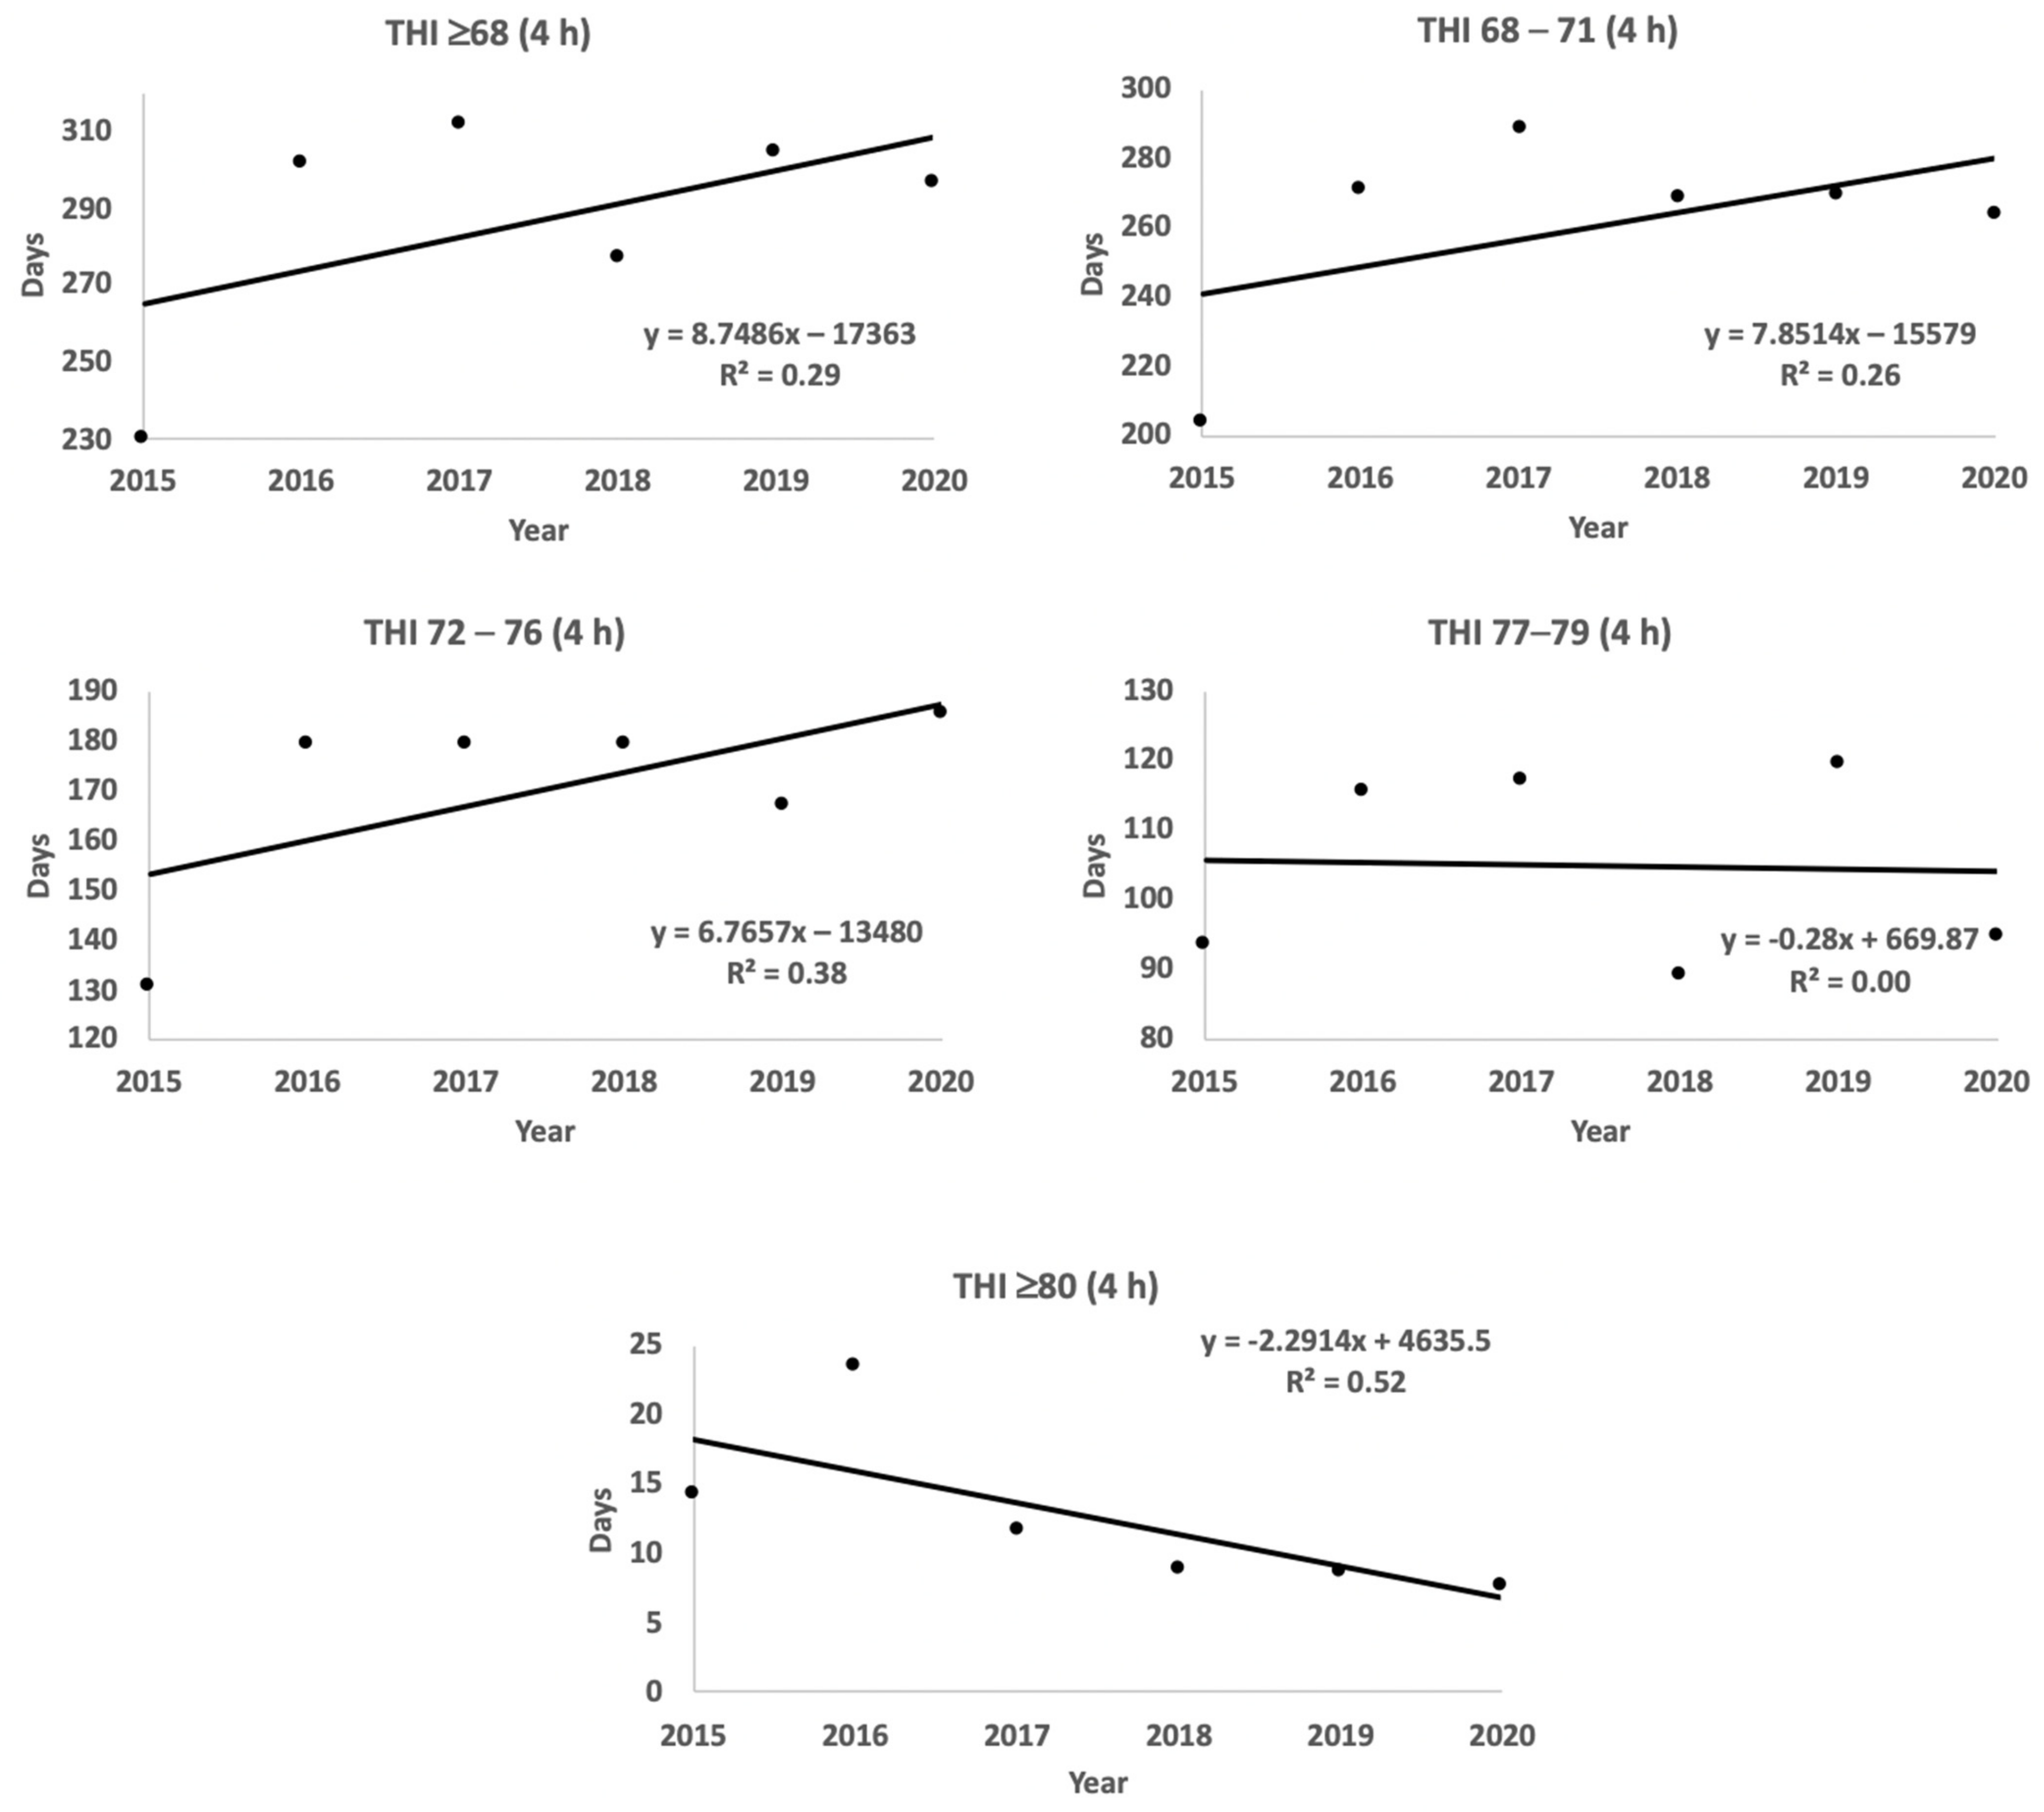
3.4.2. Relationship among Years and the THI—TOE-HS4h Subclass

A similar relationship as in TOE-HS1h was observed in TOE-HS4h (Figure 9) yet with a decreased number of days per year and a decreased R2. In fact, this new THI ≥ 68 analysis generated an annual increase of 8.75 d (R2 = 0.29). In the THI subclasses, the number of days with HS were 7.85 d per year (R2 = 0.26; THI 68–71) and 6.7 d (R2 = 0.38; THI 72–76). As the THI enlarged up to ≥ 80, an inverse relationship occurred (−2.29 d year−1; R2 = 0.52).

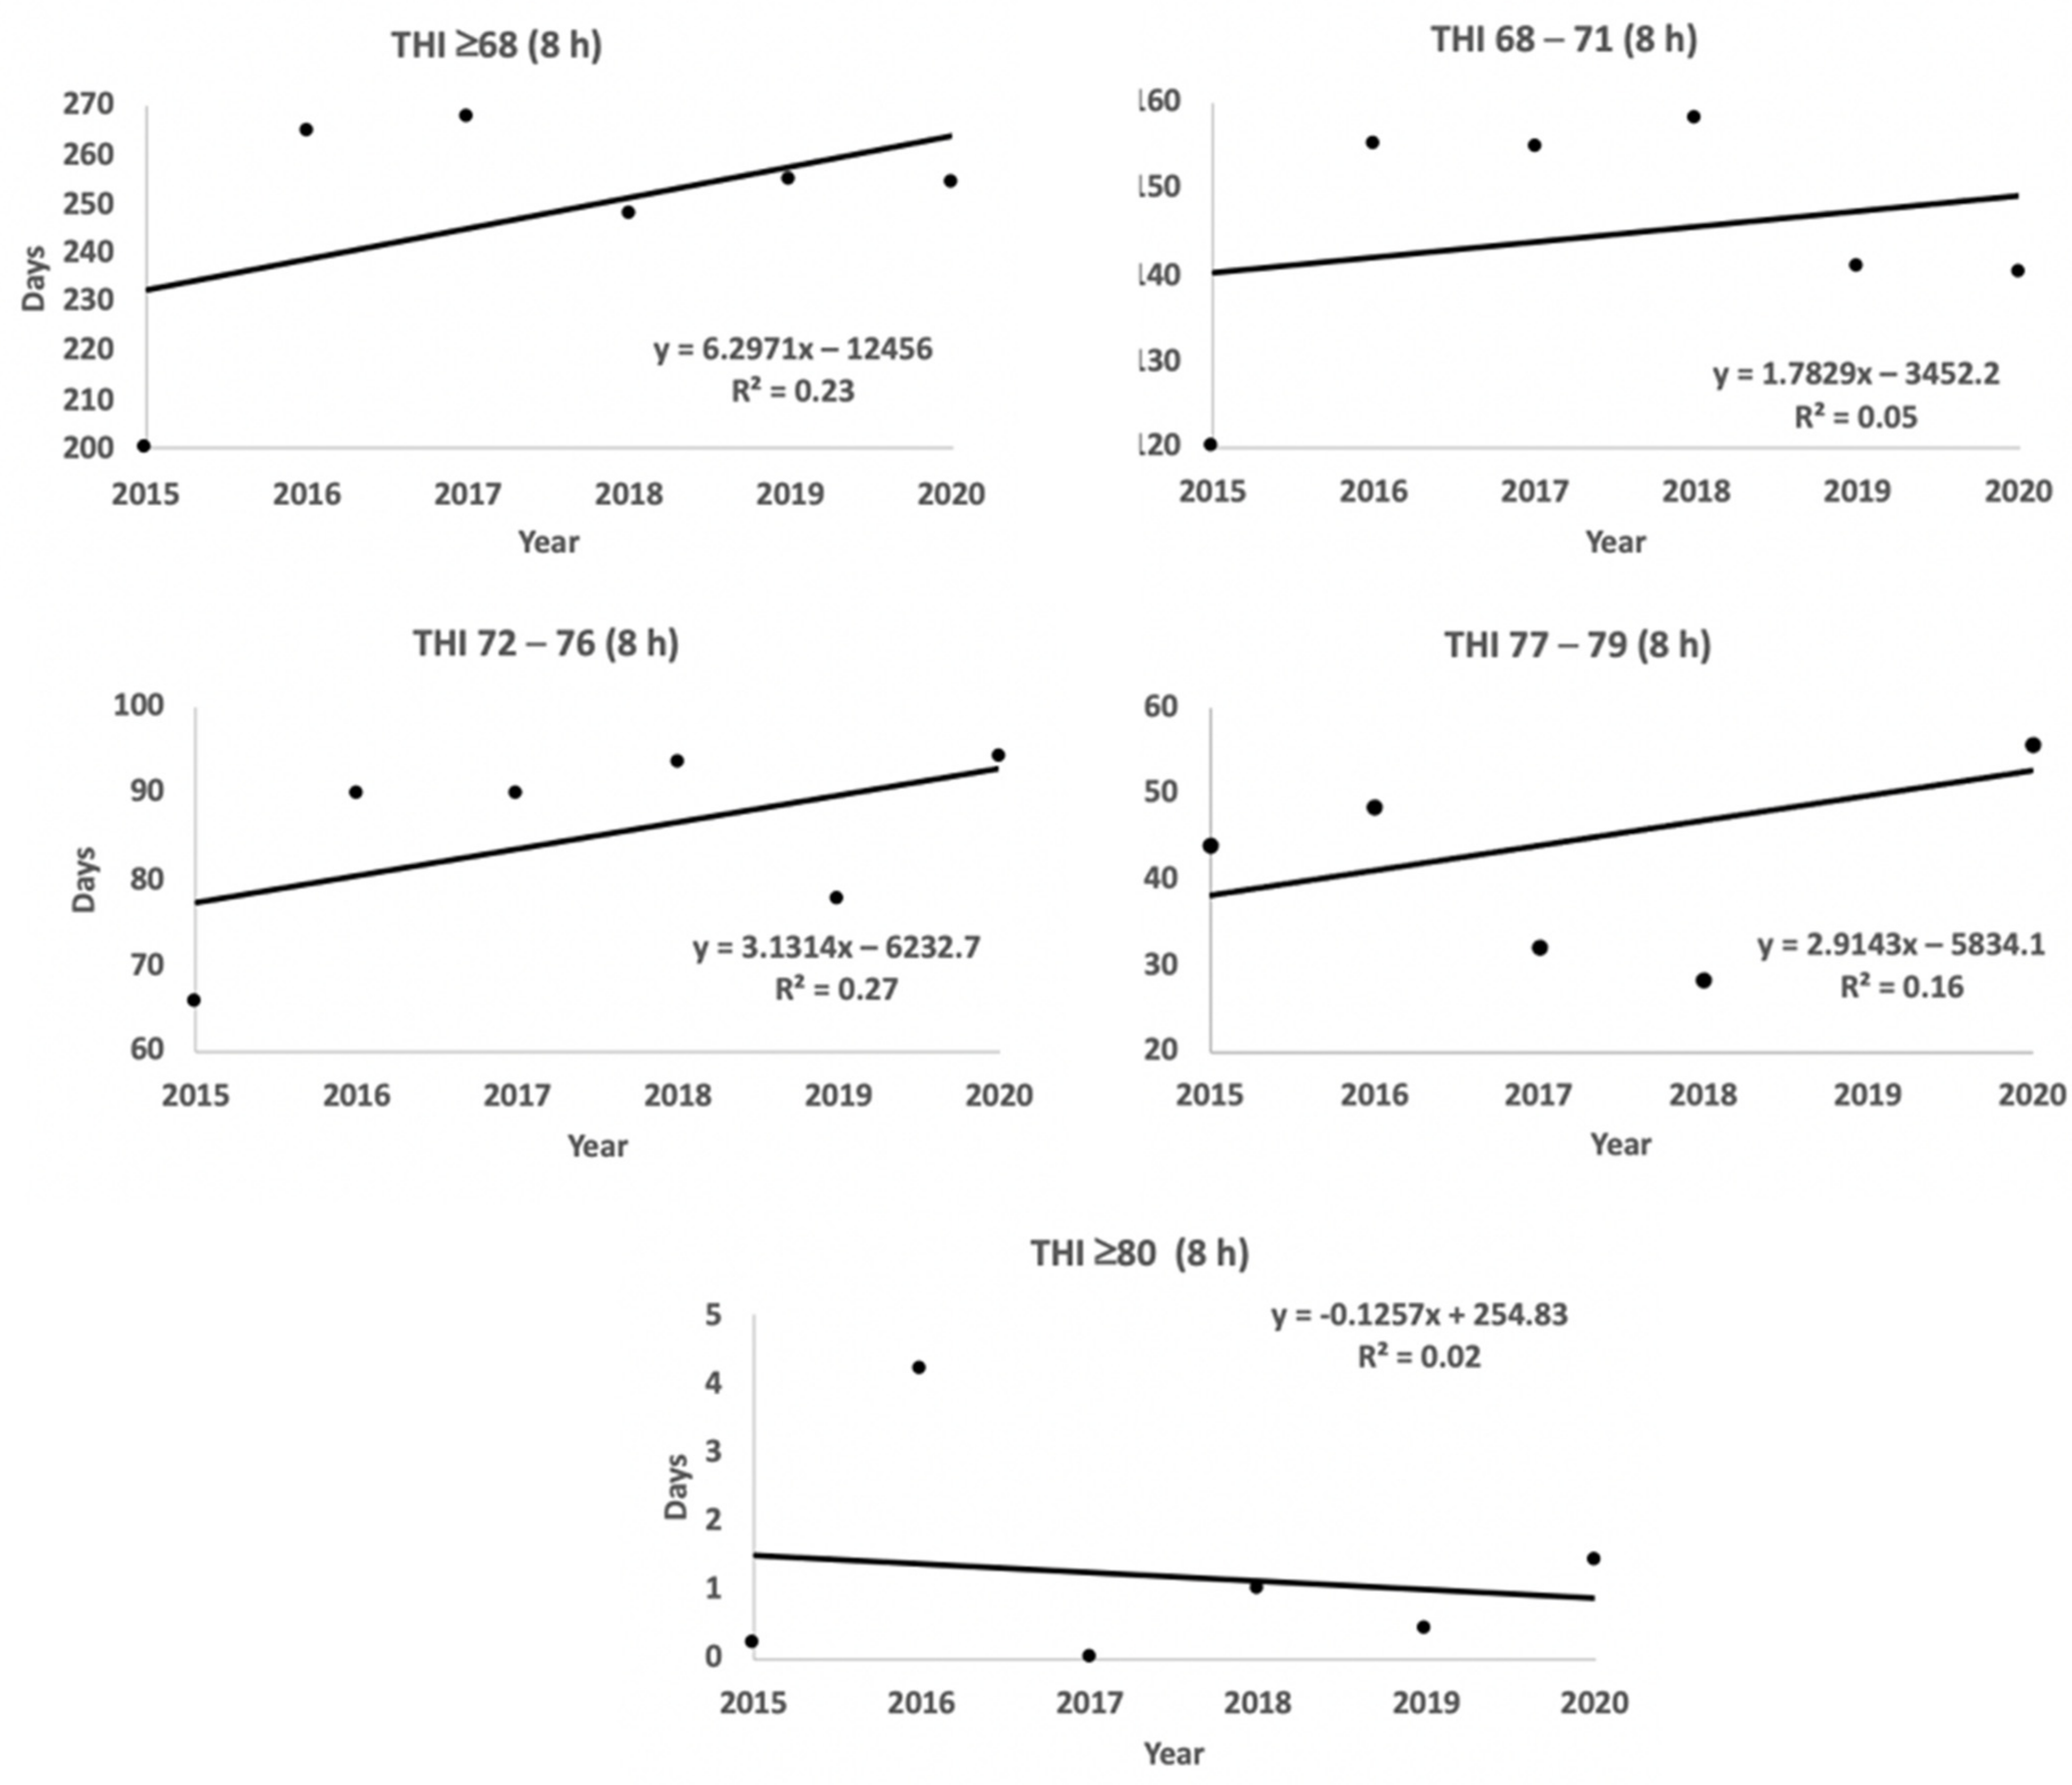
3.4.3. Relationship among Years and the THI—TOE-HS8h Subclass

As for the subclass TOE-HS8h, there was quantified an annual increase of 6.3 HS-d (R2 = 0.23) when considering THI ≥ 68 (Figure 10). Once evaluated along with other subclasses, the observed values were 1.8 d for THI 68–71 with R2 = 0.05; 3.1 d for 72–76 with R2 = 0.27; and 2.9 d for 77–79 with R2 0.16. Nonetheless, such a trend did not occur with respect to THI ≥ 80, which generated the values −0.13 d (R2 = 0.02).

3.4.4. Relationship among Year–THI value at TOE-HS8h and TOE-HS 16h Subclass

Figure 11 shows the remaining significant (p < 0.05) regressions for the TOE. THI levels of 69–71 and 77–79 show an increase in the number of days (0.78 d with R2 = 0.24, and 0.67 d with R2 = 0.58 respectively), while at 72–76 THI, a decrease was observed (−1.02 d with R2 = 0.57). Finally, at 16 h of exposure, at level ≥ 68, there is also a decrease (−3.45 d with R2 = 0.12).

4. Discussion

Our working hypothesis stated an increase, across years, in the annual number of days with THI levels above the normal THI threshold (i.e., ≥68) that would compromise the reproductive and productive soundness of Holstein cows in northern arid Mexico. Based on a total of 1,475,319 THI analyzed, our main research outcomes are aligned with such original statements; so, our working hypothesis is not rejected. In fact, on average, HS arose more than 300 d yr−1 with at least 1h-HS as well as during 31 d yr−1 with THI > 80 units. The results obtained from this study offer solid evidence that dairy farming under arid–hot–dry conditions must be supported with the development of mitigation strategies designed to counteract HS insults throughout more than 2/3 of the year.
The importance of the early forecasting of heat stress risk was previously highlighted by Herbut et al. [27], who stated the possibility to limit its negative impact on cow welfare. Thus, highly-milk-producing cows must be protected against any heat insult that would compromise milk productivity; the design of mitigation strategies is therefore a fundamental task for maintaining global milk production. Certainly, one of the main external factors that negatively affect the performance of dairy cows is the thermal environment in which they live [28]. High-yielding animals with high dairy-genetic merit are particularly sensitive to HS, since they produce more body heat due to their higher metabolic rate [29,30]. According to Becker and Stone [31], with increases from 35 to 45 kg/d in milk yield, the HS temperature threshold can be decreased by 5 °C, meaning that cows will become heat stressed earlier. Moreover, HS conditions in the US represent a noteworthy financial burden, which is estimated up to 1500 million USD. Such economic losses occur as animals face environmental insults when located outside their thermoneutral comfort zone [29].

4.1. Days with Heat Stress Based on THI

According to our results, dairy cows in the CLAG are exposed to HS conditions more than 75% all year-round. Dairy cows in the southeastern United States face nearly 50% of all annual hours under thermal stress, leading to an annual milk loss up to 2072 kg cow−1 [32]. Our results show that THI 72–76, 77–79, and ≥80 can be a serious problem for the dairy cow industry. The observed THI trends in our study, >68 and subclasses, made it evident that cows in the CLAG are subjected to continuous heat stress, depicting an interesting “heat wave profile” [32]. The last is dramatic in that dairy cows may require weeks to fully adapt to HS conditions [31], generating concomitant economic losses. Such HS insult has promoted the death of 25,000 dairy cows and a reduction in milk production close to 1.1 million liters per day [33].

4.2. Effect of Geographic Site, Month, Season, and Year upon Variability of THI Levels ≥ 68

4.2.1. Differences by Geographic Point (Farm)

The CLAG can be defined as a homogeneous area in terms of the THI ranges. Interestingly, even small areas across the CLAG, such as those near the Nazas River, occasionally with running water, can be considered as the area with the lowest regional temperatures, where the Madero dairy farm is located. Yet, the THI among geographical sites did not show important differences. Theusme et al. [34] reported climatic differences in another region of northern Mexico (i.e., Baja California). As previously proposed [35], the measurement of thermal parameters can be performed at four levels: regional, farm (outside), building (inside), and at animal levels. In the CLAG, those dairy farms without meteorological measurement devices can make use of different stations of the federal meteorological system, having the required information to define specific strategies to mitigate HS. Nevertheless, it is key to consider that different locations with automated weather stations may differ from each other; the closeness of the farm to the weather stations, the better [16].

4.2.2. Differences across Years, Seasons and Months

The results obtained from the regression analysis between HS days and year show a trend to an increase in the days with HS in the region. The last denotes a quite complex scenario, which potentially may compromise both the health and productivity of dairy cows. Certainly, under subtropical climatic conditions, little or non-alleviation from HS occurs at night. Unquestionably, since no nightly reductions in ambient temperature and humidity occur as compared to the daytime, cows are unable to lose internal heat generated throughout the day, causing these animals to be in a constant HS status [36]. At any TOE-HS subclass, spring and summer had an increased THI ≥ 68 as compared to fall and winter, while summer averaged more days per month than spring. According to Hempel et al. [24], the most HS events and largest financial losses occur in summer, proposing that such an annual increase in HS day number is related to the effect of climate change. Hence, in the CLAG, not only an increase in HS days, which occurs in the summer practically every day, but also the greatest number of days with TOE-HS with a longer exposure time and higher THI levels would also be observed. While such a scenario can negatively impact future milk yield in summer months, a carry-over effect may extend its consequences throughout the fall months, despite cows perhaps no longer be experiencing HS in Fall. From April to October, the largest number of HS days occurred. In addition, while the largest period of TOE-HS1h occurred from May to September, the TOE-HS4h arose from April to October at THI 68–71. Interestingly, during June, July, and August, the THI ≥ 68 ascended practically in a daily fashion. In agreement with our results, dairy cattle were very vulnerable to HS during July and August in the valley of Baja California, Mexico [34].

4.3. Relationship among THI Levels, Days with Heat Stress, across Years

Theusume et al. [34] predicted the impact of global warming using several bioclimatic indicators as a function of the year of study, and they concluded that most of the indicators, including the THI, showed a positive relationship across years in northern arid Mexico; such a trend was also observed in our study. In line with the previous findings, Herbut et al. [27] proposed an increasing trend toward the systematic warming of the Earth’s climate. Unexpectedly, in our study, we found at THI ≥ 80, a decrease of 5.66 d yr−1. We hypothesize that this may be due to slight increases in environmental temperature in the CLAG across years but without the proportional increases expected in the relative humidity of the air. Moreover, environmental temperatures have increased by 1.0 °C since the 1800s, and they are expected to continue to increase 1.5 °C between 2030 and 2052 [37]. In relationship to THI values, Cincović et al. [14] report that the mean maximal THI value (2005–2016) showed a trend of increasing in every month except January, October and November. Such increases in the environmental temperature and consequently in THI are the most noticeable environmental stressors, which are expressed by both an increased number of consecutive hot days and an augmented frequency of extremely hot days [38].

4.4. Effect of THI Level on Milk Production

While HS causes milk production losses in dairy cattle [29,30,39], HS during the dry period also exerts a substantial negative effect upon dairy farm profitability, which is similar to that of HS during lactation [40]. Such a trend indicates that HS is a disrupting factor upon the productivity of dairy cows even in non-lactating animals. St-Pierre et al. [29] established that dairy cows in the southeastern United States spend nearly 50% of all annual hours under thermal stress, leading to a loss of milk production up to 2072 kg cow−1 yr−1. Our data indicate that the dairy cattle of the CLAG spend an average of 69% of their annual time (251 h) under HS conditions when facing a THI of 68–71; with THI values of 72–76, an average of 53% (192 h) occurred. Such figures generate respective average losses of 2.4 L and 4.2 L d−1 cow−1 compared with not HS conditions. This decrease in milk production is associated with a failure to rescue milk yield because shifts in energy metabolism, protein catabolism, alterations in lipid metabolism due to endocrine alterations, and immune response due to oxidative stress and inflammation are the major factors in this physiological complex [41]. Dairy farms equipped with technical systems for meteorological and health data are important for inferring associations between THI and responses in cow traits, especially in early lactation, detrimental effects of HS on test-day production and female fertility [42]; both big data and sensor-satellite intelligent approaches will help to better counteract risky environmental impacts.

5. Conclusions

The CLAG is a region with high THI levels that, on average, reach more than 300 d yr−1 with at least 1 h of HS, and 31 d yr−1 having THI values higher than 80 units. Our results offer solid evidence that dairy farming under arid–hot–dry conditions must be supported with mitigation strategies to counteract HS insults throughout more than 2/3 of the year. The research approach used in our study, not only from yearly-to-season, but monthly-to-seasonal, and even minute-to-minute quantifications, makes available sound information to support the design of wide-ranging mitigation strategies. Our research outcomes are crucial to define specific strategies not only at specific windows of action but using different time-scale approaches to lessen the negative influences of HS. Future studies must address the possible interactions among HS, THI levels, milk yield, reproductive and productive efficiency, as well as immunology soundness, which are aligned with possible thermal mitigation mechanisms to reduce HS, especially in high yielding dairy cows; the last being an unavoidable assignment.

Author Contributions

Conceptualization, R.R.-M., P.A.R.-T. and C.A.M.-H.; methodology, R.R.-M., C.A.M.-H. and O.A.-G.; software, J.S.R.-M.; validation, R.R.-V. and P.A.R.-T.; Investigation, O.A.-G., P.A.R.-T. and R.R.-V.; formal analysis, R.R.-M., R.R.-V. and J.S.R.-M.; resources, P.A.R.-T. and J.S.R.-M.; Data curation, R.R.-M., R.R.-V. and J.S.R.-M.; Writing—original draft preparation, O.A.-G., R.R.-M., R.R.-V. and P.A.R.-T.; Writing—review and editing, C.A.M.-H. and R.R.-M.; Funding acquisition, P.A.R.-T. All authors have read and agreed to the published version of the manuscript.

Funding

This research was funded by Universidad Autónoma Agraria Antonio Narro, Number 38111-425502002-2742.

Institutional Review Board Statement

Not applicable.

Informed Consent Statement

Not applicable.

Data Availability Statement

The datasets used along with this research could be available from the corresponding author on reasonable request.

Conflicts of Interest

The authors have no conflict of interest to declare that are relevant to the content of this article.

References

  1. DeShazer, J.A.; Hahn, G.L.; Xin, H. Chapter 1: Basic Principles of the Thermal Environment and Livestock Energetics. In Agricultural and Biosystems; Agricultural and Biosystems Engineering Publications: St. Joseph, MI, USA, 2009; pp. 1–22. [Google Scholar]
  2. Armstrong, D.V. Heat Stress Interaction with Shade and Cooling. J. Dairy Sci. 1994, 77, 2044–2050. [Google Scholar] [CrossRef]
  3. Kadzere, C.T.; Murphy, M.R.; Silanikove, N.; Maltz, E. Heat Stress in Lactating Dairy Cows: A Review. Livest. Prod. Sci. 2002, 77, 59–91. [Google Scholar] [CrossRef]
  4. Amundson, J.L.; Mader, T.L.; Rasby, R.J.; Hu, Q.S. Environmental Effects on Pregnancy Rate in Beef Cattle1. J. Anim. Sci. 2006, 84, 3415–3420. [Google Scholar] [CrossRef] [PubMed] [Green Version]
  5. Mader, T.L.; Frank, K.L.; Harrington, J.A.; Hahn, G.L.; Nienaber, J.A. Potential Climate Change Effects on Warm-Season Livestock Production in the Great Plains. Clim. Chang. 2009, 97, 529–541. [Google Scholar] [CrossRef] [Green Version]
  6. Salem, M.; Ben, B.R. Heat Stress in Tunisia: Effects on Dairy Cows and Potential Means of Alleviating It. S. Afr. J. Anim. Sci. 2009, 39, 256–259. [Google Scholar]
  7. Gantner, V.; Mijic, P.; Kuterovac, K.; Barac, Z.; Klemen, P. Heat Stress and Milk Production in the First Parity Holsteins—Threshold Determination in Eastern Croatia. Poljoprivreda 2015, 21, 97–100. [Google Scholar] [CrossRef]
  8. Gantner, V.; Mijić, P.; Jovanovac, S.; Raguž, N.; Bobić, T.; Kuterovac, K. Influence of Temperature-Humidity Index (THI) on Daily Production of Dairy Cows in Mediterranean Region in Croatia. In Animal Farming and Environmental Interactions in the Mediterranean Region; Casasús, I., Rogošiç, J., Rosati, A., Štokoviç, I., Gabiña, D., Eds.; Wageningen Academic Publishers: Wageningen, The Netherlands, 2012; pp. 71–78. ISBN 978-90-8686-741-7. [Google Scholar]
  9. Tolkamp, B.J.; Haskell, M.J.; Langford, F.M.; Roberts, D.J.; Morgan, C.A. Are Cows More Likely to Lie down the Longer They Stand? Appl. Anim. Behav. Sci. 2010, 124, 1–10. [Google Scholar] [CrossRef]
  10. Herbut, P.; Angrecka, S. Relationship between THI Level and Dairy Cows’ Behaviour during Summer Period. Ital. J. Anim. Sci. 2018, 17, 226–233. [Google Scholar] [CrossRef] [Green Version]
  11. Vasseur, E.; Rushen, J.; Haley, D.B.; de Passillé, A.M. Sampling Cows to Assess Lying Time for On-Farm Animal Welfare Assessment. J. Dairy Sci. 2012, 95, 4968–4977. [Google Scholar] [CrossRef] [Green Version]
  12. Herbut, P.; Angrecka, S. The Effect of Heat Stress on Time Spent Lying by Cows in a Housing System. Ann. Anim. Sci. 2018, 18, 825–833. [Google Scholar] [CrossRef] [Green Version]
  13. Chen, S.; Wang, J.; Peng, D.; Li, G.; Chen, J.; Gu, X. Exposure to Heat-Stress Environment Affects the Physiology, Circulation Levels of Cytokines, and Microbiome in Dairy Cows. Sci. Rep. 2018, 8, 14606. [Google Scholar] [CrossRef] [Green Version]
  14. Cincović, M.; Majkić, M.; Belić, B.; Plavša, N.; Lakić, I.; Radinović, M. Thermal Comfort of Cows and Temperature Humidity Index in Period of 2005-2016 in Vojvodina Region (Serbia). Acta Agric. Serbica 2017, 22, 133–145. [Google Scholar] [CrossRef]
  15. Cincovic, M.; Belic, B.; Toholj, B.; Radovic, I.; Vidovic, B. The Influence of THI Values at Different Periods of Lactation on Milk Quality and Characteristics of Lactation Curve. J. Agric. Sci. 2010, 55, 235–241. [Google Scholar] [CrossRef]
  16. Wijffels, G.; Sullivan, M.; Gaughan, J. Methods to Quantify Heat Stress in Ruminants: Current Status and Future Prospects. Methods 2021, 186, 3–13. [Google Scholar] [CrossRef]
  17. Ravagnolo, O.; Misztal, I.; Hoogenboom, G. Genetic Component of Heat Stress in Dairy Cattle, Development of Heat Index Function. J. Dairy Sci. 2000, 83, 2120–2125. [Google Scholar] [CrossRef]
  18. Hahn, G.L.; Mader, T.; Eigenberg, R.A. Perspective on Development of Thermal Indices for Animal Studies and Management. EAAP Tech. Ser. 2003, 7, 31–44. [Google Scholar]
  19. Da Silva, R.G.; Morais, D.A.E.F.; Guilhermino, M.M. Evaluation of Thermal Stress Indexes for Dairy Cows in Tropical Regions. Rev. Bras. Zootec. 2007, 36, 1192–1198. [Google Scholar] [CrossRef] [Green Version]
  20. Dikmen, S.; Hansen, P.J. Is the Temperature-Humidity Index the Best Indicator of Heat Stress in Lactating Dairy Cows in a Subtropical Environment? J. Dairy Sci. 2009, 92, 109–116. [Google Scholar] [CrossRef] [Green Version]
  21. Zimbelman, R.; Rhoads, R.; Rhoads, M.; Duff, G.; Baumgard, L.; Collier, R. A Re-Evaluation of the Impact of Temperature Humidity Index (THI) and Black Globe Humidity Index (BGHI) on Milk Production in High Producing Dairy Cows. In Proceedings of the 24th Annual Southwest Nutrititon Management Conference, Tempe, AZ, USA, 26–27 February 2009. [Google Scholar]
  22. Reiczigel, J.; Solymosi, N.; Könyves, L.; Maróti-Agóts, Á.; Kern, A.; Bartyik, J. Examination of Heat Stress Caused Milk Production Loss by the Use of Temperature- Humidity Indices. Magy. Allatorvosok Lapja 2009, 131, 127–144. [Google Scholar]
  23. Dunn, R.J.H.; Mead, N.E.; Willett, K.M.; Parker, D.E. Analysis of Heat Stress in UK Dairy Cattle and Impact on Milk Yields. Environ. Res. Lett. 2014, 9. [Google Scholar] [CrossRef]
  24. Hempel, S.; Menz, C.; Pinto, S.; Galán, E.; Janke, D.; Estellés, F.; Müschner-Siemens, T.; Wang, X.; Heinicke, J.; Zhang, G.; et al. Heat Stress Risk in European Dairy Cattle Husbandry under Different Climate Change Scenarios-Uncertainties and Potential Impacts. Earth Syst. Dyn. 2019, 10, 859–884. [Google Scholar] [CrossRef] [Green Version]
  25. NCR. A Guide to Environmental Research on Animals; National Academies Press: Washington, DC, USA, 1971; ISBN 9780309018692. [Google Scholar]
  26. SAS Institute Inc. Introduccion a La Programacion En SAS®; SAS Institute Inc.: Cary, NC, USA, 2014; p. 18. [Google Scholar]
  27. Herbut, P.; Angrecka, S.; Walczak, J. Environmental Parameters to Assessing of Heat Stress in Dairy Cattle—A Review. Int. J. Biometeorol. 2018, 62, 2089–2097. [Google Scholar] [CrossRef] [Green Version]
  28. Nardone, A.; Ronchi, B.; Lacetera, N.; Ranieri, M.S.; Bernabucci, U. Effects of Climate Changes on Animal Production and Sustainability of Livestock Systems. Livest. Sci. 2010, 130, 57–69. [Google Scholar] [CrossRef]
  29. St-Pierre, N.R.; Cobanov, B.; Schnitkey, G. Economic Losses from Heat Stress by US Livestock Industries1. J. Dairy Sci. 2003, 86, E52–E77. [Google Scholar] [CrossRef] [Green Version]
  30. Bernabucci, U.; Biffani, S.; Buggiotti, L.; Vitali, A.; Lacetera, N.; Nardone, A. The Effects of Heat Stress in Italian Holstein Dairy Cattle. J. Dairy Sci. 2014, 97, 471–486. [Google Scholar] [CrossRef] [PubMed]
  31. Becker, C.A.; Stone, A.E. Graduate Student Literature Review: Heat Abatement Strategies Used to Reduce Negative Effects of Heat Stress in Dairy Cows. J. Dairy Sci. 2020, 103, 9667–9675. [Google Scholar] [CrossRef] [PubMed]
  32. Roth, Z. Reproductive Physiology and Endocrinology Responses of Cows Exposed to Environmental Heat Stress—Experiences from the Past and Lessons for the Present. Theriogenology 2020, 155, 150–156. [Google Scholar] [CrossRef]
  33. Gebremedhin, K.G. Heat Stress and Evaporative Cooling. In Environmental Physiology of Livestock; John Wiley & Sons, Ltd.: Hoboken, NJ, USA, 2012; pp. 35–48. ISBN 9781119949091. [Google Scholar]
  34. Theusme, C.; Avendaño-Reyes, L.; Macías-Cruz, U.; Correa-Calderón, A.; García-Cueto, R.O.; Mellado, M.; Vargas-Villamil, L.; Vicente-Pérez, A. Climate Change Vulnerability of Confined Livestock Systems Predicted Using Bioclimatic Indexes in an Arid Region of México. Sci. Total Environ. 2021, 751, 1–11. [Google Scholar] [CrossRef]
  35. Tian, H.; Zheng, N.; Wang, W.; Cheng, J.; Li, S.; Zhang, Y.; Wang, J. Integrated Metabolomics Study of the Milk of Heat-Stressed Lactating Dairy Cows. Sci. Rep. 2016, 6, 24208. [Google Scholar] [CrossRef]
  36. Becker, C.A.; Collier, R.J.; Stone, A.E. Invited Review: Physiological and Behavioral Effects of Heat Stress in Dairy Cows. J. Dairy Sci. 2020, 103, 6751–6770. [Google Scholar] [CrossRef]
  37. IPCC. IPPC (International Plant Protection Convention) Annual Report 2018; FAO: Rome, Italy, 2019. [Google Scholar]
  38. Roth, Z. Influence of Heat Stress on Reproduction in Dairy Cows-Physiological and Practical Aspects. J. Anim. Sci. 2020, 98, S80–S87. [Google Scholar] [CrossRef]
  39. Gantner, V.; Bobic, T.; Gantner, R.; Gregic, M.; Kuterovac, K.; Novakovic, J.; Potocnik, K. Differences in Response to Heat Stress Due to Production Level and Breed of Dairy Cows. Int. J. Biometeorol. 2017, 61, 1675–1685. [Google Scholar] [CrossRef]
  40. Fabris, T.F.; Laporta, J.; Skibiel, A.L.; Corra, F.N.; Senn, B.D.; Wohlgemuth, S.E.; Dahl, G.E. Effect of Heat Stress during Early, Late, and Entire Dry Period on Dairy Cattle. J. Dairy Sci. 2019, 102, 5647–5656. [Google Scholar] [CrossRef]
  41. Nogoy, K.M.C.; Park, J.; Chon, S.-I.; Sivamani, S.; Park, M.J.; Cho, J.P.; Hong, H.K.; Lee, D.H.; Choi, S.H. Precision Detection of Real-Time Conditions of Dairy Cows Using an Advanced Artificial Intelligence Hub. Appl. Sci. 2021, 11, 12043. [Google Scholar] [CrossRef]
  42. Gernand, E.; König, S.; Kipp, C. Influence of On-Farm Measurements for Heat Stress Indicators on Dairy Cow Productivity, Female Fertility, and Health. J. Dairy Sci. 2019, 102, 6660–6671. [Google Scholar] [CrossRef]
Figure 1. Chromatic THI diagram including the maximum THI values across hours, days and months in Lucero 2016, both dairy farm and year were selected as representative of the Comarca Lagunera, northern arid Mexico. Color code: Agriculture 12 00760 i001 = no data; Agriculture 12 00760 i002 = THI < 68; Agriculture 12 00760 i003 = THI 68–71; Agriculture 12 00760 i004 = THI 72–76; Agriculture 12 00760 i005 = THI 77–79; Agriculture 12 00760 i006 = THI ≥ 80. Note: Upper margin; each black and white line denotes one month. Left margin; each black and white line represent one hour.
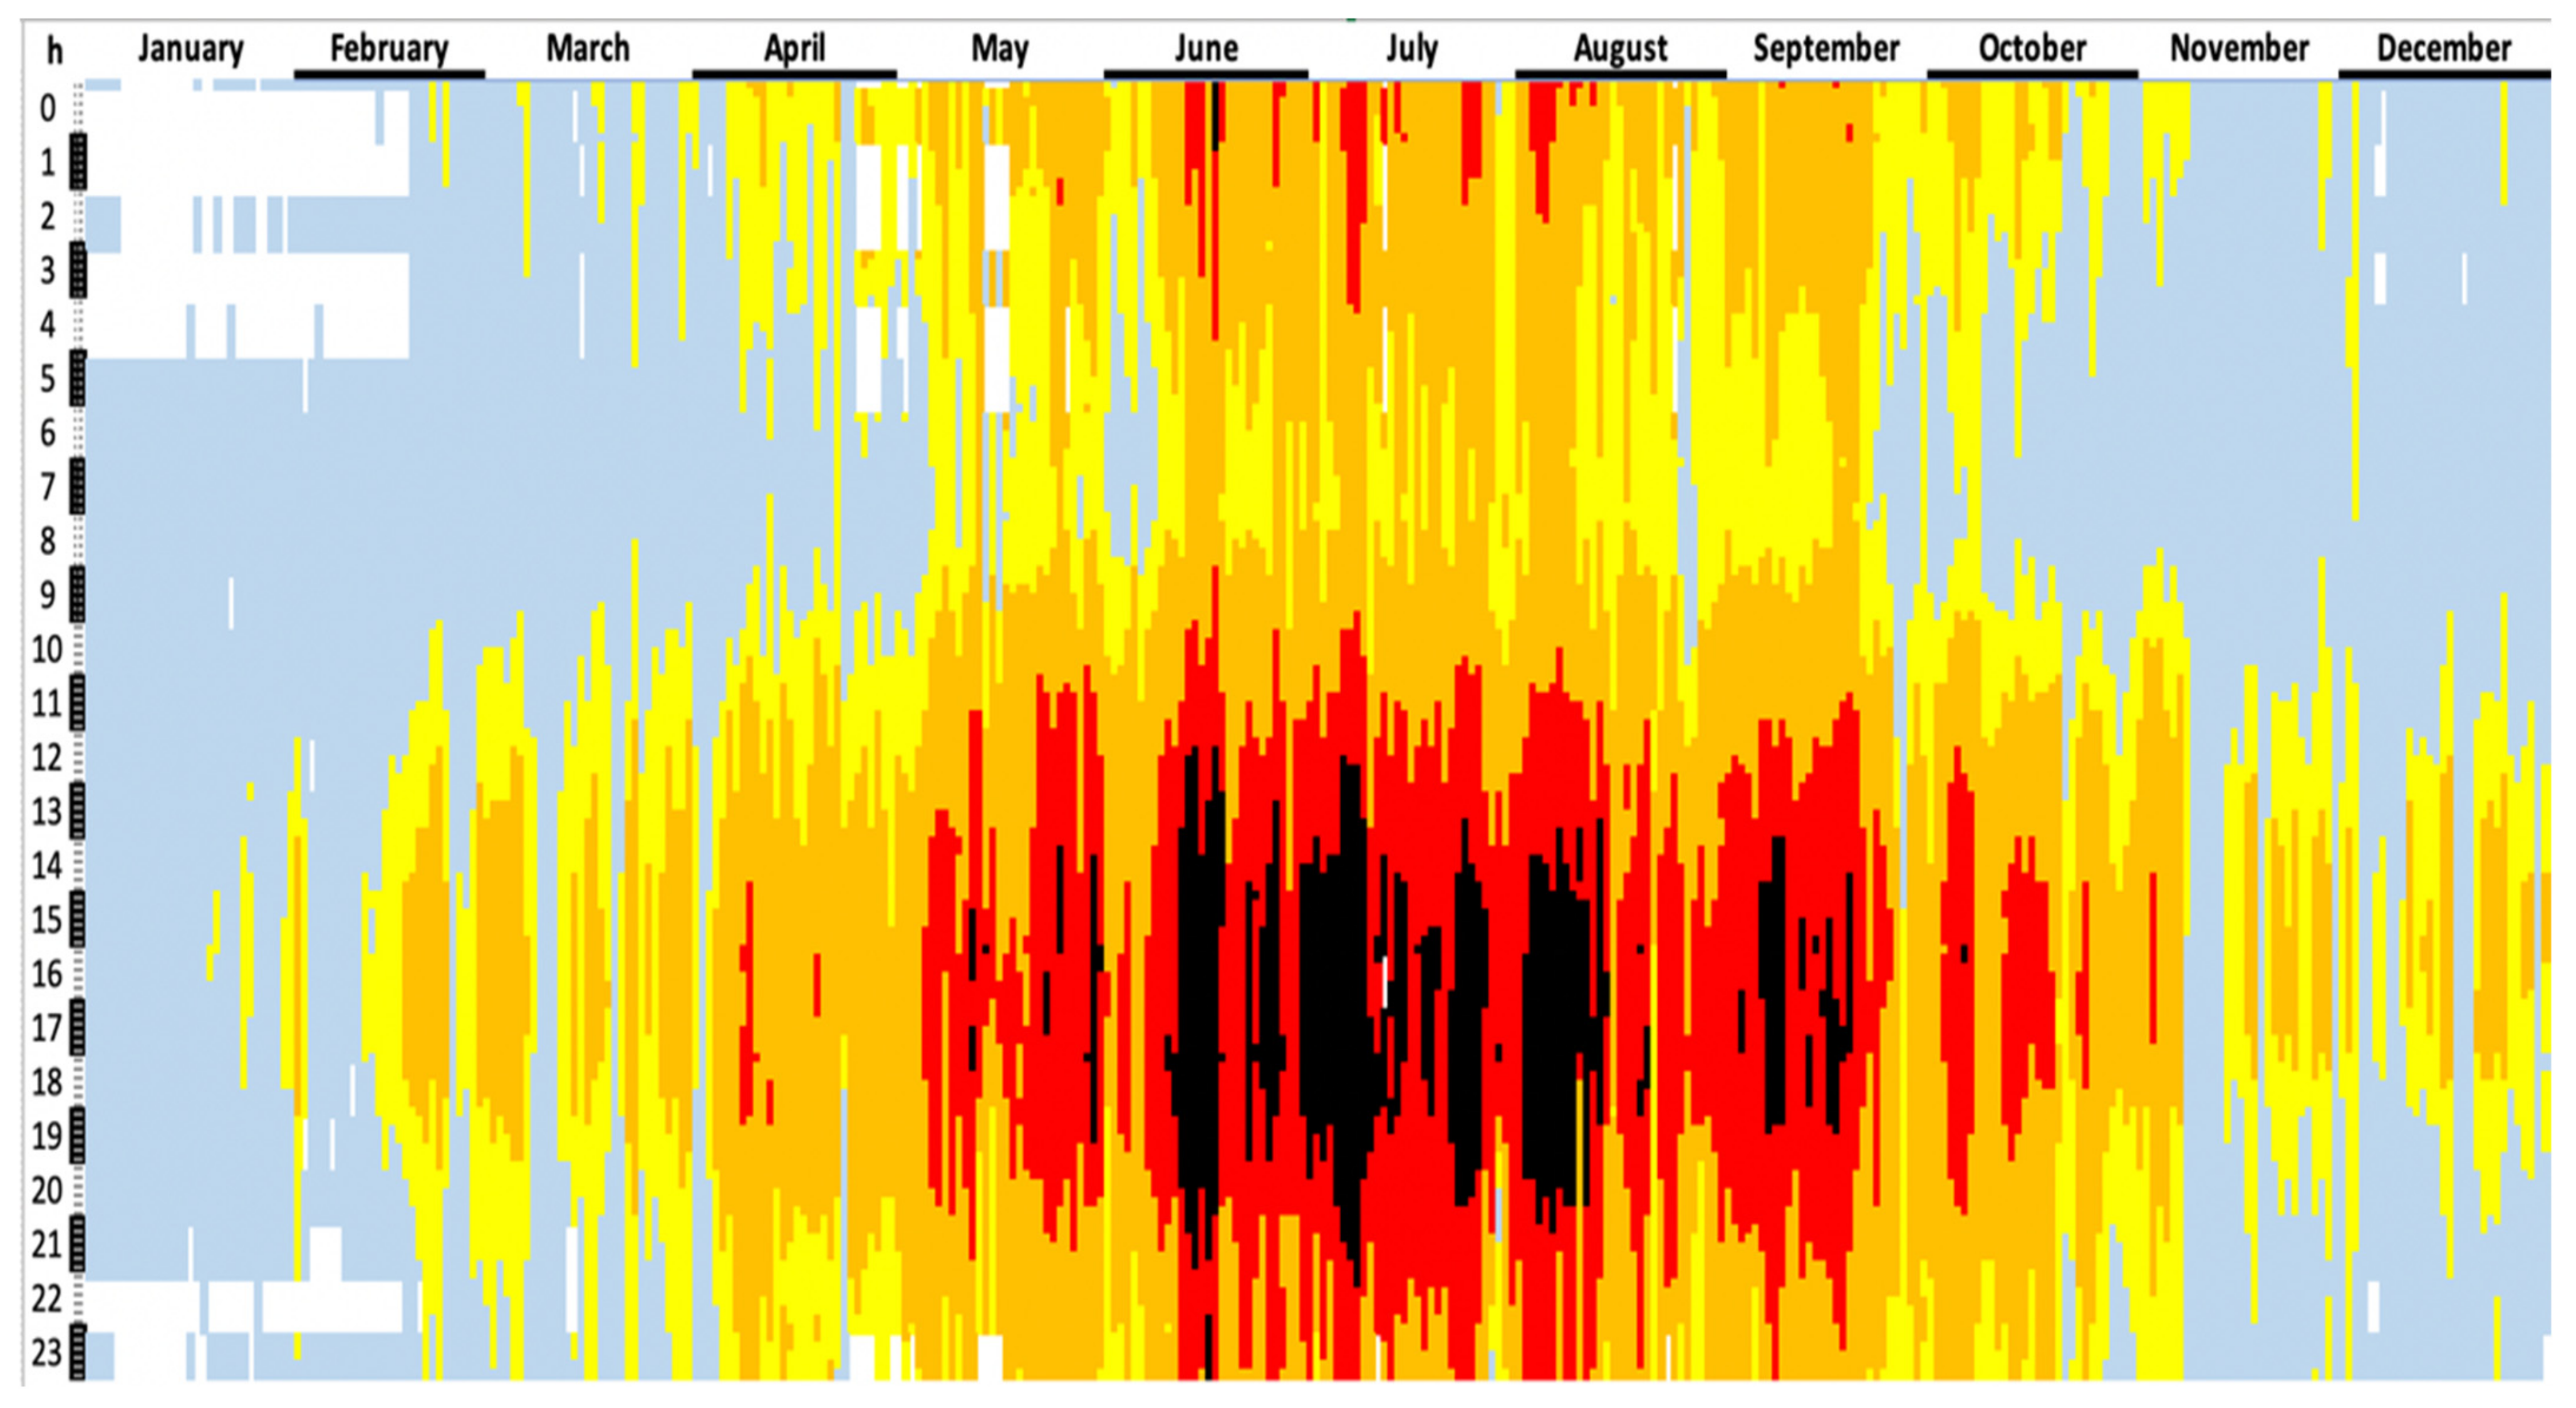
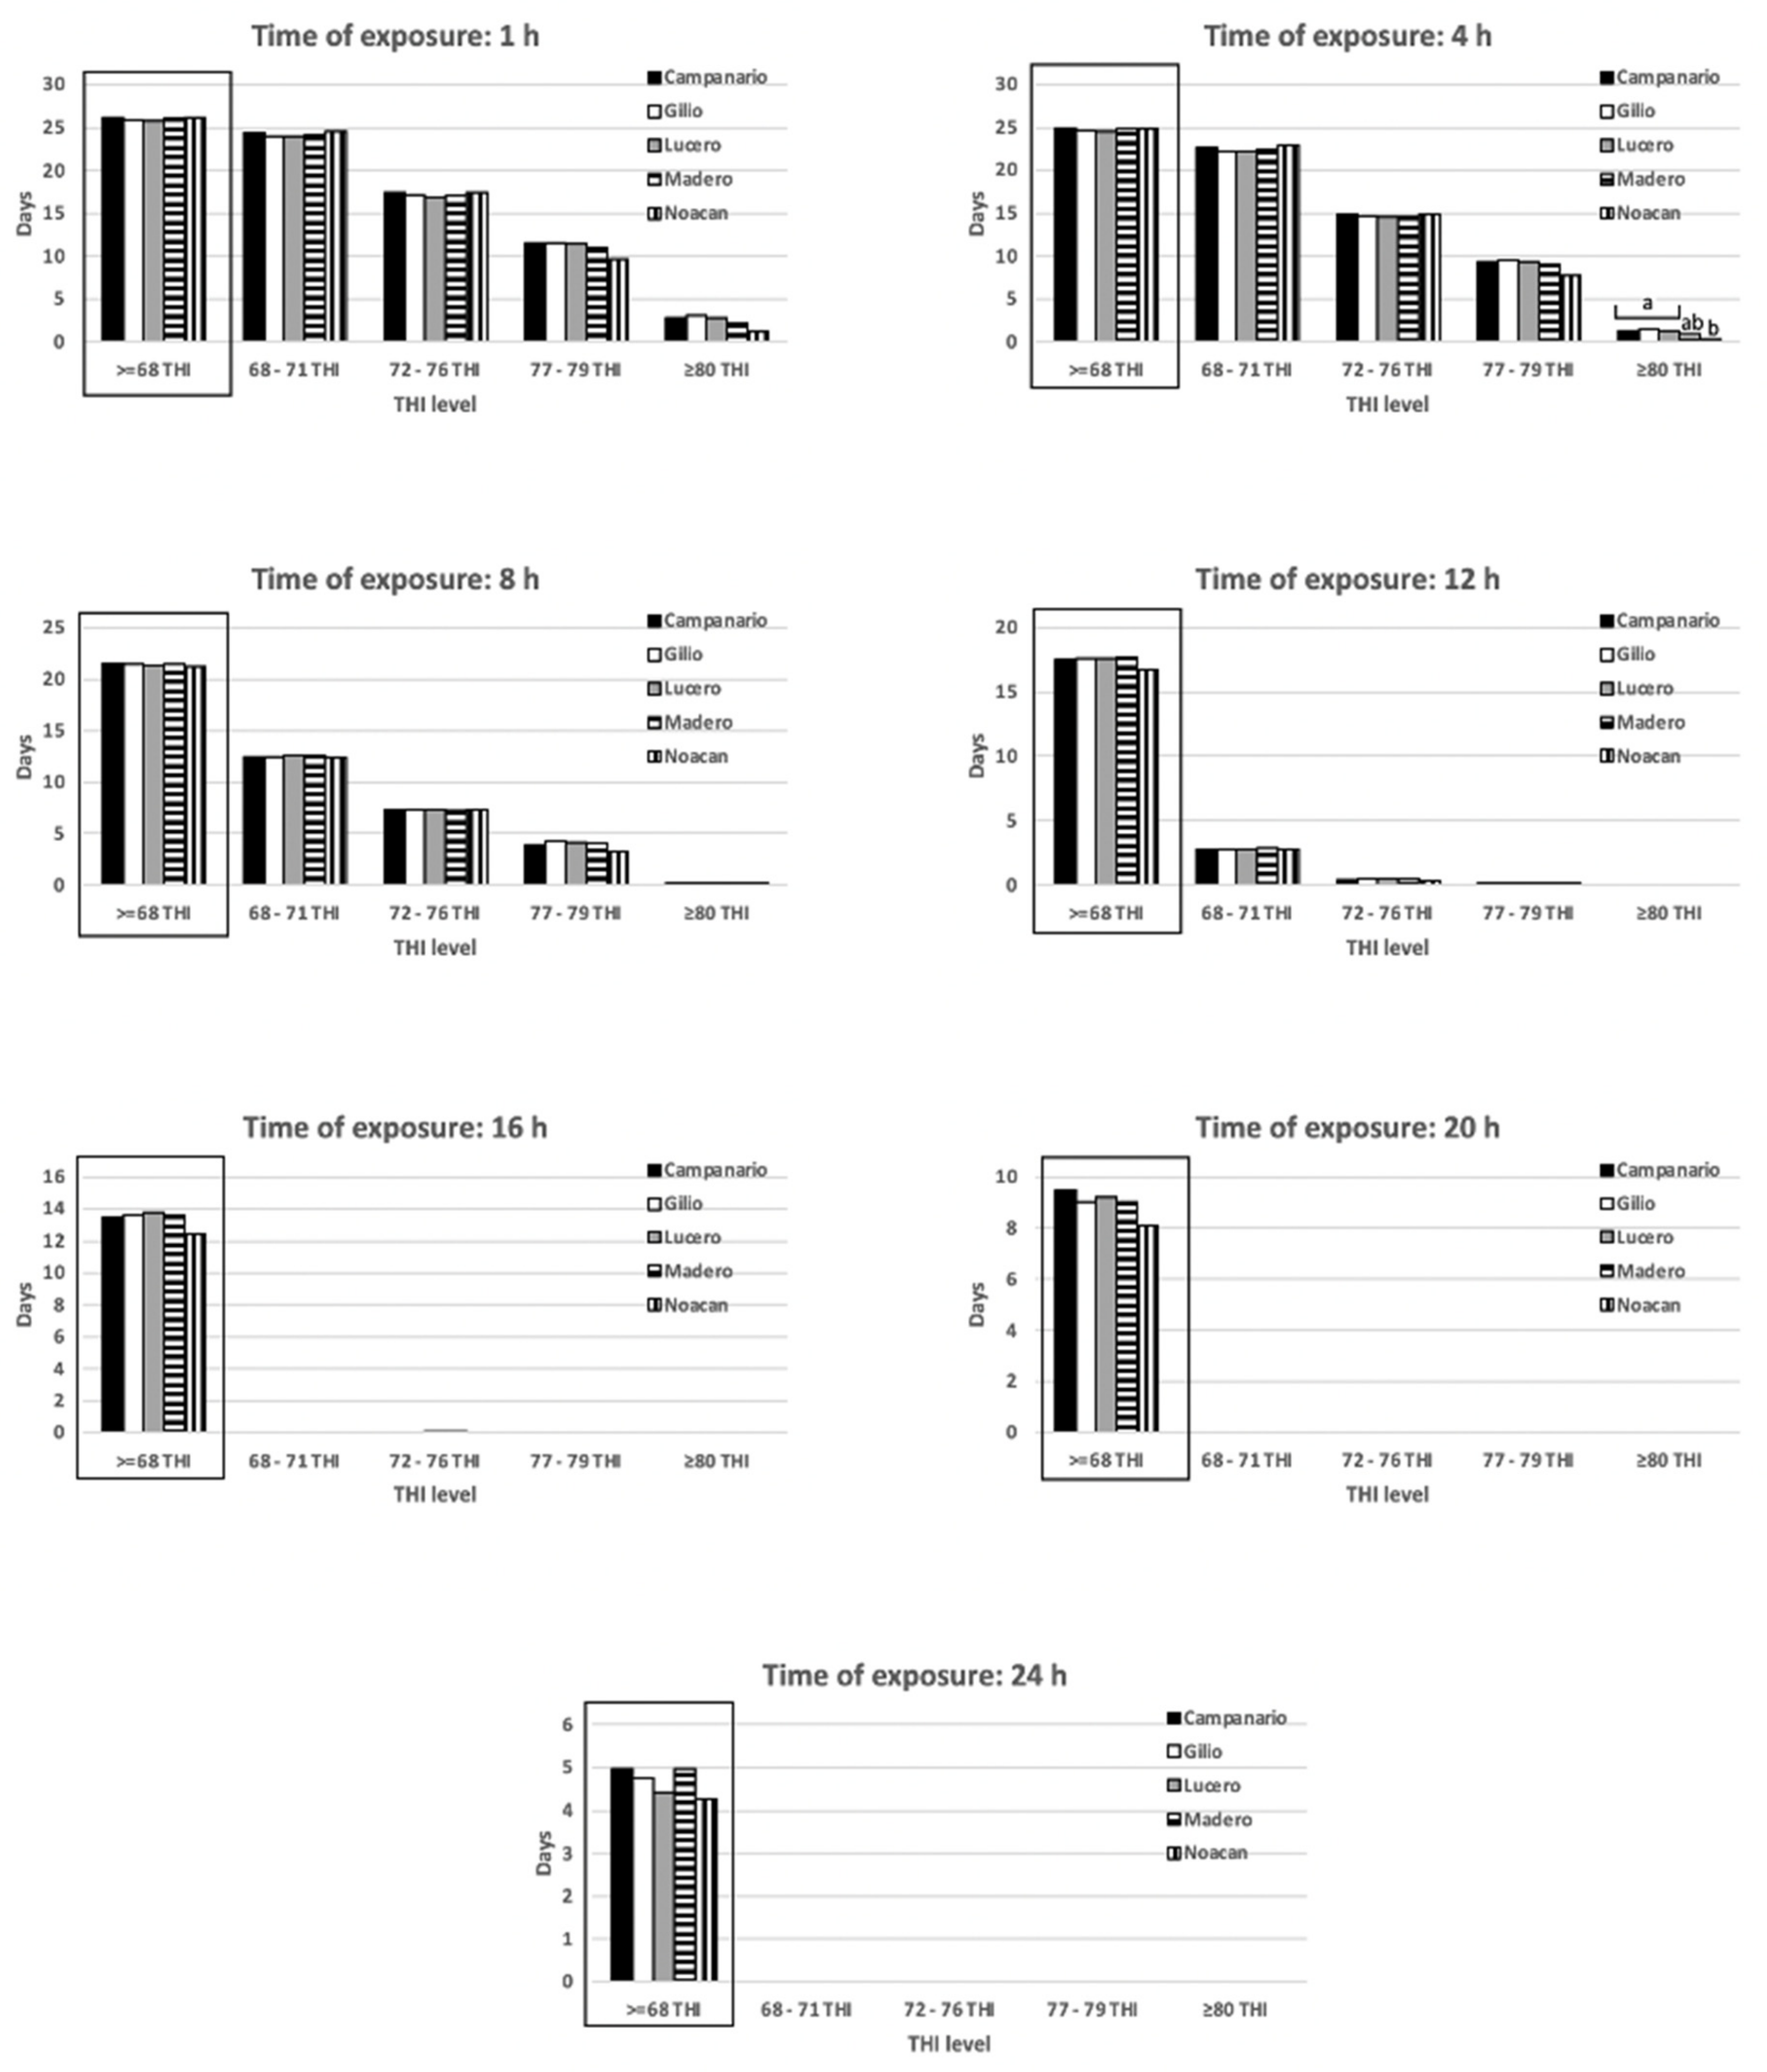
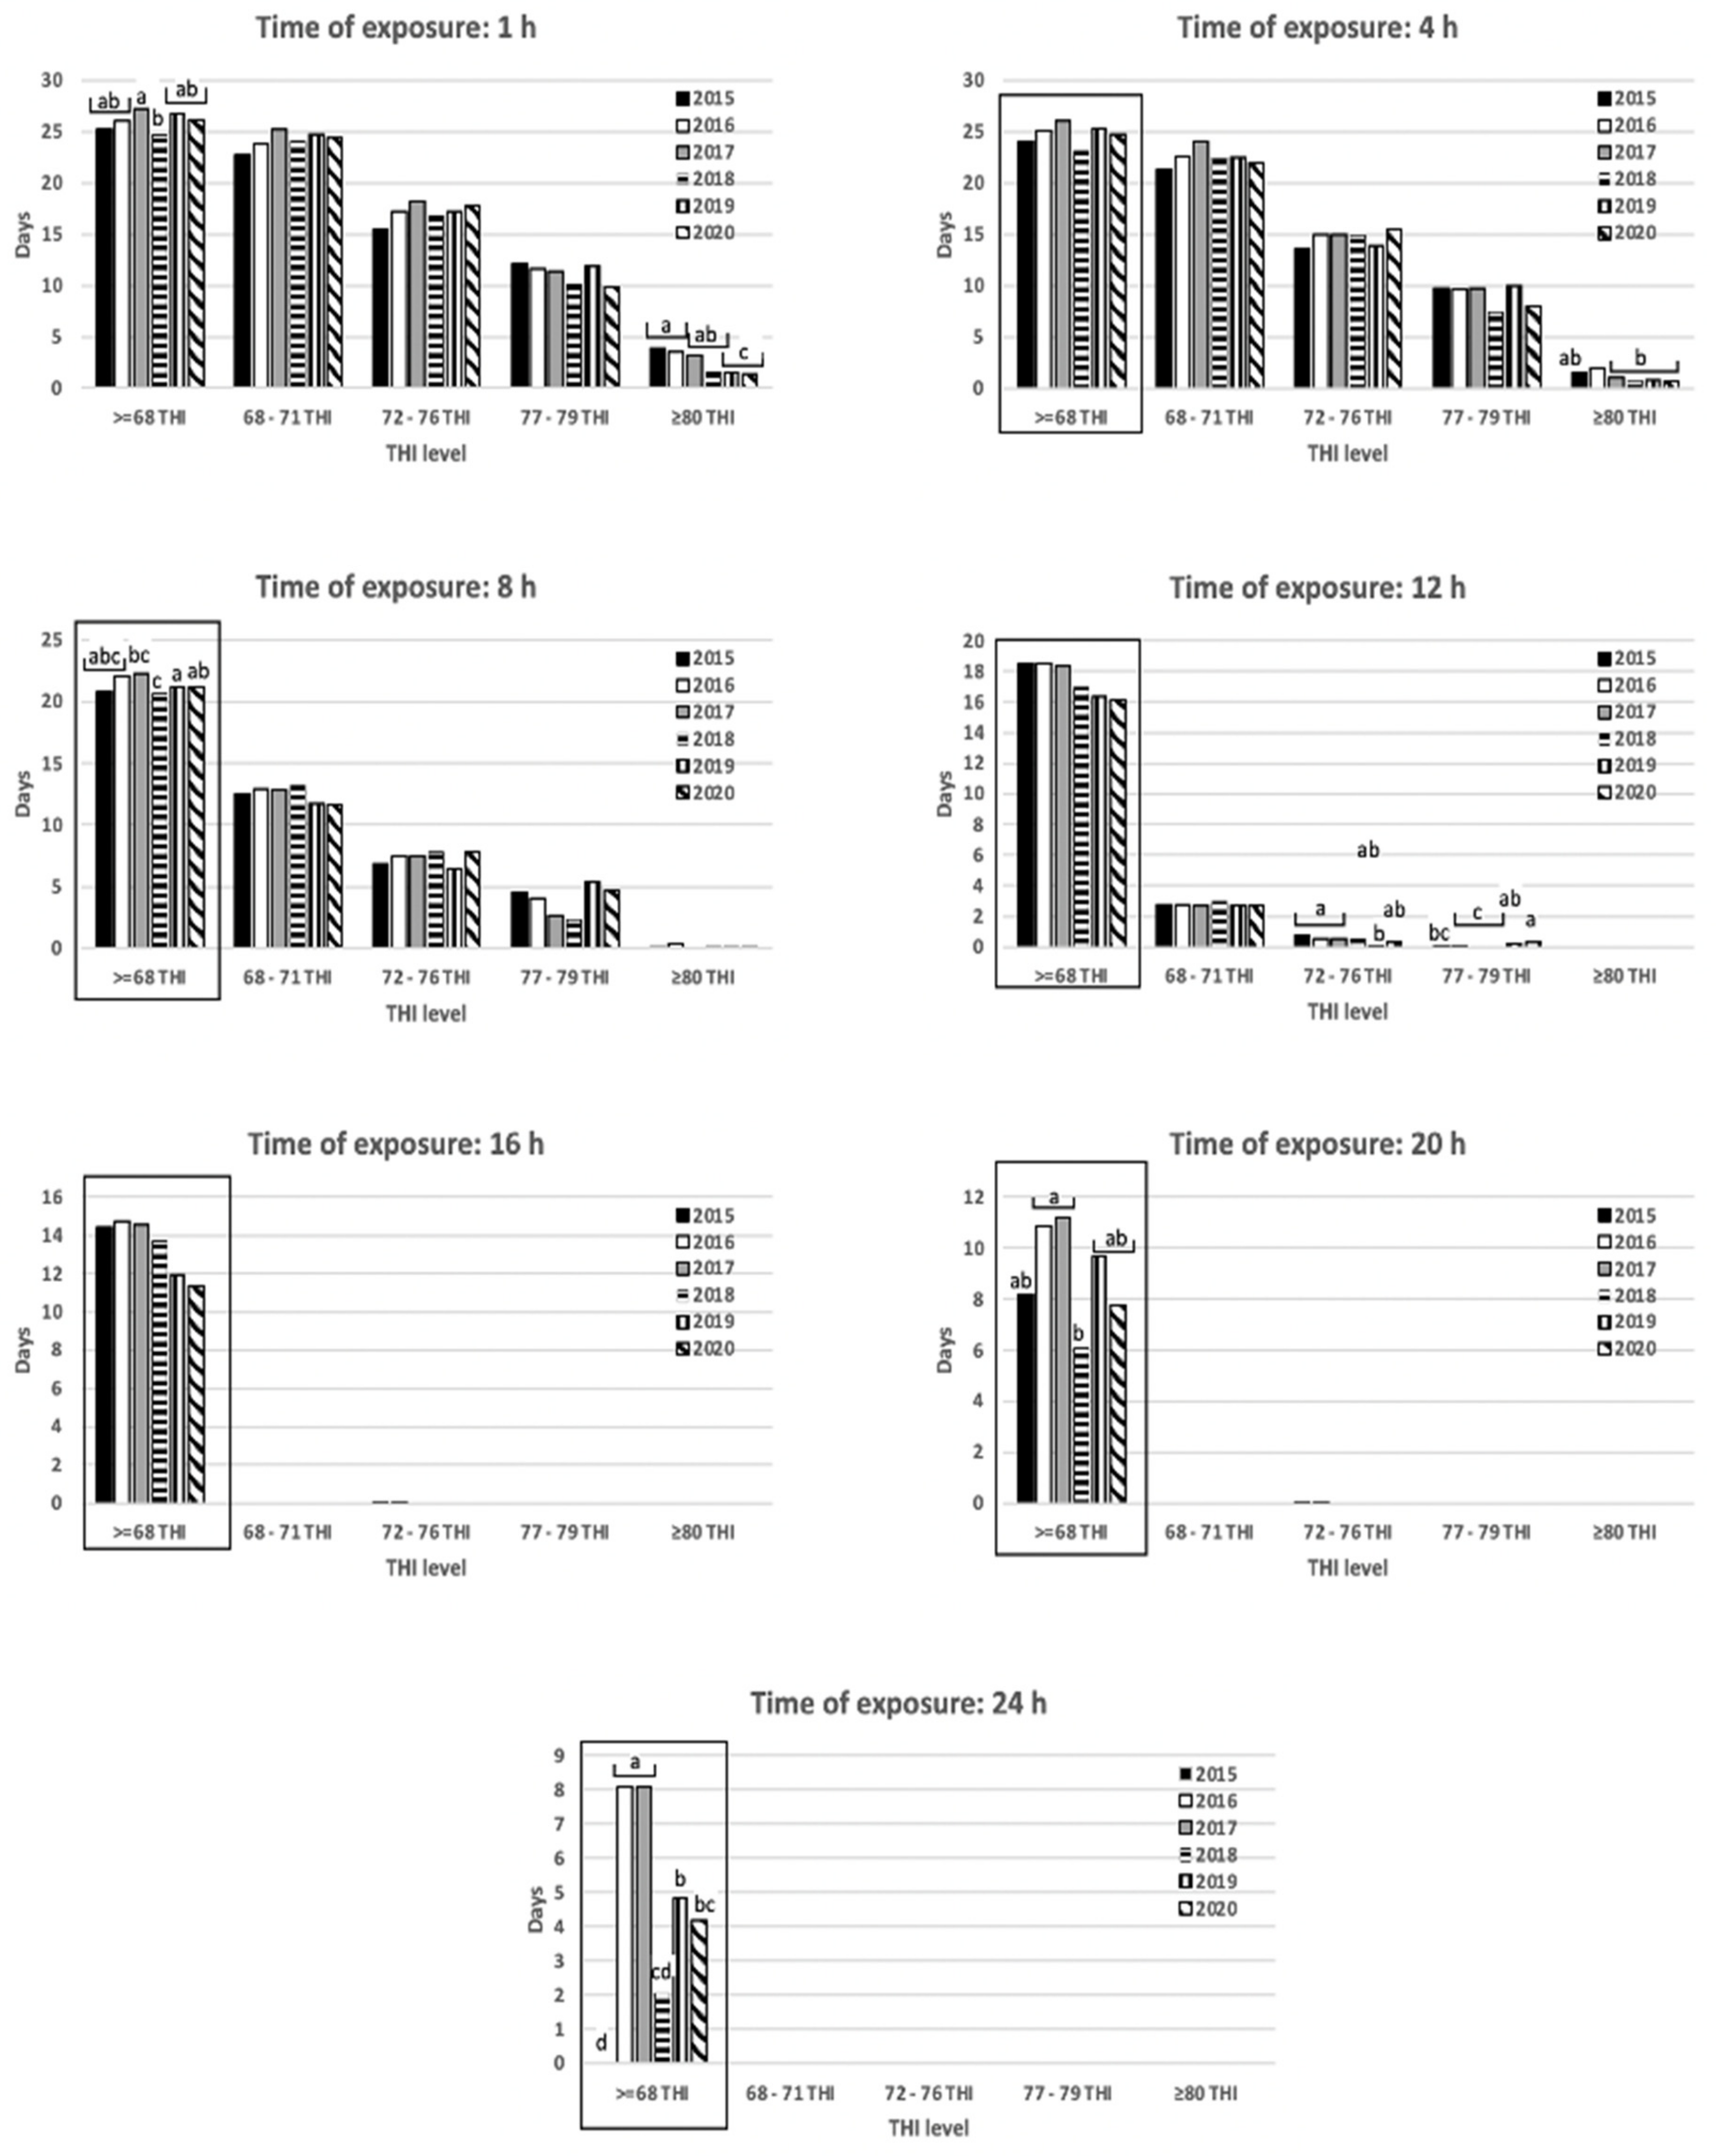
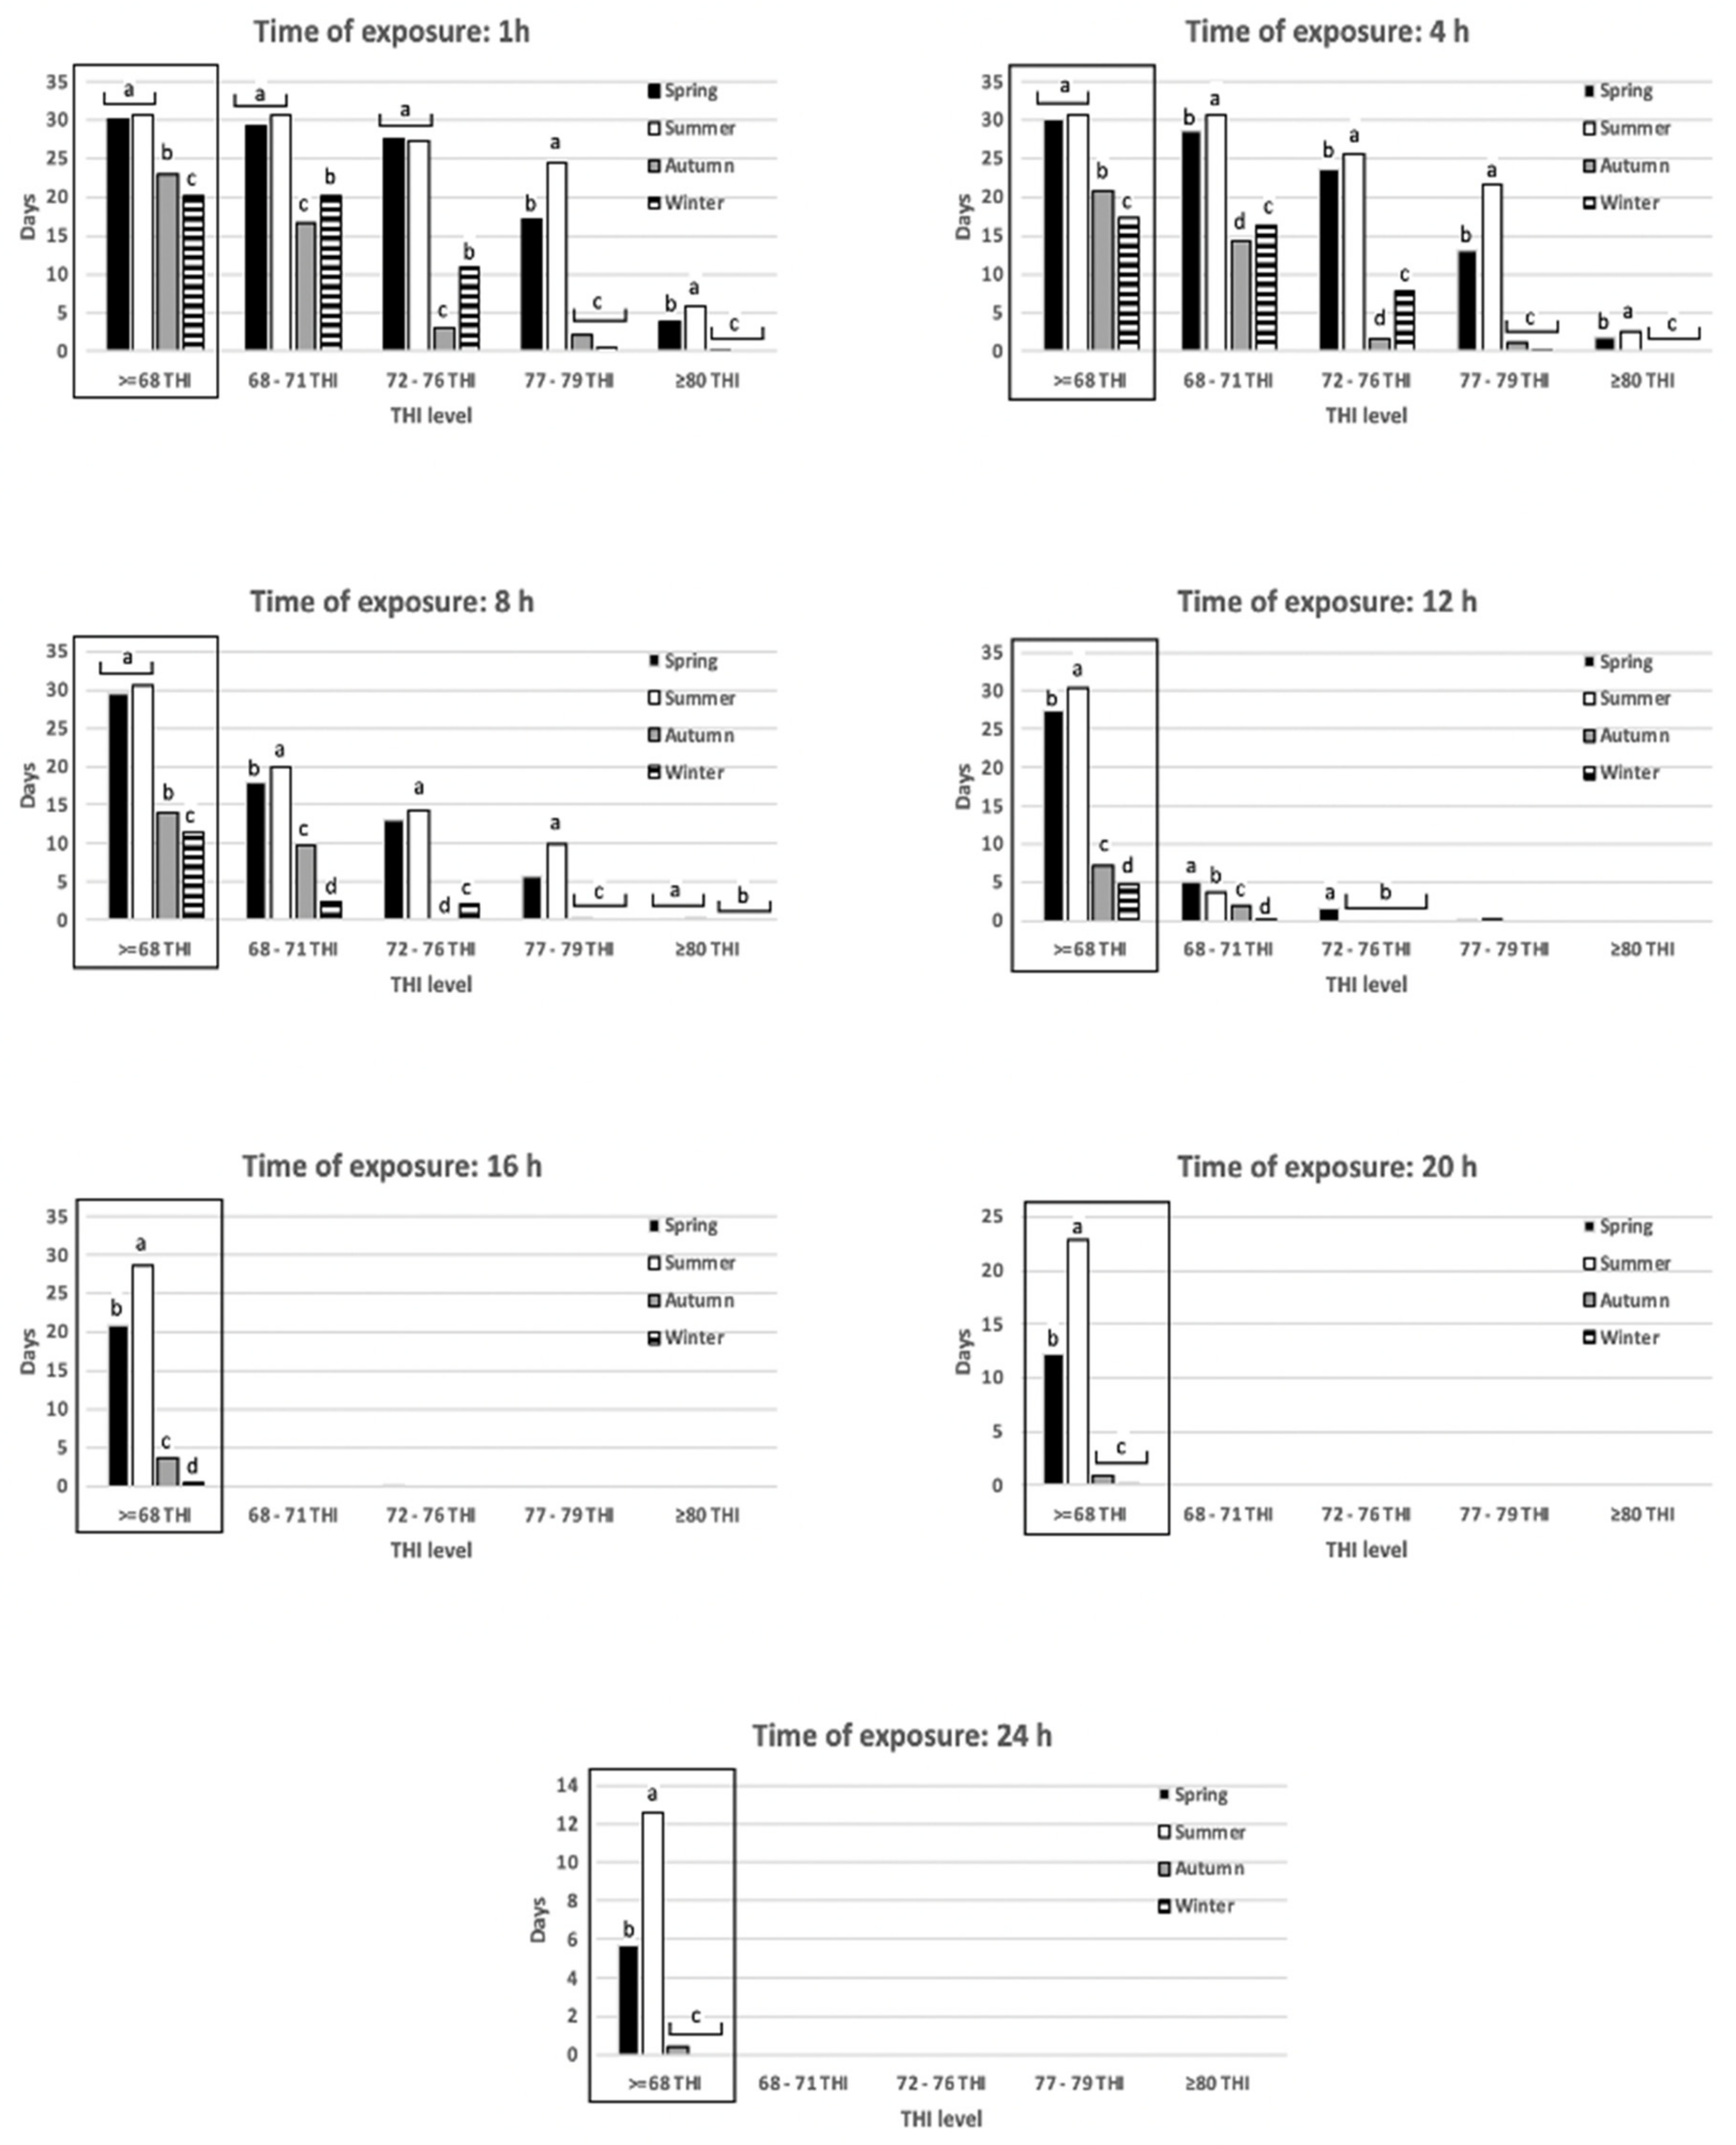
Agriculture 12 00760 g001
Figure 2. Average hour–month (HwHS) and month–year (MwHS) with HS (THI ≥ 68) in five dairy farms (2015–2020) in the Comarca Lagunera, northern arid Mexico. Non-heat stress Agriculture 12 00760 i007; Heat stress Agriculture 12 00760 i008.
Agriculture 12 00760 g002
Figure 3. Average hours of the month and average month of the year with HS at different THI levels ≥ 68) in five dairy farms (2015–2020) in the Comarca Lagunera, northern arid Mexico. Hours without HS Agriculture 12 00760 i009; h THI ≥ 68 Agriculture 12 00760 i010; h THI 68–71 Agriculture 12 00760 i011; h THI 72–76 Agriculture 12 00760 i012; h THI 77–79 Agriculture 12 00760 i013 and Agriculture 12 00760 i014 h THI ≥ 80.
Agriculture 12 00760 g003
Figure 4. Days with THI ≥ 68 and across THI subclasses: 68–71 THI (light stress); 72–76 THI (moderate stress); 77–79 THI (intense stress); and ≥80 THI (extreme stress) in five dairy farms (2015–2020) in the Comarca Lagunera, northern arid Mexico. Note: Subclasses with different literals, differ (p < 0.05); absence of literals shows no differences (p > 0.05). Bars with different superscript differs (p < 0.05).
Agriculture 12 00760 g004
Figure 5. Days with THI ≥ 68 by season and across THI subclasses: 68–71 (light stress); 72–76 (moderate stress); 77–79 (intense stress) and ≥80 (extreme stress) in five dairy farms (2015–2020) in the Comarca Lagunera, northern arid Mexico. Note: Subclasses with different literals, differ (p < 0.05); absence of literals indicates no differences (p > 0.05). Bars with different superscript differs (p < 0.05).
Agriculture 12 00760 g005
Figure 6. THI ≥ 68 across day-season and across THI subclasses: 68–71 (light stress); 72–76 (moderate stress); 77–79 (intense stress); and ≥80 (extreme stress) in five dairy farms (2015–2020) in the Comarca Lagunera, northern arid Mexico. Note: Subclasses with different literals, differ (p < 0.05); absence of literals indicates no differences (p > 0.05). Bars with different superscript differs (p < 0.05).
Agriculture 12 00760 g006
Figure 7. Average milk production (liters) according to the THI level in one representative dairy farm (2015–2020) in the Comarca Lagunera, northern arid Mexico. Note: Values are mean ± s.e; Bars with different superscript differs (p < 0.05).
Agriculture 12 00760 g007
Figure 8. Regression analysis among year-days (THI ≥ 68) in at least 1 h–TOE d−1 by THI level.
Agriculture 12 00760 g008
Figure 9. Regression analysis among year–day (THI ≥ 68) in at least 4 h TOE d−1 by THI level.
Agriculture 12 00760 g009
Figure 10. Regression analysis among year–day (THI ≥ 68) in at least 8 h TOE d−1 by THI levels.
Agriculture 12 00760 g010
Figure 11. Regression analysis among year–day when THI ≥68 occurred daily at least 12 h and 16 h.
Agriculture 12 00760 g011
Table 1. Number of days with THI ≥ 68 as well as at different THI subclasses with at least one hour of heat stress, collected from five dairy farms along with 2015–2020 in the Comarca Lagunera, northern arid Mexico.
FarmYear
201520162017201820192020
Any THI value ≥ 68
Campanario303325325297321317
Gilio303308327294321314
Lucero303309325291317309
Madero302308327297323315
Noacannd308327294323323
THI 68–71
Campanario272302302289298294
Gilio272278302288298293
Lucero272279302288295291
Madero272278302289298335
Noacannd278302288298292
THI 72–76
Campanario186220220201211219
Gilio186201220200211218
Lucero186202221201196213
Madero185200213204211212
Noacannd200213204208210
THI 77–79
Campanario146140140123154130
Gilio146153136119154128
Lucero146156141118129131
Madero143149134124140105
Noacannd14913411513396
THI ≥ 80
Campanario514444153220
Gilio475437243228
Lucero49644625625
Madero4047312274
Noacannd453020134
nd = no data.
Table 2. Average day–month and month–year with THI ≥ 68 (time exposure, hours) and THI levels in five dairy farms (2015–2020) in the Comarca Lagunera, northern arid Mexico.
Time Exposure (h)DaysMonths
12110.5
6178.4
12157.7
18147.1
24126.0
THI level
≥ 682110.5
68–71199.7
72–76168.0
77–7994.4
≥ 8042.0
Table 3. THI average (Avg), maximum (Max) and minimum (Min), temperature air, and relative humidity, across seasons, in five dairy farms (2015–2020) in the Comarca Lagunera, northern arid Mexico.
SeasonTemperature (°C)Relative Humidity (%)THI (Units)
AvgMaxMinAvgMaxMinAvgMaxMin
Winter19.1834.101.1034.9199.002.0061.887535
Autumn21.3934.206.1049.7796.000.0066.008043
Spring27.9738.9011.7034.9691.000.0072.538254
Summer27.9738.118.352.59100.0015.0074.778264
Table 4. Percentage of annual hours with heat stress (THI ≥ 68) at different time of exposure (TOE-HS, h) in one representative dairy farm (2015–2020) in the Comarca Lagunera, northern arid Mexico.
TOE-HS (h)Percentage
184.1
473.3
868.4
1264.2
1661.8
2057.6
2450.3
Table 5. Percentage of annual hours with heat stress at different THI levels in five dairy farms (2015–2020) in the Comarca Lagunera, northern arid Mexico.
THI LevelPercentage
≥6884.1
69–7180.9
72–7666.7
77–7936.5
≥8016.3
Publisher’s Note: MDPI stays neutral with regard to jurisdictional claims in published maps and institutional affiliations.

