Article

Landscape of Global Gene Expression Reveals Distinctive Tissue Characteristics in Bactrian Camels (Camelus bactrianus)

1
Laboratory of Animal Genetics, Breeding and Reproduction, Ministry of Agriculture, Institute of Animal Sciences, Chinese Academy of Agricultural Sciences (CAAS), Beijing 100193, China
2
National Germplasm Center of Domestic Animal Resources, Ministry of Technology, Institute of Animal Sciences, Chinese Academy of Agricultural Sciences (CAAS), Beijing 100193, China
3
Bactrian Camel Institute of Alsha, Bayanhot, Inner Mongolia 750306, China
*
Author to whom correspondence should be addressed.
These authors contributed equally to this work.
Agriculture 2022, 12(7), 958; https://doi.org/10.3390/agriculture12070958
Submission received: 29 May 2022 / Revised: 27 June 2022 / Accepted: 29 June 2022 / Published: 3 July 2022
(This article belongs to the Section Crop Genetics, Genomics and Breeding)

Abstract

:
Bactrian camels (Camelus bactrianus) are highly adapted to the desert and semi-desert environments of Asia and developed unique physiological adaptations to cold, heat, drought, and nutrient-poor conditions. These animals are an ideal model for studying desert adaptation. However, the transcriptome of different Bactrian camel tissues has not been profiled. This study performed a comprehensive transcriptome analysis of nine fetal and adult tissues. A total of 20,417 coding genes were identified, and 2.4 billion reads were generated. Gene expression and functional analyses revealed that approximately 50% of the identified genes were ubiquitously expressed, and one-third were tissue-elevated genes, which were enriched in pathways related to the biological functions of the corresponding tissue. Weighted gene co-expressed network analysis (WGCNA) identified four modules—fat metabolism, water balance, immunity, and digestion—and several hub genes, including APOA1, TMEM174, CXCL12, and MYL9. The analysis of differentially expressed genes (DEGs) between fetal and adult tissues revealed that downregulated genes were enriched in tissue development, whereas upregulated genes were enriched in biological function in adult camels. DEGs in the hump were enriched in immune-related pathways, suggesting that this tissue is involved in immunity. This study is the first to generate a transcriptome atlas of major tissues in Bactrian camels and explores the genes potentially involved in the adaptation to desert environments.

1. Introduction

RNA sequencing technologies have improved our understanding of RNA structure and function and allowed the genome-wide analysis of gene expression [1]. Transcriptome atlases of different mammals, including pig [2], bovine [3], mice [4,5], and human [4,6], have been generated. Bactrian camels live in the cold desert and semi-desert environments of Asia and are always known as ‘ship of the desert’. In the past, camels were used for travel and the transportation of goods. With the rapid development of China’s economy, camels primarily provide camel hair, meat, and milk, which is an important part of animal husbandry. Over the course of evolution, camels have developed several physiological adaptations to cold, heat, drought, and nutrient-poor conditions [7,8]. To adapt to the harsh living environment, they can store energy in their humps in the form of fat, enabling them to survive long periods without any food or water [9]. The camel’s body temperature may vary from 34 to 41 °C throughout the day, and it can survive losing more than 25% of its body weight in water [10]. Therefore, camels not only provide animal products, including camel hair, meat and milk, but also provide an ideal model for studying adaptation to desert environments. Whole-genome sequencing has provided insights into the genetic diversity and genetic domestication of wild and domestic camels [11,12]. Furthermore, previous studies analyzed changes in gene expression in the kidney [13,14,15], adipose tissue [16], fat depots, ileum and liver [17] of camels in response to high salinity and drought conditions.
Although previous studies performed genomic and transcriptomic analyses of Bactrian camels [11,12,18,19], a better understanding of transcriptomes will help unravel the genomic complexity and the transcriptional landscape of tissues and cells. The transcriptome characteristics and gene expression in different tissues of Bactrian camel remain unknown. In this study, we generated a transcriptome atlas of different Bactrian camel tissues, profiled genome-wide gene expression and explored the genes potentially involved in adaptation in desert environments.

2. Materials and Methods

2.1. Ethics Statement

This study conformed to the guidelines of the Institute of Animal Science of the Chinese Academy of Agricultural Sciences, Beijing, China.

2.2. Tissue Collection and RNA Extraction

Three adult male Bactrian camels (ten years old) and three camel fetuses (ten months of gestation) were used in this study. Immediately after euthanasia, samples from nine tissues (hump, heart muscle, liver, spleen, lung, kidney, small intestine, rumen, and skeletal muscle) were stored in RNAlater at −80 °C until analysis. Total RNA was extracted using the RNeasy Kit (Qiagen), and RNA concentration and integrity (RNA integrity number [RIN]) were assessed using an Agilent 2100 bioanalyzer (Agilent, Santa Clara, CA, USA). The samples with total RNA >2 μg, RNA concentration >100 ng.μL−1, RIN ≥7.0, and 28S/18S ratio ≥0.7 were selected for sequencing analysis.

2.3. cDNA Library Construction and RNA Sequencing

One microgram of isolated total RNA per sample was used to construct a cDNA library for RNA-Seq according to the protocol of TruSeq Stranded Total RNA Sample Prep Kit (Illumina, San Diego, CA, USA). The mRNA was isolated by Oligo Magnetic Beads and cut into small fragments that served as templates for cDNA synthesis. Once short, cDNA fragments were purified, they were extended with single nucleotide adenines, ligated with suitable adapters, and amplified by PCR before they were sequenced. The cDNA concentration and quality were assessed using an Agilent Bioanalyzer 2100 (Agilent, CA, USA). Finally, a cDNA library was obtained. Index-coded samples were clustered using a TruSeq PE Cluster Kit v3-cBot-HS on a cBot Cluster Generation System (Illumina, San Diego, CA, USA). The libraries were paired-end sequenced (2 × 150 bp) on an Illumina NovaSeq6000 RNA-Seq platform. The nucleotide sequences of raw reads and assembled genomes were deposited in the NCBI Sequence Read Archive database under Accession.

2.4. Sequence Analysis and Transcriptome Mapping

Raw reads were cleaned by removing adapter sequences, reads with over 10% N sequences, and low-quality reads in which the number of bases with a quality value Q ≤ 10 was more than 50%, and then clean reads were obtained. The Q20, Q30, and GC contents of the clean data were calculated. The clean reads were mapped to the Bactrian camel genome (Ca_bactrianus_MBC_1.0) using TopHat2 version 2.1.1 with default parameters [20]. BAM files were sorted by coordinate and converted to SAM files using SAMtools version 1.4 [21]. Transcripts from each sample were assembled using Cufflink, and transcriptomes for all samples were merged using Cuffmerge. Transcript abundance was expressed as fragments per kilobase of exon per million mapped reads (FPKM).

2.5. Classification of Protein-Coding Genes

Protein-coding genes were classified into (1) ubiquitously expressed (FPKM > 1), (2) enhanced (FPKM values at least 5-fold higher in a particular tissue than the average level in all other tissues), and (3) enriched (FPKM values at least 5-fold higher in a particular tissue than in all other tissues) [22]. In our analyses, to investigate global expression profiles of Bactrian camel, we calculated the Pearson correlation coefficient and the average FPKM values for heart muscle, liver, spleen, lung, kidney, hump, small intestine, and skeletal muscle tissues in adults and fetuses. The expression networks were visualized using heatmaps. Heatmaps were generated using pheatmap in R software.

2.6. Weighted Gene Co-Expressed Network Analysis

Genes potentially associated with adaptation to drought were identified by weighted gene co-expressed network analysis (WGCNA) [23]. Pair-wise correlations between the pairs of expressed genes across tissues were calculated and used to construct the adjacency matrix. The adjacency matrix was transformed into a topological overlap matrix (TOM). The TOMs quantitatively describe the similarity in nodes by comparing the weighted correlation between two nodes and other nodes. Hierarchical clustering was performed using the Dynamic Tree Cut algorithm in R [24]. Highly correlated modules were further merged using mergeCutHeight of 0.35.
The exportNetworkToCytoscape package in R was used to calculate the weight of each gene in co-expression modules and generate the edges file to select the top 300 genes in each module [25]. Genes with degrees greater than 25 were considered hubs. Gene interaction networks were created using Cytoscape version 3.7.1 [26].

2.7. Functional Enrichment Analysis

Gene Ontology (GO) and Kyoto Encyclopedia of Genes and Genomes (KEGG) enrichment analyses were performed using g:Profiler [27] (https://biit.cs.ut.ee/gprofiler/gost/, accessed on 11 April 2020). The ENTREZ_GENE_ID of the gene clusters were used as identifiers, and Homo sapiens was selected as the background dataset for the enrichment analysis. p-values ≤ 0.05 were considered statistically significant.

2.8. Quantitative Real-Time PCR

Single-strand cDNA was synthesized from RNA using the PrimeScript RT reagent Kit with gDNA Eraser (Takara, China). The mRNA sequences were downloaded from the NCBI database (https://www.ncbi.nlm.nih.gov/nucleotide/, accessed on 15 June 2020). Primer sequences were designed using primer-BLAST (https://blast.ncbi.nlm.nih.gov/Blast.cgi/, accessed on 15 June 2020) and are listed in Table S9. Differentially expressed genes (DEGs) were identified using Cuffdiff in Cufflinks. The criteria for differential expression were (1) false discovery rate (FDR) < 0.05, (2) |log2 fold change > 2|, and (3) FPKM > 1. DEGs were compared across tissues by analysis of variance with Benjamini and Hochberg FDR correction at p < 0.05. Hierarchical clustering of differentially expressed genes from each tissue of the adult Bactrian camel was performed using R and drew a heat map. Using the R package heatmap, 101 co-expressed genes were clustered into 6 groups based on their expression profiles. These genes were clustered by complete linkage hierarchical clustering based on Pearson correlation coefficients. Supplementary Table S8 contains all of the gene expression data.

3. Results

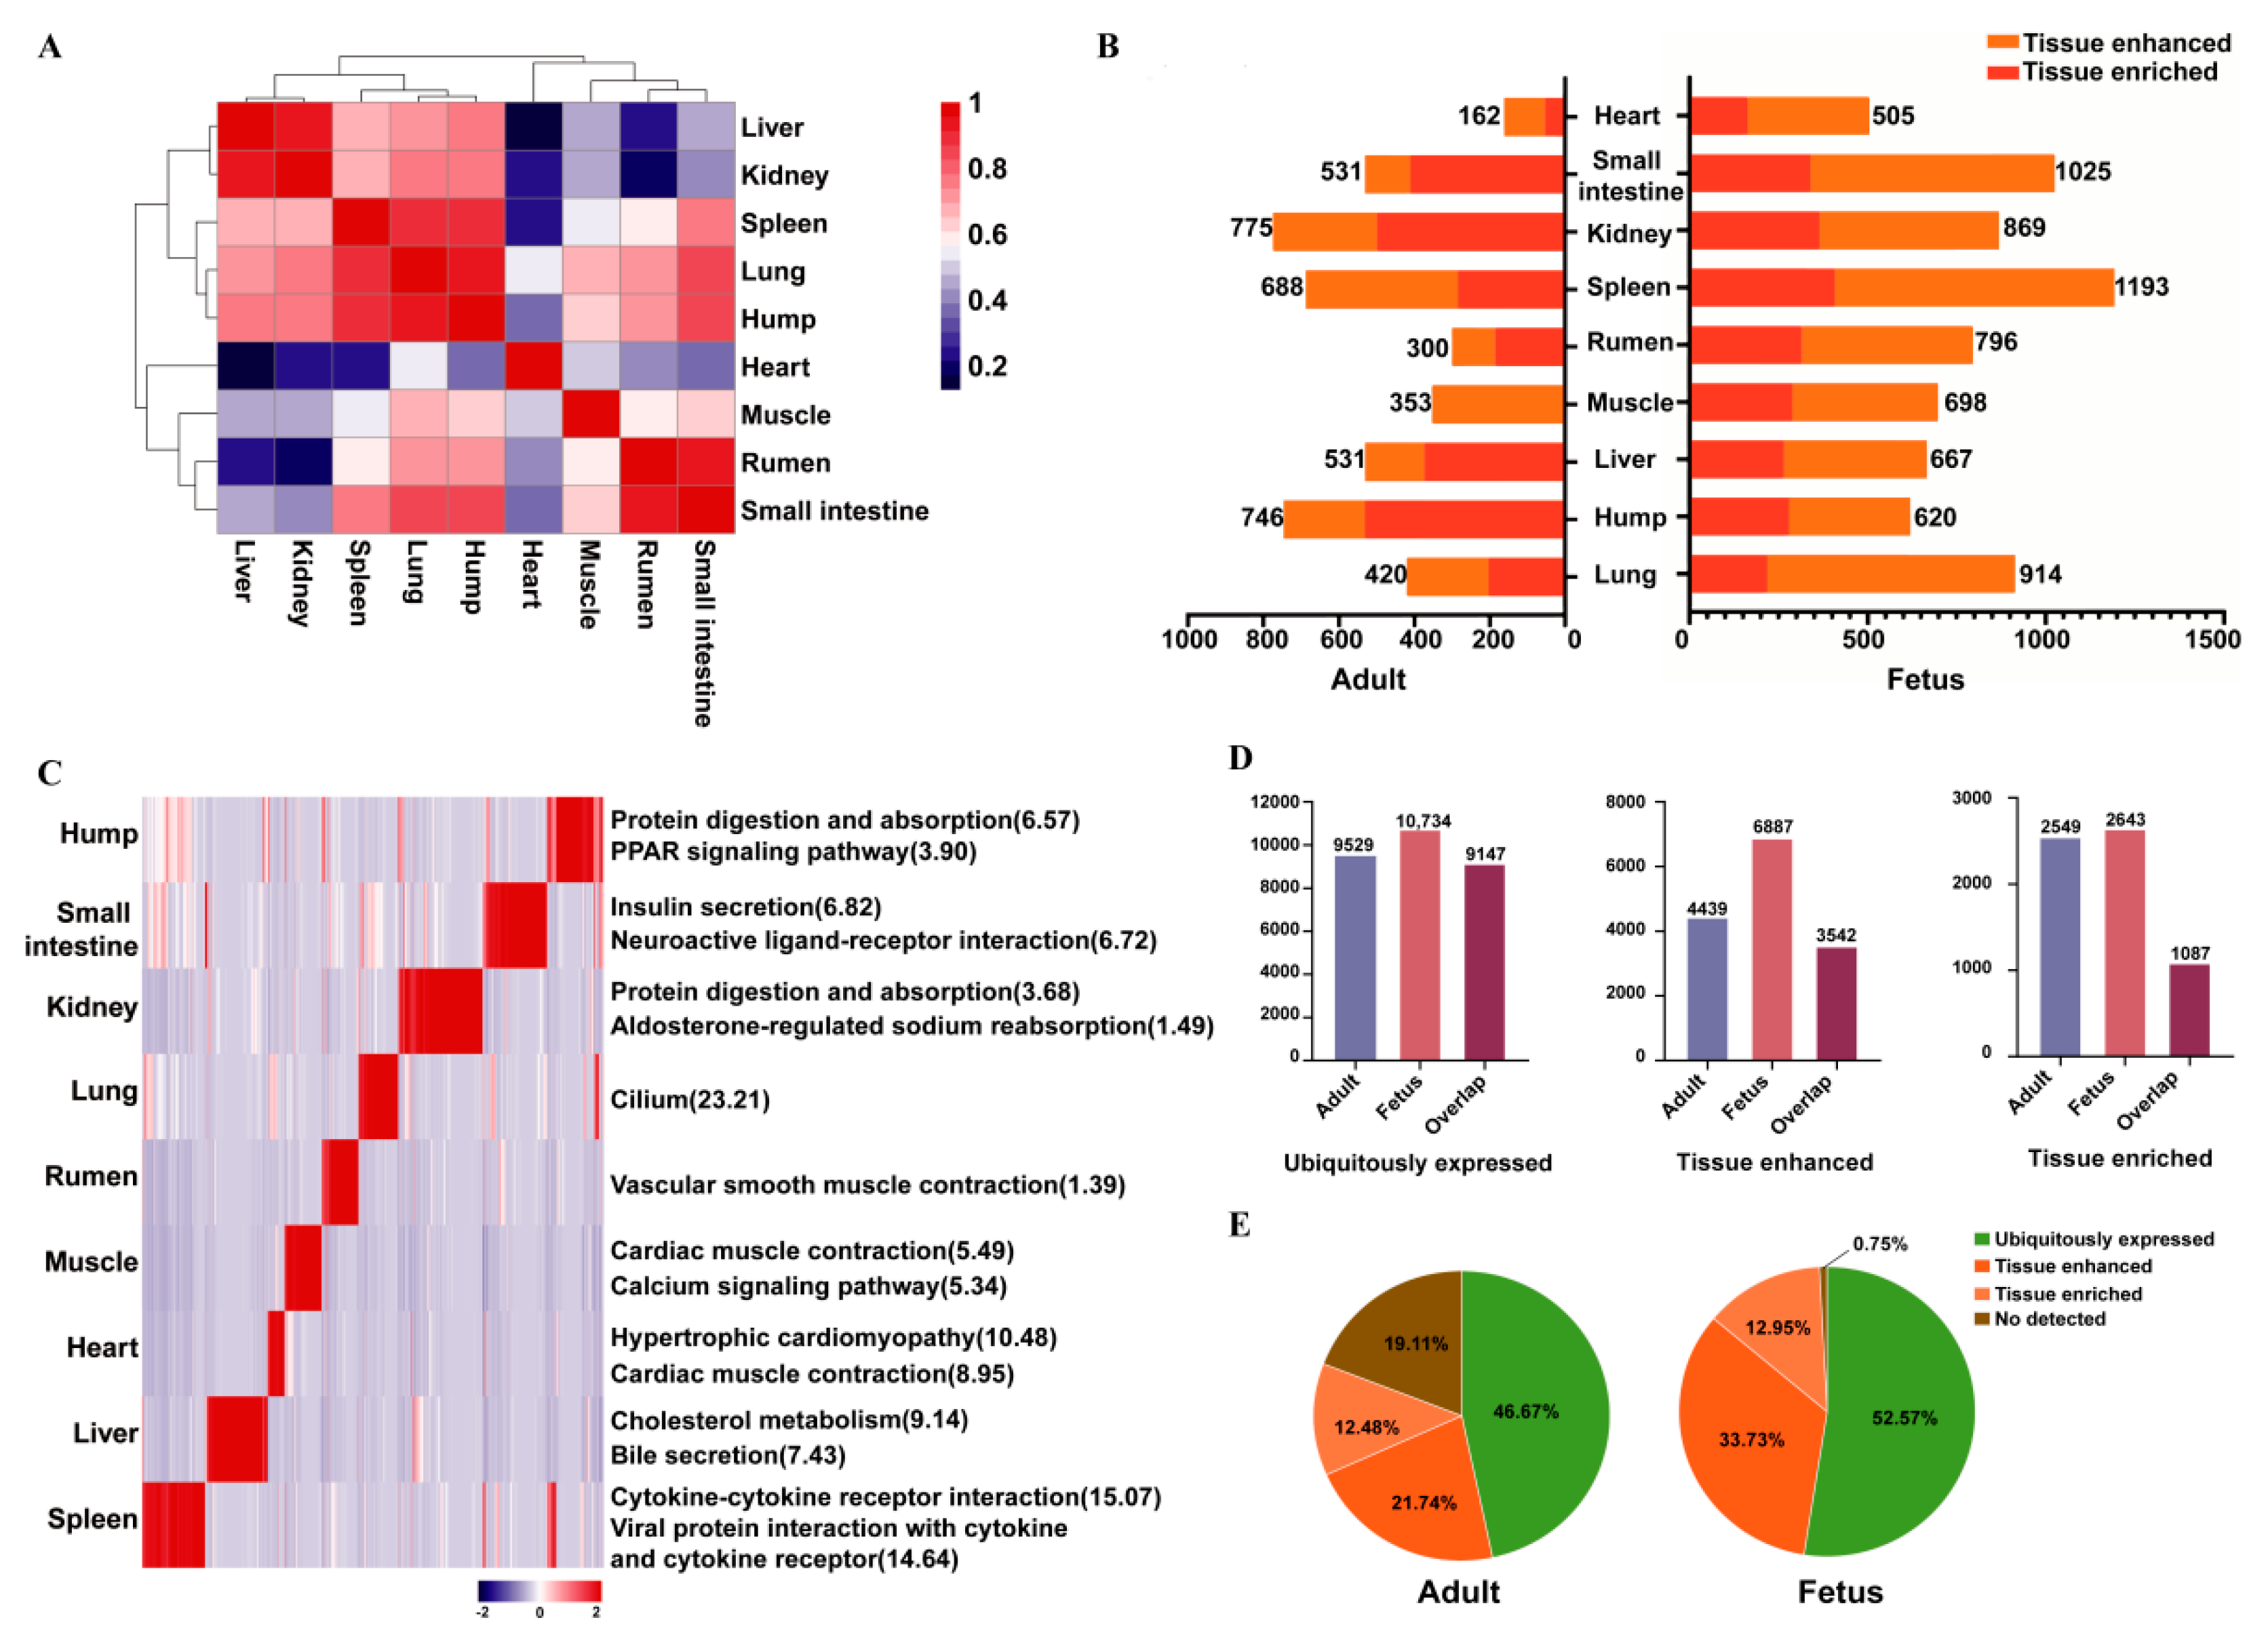
3.1. Identification and Characterizations of Coding RNAs

The mRNA expression in the heart and skeletal muscle, liver, spleen, lung, kidney, hump, rumen, and small intestine of fetuses (10 months of gestation) and castrated adult males (10 years old) of Bactrian camels was profiled by high-throughput sequencing using an Illumina NovaSeq 6000 RNA-Seq platform. Fifty-four samples (three biological replicates of each tissue/organ) were sequenced. A total of 2.40 billion reads of 150 bp paired-end RNA sequences were generated, corresponding to an average of 44.6 million sequence reads per sample. The reads were mapped to a reference genome (Ca_bactrianus_MBC_1.0). On average, 74.6% (71.0–86.7%) of the reads were mapped to genomic regions (Table S1). Contigs were assembled into transcripts using Cufflinks version 2.2.1 and transcript levels were expressed as fragments per kilobase of exon model per million mapped reads (FPKM). A total of 20,417 coding genes were detected in the analyzed tissues (Figure 1D,E, Table S2). Global gene expression was profiled by calculating Pearson correlation coefficients of expression levels between tissues and creating heatmaps. The results revealed the presence of three gene clusters in adults: digestive tissues (rumen and small intestine), muscle tissues (heart and skeletal muscle), and metabolic tissues (liver and kidney) (Figure 1A). However, this pattern was not observed in fetal samples (Figure S1A).

3.2. Classification of Protein-Coding Genes Based on Tissue Levels

To profile gene expression in each tissue, the genes of fetal and adult samples were classified into “ubiquitously expressed” (expressed in all tissues) [28] and “tissue-elevated” as described previously [22,29]. Tissue-elevated genes were further subdivided into “tissue-enriched” (5-fold higher than any other tissue) and “tissue-enhanced” (5-fold higher than the average). A total of 9529 (46.67%) and 10,734 (52.57%) genes were ubiquitously expressed in adults and fetuses, respectively. Of these, 9147 were co-expressed, accounting for 96.0% and 85.2% of ubiquitously expressed genes in adult and fetal tissues. Gene Ontology (GO) and the Kyoto Encyclopedia of Genes and Genomes (KEGG) pathway enrichment analyses showed that these co-expressed genes were enriched in protein processing in the endoplasmic reticulum, ubiquitin-mediated proteolysis, autophagy, and ribosome pathways. In adults, 4487 genes (21.98%) were tissue-elevated genes, of which 2549 and 4439 were tissue-enriched genes and tissue-enhanced genes, respectively. In fetuses, 33.74% of genes were tissue-elevated genes, of which 2643 and 6887 were tissue-enriched genes and tissue-enhanced genes, respectively (Figure 1E, Table S2). Interestingly, a total of 2448 more tissue-elevated genes were expressed in fetuses than adults, owing to more tissue-enhanced genes in fetuses (6887 genes) than in adults (4439 genes) (Figure 1E, Table S2). A total of 1087 and 3542 tissue-enriched genes and tissue-enhanced genes, respectively, overlapped between adults and fetuses.
In adults, further investigation revealed the largest number (n = 775) of tissue-elevated genes in the kidney, followed by, hump (n = 746), spleen (n = 688), small intestine (n = 531), liver (n = 531), lung (n = 420), skeletal muscle (n = 353), rumen (n = 300), and heart muscle (n = 162) (Figure 1B). Expression profiling revealed that the tissue-elevated genes were tissue-specific. GO and KEGG analyses showed that these genes were enriched in terms and pathways associated with the biological functions of the respective tissue (Figure 1C). For instance, genes in the kidneys were enriched in protein digestion and absorption and aldosterone-regulated sodium reabsorption; genes in the spleen were enriched in cytokine–cytokine receptor interaction and viral protein interaction with cytokine and cytokine receptors. Genes in the small intestine were enriched in insulin secretion and neuroactive ligand–receptor interaction, and genes in the liver-encoded proteins involved in cholesterol metabolism and bile secretion. Interestingly, genes in the hump were enriched in protein digestion and absorption, peroxisome proliferator-activated receptor (PPAR) signaling, and immune processes. In fetal samples, the number of tissue-elevated genes ranged from 505 (heart muscle) to 1193 (spleen) (Figure 1B). Expression profiling revealed that these genes were tissue-specific and GO and KEGG analyses revealed that these genes were enriched in processes and pathways related to the biological function of the analyzed tissues (Figure S1B).

3.3. Weighted Gene Co-Expression Network Analysis

To elucidate the dynamics of mRNA expression in adult tissues, the expression patterns of genes were clustered using weighted gene co-expression network analysis (WGCNA). After removing outliers, 11,548 genes with FPKM > 3 in 26 adult tissues samples were selected for WGCNA analysis. Samples were hierarchically clustered based on gene expression levels using the hclust package in R. The results revealed that digestive organs (small intestine and rumen) clustered independently from other tissues, and heart and skeletal muscle clustered together (Figure S2A). The optimum soft thresholding power β to build the co-expression network was 16. Fifteen of the thirty-one modules were identified by hierarchical clustering. A correlation analysis between co-expression modules and desert adaptation traits showed that four modules were significantly correlated with these traits (Figure 2A). The light yellow (1390 genes), blue (747 genes), dark orange (184 genes), and black (2530 genes) modules were strongly associated with fat metabolism in the liver, water balance in the kidney, immunity in the spleen, and digestion in the rumen of Bactrian camels, respectively (Table S3).
We performed a KEGG pathway analysis of four highly correlated module genes that overlapped with tissue-elevated genes in the liver, kidney, spleen, and rumen (Table S4, Figure S4). A total of 301 genes in the light yellow module overlapped with liver tissue-elevated genes and were enriched in metabolic pathways, PPAR signaling, cholesterol metabolism, bile secretion, and fat digestion and absorption (Figure 2C); 195 genes in the blue module overlapped with kidney tissue-elevated genes and were associated with metabolic pathways, aldosterone-regulated sodium reabsorption, and protein digestion and absorption (Figure S4B); 49 genes in the dark orange module overlapped with spleen tissue-elevated genes and were implicated in cell adhesion and rheumatoid arthritis (Figure S4D); and 76 genes in the blue module overlapped with rumen tissue-elevated genes, which were involved in vascular smooth muscle contraction (Figure S4F).
The hub genes ATPase copper transporting beta (ATP7B), oxidative stress-induced growth inhibitor 1 (OSGIN1), ELOVL fatty acid elongase 2 (ELOVL2), protein C, inactivator of coagulation factors Va and VIIIa (PROC), apolipoprotein A1 (APOA1), and APOBEC1 complementation factor (A1CF) in the light yellow module, were significantly correlated with fat metabolism (Figure 2A). Furthermore, transmembrane protein 174 (TMEM174), gamma-glutamylamine cyclotransferase (GGACT), and solute carrier family 16 member 4 (SLC16A4) in the blue module; membrane spanning 4-domains A2 (MS4A2), glycerophosphodiester phosphodiesterase domain containing 2 (GDPD2), C-X-C motif chemokine ligand 12 (CXCL12), and SLAM family member 7 (SLAMF7) in the dark orange module; and myosin light chain 9 (MYL9), calponin 1 (CNN1), mitogen-activated protein kinase 4 (MAPK4), MAS-related GPR family member F (MRGPRF), and protein phosphatase 1 regulatory subunit 12C (PPP1R12C) in the black module might play roles in water balance, immune function, and digestion in Bactrian camels (Figure S4A,C,E).
In fetal tissues, 12 of 31 modules were identified by hierarchical clustering. Four modules—salmon (447 genes), turquoise (841 genes), dark gray (470 genes), and dark orange (613 genes)—were significantly correlated with adaptation to desert environments (Figure S3A, Table S5). In addition, 111, 225, 231, and 189 genes in the salmon, turquoise, dark gray, and dark orange modules were associated with fat metabolism in the hump, water balance in the kidneys, immunity in the spleen, and digestion in the rumen, respectively (Table S6). The results showed that the enriched KEGG pathways were related to the biological functions of the corresponding tissue (Figure S3C; Figure S5B,D,F). Genes in the salmon module that overlapped with tissue-elevated hump genes were enriched in pathways associated with lipid metabolism, including PPAR and AMP-activated protein kinase (AMPK) signaling. Moreover, the hub genes fatty acid-binding protein 4 (FABP4) and peroxisome proliferator-activated receptor gamma (PPARγ) in the salmon module; solute carrier family 16 member 4 (SLC16A4), potassium inwardly rectifying channel subfamily J member 16 (KCNJ16), and LOC105066483 in the turquoise module; regulator of G protein signaling 18 (RGS18) in the dark gray module; alpha-2-macroglobulin like 1 (A2ML1), keratin 78 (KRT78), involucrin (IVL), and LOC105068226 in the dark orange module were associated with fat metabolism, water balance, immune function, and digestion in fetuses, respectively (Figure S3B; Figure S5A,C,E).

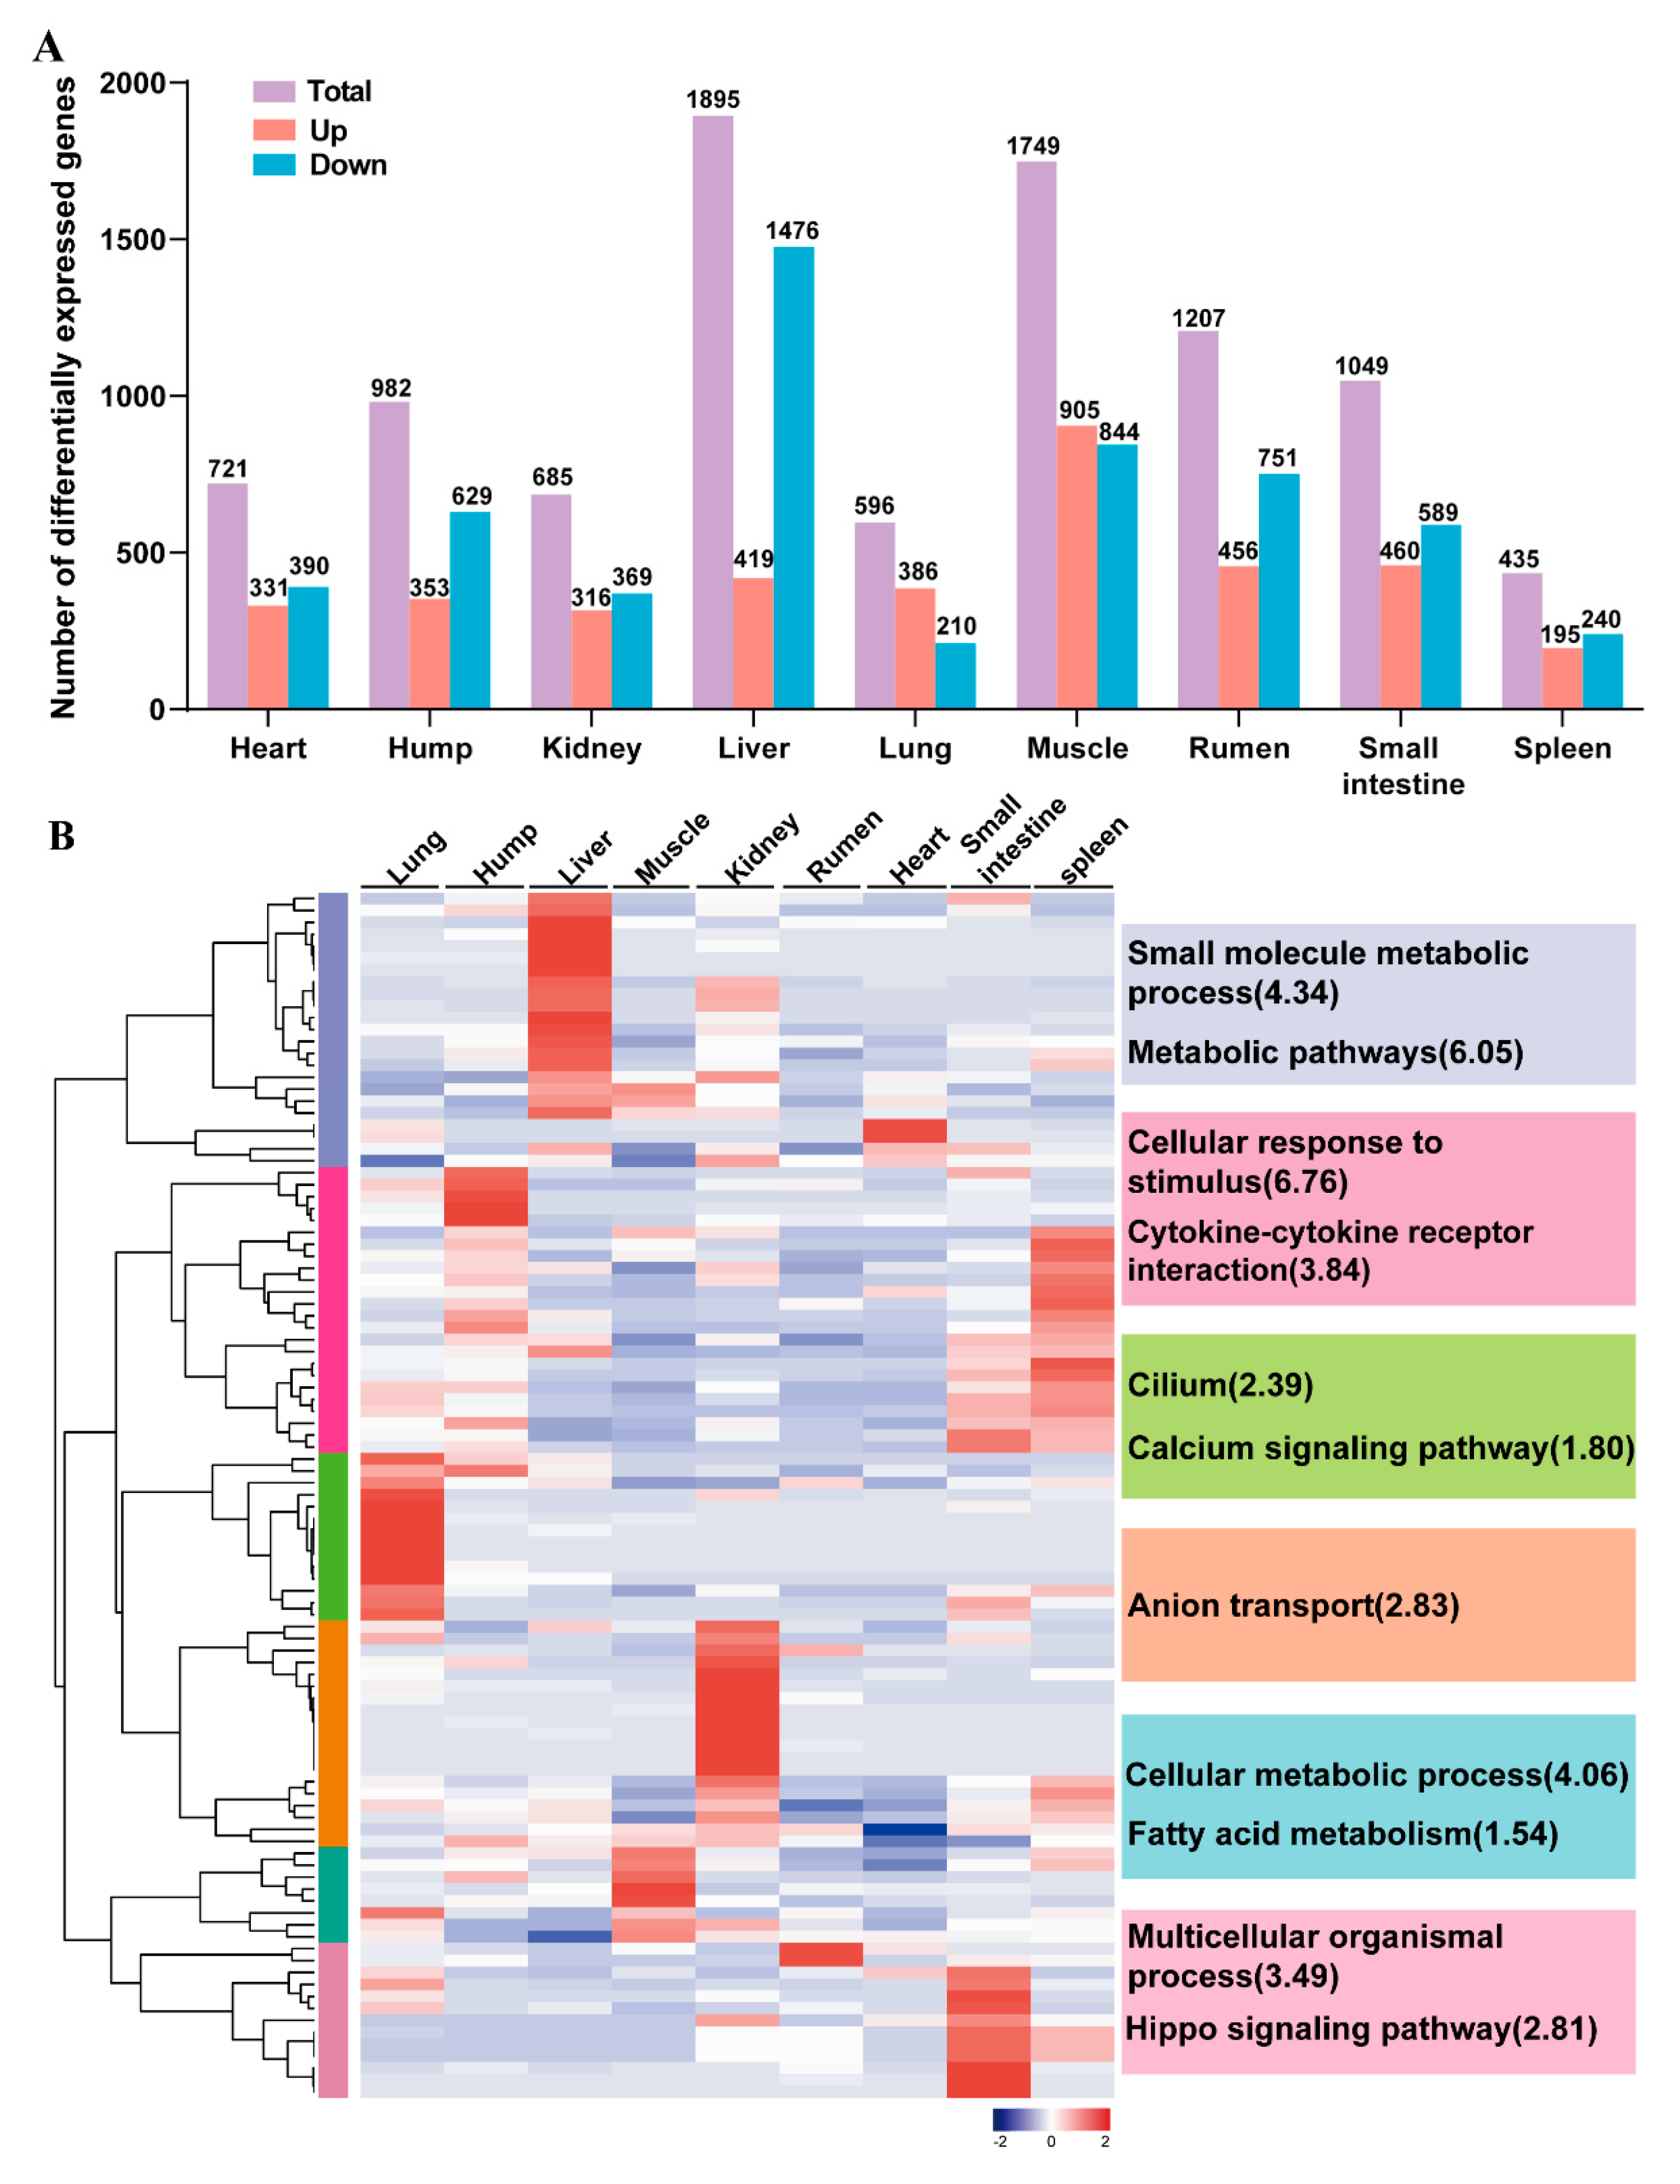
3.4. Development-Dependent Genes in Nine tissues

To identify candidate genes associated with tissues development in Bactrian camel, we investigated gene expression and identified the differentially expressed genes (DEGs) between adult and fetal tissues were analyzed to identify development-related genes. A total of 9319 DEGs were identified in adult tissues and the number of DEGs varied from 1895 in the liver to 435 in the spleen. The number of downregulated genes was higher than that of upregulated genes in all adult tissues, except the lung and skeletal muscle (Figure 3A). In addition, GO and KEGG analyses demonstrated that downregulated genes were enriched in the regulation of developmental processes, including animal organ development, regulation of developmental process, and multicellular organism development (Table S7).
Upregulated genes were enriched in lipid metabolic processes, fatty acid catabolic processes, and small-molecule metabolic process in the liver; carbonate dehydratase activity, organic anion transport, and small-molecule metabolic processes in the kidneys; protein binding, cellular polysaccharide metabolic processes, and glucan biosynthetic processes in the rumen; multicellular organism development, secretory processes, and positive regulation of multicellular organismal processes in the small intestine; nucleotide binding, small-molecule binding, and myofibrillary development in skeletal muscle. Interestingly, we identified immune-related processes in the upregulated genes of hump, including immune response, leukocyte and lymphocyte differentiation, and immune response regulation.
Meanwhile, we overlapped the gene sets from three different analyses: DEGs between fetal and adult tissues, tissue-elevated genes in all adult tissues from gene classification analysis and a positively selected gene set from a comparative genome analysis of Bactrian camel and cattle [19]. A total of 101 overlapping genes were grouped into 6 clusters by hierarchical cluster analysis (Table S8). The results showed that the expression pattern was tissue-specific. The highly expressed genes in these clusters were enriched in small-molecule metabolic processes and metabolic pathways in the liver and cilium and calcium signaling in the lungs (Figure 3B). The highly expressed genes in the hump and spleen were grouped into cluster III and were enriched in immune stimuli processes and cytokine–cytokine receptor interactions pathways.

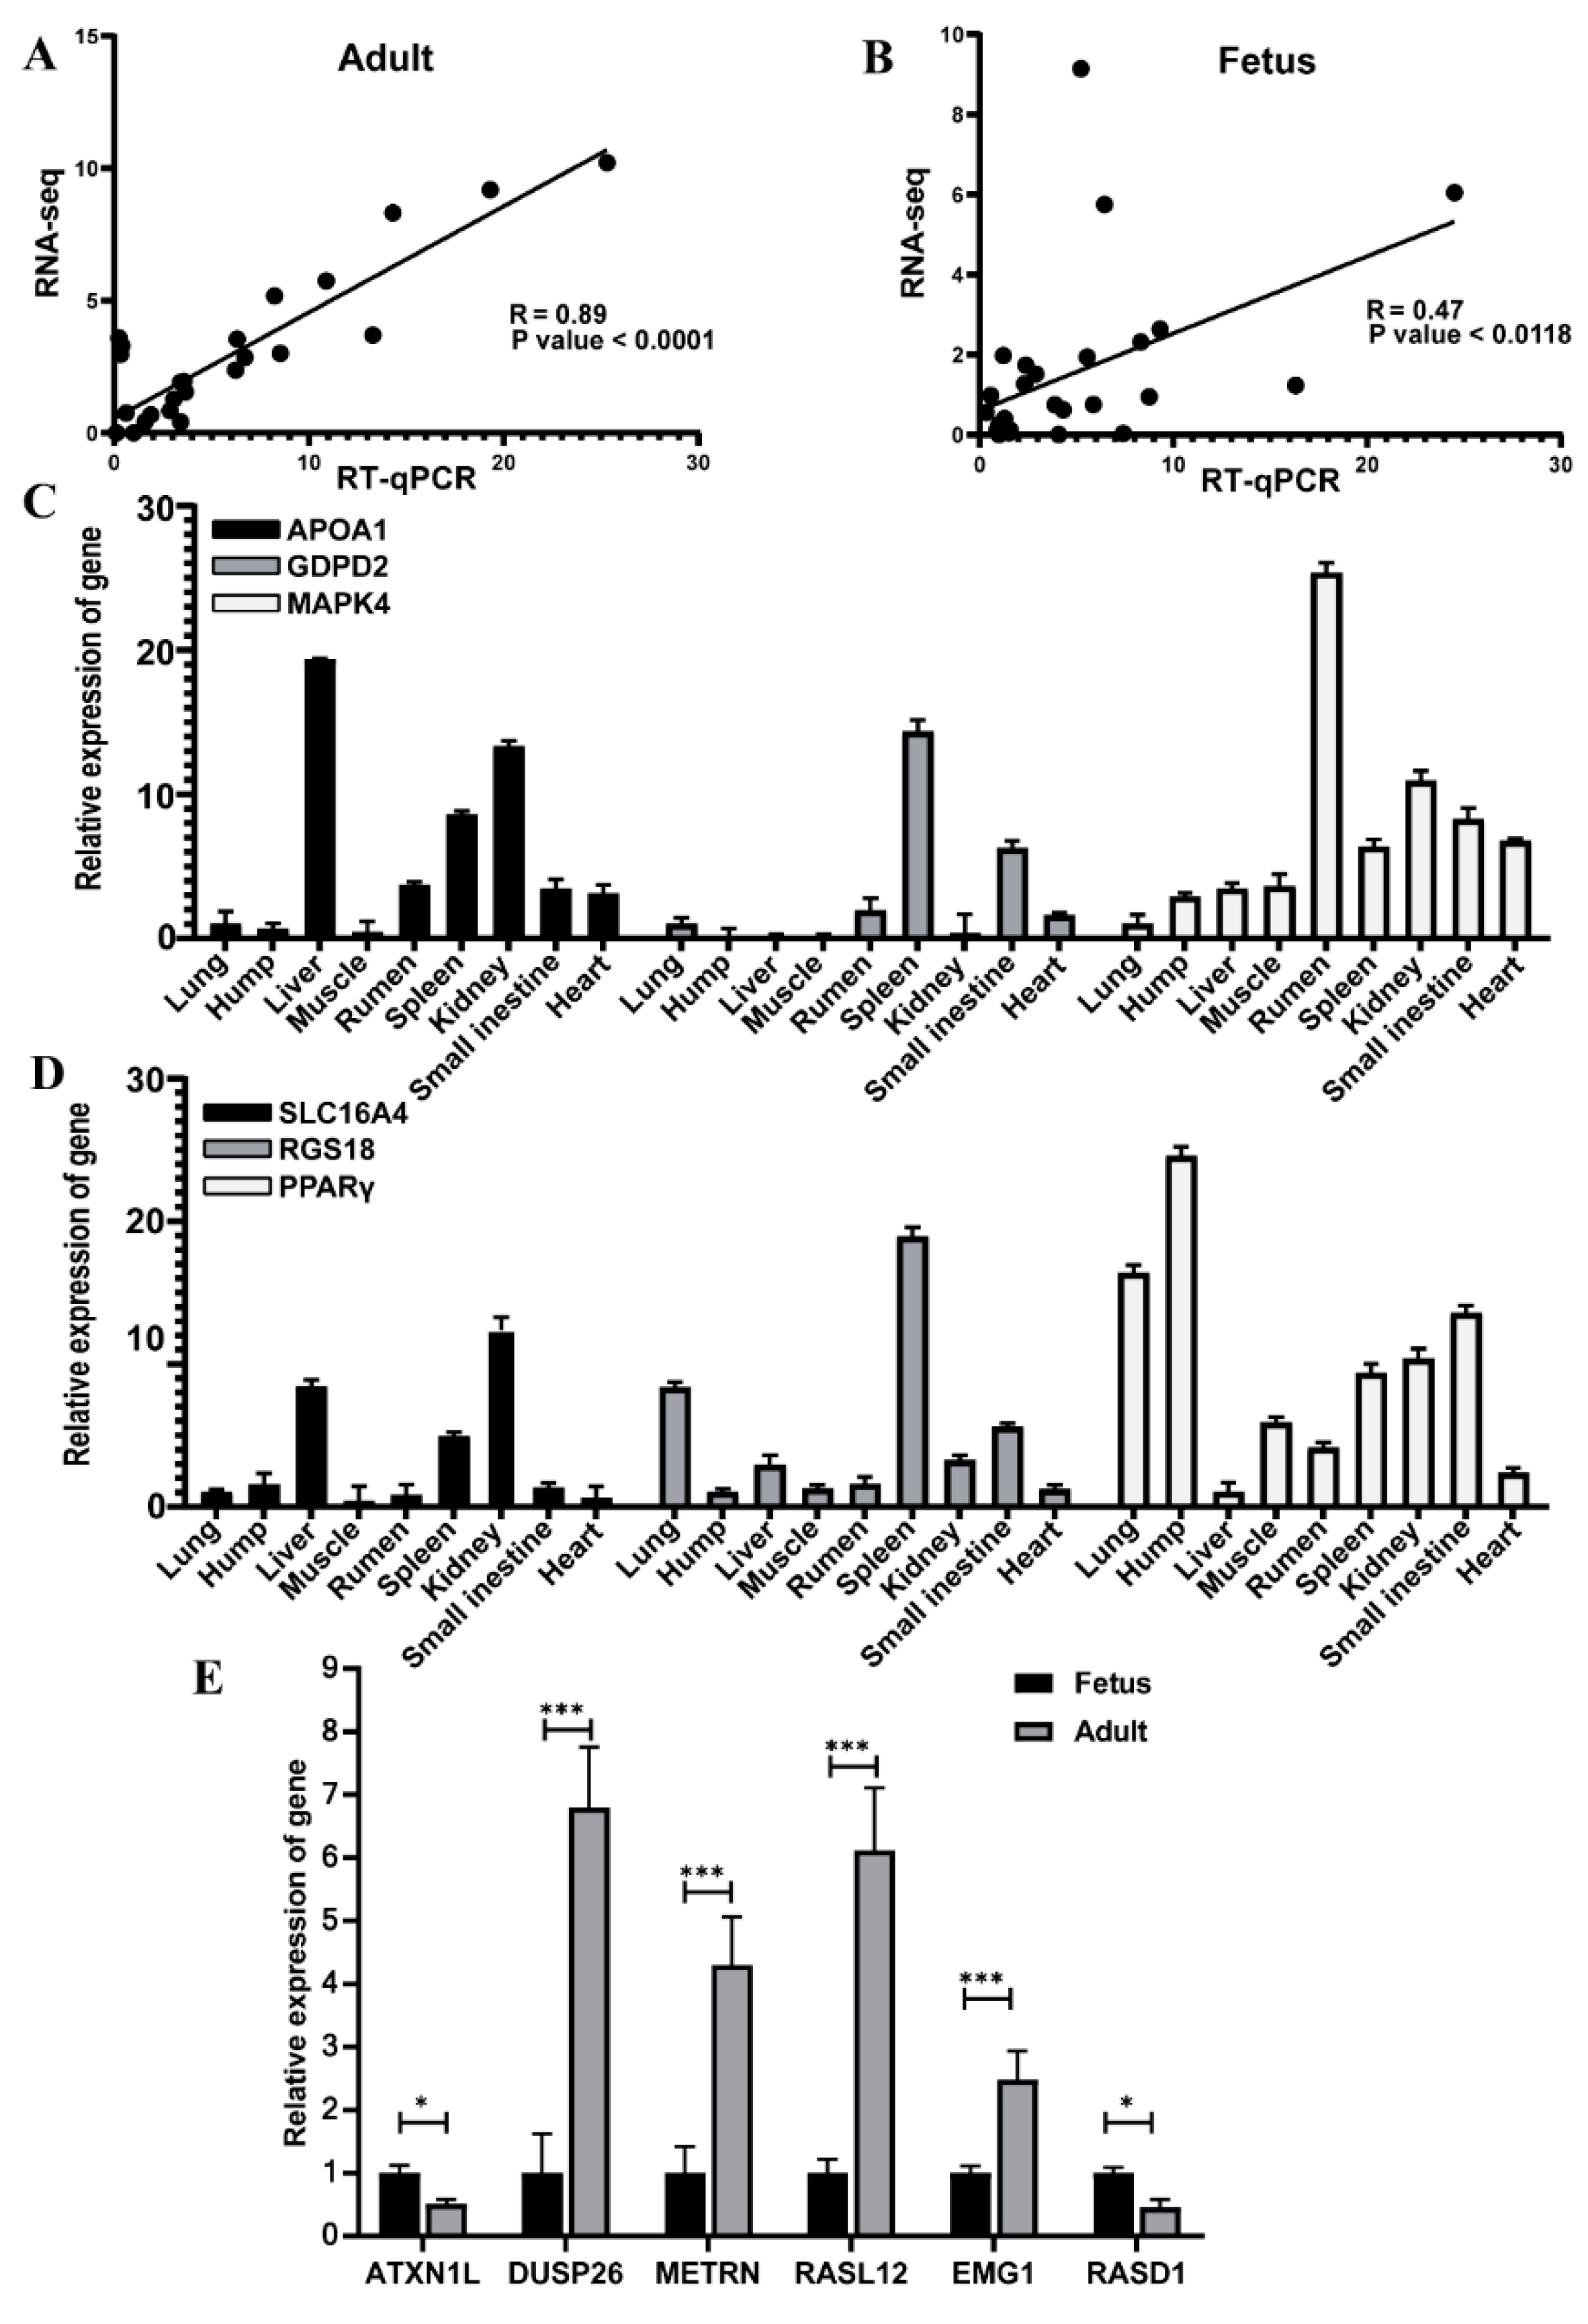
3.5. Validation of RNA-Seq Data by Quantitative Real-Time Polymerase chain Reaction (qRT-PCR)

Six DEGs—ataxin 1 like (ATXN1L), dual-specificity phosphatase 26 (DUSP26), meteorin, glial cell differentiation regulator (METRN), RAS-like family 12 (RASL12), EMG1 N1-specific pseudouridine methyltransferase (EMG1), and dexamethasone-induced Ras-related protein 1 (RASD1)—were analyzed in the rumen of adults and fetuses by qRT-PCR to validate the reproducibility and repeatability of RNA-Seq (Figure 4E). The results showed that these genes were significantly differentially expressed in this tissue. Moreover, the relative expression of six randomly selected hub genes—APOA1, GDPD2, MAPK4, SLC16A4, RGS18, and PPARγ—was measured by qRT-PCR in six tissues (Figure 4C,D). APOA1, GDPD2, and MAPK4 were highly expressed in the liver, spleen, and rumen of adults, whereas SLC16A4, RGS18, and PPARγ were strongly expressed in the kidney, spleen, and hump of fetuses, respectively. The concordance between RNA-Seq and RT-qPCR results was measured by Pearson correlation analysis. There was a high concordance between these methods in adult tissues (R = 0.89, p < 0.0001) and fetal tissues (R = 0.47, p < 0.0118) (Figure 4A,B).

4. Discussion

The construction of the atlas of the human [30,31,32], mouse [33,34], cattle [3,35], sheep [36], and pig [2] transcriptome provides a comprehensive platform for analyzing the relationship between the expression, organization, and function of genes. This study investigated the transcriptome of the Bactrian camel by constructing an RNA-Seq atlas of nine tissues from fetuses and adults. The results revealed that the tissues with similar functions—small intestine and rumen; heart and skeletal muscle; and liver and kidney—presented similar gene expression patterns, consistent with previous results in humans [22], sheep [36], and yak (Bos grunniens) [37], suggesting that the tissue gene expression profiles of Bactrian camels are similar to those of other domestic animals [38].
The gene classification method proposed by Uhlen et al. [29] was used in this study. The expressed genes were classified as ubiquitously expressed and tissue-elevated, and the term “tissue-specific” was avoided as it depends on the definition of cutoff values. The proportion of ubiquitously expressed genes and tissue-elevated genes in adult camels was similar to that in humans [29]. Furthermore, tissue-elevated genes were enriched in terms and pathways related to the biological functions of the corresponding tissue in adults. For instance, liver tissue-elevated genes were enriched in small-molecule metabolism, lipid metabolism, cholesterol metabolism, and bile secretion in pigs [39], chickens [40], and mice [41]. Spleen tissue-elevated genes were enriched in immune system regulation, cytokine–cytokine receptor interactions, and viral protein interaction with cytokine and cytokine receptors in chickens [42,43], pigs [44], and goats [45].
Human and mice studies have revealed that adipose tissue is involved in endocrine functions [46] and innate immune control [47,48,49]. A transcriptome study showed that genes in the hump of Bactrian camels were more enriched in immune-related pathways than in other adipose tissues [16]. In our study, hump samples had the second highest number of tissue-elevated genes among all adult tissues. In turn, the number of tissue-elevated genes was comparatively lower in human adipose tissue [22]. Previous studies showed that hump tissue-elevated genes were enriched in PPAR signaling, fatty acid metabolism, regulation of lipolysis in adipocytes, and fatty acid biosynthesis in cows [50] and goats [51,52,53]. In our analysis, hump samples were also enriched in immune system development, chemotaxis, and the regulation of the inflammatory response, suggesting that this tissue is involved in immunity.
The sets of hub genes identified by WGCNA analysis are potentially implicated in regulating fat metabolism, water balance, immunity, and digestion in response to desert environmental stresses. For instance, hub genes APOA1, A1CF, ATP7B, and ELOVL2 significantly correlate with fat metabolism in adult animals. Previous studies have shown that these genes are involved in liver fat metabolism and glucose metabolism. APOA1 plays a vital role in lipoprotein pathways [54]; reverse cholesterol transport [55,56]; and HDL synthesis, maturation, conversion, and catabolism [57]. A1CF is implicated in hepatic fructose and glycerol metabolism [58] and hepatic steatosis [59]. ATP7B is involved in copper homeostasis in the liver [60], and ELOVL2 is associated with the synthesis of long-chain polyunsaturated fatty acids [61] and docosahexaenoic acid (DHA) [62]. TMEM174 is highly expressed in the human kidney and is implicated in water balance by increasing the transcription of AP-1 and promoting renal cell proliferation [63]. The hub gene CXCL12 is linked with immunity and inflammation and is indispensable for lymphopoiesis [64,65,66,67,68]. MYL9 and PPP1R12C are implicated in skeletal muscle growth and development [69] and regulation of the actin cytoskeleton [70]. In our study, these hub genes were highly expressed in the liver, kidney, spleen, and rumen, suggesting a role in the adaptation to desert environments.
The analysis of DEGs between fetuses and adults allows screening for development-associated genes. Our results showed that downregulated DEGs in adult camels were enriched in the regulation of developmental processes, whereas upregulated genes were enriched in processes and pathways related to the biological functions of the corresponding tissue. For instance, upregulated genes in the kidneys were enriched in carbonate dehydratase activity, small-molecule metabolism, and organic anion transport—implicated in osmotic and salt stress—in rabbits [71] and teleost fishes [72]. In addition, upregulated genes in the hump tissue of adult camels were enriched in immune response regulation and leukocyte and lymphocyte differentiation. Consistent with this finding, Guo et al. found that upregulated DEGs in the hump were enriched in immune pathways [16].
We overlapped the results of 3 different analyses—DEGs from 9 tissues, tissue-elevated genes in adult tissues, and a gene set [19]—and grouped 101 co-expression genes into 6 clusters. The co-expressed genes in each cluster were enriched in processes and pathways related to the biological functions of the corresponding tissue, and some of these genes might be related to tissue development and function, including C-X3-C motif chemokine receptor 1 (CX3CR1) and TNF superfamily member 11 (TNFSF11) in the hump and spleen; homogentisate 1,2-dioxygenase (HGD) and kynureninase (KYNU) in the liver; dynein axonemal intermediate chain 2 (DNAI2) and cysteinyl leukotriene receptor 2 (CYSLTR2) in the lungs; and solute carrier family 13 member 3 (SLC13A3) and secreted phosphoprotein 1 (SPP1) in the kidneys. CX3CL1 belongs to the CX3C subgroup of chemokines [73] and mediates the chemotaxis and adhesion of inflammatory cells through CX3CR1 [74,75]. TNFSF11 (TRANCE/RNAKL) regulates T cell-mediated immune responses [76,77]. HGD is expressed in the human liver, kidney, and small intestine [78] and plays a role in the metabolism of tyrosine [79]. CysLTR2, a member of the G protein receptor family, is expressed in the spleen and peripheral blood leukocytes, lung smooth muscle cells, and alveolar macrophages [80,81] and is associated with asthma in humans [82]. SLC13A3, which encodes plasma membrane Na+/dicarboxylate cotransporter 3 [83], is expressed on the basolateral membrane of human renal proximal tubular epithelia [84] and is associated with Na+/S cotransport [85]. These data demonstrate the potential role of these genes in tissue development and environmental stress adaptation in Bactrian camels. Nonetheless, future studies are necessary to assess the function of these genes.

5. Conclusions

Our findings indicated that tissues with similar functions present similar gene expression patterns. Approximately 50% of the identified genes were ubiquitously expressed, and one-third were tissue-elevated genes, which were enriched in pathways related to the biological functions of the corresponding tissue. WGCNA identified four modules and several hub genes. Upregulated DEGs were enriched in biological function items and pathways of the corresponding tissue in adult camels. As desert-adapted mammals, Bactrian camels are an excellent model to assess the correlation between gene expression and physiological adaptations to environmental stressors.

Supplementary Materials

The following supporting information can be downloaded at: https://www.mdpi.com/article/10.3390/agriculture12070958/s1, Figure S1: Classification of protein-coding genes in Bactrian camels; Figure S2: Cluster map of adult tissues based on weighted gene co-expression network analysis (WGCNA); Figure S3: Weighted gene co-expression network analysis (WGCNA) of genes associated with adaptation to desert environments in fetal camels; Figure S4: Weighted gene co-expression network analysis (WGCNA) of genes associated with adaptation to desert environments in adult camels; Figure S5: Weighted gene co-expression network analysis (WGCNA) of genes associated with adaptation to desert environments in fetal camels. Table S1: Quality analysis and genome mapping analysis of transcriptome sequencing; Table S2: Classification of all Bactrian camel protein-coding genes based on transcript expression levels in 9 tissues; Table S3: Modules associated with desert adaptation traits in adult camels; Table S4: Overlapping genes of four highly related modules and tissue-elevated genes in adult camels; Table S5: Modules associated with desert adaptation traits in fetal camels; Table S6: Overlapping genes of four highly correlated module genes and tissue-elevated genes in fetal camels; Table S7: GO and KEGG analyses; Table S8: Expression levels and classification of the 101 co-expressed genes; Table S9: Primer pairs of hub genes used for qRT-PCR validation.

Author Contributions

Conceptualization, X.H.; methodology, X.H., Y.L., L.J. and Y.F.; software, Y.L. and Y.F.; validation, Y.F. and S.W.; formal analysis, Y.L. and Y.F.; investigation, Y.P. and Q.Z.; resources, J.Z. and Y.P.; writing—original draft preparation, Y.L., Y.F. and X.H.; writing—review and editing, X.H., Y.M. and L.J.; visualization, Y.L. and Y.F.; supervision, X.H.; project administration, Y.M., L.J. and X.H. All authors have read and agreed to the published version of the manuscript.

Funding

This research was funded by the Agricultural Science and Technology Innovation Program of China (Grant No. ASTIP-IAS01) and the National Germplasm Center of Domestic Animals Resources.

Institutional Review Board Statement

The animal study protocol was approved by Animal Care Committee of the Beijing Academy of Agricultural Sciences (IAS2019-58 dated 17.10.2019).

Informed Consent Statement

Not applicable.

Data Availability Statement

All raw data generated in this study were submitted to the National Center for Biotechnology Information Sequence Read Archive (NCBI SRA) database under BioProject No. PRJNA857334. Available online: https://dataview.ncbi.nlm.nih.gov/object/PRJNA857334 (accessed on 10 July 2022).

Acknowledgments

We thank Qiang Zhang from Bactrian Camel Institute of Alsha, Inner Mongolia for sample collections.

Conflicts of Interest

The authors declare no conflict of interest.

References

  1. Stark, R.; Grzelak, M.; Hadfield, J. RNA sequencing: The teenage years. Nat. Rev. Genet. 2019, 20, 631–656. [Google Scholar] [CrossRef] [PubMed]
  2. Freeman, T.C.; Ivens, A.; Baillie, J.K.; Beraldi, D.; Barnett, M.W.; Dorward, D.; Downing, A.; Fairbairn, L.; Kapetanovic, R.; Raza, S.; et al. A gene expression atlas of the domestic pig. BMC Biol. 2012, 10, 90. [Google Scholar] [CrossRef] [PubMed] [Green Version]
  3. Harhay, G.P.; Smith, T.P.; Alexander, L.J.; Haudenschild, C.D.; Keele, J.W.; Matukumalli, L.K.; Schroeder, S.G.; Van Tassell, C.P.; Gresham, C.R.; Bridges, S.M.; et al. An atlas of bovine gene expression reveals novel distinctive tissue characteristics and evidence for improving genome annotation. Genome Biol. 2010, 11, R102. [Google Scholar] [CrossRef] [PubMed] [Green Version]
  4. Su, A.I.; Wiltshire, T.; Batalov, S.; Lapp, H.; Ching, K.A.; Block, D.; Zhang, J.; Soden, R.; Hayakawa, M.; Kreiman, G.; et al. A gene atlas of the mouse and human protein-encoding transcriptomes. Proc. Natl. Acad. Sci. USA 2004, 101, 6062–6067. [Google Scholar] [CrossRef] [Green Version]
  5. Yu, Y.; Fuscoe, J.C.; Zhao, C.; Guo, C.; Jia, M.; Qing, T.; Bannon, D.I.; Lancashire, L.; Bao, W.; Du, T.; et al. A rat RNA-Seq transcriptomic BodyMap across 11 organs and 4 developmental stages. Nat. Commun. 2014, 5, 3230. [Google Scholar] [CrossRef]
  6. Andersson, R.; Gebhard, C.; Miguel-Escalada, I.; Hoof, I.; Bornholdt, J.; Boyd, M.; Chen, Y.; Zhao, X.; Schmidl, C.; Suzuki, T.; et al. An atlas of active enhancers across human cell types and tissues. Nature 2014, 507, 455–461. [Google Scholar] [CrossRef]
  7. Brennan, A.; Leech, J.T.; Kad, N.M.; Mason, J.M. An Approach to Derive Functional Peptide Inhibitors of Transcription Factor Activity. JACS Au 2022, 2, 996–1006. [Google Scholar] [CrossRef]
  8. Alhaddad, H.; Maraqa, T.; Alabdulghafour, S.; Alaskar, H.; Alaqeely, R.; Almathen, F.; Alhajeri, B.H. Quality and quantity of dromedary camel DNA sampled from whole-blood, saliva, and tail-hair. PLoS ONE 2019, 14, e0211743. [Google Scholar] [CrossRef] [Green Version]
  9. Emmanuel, B.; Nahapetian, A. Fatty-Acid Composition of Depot Fats, and Rumen Wall of the Camel (Camelus-Dromedarius). Comp. Biochem. Phys. B 1980, 67, 701–704. [Google Scholar] [CrossRef]
  10. Schmidt-Nielsen, K. The Physiology of the Camel. Sci. Am. 1959, 201, 140–151. [Google Scholar] [CrossRef]
  11. Bactrian Camels Genome, S.; Analysis, C.; Wang, Z.; Ding, G.; Chen, G.; Sun, Y.; Sun, Z.; Zhang, H.; Wang, L.; Hasi, S.; et al. Genome sequences of wild and domestic bactrian camels. Nat. Commun. 2012, 3, 1202. [Google Scholar] [CrossRef]
  12. Ming, L.; Yuan, L.; Yi, L.; Ding, G.; Hasi, S.; Chen, G.; Jambl, T.; Hedayat-Evright, N.; Batmunkh, M.; Badmaevna, G.K.; et al. Whole-genome sequencing of 128 camels across Asia reveals origin and migration of domestic Bactrian camels. Commun. Biol. 2020, 3, 1. [Google Scholar] [CrossRef] [PubMed] [Green Version]
  13. Ali, M.A.; Abu Damir, H.; Ali, O.M.; Amir, N.; Tariq, S.; Greenwood, M.P.; Lin, P.; Gillard, B.; Murphy, D.; Adem, A. The effect of long-term dehydration and subsequent rehydration on markers of inflammation, oxidative stress and apoptosis in the camel kidney. BMC Veter Res. 2020, 16, 458. [Google Scholar] [CrossRef]
  14. Zhang, D.; Pan, J.; Cao, J.; Cao, Y.; Zhou, H. Screening of drought-resistance related genes and analysis of promising regulatory pathway in camel renal medulla. Genomics 2020, 112, 2633–2639. [Google Scholar] [CrossRef] [PubMed]
  15. Cao, Y.; Zhang, D.; Zhou, H. Key genes differential expressions and pathway involved in salt and water-deprivation stresses for renal cortex in camel. BMC Mol. Biol. 2019, 20, 11. [Google Scholar] [CrossRef] [PubMed]
  16. Guo, F.; Si, R.; He, J.; Yuan, L.; Hai, L.; Ming, L.; Yi, L.; Ji, R. Comprehensive transcriptome analysis of adipose tissue in the Bactrian camel reveals fore hump has more specific physiological functions in immune and endocrine systems. Livest. Sci. 2019, 228, 195–200. [Google Scholar] [CrossRef]
  17. Zhang, D.; Pan, J.; Zhou, H.; Cao, Y. Evidence from ileum and liver transcriptomes of resistance to high-salt and water-deprivation conditions in camel. Zool. Lett. 2020, 6, 8. [Google Scholar] [CrossRef]
  18. Hedayat-Evrigh, N.; Khalkhali-Evrigh, R.; Bakhtiarizadeh, M.R. Genome-Wide Identification and Analysis of Variants in Domestic and Wild Bactrian Camels Using Whole-Genome Sequencing Data. J. Genom. 2020, 2020, 2430846. [Google Scholar] [CrossRef]
  19. Wu, H.; Guang, X.; Al-Fageeh, M.B.; Cao, J.; Pan, S.; Zhou, H.; Zhang, L.; AbuTarboush, M.H.; Xing, Y.; Xie, Z.; et al. Camelid genomes reveal evolution and adaptation to desert environments. Nat. Commun. 2014, 5, 5188. [Google Scholar] [CrossRef] [Green Version]
  20. Trapnell, C.; Roberts, A.; Goff, L.; Pertea, G.; Kim, D.; Kelley, D.R.; Pimentel, H.; Salzberg, S.L.; Rinn, J.L.; Pachter, L. Differential gene and transcript expression analysis of RNA-seq experiments with TopHat and Cufflinks. Nat. Protoc. 2012, 7, 562–578. [Google Scholar] [CrossRef] [Green Version]
  21. Li, H.; Handsaker, B.; Wysoker, A.; Fennell, T.; Ruan, J.; Homer, N.; Marth, G.; Abecasis, G.; Durbin, R. 1000 Genome Project Data Processing Subgroup. The Sequence Alignment/Map format and SAMtools. Bioinformatics 2009, 25, 2078–2079. [Google Scholar] [CrossRef] [PubMed] [Green Version]
  22. Uhlén, M.; Fagerberg, L.; Hallström, B.M.; Lindskog, C.; Oksvold, P.; Mardinoglu, A.; Sivertsson, Å.; Kampf, C.; Sjöstedt, E.; Asplund, A.; et al. Tissue-Based Map of the Human Proteome. Science 2015, 347, 1260419. [Google Scholar] [CrossRef] [PubMed]
  23. Langfelder, P.; Horvath, S. WGCNA: An R package for weighted correlation network analysis. BMC Bioinform. 2008, 9, 559. [Google Scholar] [CrossRef] [Green Version]
  24. Langfelder, P.; Zhang, B.; Horvath, S. Defining clusters from a hierarchical cluster tree: The Dynamic Tree Cut package for R. Bioinformatics 2008, 24, 719–720. [Google Scholar] [CrossRef]
  25. Min, Y.; Kramer, E.M. Transcriptome profiling and weighted gene co-expression network analysis of early floral development in Aquilegia coerulea. Sci. Rep. 2020, 10, 19637. [Google Scholar] [CrossRef] [PubMed]
  26. Shannon, P.; Markiel, A.; Ozier, O.; Baliga, N.S.; Wang, J.T.; Ramage, D.; Amin, N.; Schwikowski, B.; Ideker, T. Cytoscape: A software environment for integrated models of Biomolecular Interaction Networks. Genome Res. 2003, 13, 2498–2504. [Google Scholar] [CrossRef] [PubMed]
  27. Reimand, J.; Arak, T.; Adler, P.; Kolberg, L.; Reisberg, S.; Peterson, H.; Vilo, J. g:Profiler—A web server for functional interpretation of gene lists (2016 update). Nucleic Acids Res. 2016, 44, W83–W89. [Google Scholar] [CrossRef]
  28. Hebenstreit, D.; Fang, M.; Gu, M.; Charoensawan, V.; Van Oudenaarden, A.; Teichmann, S. RNA sequencing reveals two major classes of gene expression levels in metazoan cells. Mol. Syst. Biol. 2011, 7, 497. [Google Scholar] [CrossRef] [Green Version]
  29. Uhlén, M.; Hallström, B.M.; Lindskog, C.; Mardinoglu, A.; Pontén, F.; Nielsen, J. Transcriptomics resources of human tissues and organs. Mol. Syst. Biol. 2016, 12, 862. [Google Scholar] [CrossRef]
  30. Hawrylycz, M.J.; Lein, E.S.; Guillozet-Bongaarts, A.L.; Shen, E.H.; Ng, L.; Miller, J.A.; Van De Lagemaat, L.N.; Smith, K.A.; Ebbert, A.; Riley, Z.L.; et al. An anatomically comprehensive atlas of the adult human brain transcriptome. Nature 2012, 489, 391–399. [Google Scholar] [CrossRef]
  31. Keen, J.C.; Moore, H.M. The Genotype-Tissue Expression (GTEx) Project: Linking Clinical Data with Molecular Analysis to Advance Personalized Medicine. J. Pers. Med. 2015, 5, 22–29. [Google Scholar] [CrossRef] [PubMed]
  32. Yu, N.Y.-L.; Hallström, B.M.; Fagerberg, L.; Ponten, F.; Kawaji, H.; Carninci, P.; Forrest, A.; The FANTOM consortium; Hayashizaki, Y.; Uhlen, M.; et al. Complementing tissue characterization by integrating transcriptome profiling from the Human Protein Atlas and from the FANTOM5 consortium. Nucleic Acids Res. 2015, 43, 6787–6798. [Google Scholar] [CrossRef] [PubMed] [Green Version]
  33. Diez-Roux, G.; Banfi, S.; Sultan, M.; Geffers, L.; Anand, S.; Rozado, D.; Magen, A.; Canidio, E.; Pagani, M.; Peluso, I.; et al. A High-Resolution Anatomical Atlas of the Transcriptome in the Mouse Embryo. PLOS Biol. 2011, 9, e1000582. [Google Scholar] [CrossRef] [PubMed]
  34. Carson, J.; Thaller, C.; Eichele, G. A transcriptome atlas of the mouse brain at cellular resolution. Curr. Opin. Neurobiol. 2002, 12, 562–565. [Google Scholar] [CrossRef]
  35. Sun, H.-Z.; Zhao, K.; Zhou, M.; Chen, Y.; Guan, L.L. Landscape of multi-tissue global gene expression reveals the regulatory signatures of feed efficiency in beef cattle. Bioinformatics 2018, 35, 1712–1719. [Google Scholar] [CrossRef]
  36. Clark, E.L.; Bush, S.J.; McCulloch, M.E.B.; Farquhar, I.L.; Young, R.; Lefevre, L.; Pridans, C.; Tsang, H.G.; Wu, C.; Afrasiabi, C.; et al. A high resolution atlas of gene expression in the domestic sheep (Ovis aries). PLoS Genet. 2017, 13, e1006997. [Google Scholar] [CrossRef] [Green Version]
  37. Qi, X.; Zhang, Q.; He, Y.; Yang, L.; Zhang, X.; Shi, P.; Yang, L.; Liu, Z.; Zhang, F.; Liu, F.; et al. The Transcriptomic Landscape of Yaks Reveals Molecular Pathways for High Altitude Adaptation. Genome Biol. Evol. 2018, 11, 72–85. [Google Scholar] [CrossRef]
  38. Tang, Q.; Guosong, W.; Zhou, X.; Jin, L.; Guan, J.; Liu, R.; Li, J.; Long, K.; Tiandong, C.; Che, T.; et al. Comparative transcriptomics of 5 high-altitude vertebrates and their low-altitude relatives. GigaScience 2017, 6, gix105. [Google Scholar] [CrossRef]
  39. Wang, Y.; Zhang, W.; Wu, X.; Wu, C.; Qian, L.; Wang, L.; Zhang, X.; Yang, M.; Li, D.; Ding, J.; et al. Transcriptomic comparison of liver tissue between Anqing six-end-white pigs and Yorkshire pigs based on RNA sequencing. Genome 2020, 63, 203–214. [Google Scholar] [CrossRef]
  40. Li, H.; Wang, T.; Xu, C.; Wang, D.; Ren, J.; Li, Y.; Tian, Y.; Wang, Y.; Jiao, Y.; Kang, X.; et al. Transcriptome profile of liver at different physiological stages reveals potential mode for lipid metabolism in laying hens. BMC Genom. 2015, 16, 763. [Google Scholar] [CrossRef] [Green Version]
  41. Li, L.Y.; Wu, J.X. Analysis of hub genes and molecular mechanisms in non-alcoholic steatohepatitis based on the gene expression omnibus database. Zhonghua Yi Xue Za Zhi 2021, 101, 3317–3322. [Google Scholar] [CrossRef] [PubMed]
  42. Song, X.; Jiang, H.; Qi, Z.; Shen, X.; Xue, M.; Hu, J.; Liu, H.; Zhou, X.; Tu, J.; Qi, K. APEC infection affects cytokine–cytokine receptor interaction and cell cycle pathways in chicken trachea. Res. Veter Sci. 2020, 130, 144–152. [Google Scholar] [CrossRef] [PubMed]
  43. Vu, T.H.; Hong, Y.; Truong, A.D.; Lee, J.; Lee, S.; Song, K.-D.; Cha, J.; Dang, H.V.; Tran, H.T.T.; Lillehoj, H.S.; et al. Cytokine-cytokine receptor interactions in the highly pathogenic avian influenza H5N1 virus-infected lungs of genetically disparate Ri chicken lines. Anim. Biosci. 2022, 35, 367–376. [Google Scholar] [CrossRef] [PubMed]
  44. Ye, M.; Bao, H.; Meng, Y.; Guan, L.; Stothard, P.; Plastow, G. Comparative transcriptomic analysis of porcine peripheral blood reveals differentially expressed genes from the cytokine–cytokine receptor interaction pathway related to health status. Genome 2017, 60, 1021–1028. [Google Scholar] [CrossRef] [PubMed] [Green Version]
  45. Olech, M.; Ropka-Molik, K.; Szmatoła, T.; Piórkowska, K.; Kuźmak, J. Transcriptome Analysis for Genes Associated with Small Ruminant Lentiviruses Infection in Goats of Carpathian Breed. Viruses 2021, 13, 2054. [Google Scholar] [CrossRef] [PubMed]
  46. Kershaw, E.E.; Flier, J.S. Adipose Tissue as an Endocrine Organ. J. Clin. Endocrinol. Metab. 2004, 89, 2548–2556. [Google Scholar] [CrossRef]
  47. Chung, K.-J.; Nati, M.; Chavakis, T.; Chatzigeorgiou, A. Innate immune cells in the adipose tissue. Rev. Endocr. Metab. Disord. 2018, 19, 283–292. [Google Scholar] [CrossRef]
  48. Kane, H.; Lynch, L. Innate Immune Control of Adipose Tissue Homeostasis. Trends Immunol. 2019, 40, 857–872. [Google Scholar] [CrossRef]
  49. Jimenez, M.T.; Michieletto, M.F.; Henao-Mejia, J. A new perspective on mesenchymal-immune interactions in adipose tissue. Trends Immunol. 2021, 42, 375–388. [Google Scholar] [CrossRef]
  50. Kadegowda, A.K.; Bionaz, M.; Piperova, L.S.; Erdman, R.A.; Loor, J.J. Peroxisome proliferator-activated receptor-gamma activation and long-chain fatty acids alter lipogenic gene networks in bovine mammary epithelial cells to various extents. J. Dairy Sci. 2009, 92, 4276–4289. [Google Scholar] [CrossRef] [Green Version]
  51. Shi, H.B.; Luo, J.; Yao, D.W.; Zhu, J.J.; Xu, H.F.; Shi, H.P.; Loor, J.J. Peroxisome proliferator-activated receptor-gamma stimulates the synthesis of monounsaturated fatty acids in dairy goat mammary epithelial cells via the control of stearoyl-coenzyme A desaturase. J. Dairy Sci. 2013, 96, 7844–7853. [Google Scholar] [CrossRef] [PubMed] [Green Version]
  52. Shi, H.; Luo, J.; Zhu, J.; Li, J.; Sun, Y.; Lin, X.; Zhang, L.; Yao, D.; Shi, H. PPAR gamma Regulates Genes Involved in Triacylglycerol Synthesis and Secretion in Mammary Gland Epithelial Cells of Dairy Goats. PPAR Res. 2013, 2013, 310948. [Google Scholar] [CrossRef] [PubMed] [Green Version]
  53. Shi, H.B.; Zhao, W.S.; Luo, J.; Yao, D.W.; Sun, Y.T.; Li, J.; Shi, H.P.; Loor, J.J. Peroxisome proliferator-activated receptor gamma1 and gamma2 isoforms alter lipogenic gene networks in goat mammary epithelial cells to different extents. J. Dairy Sci. 2014, 97, 5437–5447. [Google Scholar] [CrossRef] [PubMed]
  54. Lorenzi, I.; Eckardstein, A.V.; Cavelier, C.; Radosavljevic, S.; Rohrer, L. Apolipoprotein A-I but not high-density lipoproteins are internalised by RAW macrophages: Roles of ATP-binding cassette transporter A1 and scavenger receptor BI. J. Mol. Med. 2008, 86, 171–183. [Google Scholar] [CrossRef] [Green Version]
  55. Izaola, O.; Primo, D.; Hoyos, E.G.; Gomez, J.J.L.; Ortola, A.; de Luis, D. Association of rs670 variant of APOA1 gene with lipid profile and insulin resistance after 9 months of a high protein/low carbohydrate vs a standard hypocaloric diet. Clin. Nutr. 2019, 39, 988–993. [Google Scholar] [CrossRef]
  56. Reichl, D.; Miller, N.E. Pathophysiology of reverse cholesterol transport. Insights from inherited disorders of lipoprotein metabolism. Arter. Off. J. Am. Heart Assoc. Inc. 1989, 9, 785–797. [Google Scholar] [CrossRef] [Green Version]
  57. Holleboom, A.G.; Vergeer, M.; Hovingh, G.K.; Kastelein, J.J.; Kuivenhoven, J.A. The value of HDL genetics. Curr. Opin. Lipidol. 2008, 19, 385–394. [Google Scholar] [CrossRef]
  58. Nikolaou, K.; Vatandaslar, H.; Meyer, C.; Schmid, M.W.; Tuschl, T.; Stoffel, M. The RNA-Binding Protein A1CF Regulates Hepatic Fructose and Glycerol Metabolism via Alternative RNA Splicing. Cell Rep. 2019, 29, 283–300. [Google Scholar] [CrossRef] [Green Version]
  59. Blanc, V.; Riordan, J.D.; Soleymanjahi, S.; Nadeau, J.H.; Nalbantoglu, I.; Xie, Y.; Molitor, E.A.; Madison, B.B.; Brunt, E.M.; Mills, J.C.; et al. Apobec1 complementation factor overexpression promotes hepatic steatosis, fibrosis, and hepatocellular cancer. J. Clin. Investig. 2021, 131, 138699. [Google Scholar] [CrossRef]
  60. Bartee, M.Y.; Lutsenko, S. Hepatic copper-transporting ATPase ATP7B: Function and inactivation at the molecular and cellular level. BioMetals 2007, 20, 627–637. [Google Scholar] [CrossRef]
  61. Pan, G.; Cavalli, M.; Carlsson, B.; Skrtic, S.; Kumar, C.; Wadelius, C. rs953413 Regulates Polyunsaturated Fatty Acid Metabolism by Modulating ELOVL2 Expression. iScience 2020, 23, 100808. [Google Scholar] [CrossRef] [PubMed]
  62. Liu, C.; Ye, D.; Wang, H.; He, M.; Sun, Y. Elovl2 But Not Elovl5 Is Essential for the Biosynthesis of Docosahexaenoic Acid (DHA) in Zebrafish: Insight from a Comparative Gene Knockout Study. Mar. Biotechnol. 2020, 22, 613–619. [Google Scholar] [CrossRef] [PubMed]
  63. Wang, P.Z.; Sun, B.; Hao, D.X.; Zhang, X.J.; Shi, T.P.; Ma, D.L. Human TMEM174 that is highly expressed in kidney tissue activates AP-1 and promotes cell proliferation. Biochem. Bioph. Res. Co. 2010, 394, 993–999. [Google Scholar] [CrossRef]
  64. Nagasawa, T.; Hirota, S.; Tachibana, K.; Takakura, N.; Nishikawa, S.-I.; Kitamura, Y.; Yoshida, N.; Kikutani, H.; Kishimoto, T. Defects of B-cell lymphopoiesis and bone-marrow myelopoiesis in mice lacking the CXC chemokine PBSF/SDF-1. Nature 1996, 382, 635–638. [Google Scholar] [CrossRef] [PubMed]
  65. Feig, C.; Jones, J.O.; Kraman, M.; Wells, R.J.; Deonarine, A.; Chan, D.S.; Connell, C.M.; Roberts, E.W.; Zhao, Q.; Caballero, O.L.; et al. Targeting CXCL12 from FAP-expressing carcinoma-associated fibroblasts synergizes with anti-PD-L1 immunotherapy in pancreatic cancer. Proc. Natl. Acad. Sci. USA 2013, 110, 20212–20217. [Google Scholar] [CrossRef] [Green Version]
  66. Schiraldi, M.; Raucci, A.; Muñoz, L.M.; Livoti, E.; Celona, B.; Venereau, E.; Apuzzo, T.; De Marchis, F.; Pedotti, M.; Bachi, A.; et al. HMGB1 promotes recruitment of inflammatory cells to damaged tissues by forming a complex with CXCL12 and signaling via CXCR4. J. Exp. Med. 2012, 209, 551–563. [Google Scholar] [CrossRef] [Green Version]
  67. Vinnitskaya, A.; Svitich, O.A.; Ammour, Y.; Zverev, V. Effect of CXCL12 and TLR ligands on tumor cell migration and expression of innate immunity factors. Allergy 2020, 75, 188. [Google Scholar]
  68. Adler, M.W.; Rogers, T.J. Are chemokines the third major system in the brain? J. Leukoc. Biol. 2005, 78, 1204–1209. [Google Scholar] [CrossRef] [Green Version]
  69. Li, X.; Xie, S.; Qian, L.; Cai, C.; Bi, H.; Cui, W. Identification of genes related to skeletal muscle growth and development by integrated analysis of transcriptome and proteome in myostatin-edited Meishan pigs. J. Proteom. 2020, 213, 103628. [Google Scholar] [CrossRef]
  70. Tan, I.; Ng, C.H.; Lim, L.; Leung, T. Phosphorylation of a Novel Myosin Binding Subunit of Protein Phosphatase 1 Reveals a Conserved Mechanism in the Regulation of Actin Cytoskeleton. J. Biol. Chem. 2001, 276, 21209–21216. [Google Scholar] [CrossRef] [Green Version]
  71. Meinild, A.-K.; Loo, D.D.F.; Pajor, A.M.; Zeuthen, T.; Wright, E.M. Water transport by the renal Na+-dicarboxylate cotransporter. Am. J. Physiol. Physiol. 2000, 278, F777–F783. [Google Scholar] [CrossRef] [PubMed] [Green Version]
  72. Takvam, M.; Wood, C.M.; Kryvi, H.; Nilsen, T.O. Ion Transporters and Osmoregulation in the Kidney of Teleost Fishes as a Function of Salinity. Front. Physiol. 2021, 12, 664588. [Google Scholar] [CrossRef] [PubMed]
  73. Kanazawa, N.; Nakamura, T.; Tashiro, K.; Muramatsu, M.; Morita, K.; Yoneda, K.; Inaba, K.; Imamura, S.; Honjo, T. Fractalkine and macrophage-derived chemokine: T cell-attracting chemokines expressed in T cell area dendritic cells. Eur. J. Immunol. 1999, 29, 1925–1932. [Google Scholar] [CrossRef]
  74. Verge, G.M.; Milligan, E.D.; Maier, S.F.; Watkins, L.R.; Naeve, G.S.; Foster, A.C. Fractalkine (CX3CL1) and fractalkine receptor (CX3CR1) distribution in spinal cord and dorsal root ganglia under basal and neuropathic pain conditions. Eur. J. Neurosci. 2004, 20, 1150–1160. [Google Scholar] [CrossRef]
  75. Deiva, K.; Geeraerts, T.; Salim, H.; Leclerc, P.; Hery, C.; Hugel, B.; Freyssinet, J.-M.; Tardieu, M. Fractalkine reduces N-methyl-d-aspartate-induced calcium flux and apoptosis in human neurons through extracellular signal-regulated kinase activation. Eur. J. Neurosci. 2004, 20, 3222–3232. [Google Scholar] [CrossRef]
  76. Takegahara, N.; Kim, H.; Choi, Y. RANKL biology. Bone 2022, 159, 116353. [Google Scholar] [CrossRef]
  77. Anderson, D.M.; Maraskovsky, E.; Billingsley, W.L.; Dougall, W.C.; Tometsko, M.E.; Roux, E.R.; Teepe, M.C.; DuBose, R.F.; Cosman, D.; Galibert, L.J. A homologue of the TNF receptor and its ligand enhance T-cell growth and dendritic-cell function. Nature 1997, 390, 175–179. [Google Scholar] [CrossRef]
  78. Fernandez-Canon, J.M.; Granadino, B.; Beltran-Valero de Bernabe, D.; Renedo, M.; Fernandez-Ruiz, E.; Penalva, M.A.; Rodriguez de Cordoba, S. The molecular basis of alkaptonuria. Nat. Genet. 1996, 14, 19–24. [Google Scholar] [CrossRef]
  79. Ranganath, L.R.; Jarvis, J.C.; Gallagher, J.A. Recent advances in management of alkaptonuria (invited review; best practice article). J. Clin. Pathol. 2013, 66, 367–373. [Google Scholar] [CrossRef]
  80. Singh, R.; Gupta, S.; Dastidar, S.; Ray, A. Cysteinyl Leukotrienes and Their Receptors: Molecular and Functional Characteristics. Pharmacology 2010, 85, 336–349. [Google Scholar] [CrossRef]
  81. Wu, X.; Hong, H.; Zuo, K.; Han, M.; Li, J.; Wen, W.; Xu, G.; Miao, B.; Li, H. Expression of leukotriene and its receptors in eosinophilic chronic rhinosinusitis with nasal polyps. Int. Forum Allergy Rhinol. 2015, 6, 75–81. [Google Scholar] [CrossRef] [PubMed]
  82. Fukai, H.; Ogasawara, Y.; Migita, O.; Koga, M.; Ichikawa, K.; Shibasaki, M.; Arinami, T.; Noguchi, E. Association between a polymorphism in cysteinyl leukotriene receptor 2 on chromosome 13q14 and atopic asthma. Pharmacogenetics 2004, 14, 683–690. [Google Scholar] [CrossRef] [PubMed]
  83. Dewulf, J.P.; Wiame, E.; Dorboz, I.; Elmaleh-Bergès, M.; Imbard, A.; Dumitriu, D.; Rak, M.; Bourillon, A.; Helaers, R.; Malla, A.; et al. SLC13A3 variants cause acute reversible leukoencephalopathy and α-ketoglutarate accumulation. Ann. Neurol. 2019, 85, 385–395. [Google Scholar] [CrossRef] [PubMed]
  84. Bai, X.; Chen, X.; Feng, Z.; Hou, K.; Zhang, P.; Fu, B.; Shi, S. Identification of basolateral membrane targeting signal of human sodium-dependent dicarboxylate transporter 3. J. Cell. Physiol. 2005, 206, 821–830. [Google Scholar] [CrossRef]
  85. Bergeron, M.; Clémençon, B.; Hediger, M.; Markovich, D. SLC13 family of Na+-coupled di- and tri-carboxylate/sulfate transporters. Mol. Asp. Med. 2013, 34, 299–312. [Google Scholar] [CrossRef]
Figure 1. Classification of protein-coding genes in Bactrian camels. (A) Global correlation analysis of transcriptomes across adult tissues based on 20,417 protein-coding genes. Transcript levels were expressed as fragments per kilobase of exon per million fragments mapped. (B) Number of tissue-enhanced genes and tissue-enriched genes in nine tissues of adult camels. (C) Expression profiles of tissue-elevated genes with the corresponding GO terms and KEGG pathways. (D) Number of ubiquitously expressed genes and tissue-elevated genes in adults and fetuses. (E) Gene classification based on the level of expression.
Agriculture 12 00958 g001
Figure 2. Weighted gene co-expression network analysis (WGCNA) of genes associated with adaptation to desert environments in adult camels. (A) Heatmap of the correlation of module genes with fat metabolism, water balance, immunity, and digestion. (B) Gene network of the top 300 genes in the light yellow module. Yellow circles correspond to hub genes with a degree of connectivity greater than 25. (C) KEGG pathway analysis of genes in light yellow module that overlapped with liver tissue-elevated genes.
Agriculture 12 00958 g002
Figure 3. Expression of development-associated genes in Bactrian camels. (A) Number of differentially expressed genes between adults and fetuses. The criteria for differential expression were false-discovery rate < 0.05, fold-change > 2, and FPKM > 1. (B) Expression profiles of 101 genes with significantly and uniquely enriched GO terms and KEGG pathways.
Agriculture 12 00958 g003
Figure 4. Validation of RNA-Seq results by quantitative real-time polymerase chain reaction (qRT-PCR) across different tissues of Bactrian camels. Concordance between qRT-PCR and RNA-seq results in (A) adults and (B) fetuses. Correlation analysis was performed using GraphPad software version 8.0. (C) Relative mRNA expression of hub genes APOA1, GDPD2, and MAPK4 in adult tissues. (D) Relative mRNA expression of hub genes SLC16A4, RGS18, and PPARγ in fetal tissues. (E) RT-qPCR analysis of differentially expressed genes in the rumen (* p < 0.05; *** p < 0.001).
Agriculture 12 00958 g004
Publisher’s Note: MDPI stays neutral with regard to jurisdictional claims in published maps and institutional affiliations.

