Abstract
The combine harvester is the main machine for fieldwork during the harvest season. When the harvester fails and cannot continue to work, this indirectly affects the harvest time and the yield in the field. The emergency maintenance service of agricultural machinery can be optimized through the dynamic planning of harvester maintenance tasks, using the operation and maintenance platform. According to the scene, a priority scheme for the operation and maintenance tasks, based on the improved Q-learning algorithm, was proposed. The continuous approximation capability of the model was improved by using the BP neural network algorithm and the Q function value, in iterations, was updated continuously. At the same time, the improved TOPSIS method, based on Mahalanobis distance, was used to calculate the closeness of each harvester maintenance task, so as to determine the priority of the equipment maintenance tasks. An operation and maintenance service platform for combine harvesters was developed based on the B/S architecture, with the goal of minimizing the operation and maintenance costs and improving the tasks’ complete efficiency. In this research process, dynamic scheduling rules were formulated. Operation and maintenance resources were optimized and rationally allocated through dynamic optimization scheduling methods, and feasible solution information was generated from the operation and maintenance service platform. Finally, the actual data from the enterprise were used for verification and analysis. The verification showed the following: through a comparison of algorithm performance, it was seen that the improved BP-Q-Learning algorithm can quickly find the operation and maintenance scheduling scheme in the maintenance scheduling; the priority rules can improve the efficiency of task execution, to a certain extent; the cost of the tasks’ execution can be significantly reduced; and the maintenance distance can be shortened. This research has reference significance for the formulation and optimization of agricultural machinery maintenance for cross-regional operations.
1. Introduction
In China, due to the seasonal maturity of crops from the south to the north, the demand for harvesters tends toward a cross-regional operation. Due to the concentrated operating time, the high operating intensity, the harsh operating environments, and the wide operating service areas of the harvesters [1], the failure frequency of agricultural machinery can easily increase. In recent years, more and more attention has been paid to the development of optimization technology for agricultural machinery service resource allocation [2,3,4], especially in the process of seasonal cross-regional operations, given the particularity of rushing to harvest. When the machines cannot be maintained and the failures cannot be solved in time, this can result in a reduction in the farmland harvest and, thus, a reduction in the income of the cross-regional operation of agricultural machinery, which can bring serious consequences. According to the characteristics of agricultural machinery maintenance services, the optimal maintenance cost, and the rapid arrival of maintenance services to the maintenance demand points are the keys to improving the efficiency of maintenance work. Excellent performance in agricultural machinery service plays a very important role in improving the quality of agricultural machinery operations and promoting the healthy and orderly development of agricultural production.
From the beginning of May to the end of June every year, the harvester, as the main model for cross-regional operations, plays an important role and is also the source of economic income for the owners of agricultural machinery. Agricultural machinery enterprises provide information on the demand for harvesters in different regions, for users who purchase agricultural machinery. Combine harvester owners are organized enough to carry out cross-regional harvesting services [5], and enterprise service teams are sent to provide guarantee work for harvester users. The maintenance services include maintenance personnel [6], service vehicles, spare parts, and other resource information [7]. In this research, the main aim was to quickly dispatch maintenance personnel from the maintenance station to the fault maintenance point, through the operation and maintenance platform [8], according to the location information of the agricultural machinery failure points, the maintenance service stations, and the service vehicles at the scene.
In summary, during the cross-regional operation of combine harvesters, the failure rate is greatly increased due to the high frequency of use. However, the agricultural machinery in one region is used to harvest crops in different fields, and the failure points of the harvester are scattered and numerous. During the maintenance process, the agricultural machinery operator usually calls to report the failure, the maintenance personnel carry out the operation and maintenance in order, according to the requests. The relevant cost and overall efficiency are not considered in the maintenance service, and there is no system to record the relevant data from the entire maintenance process, resulting in problems. For example, the technicians in the team may be unable to repair the harvester due to a lack of skills and experience, or the repair tools and spare parts may not meet the current breakdown needs. In addition, the maintenance personnel sometimes have to walk a long distance from one field to another. These problems affect the harvest cycle of the field crops, reduce harvester efficiency, and increase the maintenance costs.
Unlike previous studies, in this paper, the scheduling and optimization of resources in the process of cross-regional operation maintenance service was focused on. The problem involved the maintenance allocation of the operation and maintenance personnel, the resource allocation of spare parts, and the maintenance efficiency costs. The agricultural machinery enterprises provided operation and maintenance personnel, tools, and spare parts for maintenance service stations. In addition, for different machinery, with different fault levels and different maintenance times, each maintenance task needs to be dynamically processed. Each maintenance team must have the different skills required for the service, select special maintenance tools, and configure different replacement parts. Therefore, in this study the dynamic optimization rules of agricultural machinery operation and maintenance service resources were constructed and analyzed, and a dynamic optimization scheme was constructed by adopting the TOPSIS method. Next, a harvester operation and maintenance service platform was developed for cross-regional operations. The dynamic scheduling algorithm was evaluated based on the information obtained from the operation and maintenance database of Lovol agricultural machinery enterprises, China. The main contributions of this paper were summarized as follows:
1. The relevant scenarios and solutions of harvester operations in the process of cross-regional operations are summarized and analyzed in this paper. Its advantages and limitations are analyzed, and the problems existing in the process of harvester maintenance are discussed. In addition, the reliability of the proposed algorithm is evaluated through the operation and maintenance data of the enterprise, a comparative analysis is made, and the set dynamic scheduling rules are also verified.
2. For the cross-regional operation of combine harvesters, a comprehensive operation and maintenance service platform system was designed, which can realize the functions of data collection, data failure prediction and diagnosis, and operation process maintenance, etc. Furthermore, based on this platform, an optimization process for service resource scheduling was developed. Through the integration of the maintenance customer, the service enterprise center, and the service personnel, the problems regarding the rapid repair of faults in the whole cycle process can finally be solved.
2. Literature Review
In Europe and the United States, most of the farms own their own large-scale agricultural machinery to realize agricultural machinery operations [9] and maintenance work. Through the monitoring of data information in agricultural scenarios [10,11], the field transfer of agricultural machinery [12,13,14] and the collaborative operation optimization [15,16] are carried out, but there are very few studies on the cross-regional operation of agricultural machinery. It can be said that the cross-regional operation of agricultural machinery is a product with Chinese characteristics and specific historical conditions. Among them, the optimization of an operation and maintenance service path is the key to realizing the agricultural machinery maintenance service. The comprehensive operation and maintenance can be divided into preventive maintenance [17], predictive maintenance [18], and fault maintenance. Cross-regional scheduling operations are mostly concentrated in logistics distribution, emergency rescue, and other fields [19]. In addition, taking into account time windows, operation and maintenance costs, and distance [20], a Q-Learning algorithm was adopted to carry out dynamic scheduling [21,22] in this study. Lijian et al. [23] proposed a new neighborhood method to provide decision support for the door-to-door maintenance servicing of agricultural machinery, under the constraints of the customer’s time window, working time, and fleet size. Hu et al. [24] proposed a service provider selection framework for a dynamic maintenance network node layout, which improved the reliability of service provider selection in the process of maintenance network construction. Gualberto et al. [25] developed a system that can analyze the emergency service, according to the frequent changes of the location of the harvesting field, taking the emergency service of harvester tire maintenance as a case. Yan et al. [26] conducted preventive maintenance work by using a two-layer Q-learning algorithm, and a DT driven by reinforcement learning (RL) that was proposed can achieve efficient collaborative scheduling between production and maintenance departments and can help manufacturing enterprises improve the real-time decision-making process, under uncertain disturbances.
Moreover, the contribution of a service platform system [27,28] to agriculture has been discussed in many studies [29]. When agricultural machinery is intensively used and the maintenance process is not scientific, it is necessary to optimize the scheduling of resources through the service platform [30,31] for the comprehensive operation of agricultural machinery [32]. In this way, in the process of expanding demand, the implementation of sustainable practices in this field, and managing and controlling the optimization of the operation and maintenance service resources in agricultural scenarios can quickly solve the harvester failure. This means that it can participate in the agricultural harvesting process again, which will help to improve the efficiency of comprehensive operation and maintenance.
From the literature, it can be seen that the main method of optimizing the scheduling of harvester maintenance resources in cross-regional operations is to solve the priority order of the maintenance tasks, the timeliness requirements of maintenance activities, and the effective scheduling of maintenance resources. In this paper, the optimal scheduling of cross-regional operations and the maintenance resources of harvesters were studied. The main contributions of this paper have two aspects. First, as far as we know, the existing literature has mostly focused on the scheduling and coordination of agricultural machinery operations; however, the issues regarding the optimization of the configuration of maintenance personnel, maintenance tools, and spare parts in the process of maintaining agricultural machinery have not been solved. Therefore, the development of the operation and maintenance platform was also considered in our study. Second, although various optimization algorithms have been widely used in agricultural machinery scheduling and optimization, such as navigation, scheduling, and allocation, there has never been any research on the dynamic scheduling optimization of combine harvester maintenance. In this research, the TOPSIS method was used to construct dynamic scheduling priority rules, and through the improved Q-Learning dynamic scheduling algorithm of BP, the operation and maintenance service platform was finally designed, the operation and maintenance service solution was generated, and a better maintenance service was proposed to solve the problems of agricultural machinery maintenance.
3. Problem Description and Model
3.1. Problem Analysis
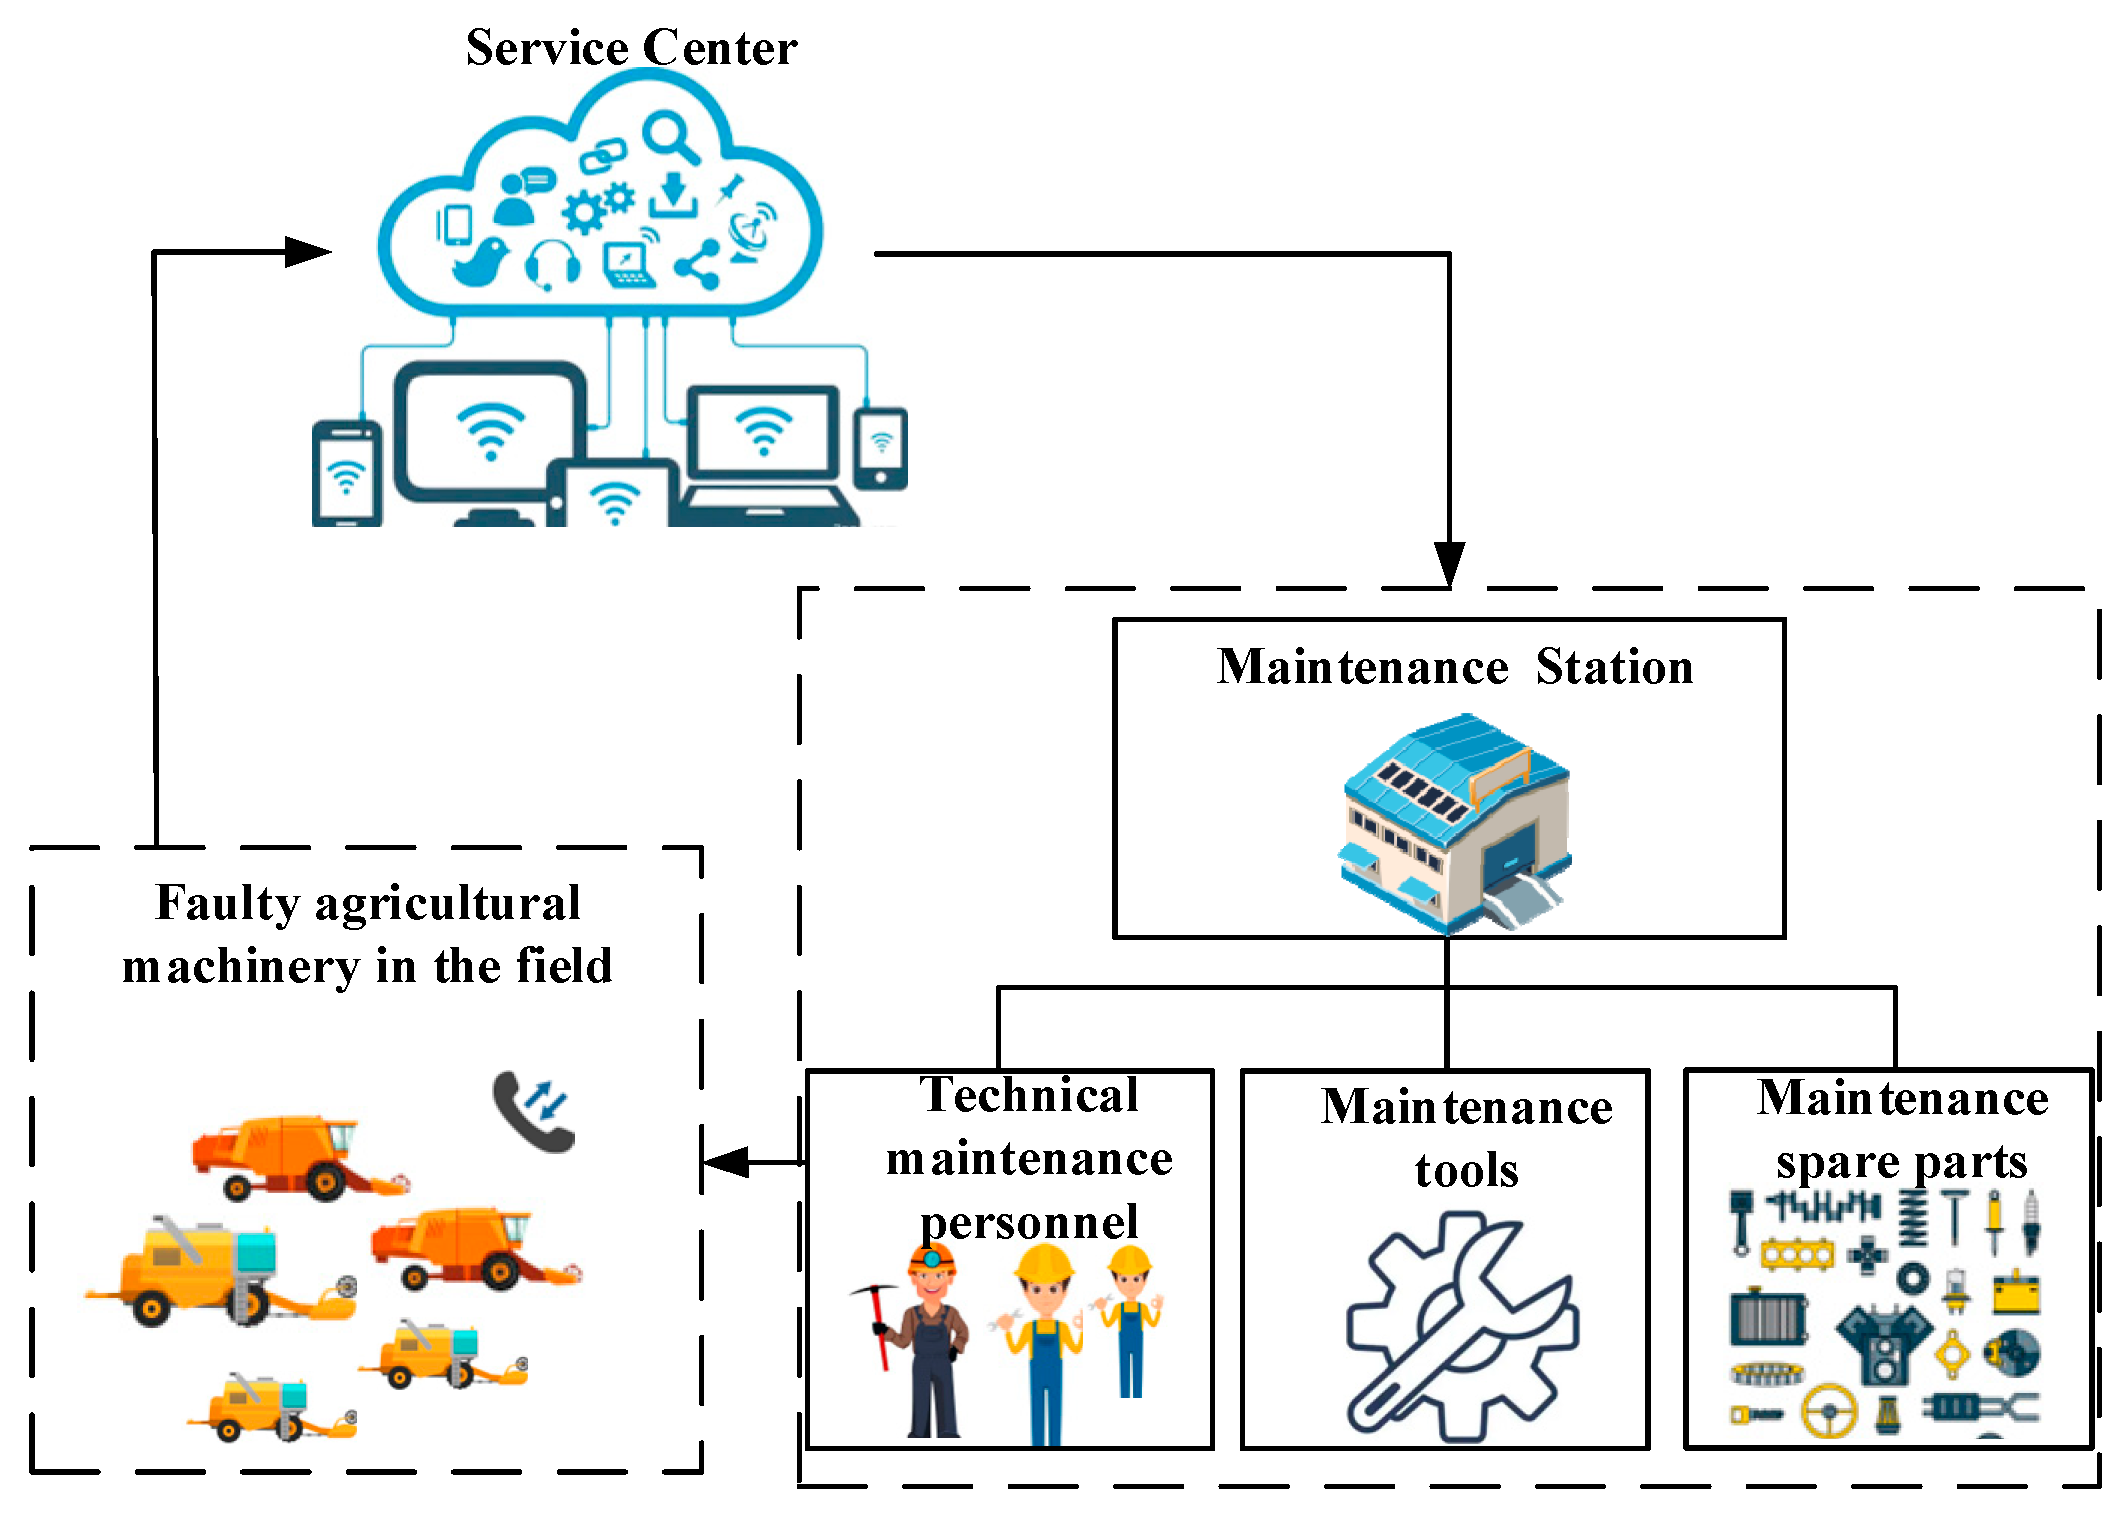
The cross-regional operation and maintenance service of harvesters is a process of seeking service and maintenance personnel to provide services for the faulty agricultural machinery. However, in the agricultural scene, once the agricultural machinery fails, it is difficult to move the consignment to the service network for maintenance, due to the special operation conditions of the agricultural machinery. However, the harvesting task needs to be completed as soon as possible, so the service provider can only be sought for rescue. In the maintenance process, the service provider mainly sends technical maintenance personnel, carrying maintenance tools and the identified spare parts, to the fault point of the harvester to carry out the maintenance work. In this service scenario, the number of maintenance personnel, maintenance tools, and spare parts in the service station or service center is limited. When responding to maintenance scheduling requirements, there are time window requirements for planned tasks or real-time requests for service orders, etc. When there are multiple maintenance requests that need to be dealt with in time, within a certain period, the task execution plan should be adjusted in real time, according to the dynamic scheduling priority rules of the cross-regional operations of combine harvesters, as shown in Figure 1.

Figure 1.
Schematic diagram of the structure of the maintenance service system for cross-regional operations.
3.2. Hypothetical Description
The dynamic scheduling mathematical model refers to the mathematical description of the optimization objectives and constraints in the dynamic scheduling process. Firstly, according to the characteristics of the scheduling problem of the harvester cross-regional operation and maintenance service, the following assumptions were made:
- (1)
- The maintenance tasks of the harvester in this article can all be carried out at the same time, and there is no sequence.
- (2)
- The initial starting point of the maintenance service is the repair station.
- (3)
- After completing the current harvester maintenance, operation and maintenance personnel can go directly to the next harvester maintenance service demand point from the current location, without returning to the maintenance station.
- (4)
- The task’s time window requirement refers to the time window when maintenance starts, regardless of whether the task’s end time is within the time window.
- (5)
- A subtask can only be handled by one maintenance person, with one auxiliary tool or spare part, at most, and the maintenance personnel and auxiliary tools can handle multiple subtasks in one task.
- (6)
- Maintenance personnel have different skill levels for different types of work, different types of work can be performed by different personnel, and different types of auxiliary tools can complete different maintenance work.
- (7)
- The number of spare parts stored by an operation and maintenance unit is limited. If the number of spare parts for a certain model in the operation and maintenance unit is insufficient, another operation and maintenance unit needs to provide the spare parts.
3.3. Model Building
3.3.1. Parameter Definition and Symbol Representation
Variable symbols are defined as follows:
σ1, σ2, σ3—the weight value of each optimization objective.
DXA, DZA, DYA—the maximum value corresponding to each indicator.
DXB, DYB, DZB—the minimum value corresponding to each indicator.
εb—the cost penalty coefficient of insufficient spare parts storage.
Sqi—mission Zi’s transport distance.
l—the number of transportation routes for O&M resources.
Nc—the distance of route c.
wPi—the staff execution cost.
wPij—the hourly salary of the person in charge of the subtask Zij.
tij—the estimated completion time for task Zij.
wHij—the depletion cost of auxiliary tools used by subtask Zij.
v—the average speed of transport.
Nc/v—the transit time for route c.
uij—the efficiency improvement factor after using auxiliary tools.
tij·uij—the actual execution time of task Zij.
3.3.2. Constraint Condition
Because there was a matching principle between harvester maintenance and resource allocation, in order to describe the rules, the constraint conditions of the model were analyzed. In order to avoid illegal solutions and affecting the iterative process, the constraint conditions were established in the form of penalty coefficients, as follows:
(1) Skill constraints of maintenance personnel
For those who are not qualified to perform a task, a larger number will be used for cost calculation when calculating the cost objective function. Wpij represents the hourly salary of personnel Pj.
(2) Service tool constraints
The auxiliary tools can only assist in the processing of some O&M tasks. It is assumed that the efficiency improvement coefficient is uimj. In order to avoid the mismatch between the auxiliary tools and the operation and maintenance tasks, uimj was set as follows:
where Tj represents the fault type corresponding to task Zil, and represents the efficiency improvement coefficient of auxiliary tools participating in fault Tj. When the auxiliary tool cannot handle the fault, takes a larger value as the penalty coefficient.
(3) Operation skill constraint
Rjk is used to represent the ability coefficient of personnel Pj to operate the auxiliary tool Hk, and this coefficient is filled into the matrix Rp×q. If the personnel have the ability to operate auxiliary tools, the value is one; if the personnel do not have the ability to operate auxiliary tools, the coefficient is a maximum value.
(4) Quantity constraint of spare parts
The quantity of spare parts stored by an operation and maintenance unit is limited. It is assumed that there are two operation and maintenance units, A and B, wherein the quantity of model Bl spare parts in operation and maintenance unit A is , and the quantity of model Bl spare parts in operation and maintenance unit B is . The following inequality shall be satisfied for all types of spare parts. Where represents the number of spare parts, Bl is provided by operation and maintenance unit A in the task set. represents the number of spare parts Bl provided by operation and maintenance unit B in the task set.
When the above inequality is not established, the time penalty coefficient of introducing a shortage of spare parts is , which is a large value and directly affects the completion time of the total task.
3.3.3. Scheduling Model Establishment
According to the above problem description, the model hypothesis, the symbol definitions, the total task transportation distance, the total task completion cost, and the total task completion time were taken as the optimization goals, and normalization was adopted in the calculation of the fitness function. Firstly, the value ranges of different indicators were unified, then the weights of different indicators were set to achieve normalization, and the final multi-objective optimization function was obtained. The constructed dynamic scheduling mathematical model is as follows:
Normalized multi-objective function:
The shortest total transportation distance:
Minimum task completion cost:
Total time to complete the shortest task:
Mission Zi’s transport distance:
Staff execution cost:
Auxiliary tool loss cost:
Completion time of task Zi:
Equation (6) is the function where the three optimization objective functions are normalized, wherein σ1, σ2, and σ3 are the weight value of each optimization objective; DXA, DYA, and DZA are the maximum values corresponding to each index; and DXB, DYB, and DZB are the minimum values corresponding to each index. Equations (7)–(9) represent the objective functions of this scheduling plan, which are the shortest total transportation distance, the lowest task completion cost, and the shortest task completion time, where is the cost penalty coefficient of insufficient spare parts storage. Equation (10) represents the transportation route of task Zi, wherein l is the number of transportation routes for the operation and maintenance resources and Nc is the distance of the moving path, cc. Equation (11) and Equation (12), respectively, represent the personnel execution cost and the auxiliary tool loss cost, where is the hourly salary of the person in charge of the sub-task Zij; Tij is the estimated completion time of task Zij; and is the loss cost of the auxiliary tools used by the subtask Zij, independent of the duration of the task. Equation (13) represents the completion time of task Zi, including the transportation time and the task execution time. Where v is the average transportation speed, Nc/v is the transportation time of path c, and Uij is the efficiency improvement coefficient, after using the auxiliary tools. If the auxiliary tools are not used, the parameter is one. If the operation and maintenance personnel do not have the skills to operate the corresponding auxiliary tools, the parameter is set to a larger value as a punishment. tij·uij is the actual execution time of task Zij.
4. Design of Optimization Algorithm for Dynamic Problems
4.1. The Overall Framework of Dynamic Algorithms
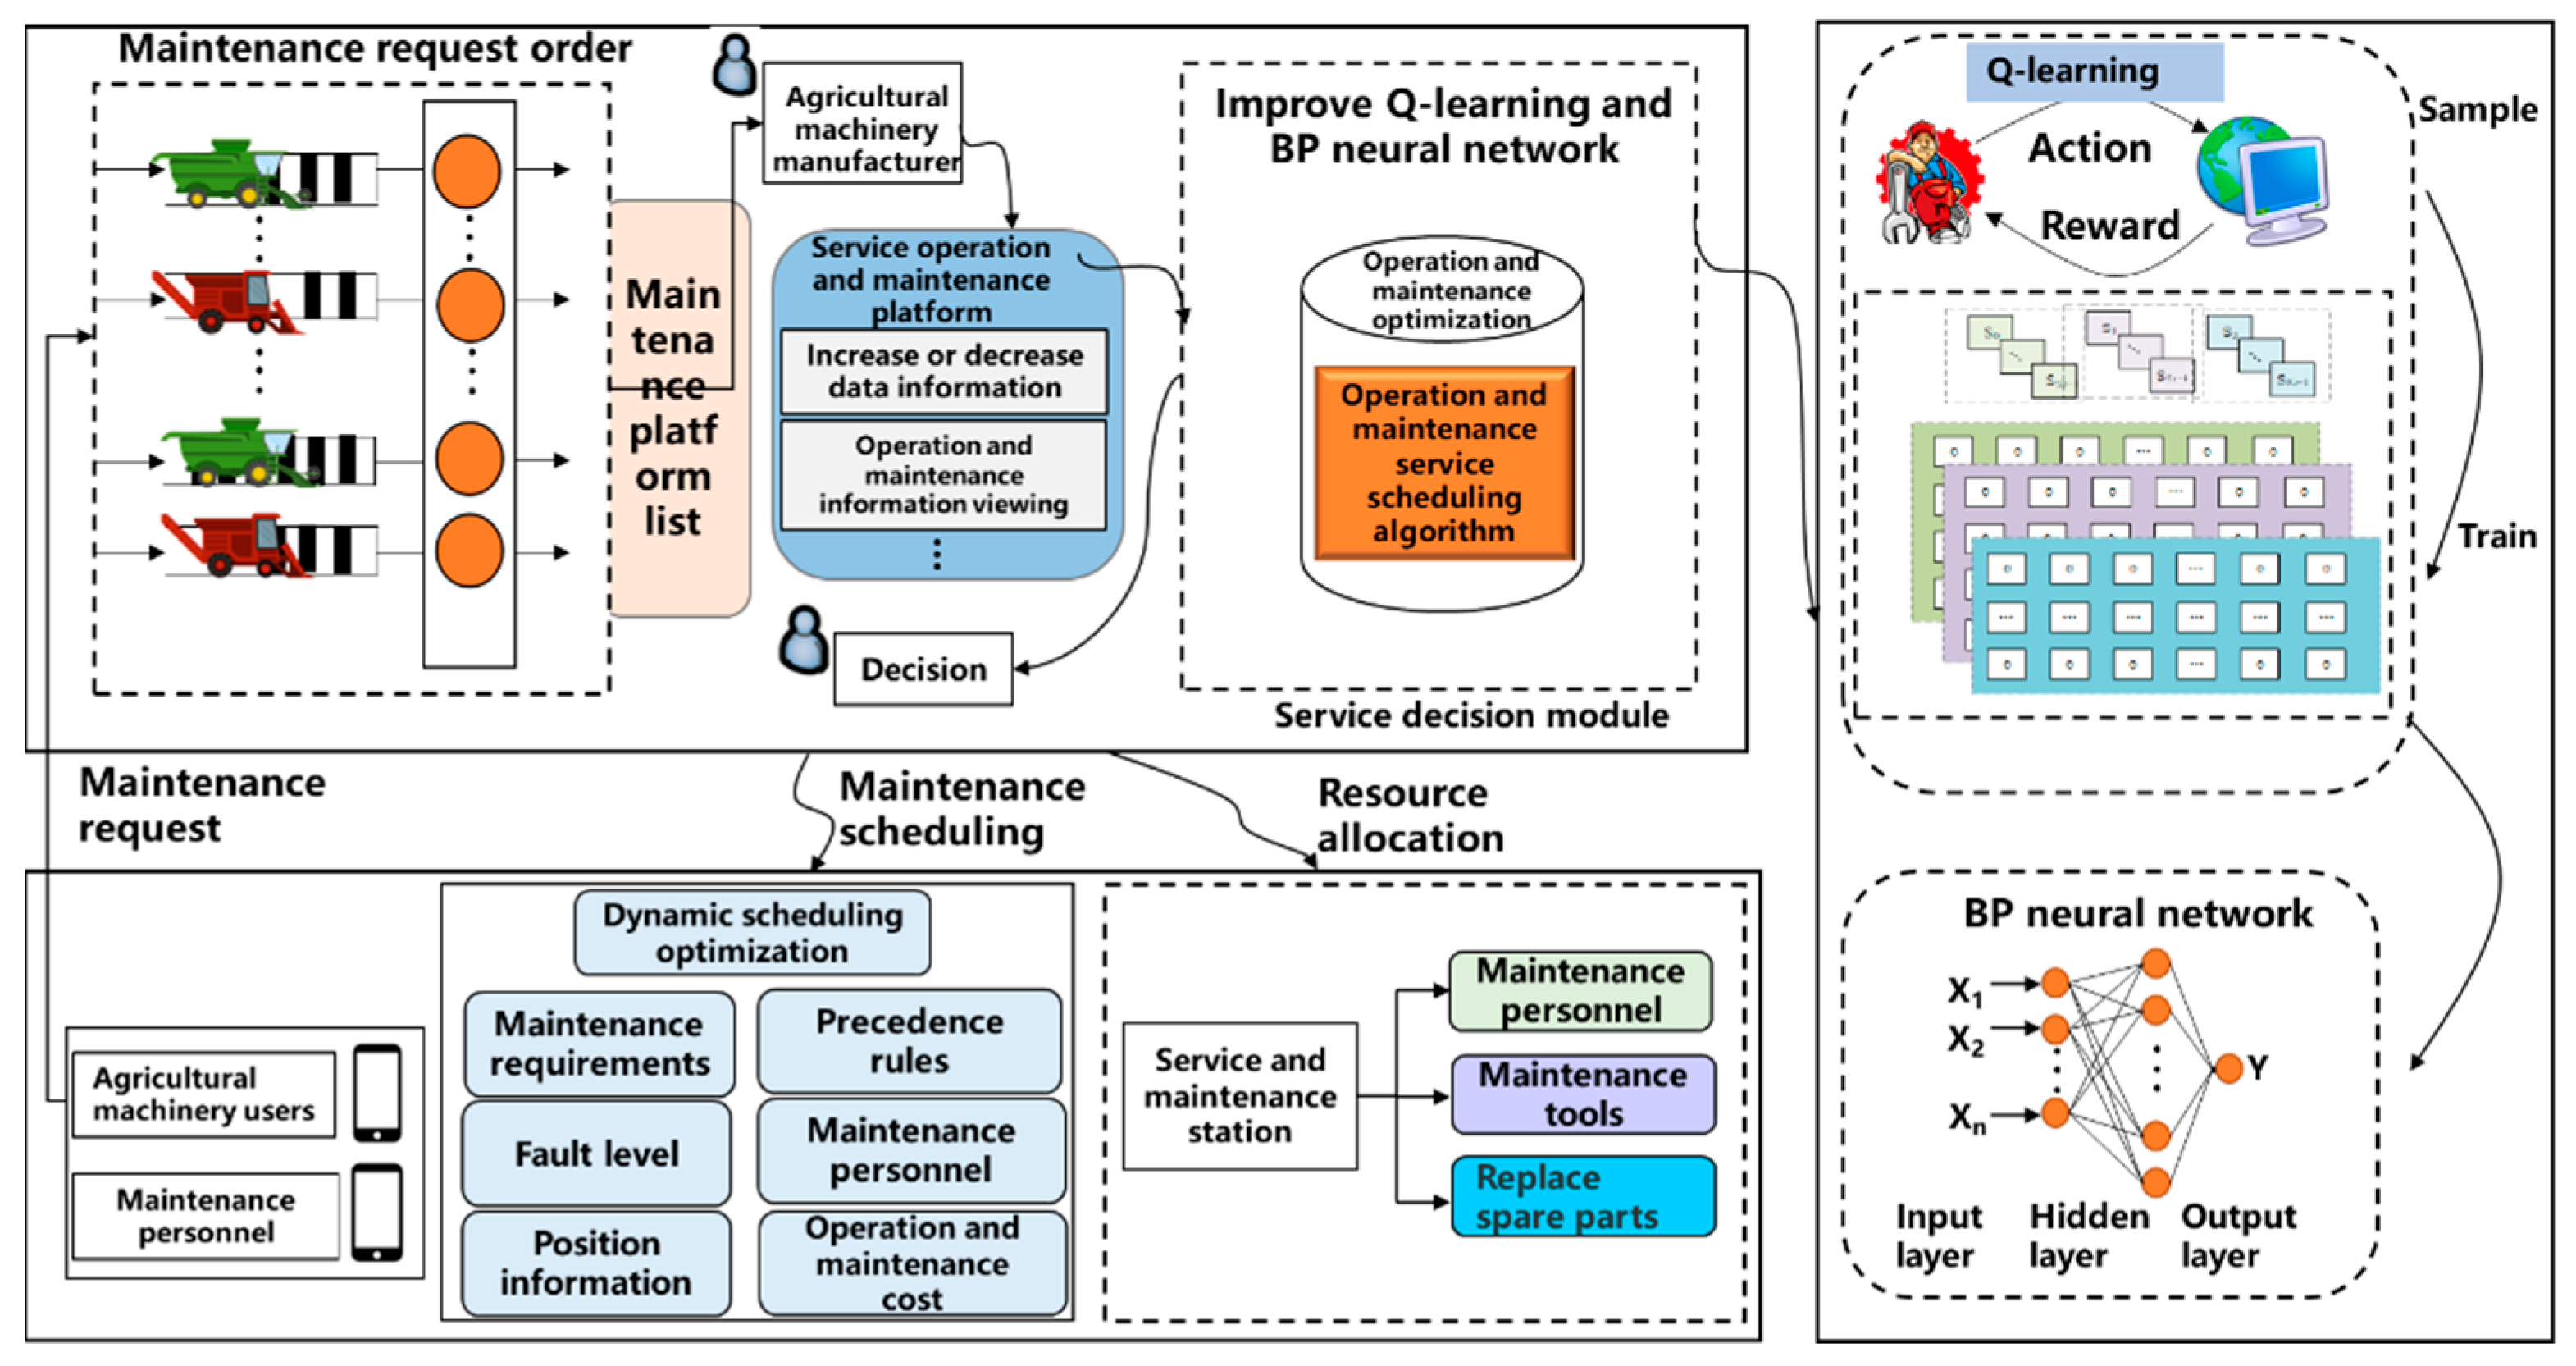
A task allocation system model of Q-Learning reinforcement learning, based on the BP algorithm, was proposed. As shown in Figure 2, the basic idea of the dynamic service resource scheduling optimization architecture for combine harvesters was as follows: when multiple maintenance tasks need multiple operation and maintenance resources to be processed, the current state includes maintenance personnel, maintenance tools, maintenance stations, faulty maintenance of the harvester being executed, and maintenance requests that have not yet been executed. In each operation and maintenance scheduling, assuming that the ongoing maintenance tasks remained unchanged, the priority indicators of different operation and maintenance tasks were calculated according to the resource scheduling rules of the combine harvester maintenance service, the order of task execution was adjusted, and the tasks not executed by the maintenance personnel and the newly generated fault maintenance requirements were re-optimized, so as to obtain a better arrangement.

Figure 2.
The overall framework of the dynamic algorithm.
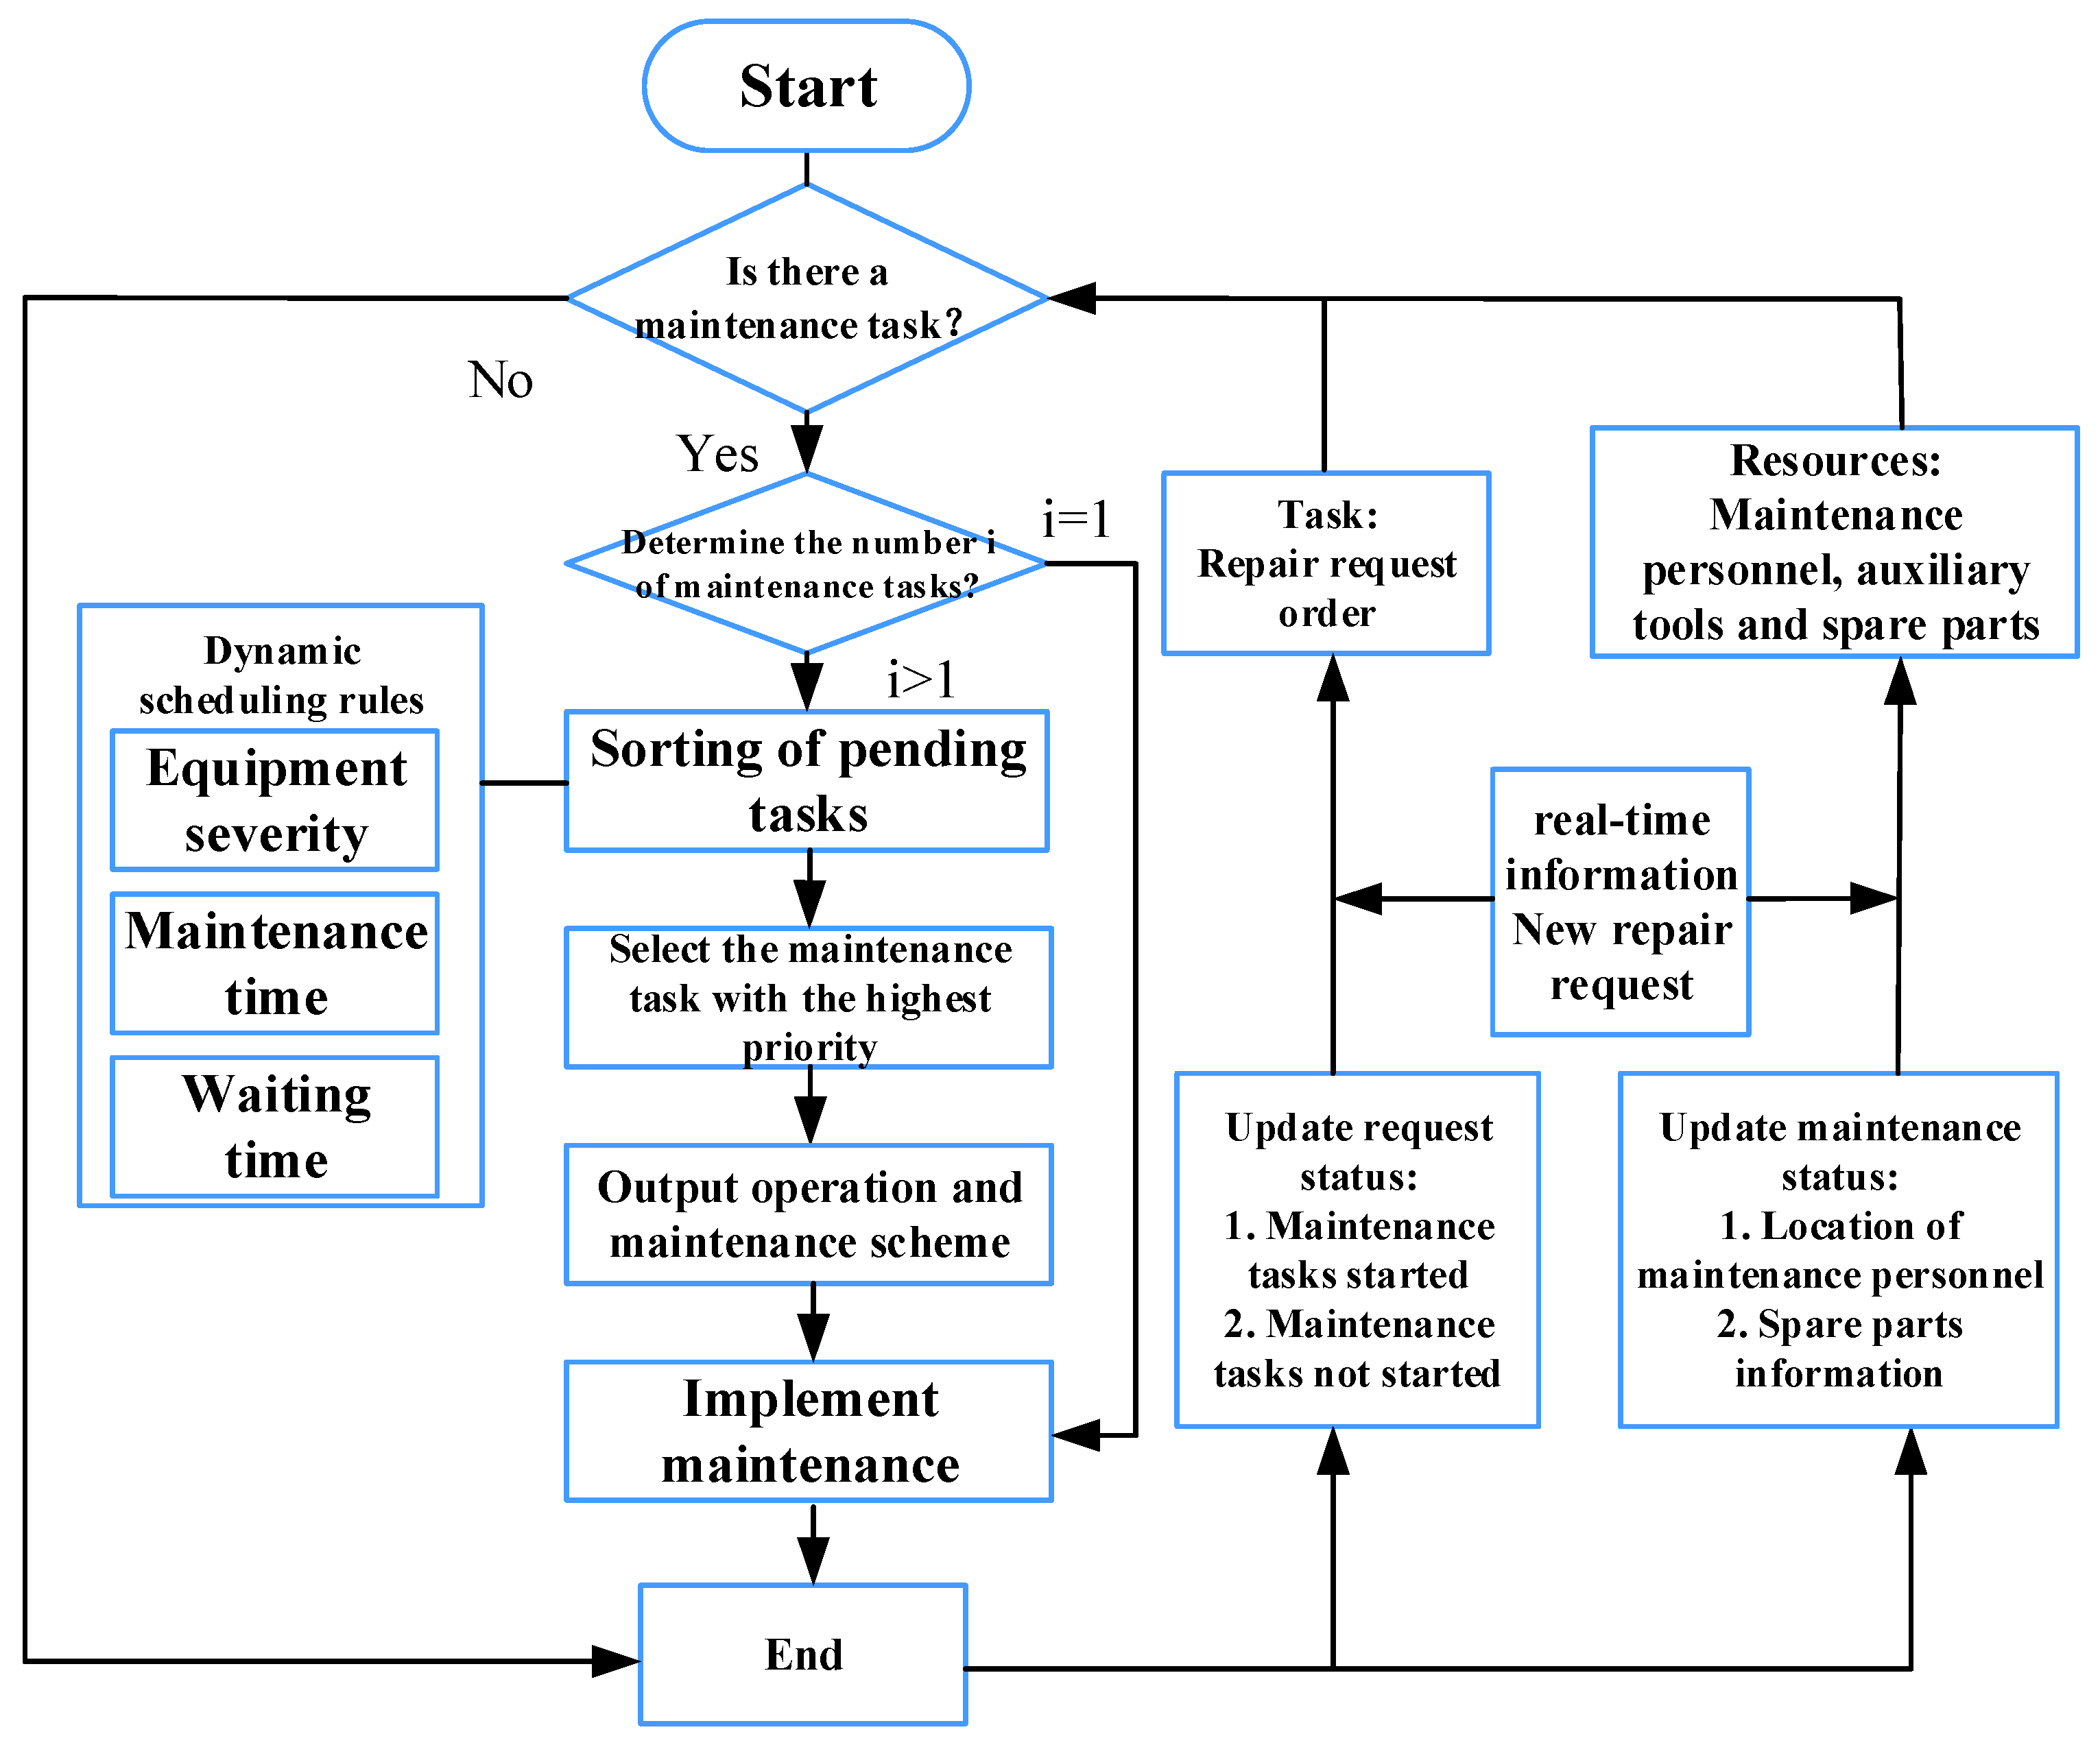
4.2. Dynamic Scheduling Policy
Dynamic scheduling included new maintenance requests, and the emergency maintenance requirements of harvesters, etc. The traditional harvester maintenance service scheduling problem did not consider the emergence of real-time maintenance requests in the maintenance process. Aiming at the characteristics of cross-regional operations, real-time maintenance tasks and the changes of new maintenance request orders and a dynamic scheduling model of maintenance tasks, considering priorities, were put forward in this study, according to the following three rules: a high degree of failure priority; first come, first served; and short task priority, as shown in Figure 3.
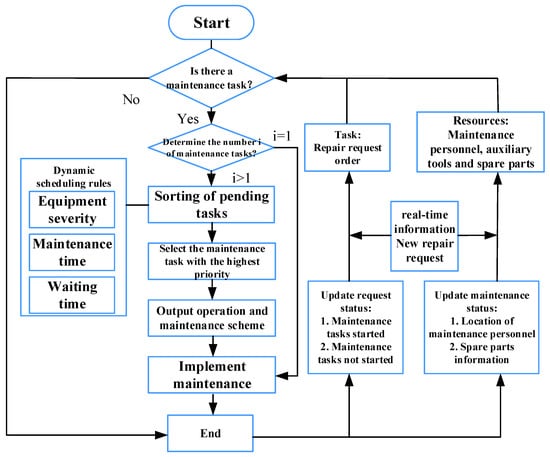
Figure 3.
Dynamic scheduling model of harvester maintenance tasks.
- (1)
- High degree of failure priority
According to GB/T 35488-2017 [33], the failures of combine harvesters can be divided into the following three categories: general failures, serious failures, and fatal failures. Among them, the general fault level is Class I, the serious fault is Class II, and the fatal fault is Class III. The emergency harvester applies real-time insertion methods to process the information of dynamic events, convert events into dynamic requests, and to judge the emergency degree of a harvester’s failure. If the fatal fault needs to be dealt with as soon as possible, non-emergency faults can be repaired according to the demand intensity of the field crops on the harvester. The severity of the task Zij is expressed by a constant, if the general fault severity Uij-level = 1, the serious fault severity Uij-level = 2, and the fatal fault severity Uij-level = 5; the number of harvester faults corresponding to the task Zij is set as nij, and the urgency index of the corresponding fault as uij, then the severity of task Zi is as follows:
- (2)
- Short maintenance priority scheduling
After receiving the repair request, the system platform judges the tasks with less repair time according to the fault repair request, and gives priority to the execution of the task order, shortens the waiting time of the job, and improves the responsiveness and processing efficiency of the order. If the current time is Tn, and the latest start time of the task allowed by the task time window of task Zi is Ti-sum, then the remaining allowable period of task Zi is as follows:
- (3)
- First come, first served scheduling
The scheduling service is carried out according to the order of maintenance service requests. If the maintenance application time of task Zi is set to be Ti-st, and the current time is Tn; the start time of maintenance service is set to be 0; and the reporting time of a new maintenance request in real time is calculated according to the actual time of the task reception, then the waiting time of task Zi is as follows:
4.3. Construction of Dynamic Scheduling Principles
The approximate ideal solution ranking method (TOPSIS) is a method used to evaluate the pros and cons of multi-objective solutions, which is often used to evaluate task priority under various scheduling rules. This method was used to construct the dynamic scheduling rules. The specific process is as follows:
Step 1: There are m maintenance tasks—A1, A2, …, and Am—and n reviews available—B1, B2…, and Bn—to evaluate each maintenance task. For any maintenance task, Ai, there are n evaluation values, as follows: xi = (xi1, xi2, xij, … xin), where xij represents the evaluation value of the index Bj in the priority evaluation index of the maintenance task, Ai and the initial evaluation matrix is composed of the evaluation values of the m maintenance tasks.
Step 2: To avoid the influence of the data dimension in X, it was standardized. There are many methods of standardization. Through the comparative study of many normalization methods, the vector normalization method was selected in this paper to normalize the initial evaluation matrix X. The two extremely large indicators of the high failure degree and the large task time window, were processed by Formula (18). The extremely small indicator of task maintenance demand time, was processed by Formula (19). After standardization, the standard matrix, C, of Formula (20) was obtained.
Step 3: Multiply each column of the standard matrix by the weight index, ωj, of the corresponding rule and obtain the final normalized matrix, E.
Step 4: The core idea of the TOPSIS method is to judge the distance between each alternative scheme and the ideal solution and to sort the alternatives according to the distance to obtain the optimal solution. The ideal solution and the negative ideal solution must be obtained before calculating the distance. For extremely large indexes, the maximum index is calculated according to Formula (22). For extremely small indexes, the performance index is calculated according to Formula (23).
The Euclidean distance in the traditional TOPSIS method is replaced by the Mahalanobis distance to calculate the distance between each scheme and the ideal solution, which can effectively reduce the interaction between the evaluation indicators and make the results more accurate and convincing. The Mahalanobis distance judges the relationship between two variables by introducing covariance. The formula for calculating the Mahalanobis distance between variables yi and yj is shown in Formula (24).
In the formula, T−1 is the inverse matrix of the covariance matrix of variables yi and yj. When the covariance matrix is the identity matrix, the Mahalanobis distance calculation formula and the Euclidean distance calculation formula are the same. Since the covariance matrix is normalized to eliminate the influence of the dimension, it is unnecessary to normalize the initial evaluation matrix. By introducing the weight into the Mahalanobis distance calculation formula, the Mahalanobis distance between the faulty harvester, A, and the ideal solution is as follows:
For the faulty harvester, A, the Mahalanobis distance from the negative ideal solution is as follows:
Similarly, the closeness of each maintenance task is calculated by the closeness expression, which indicates that the closer the maintenance task is to the ideal solution, the higher the priority is. The final order of each maintenance task can be obtained through the closeness of each maintenance task.
4.4. Q-Learning Algorithm of BP Neural Network
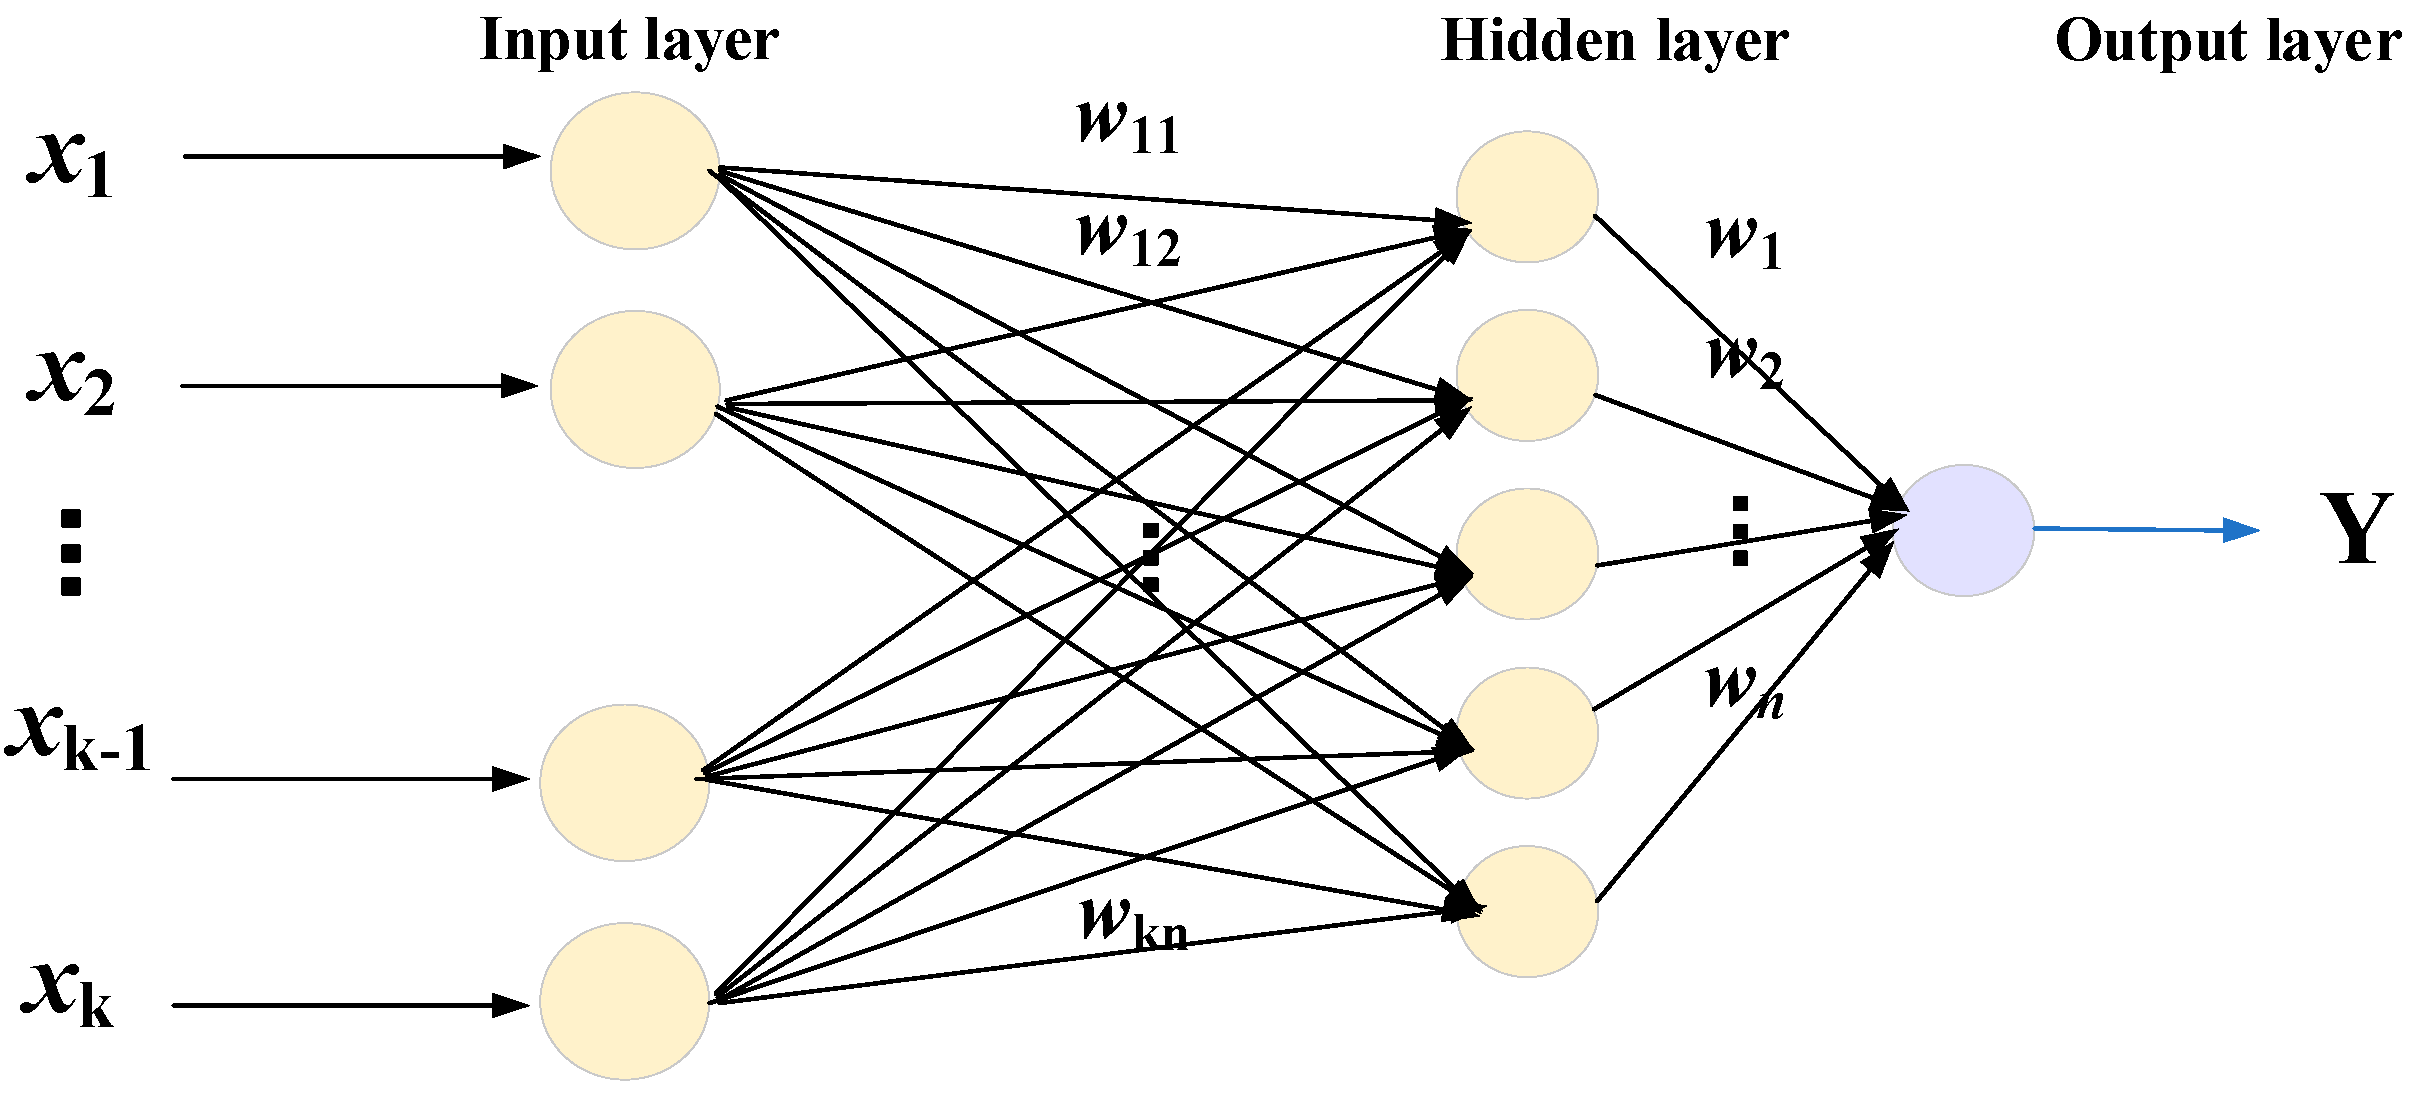
4.4.1. BP Neural Network
The BP neural network is a forward neural network with error back propagation. It usually consists of one input layer, one output layer, and one hidden layer. The output layer generally contains one neuron, and the hidden layer generally contains multiple neurons. Its structure is shown in Figure 4.
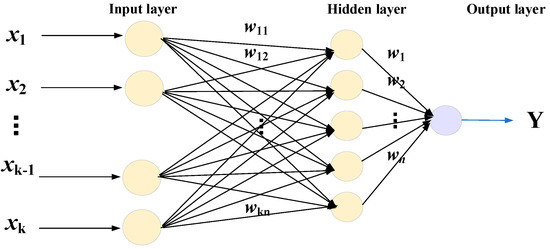
Figure 4.
BP neural network structure.
Each neuron in the hidden layer has a nonlinear sigmoid activation function. The input variable of the network is set to be Xi = [x1, x2, … xk], (I = 1, 2, …, k); the pre-output variable is Y = [y1, y2, … ym]; and the weight between the input layer and the hidden layer is wij = [w11, w12, wkn], (j = 1, 2, …, n). The weight between the hidden layer and the output layer is wj = [w1, w2, wn]. The network output formula is as follows:
4.4.2. Q-learning Algorithm
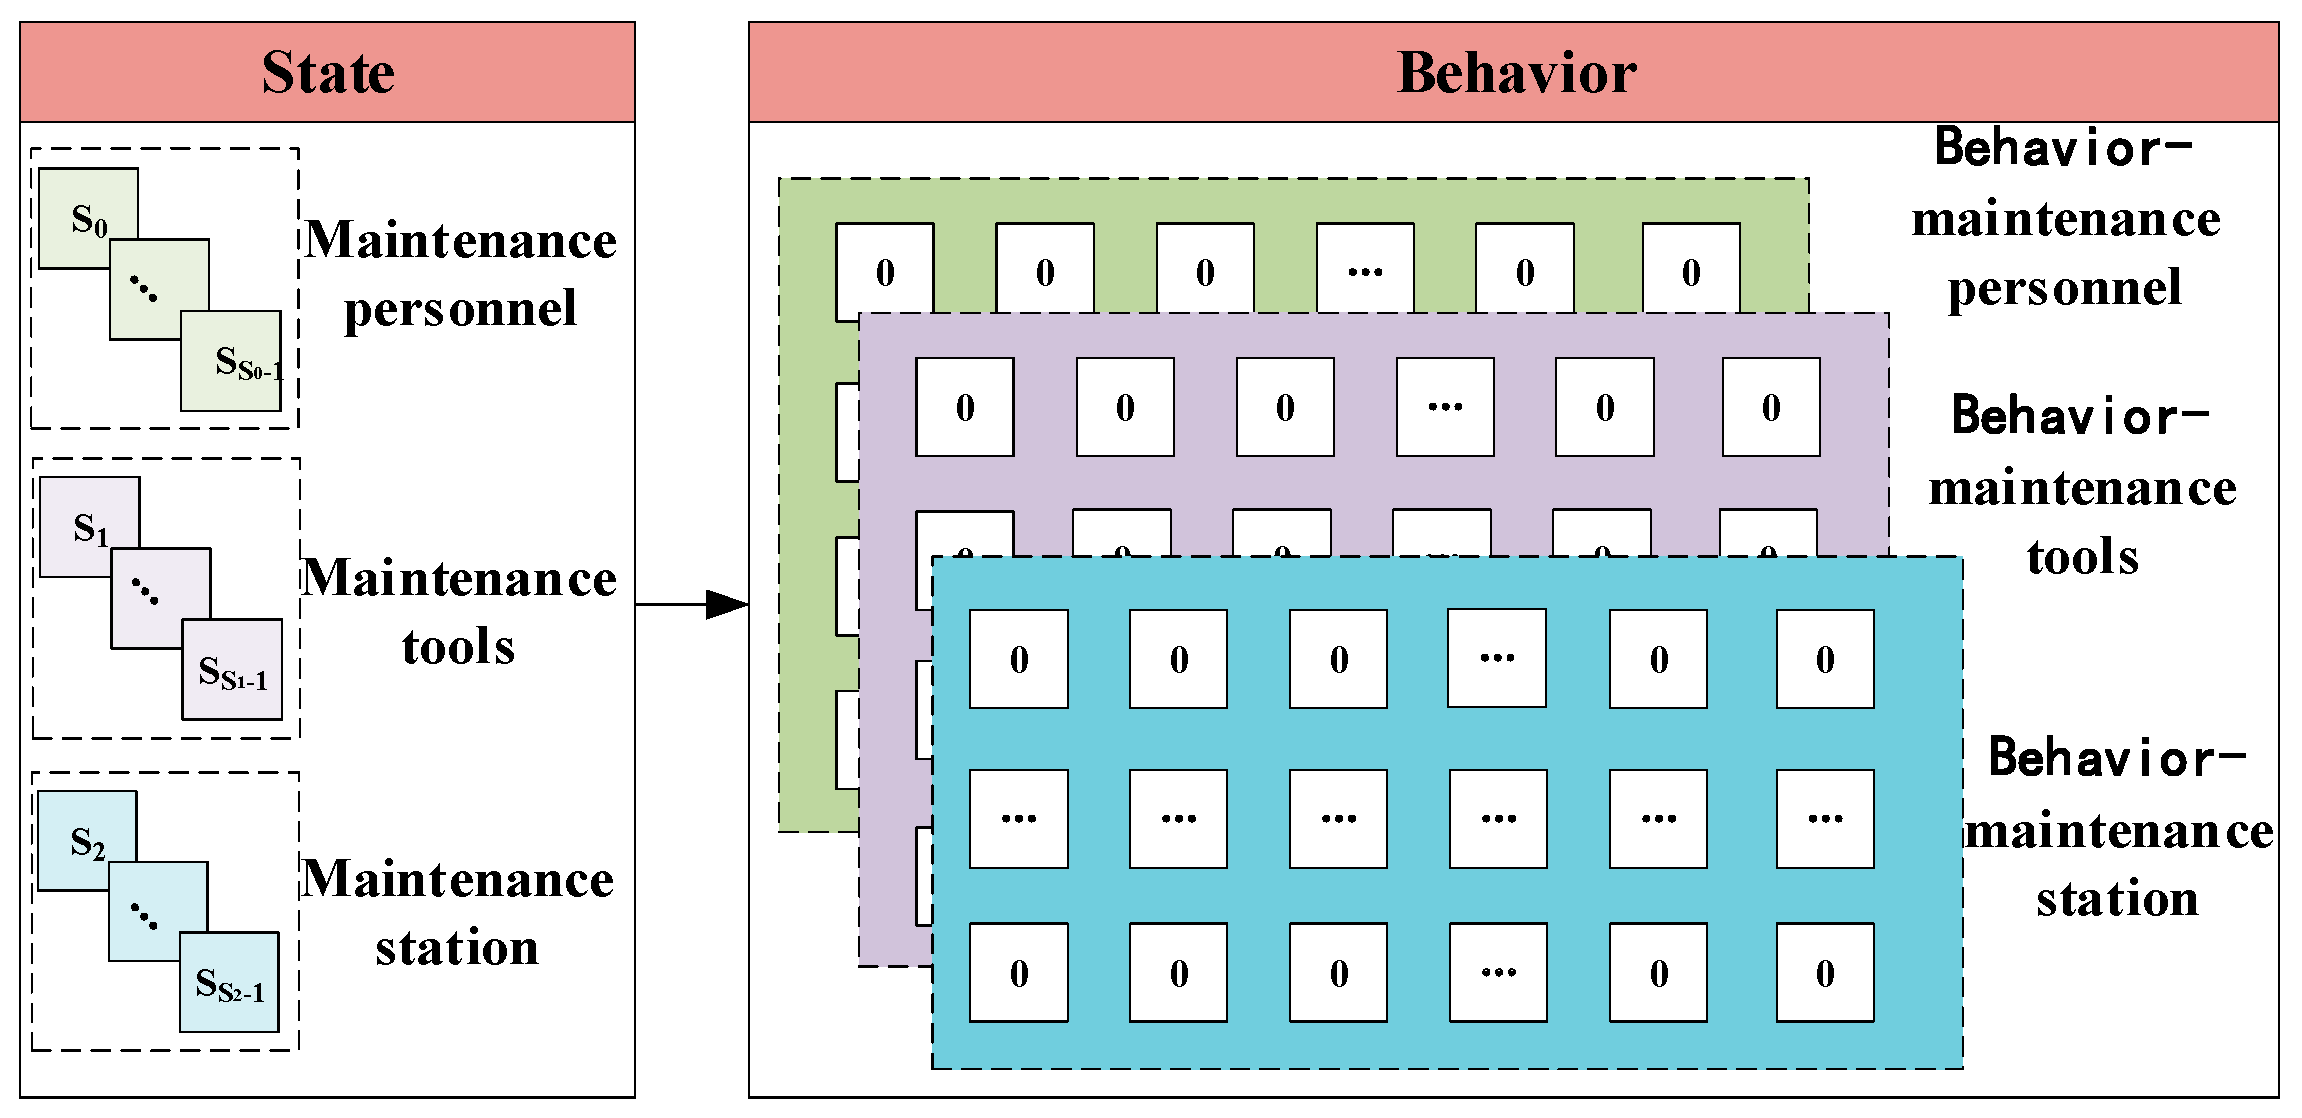
Q-learning is a classic optimization method in reinforcement learning, which has obvious advantages in dealing with decision-making problems in discrete processes. In the Q-learning algorithm, there is a Q table that records and updates the Q value of each action, in each state, and the optimal path is selected by constructing an evaluation Q matrix of state behavior. Reinforcement functions are also called reward and punishment functions. In this paper, the types of operation and maintenance resources required by the subtasks in task Zi are regarded as a state, and the personnel, tools, and spare parts are regarded as behaviors. If the operation and maintenance resources required by the current state are selected by a state, the normalized optimization target value will be given as a reward. If a resource that does not meet the current state is selected, for example, auxiliary tools or operation and maintenance personnel who do not have the necessary skills, the reward value is zero. The description of the Q matrix state behavior in this paper is shown in Figure 5 [34].

Figure 5.
Schematic diagram of state behavior description.
As a reinforcement learning technique, the Q-learning algorithm can select the maintenance service scheme by constructing the state behavior evaluation Q matrix. The advantage of the Q-learning algorithm is that there is no need to set an environmental model or a mathematical model. Through the learning of the working mode of the Q-value function, the return value of the action approaching the ideal scheme is higher for the state action. The learning factor variable ζ is introduced to balance the ratio of the current return to the long-term return in the Q-learning algorithm, and the value range of ζ is between [0, 1]. After the learning, the Q value is initialized to a fixed value, and then the agent selects at, and the balanced return is ζt, and it enters the cycle of the new state st+1. The update process of the Q value state at time t + 1 is as follows:
where λ is the learning factor, ζ is the cycle factor of the model. As an efficient iterative algorithm, if the initial value is set high, it is encouraged to increase the number of iterations, update the rules, and increase the selection probability of the other options. The dynamic scheduling of maintenance resource priority is a high-dimensional, continuous space and it is difficult for the classical Q-learning algorithm to store the state value and action value, respectively. Therefore, the classical Q-learning algorithm was improved and optimized in this paper. Based on the BP neural network function, the optimal value of the model is continuously approximated, and the feedback error value, Δμ, of the BP function is expressed as follows:
The feedback error value, Δμ, is used to adjust the weights of neurons at any time. η is the reward coefficient and corrects the error of the travel trajectory.
4.4.3. Improved Q-Learning Algorithm of BP Neural Network
In order to realize Q-learning in a continuous state and an action space, the combination of the BP neural network and the Q-learning algorithm was selected in this paper. Based on the BP-improved Q-learning algorithm, the dynamic scheduling of maintenance tasks was optimized, the Q function value was taken as a comprehensive evaluation index, the Q value table was randomly initialized, the action of the next maintenance task was selected based on the maintenance activity state, and the Q value was calculated. If the Q value in the current iteration is greater than the maximized value, a new round of learning starts at the end of the current iteration; if the Q value in the current iteration is less than the maximized value, it is urgent to optimize by iteration. The BP neural network algorithm has good generalization performance, which helps the function model to approximate the optimal solution.
The parameters of each layer of the BP network model are trained, the model weights and sample training sets are updated, and the BP neural network is used to approximate the optimal Q value. The update process is described as follows:
When the state of the maintenance task changes from st to st+1, the corresponding reward value ηt is obtained, and the learning factor variable ζ can control the efficiency and speed of learning. The closer ζ is to one, the faster the iteration efficiency of solving the Q value is, and the better the convergence performance is. The improved Q-learning algorithm, integrated with the BP neural network model has a strong generalization ability, and the calculation process of extracting the optimal solution is accurate. With the constantly updated Q value, the steps are as follows:
Step 1: The initialization parameters are set to have n tasks in the current task set and let i = 0. According to the initial Q matrix of a generated task Z0, all its elements are set to be zero.
Step 2: The scheduling problem in this paper needs to allocate operation and maintenance resources for each subtask, and the initial state of each subtask scheduling scheme is set as S0. After each step is executed, it moves to the next state Si+1.
Step 3: The distribution of the Q-value function is determined according to the Q-learning algorithm, the classical algorithm is optimized, neurons are introduced, and the appropriate activation function is determined. The search command is executed and is compared with the Q-value function table.
Step 4: The Q value of the Q-learning algorithm model is updated to determine the set of maintenance service plans.
Step 5: On the premise of ensuring the priority rules of service scheduling, the training values, with possible results, are repeatedly trained by adopting the BP algorithm in the improved Q-learning algorithm.
Step 6: The process optimization in the global scope is implemented to find the optimal scheduling scheme for each task, and then the final action sequence is output according to the Q matrix, which is the final scheduling scheme.
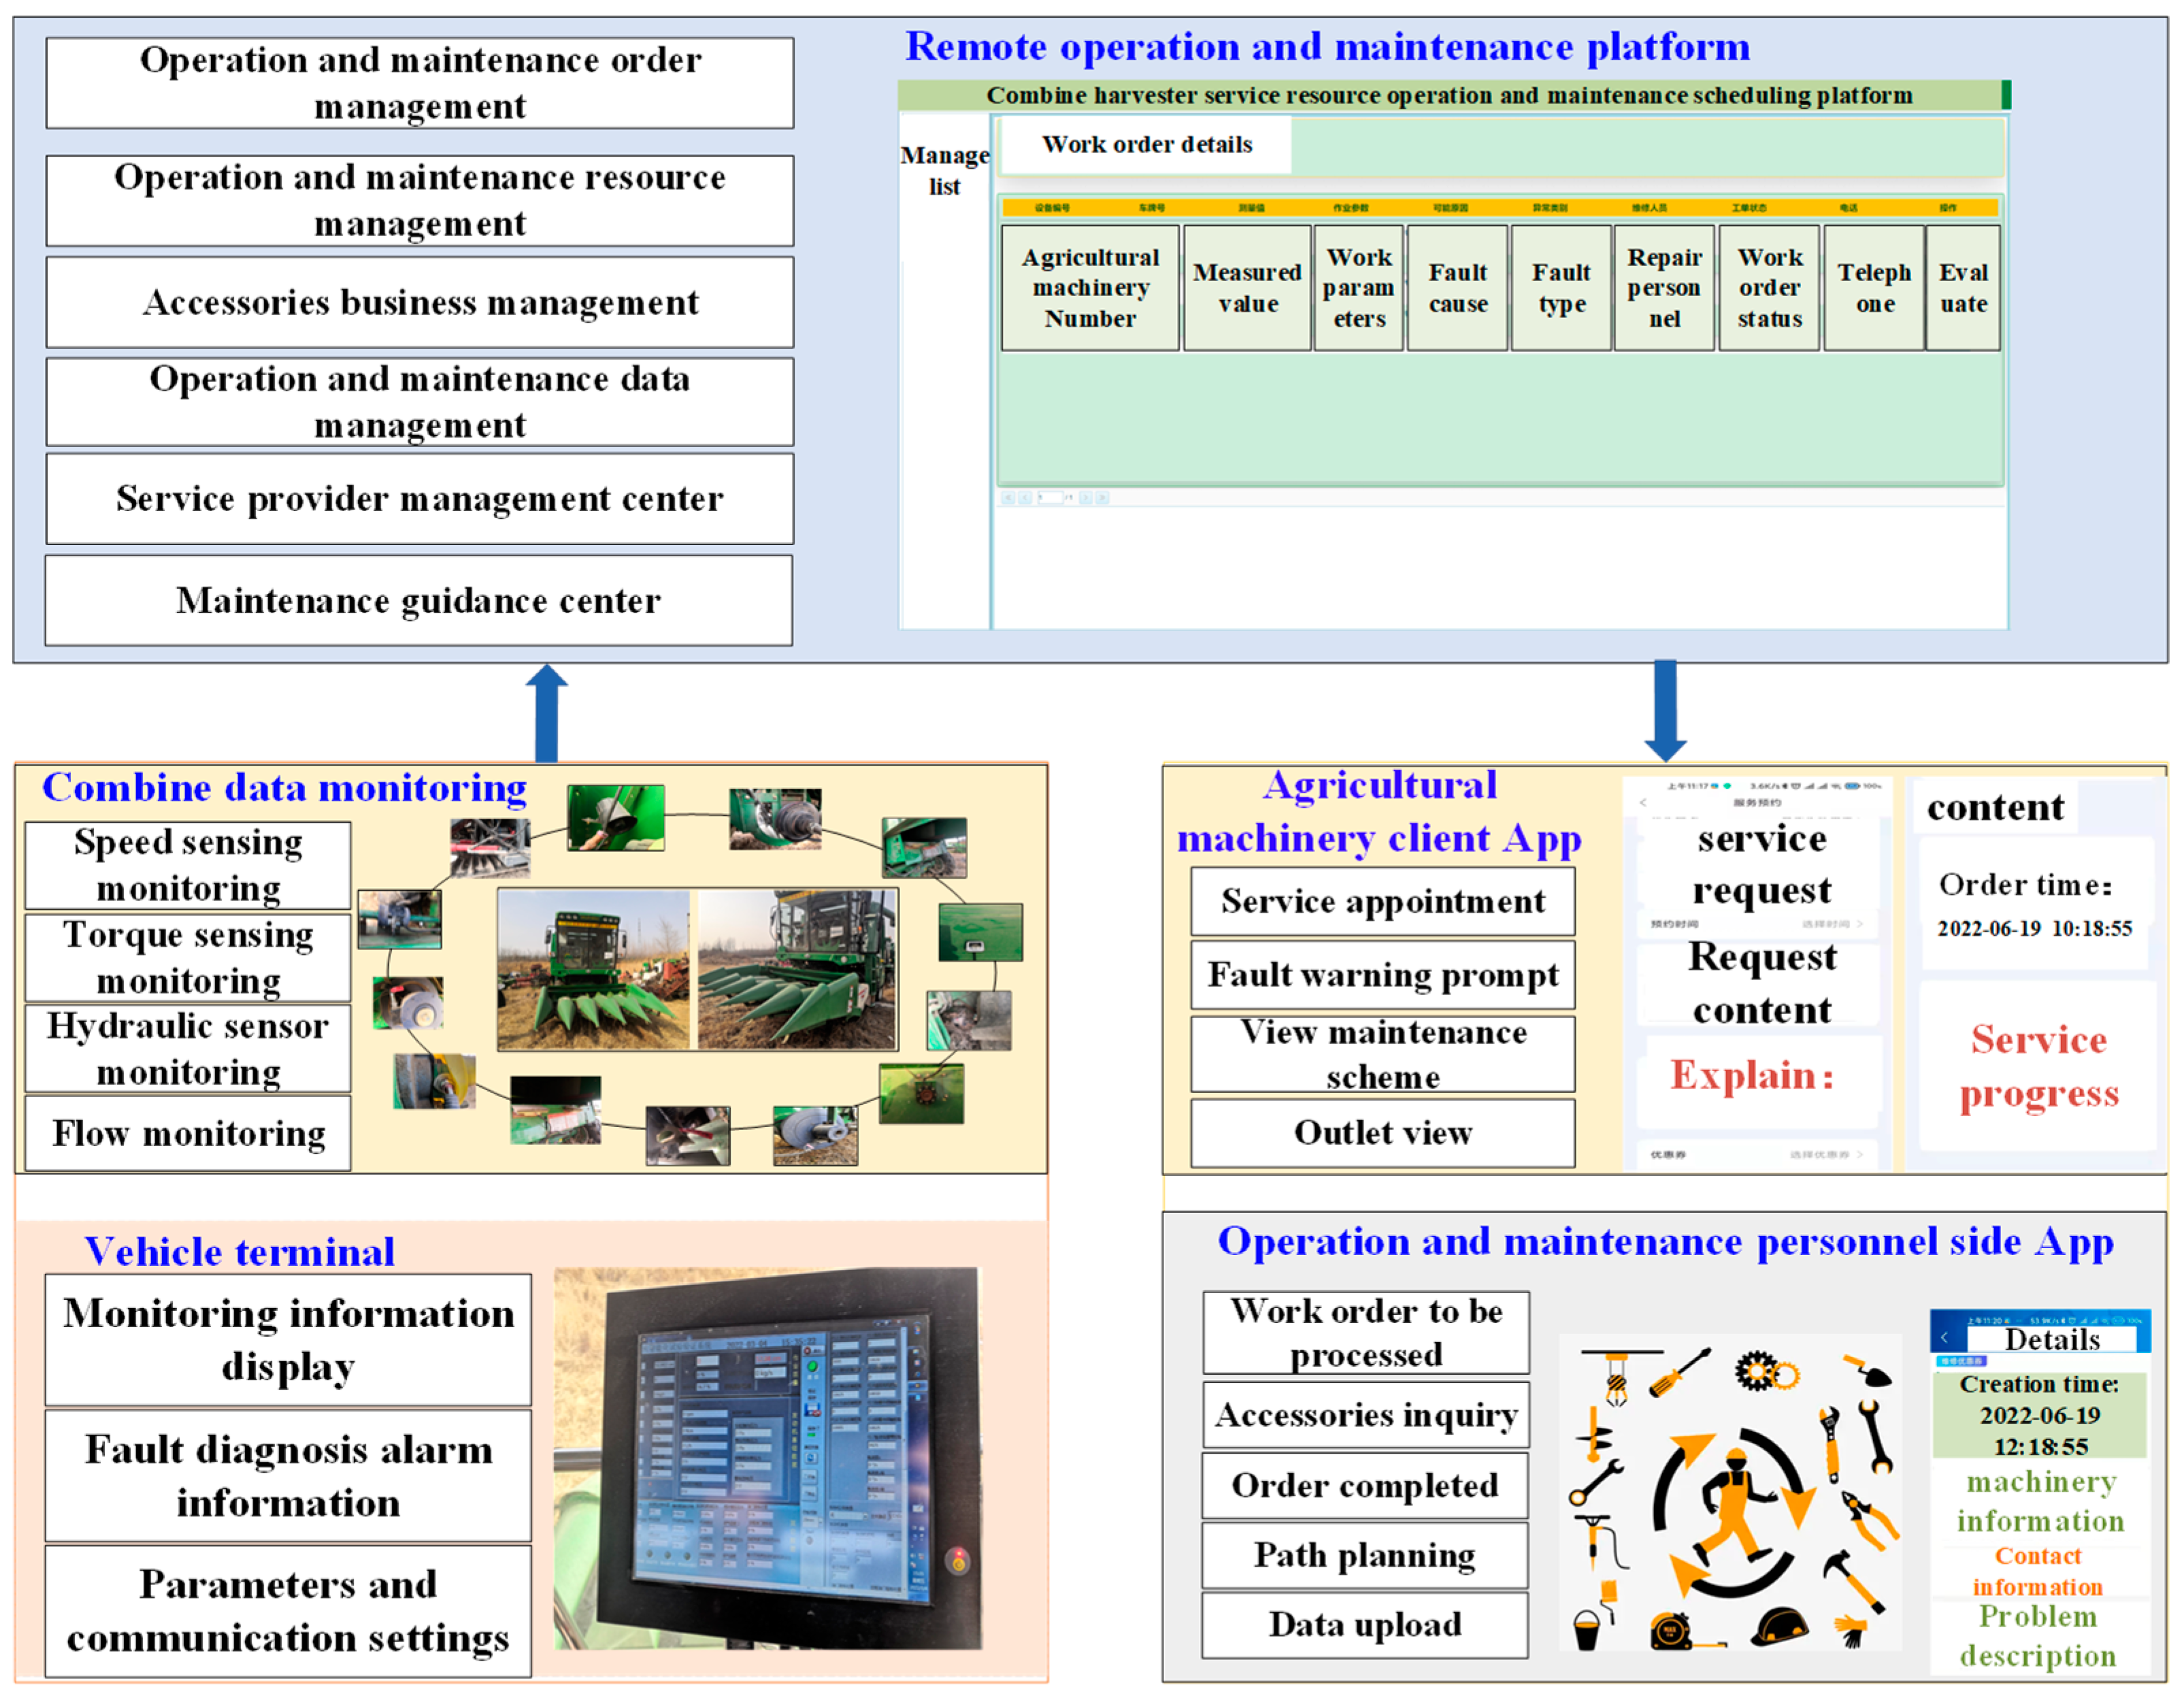
5. Comprehensive Operation and Maintenance Platform Development
The comprehensive operation and maintenance platform consisted of a combine harvester remote operation and maintenance platform, a harvester data monitoring module, and a mobile APP module. The remote operation and maintenance platform was mainly composed of the following: operation and maintenance order management, operation and maintenance resource management, spare parts business management, a service provider management center, and a maintenance guidance center, etc. This realized the functions of receiving and sending orders, managing and allocating operation and maintenance personnel and spare parts resources, and viewing and creating the information of service providers, etc. The data monitoring module included sensors to monitor harvester information, engine status information, and operation quality information, which realized the functions of real-time collection and the transmission of harvester information, and fault information alarms, etc. APPs on the application side mainly included the agricultural manipulator APP and the maintenance personnel APP. The agricultural machinery manipulator APP can realize the functions of the real-time sending of failure and maintenance requests, the viewing of maintenance plans, information search on nearby maintenance outlets and the evaluation of service maintenance. The maintenance personnel APP can view the information about the current task details, fault request information, information about the current order and pending order, information about the spare parts warehouse, the real-time uploading of maintenance data, and the best service route through positioning, etc.
During the operation, firstly, the data monitoring module obtained the failure information of the harvester, and, through the fault diagnosis function of the operation and maintenance system, the failure type of the combine harvester was obtained. According to the failure information, the maintenance plan and instructions were sent to the driver of the failed harvester. Based on the demand information given by the faulty agricultural machine operator, the order in which business was carried out in providing the maintenance activities for the agricultural machine operator, the coordinate information of the fault point, and the coordinate information of the service station were combined to generate the best service route. The instruction was sent to the service provider and to the operation and maintenance personnel, and the optimal maintenance plan was sent to the maintenance personnel’s mobile phone APP to realize the real-time data sharing and the provision of optimized route plans. The functional framework of the comprehensive, remote operation and maintenance platform is shown in Figure 6.
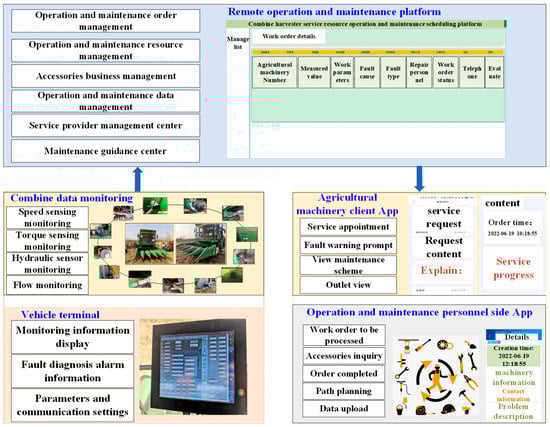
Figure 6.
Comprehensive operation and maintenance service platform.
6. Experimental Verification and Analysis
6.1. Experimental Design
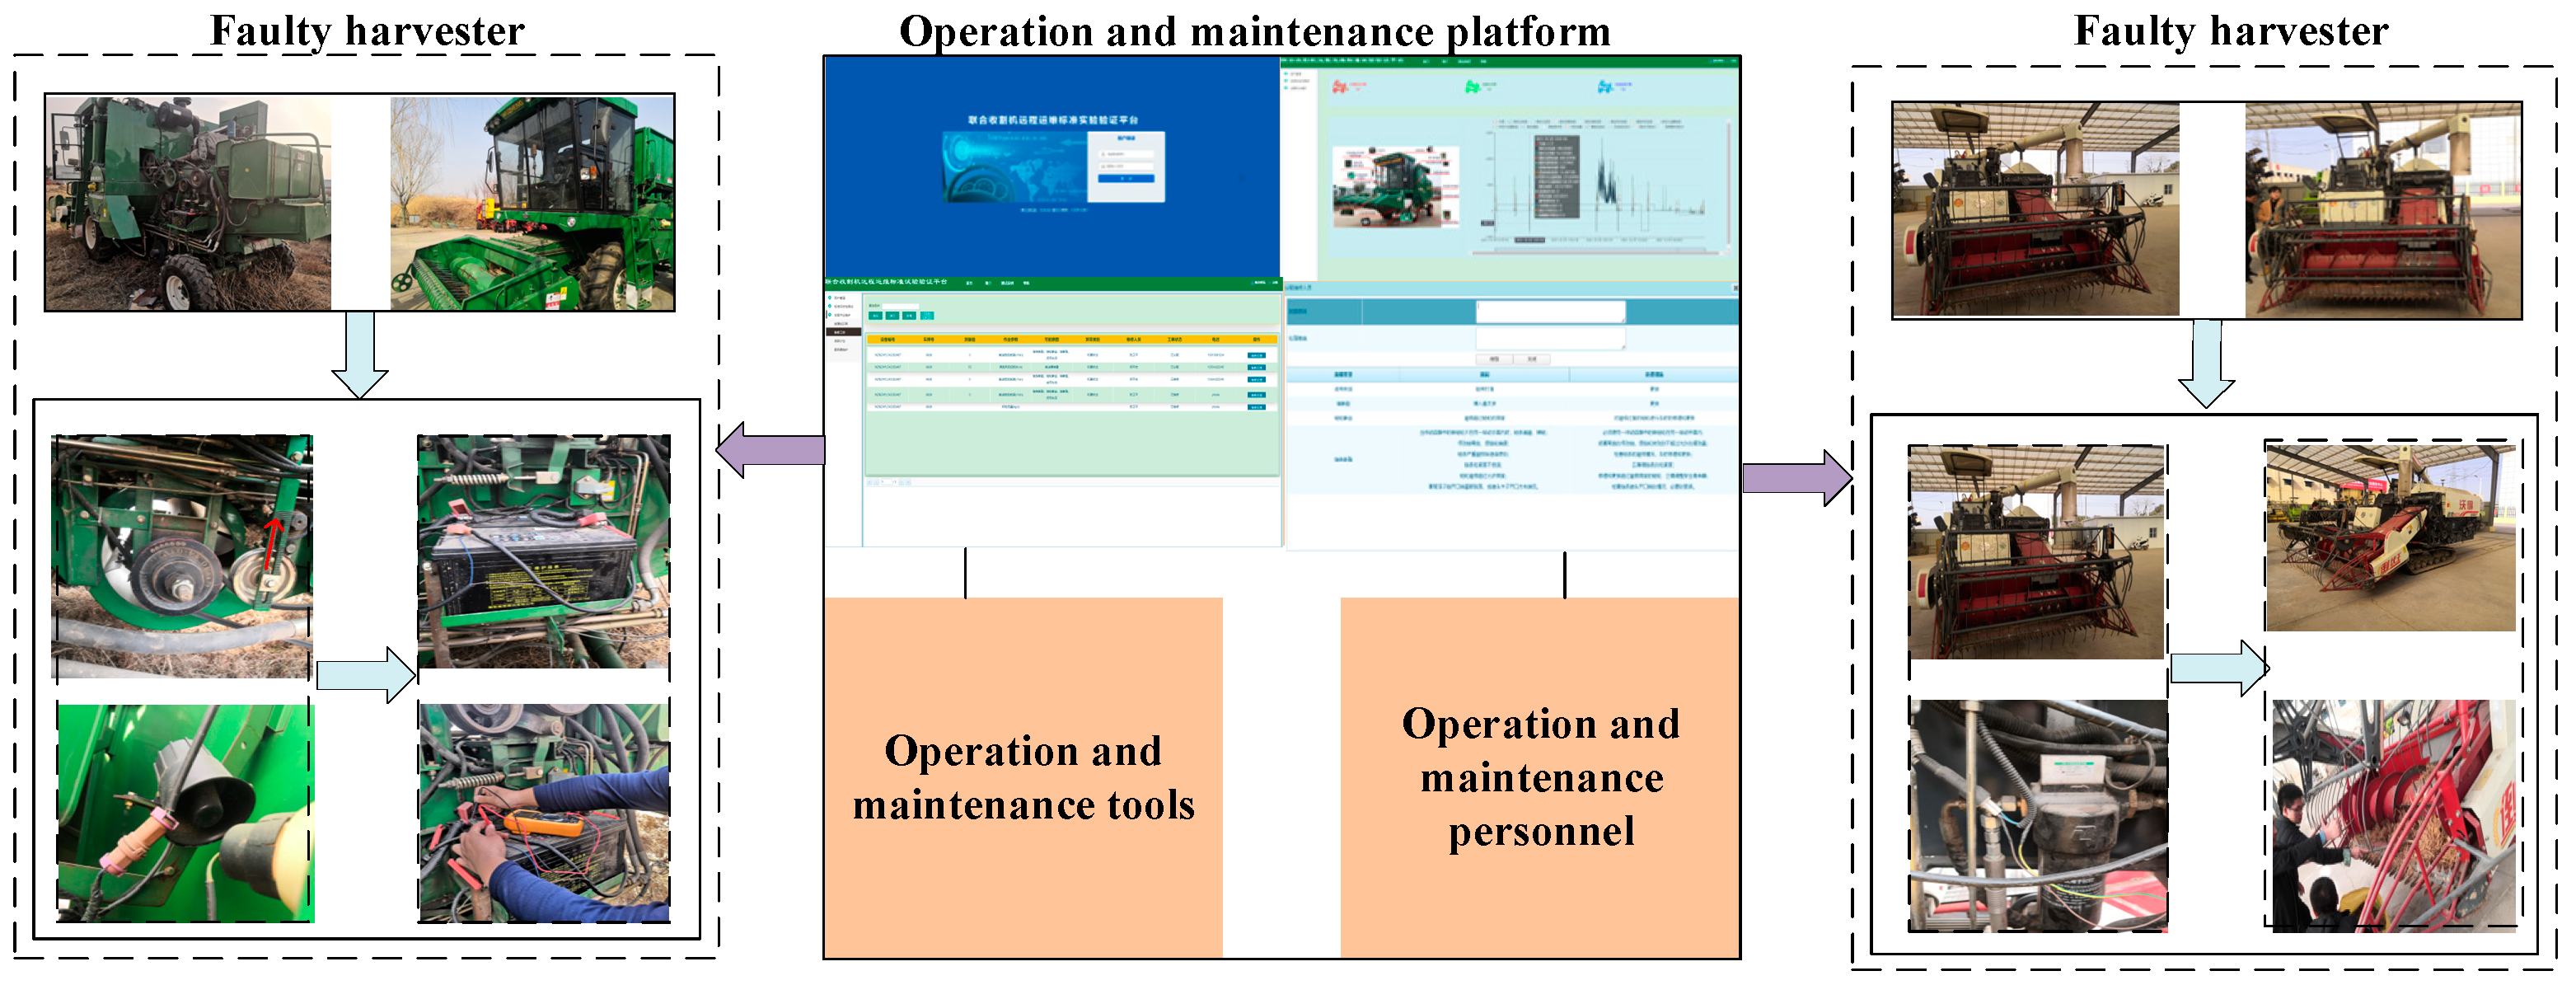
In this paper, according to the summer harvest process of “Weichai Lovol Heavy Industry Co., Ltd.” (Weifang, China) agricultural machinery, in 2021, wheat harvesters and rapeseed harvesters were involved in crop harvesting. The experimental plan was designed for the actual operation and maintenance service information in cross-regional operation, in a county of Anhui Province. The models were the Lovol 4LZ-2.5E2 wheat harvester and the Lovol Gushen GN60 (4LZ-6) self-propelled rapeseed combine harvester. The experimental scene of harvester maintenance service is shown in Figure 7. The average speed of the service vehicle driven by the maintenance service team was set to be 50 km/h. The operation and maintenance resource information in the set maintenance operation is shown in Table 1. The number of people allocated was as follows: one captain of the maintenance team, P1; one hydraulic engineer, P2; three electrical engineers, P3, P4, and P5; and three mechanical engineers P6, and P7. The information on the quantity of spare parts in two maintenance service stations was set, and two maintenance service stations and nine faulty harvesters were set. The distance between different service stations and the fault point of the harvester is shown in Table 2.
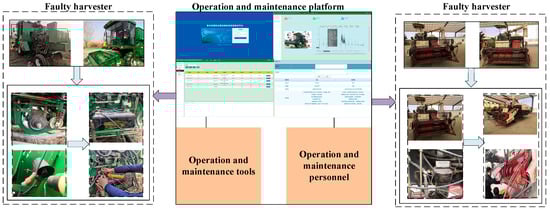
Figure 7.
Harvester maintenance service test scene.

Table 1.
Assumed operation and maintenance resource information.
Table 2.
Assumed location information of each maintenance service station and the failure point of the harvester.
The demand information for the operation and maintenance personnel, auxiliary tools, and the spare parts of the joint harvester failure is shown in Table 3. This includes the estimated time parameters, the fault level, and the type of fault for each maintenance task of the wheat harvester and rapeseed harvester, respectively.
Table 3.
Requirement information and processing time of tasks during harvester maintenance.
Table 4 shows the task information table for a certain day, including the failure urgency of the faulty model, the accepted maintenance time window requirements, and the start time of the task request. Due to the cost loss in the use of labor and tools, the corresponding cost relationship was set according to the scene. The cost of the manual maintenance process and the loss cost mainly related to the process of tool use, as shown in Table 5.
Table 4.
A day’s task and maintenance demand information table.
Table 5.
Personnel cost and tool loss cost.
6.2. Parameter Selection
All experiments were written in python 3.7 language, compiled on pyCharm, and run on an Intel(R) Core(TM) i5-8500T CPU @ 2.10 GHz 2.11 GHz Windows 10 operating system. The selection of the parameters had a certain impact on the performance of the algorithm. According to the setting information of the above experimental scheme, the task information was set in the joint harvester operation and maintenance platform system. In the process of the cross-regional operation and service, the agricultural machinery enterprises reduced the distance of the operation and maintenance in order to reduce the cost of the operation and maintenance. Therefore, the priority weights were set as ω0 = 0.5, ω1 = 0.3, and ω2 = 0.2. The weights of the optimization objectives were set as σ1 = 3, σ2 = 5, σ3 = 2, μ = 0.1, γ = 0.5, and α = 0.3, and the number of training was 500.
6.3. Validation Comparative Analysis
6.3.1. Comparison of Different Priorities
According to the time window requirements and the task reporting time, the dynamic scheduling test was carried out according to the cycle of 1 h, and the maintenance service scheduling was divided into two stages. According to the proposed BP improved TOPSIS method, the priority index of each task in each scheduling was calculated, and the closeness value of each maintenance task and the task execution sequence were obtained, as shown in Table 6.
Table 6.
Task information and combined task closeness value.
In order to compare the optimization effect of the algorithm designed with that of a single rule, the improved Q-Learning algorithm was used to solve the scheduling plan through a single rule. The final task execution order and solution optimization indicators are shown in Table 7. The order of the tasks that cannot be determined under a single rule was determined randomly, which was convenient for the algorithm to solve.
Table 7.
Average metrics for solving rules with different priorities.
By comparing the final scheduling scheme that was solved by a single rule, with the final scheduling scheme that was solved by the BP-improved TOPSIS method, after combination priority sorting, it was proved that the dynamic scheduling combined priority rules in this paper can improve the task execution efficiency, to a certain extent, and significantly reduce the task execution and transportation costs.
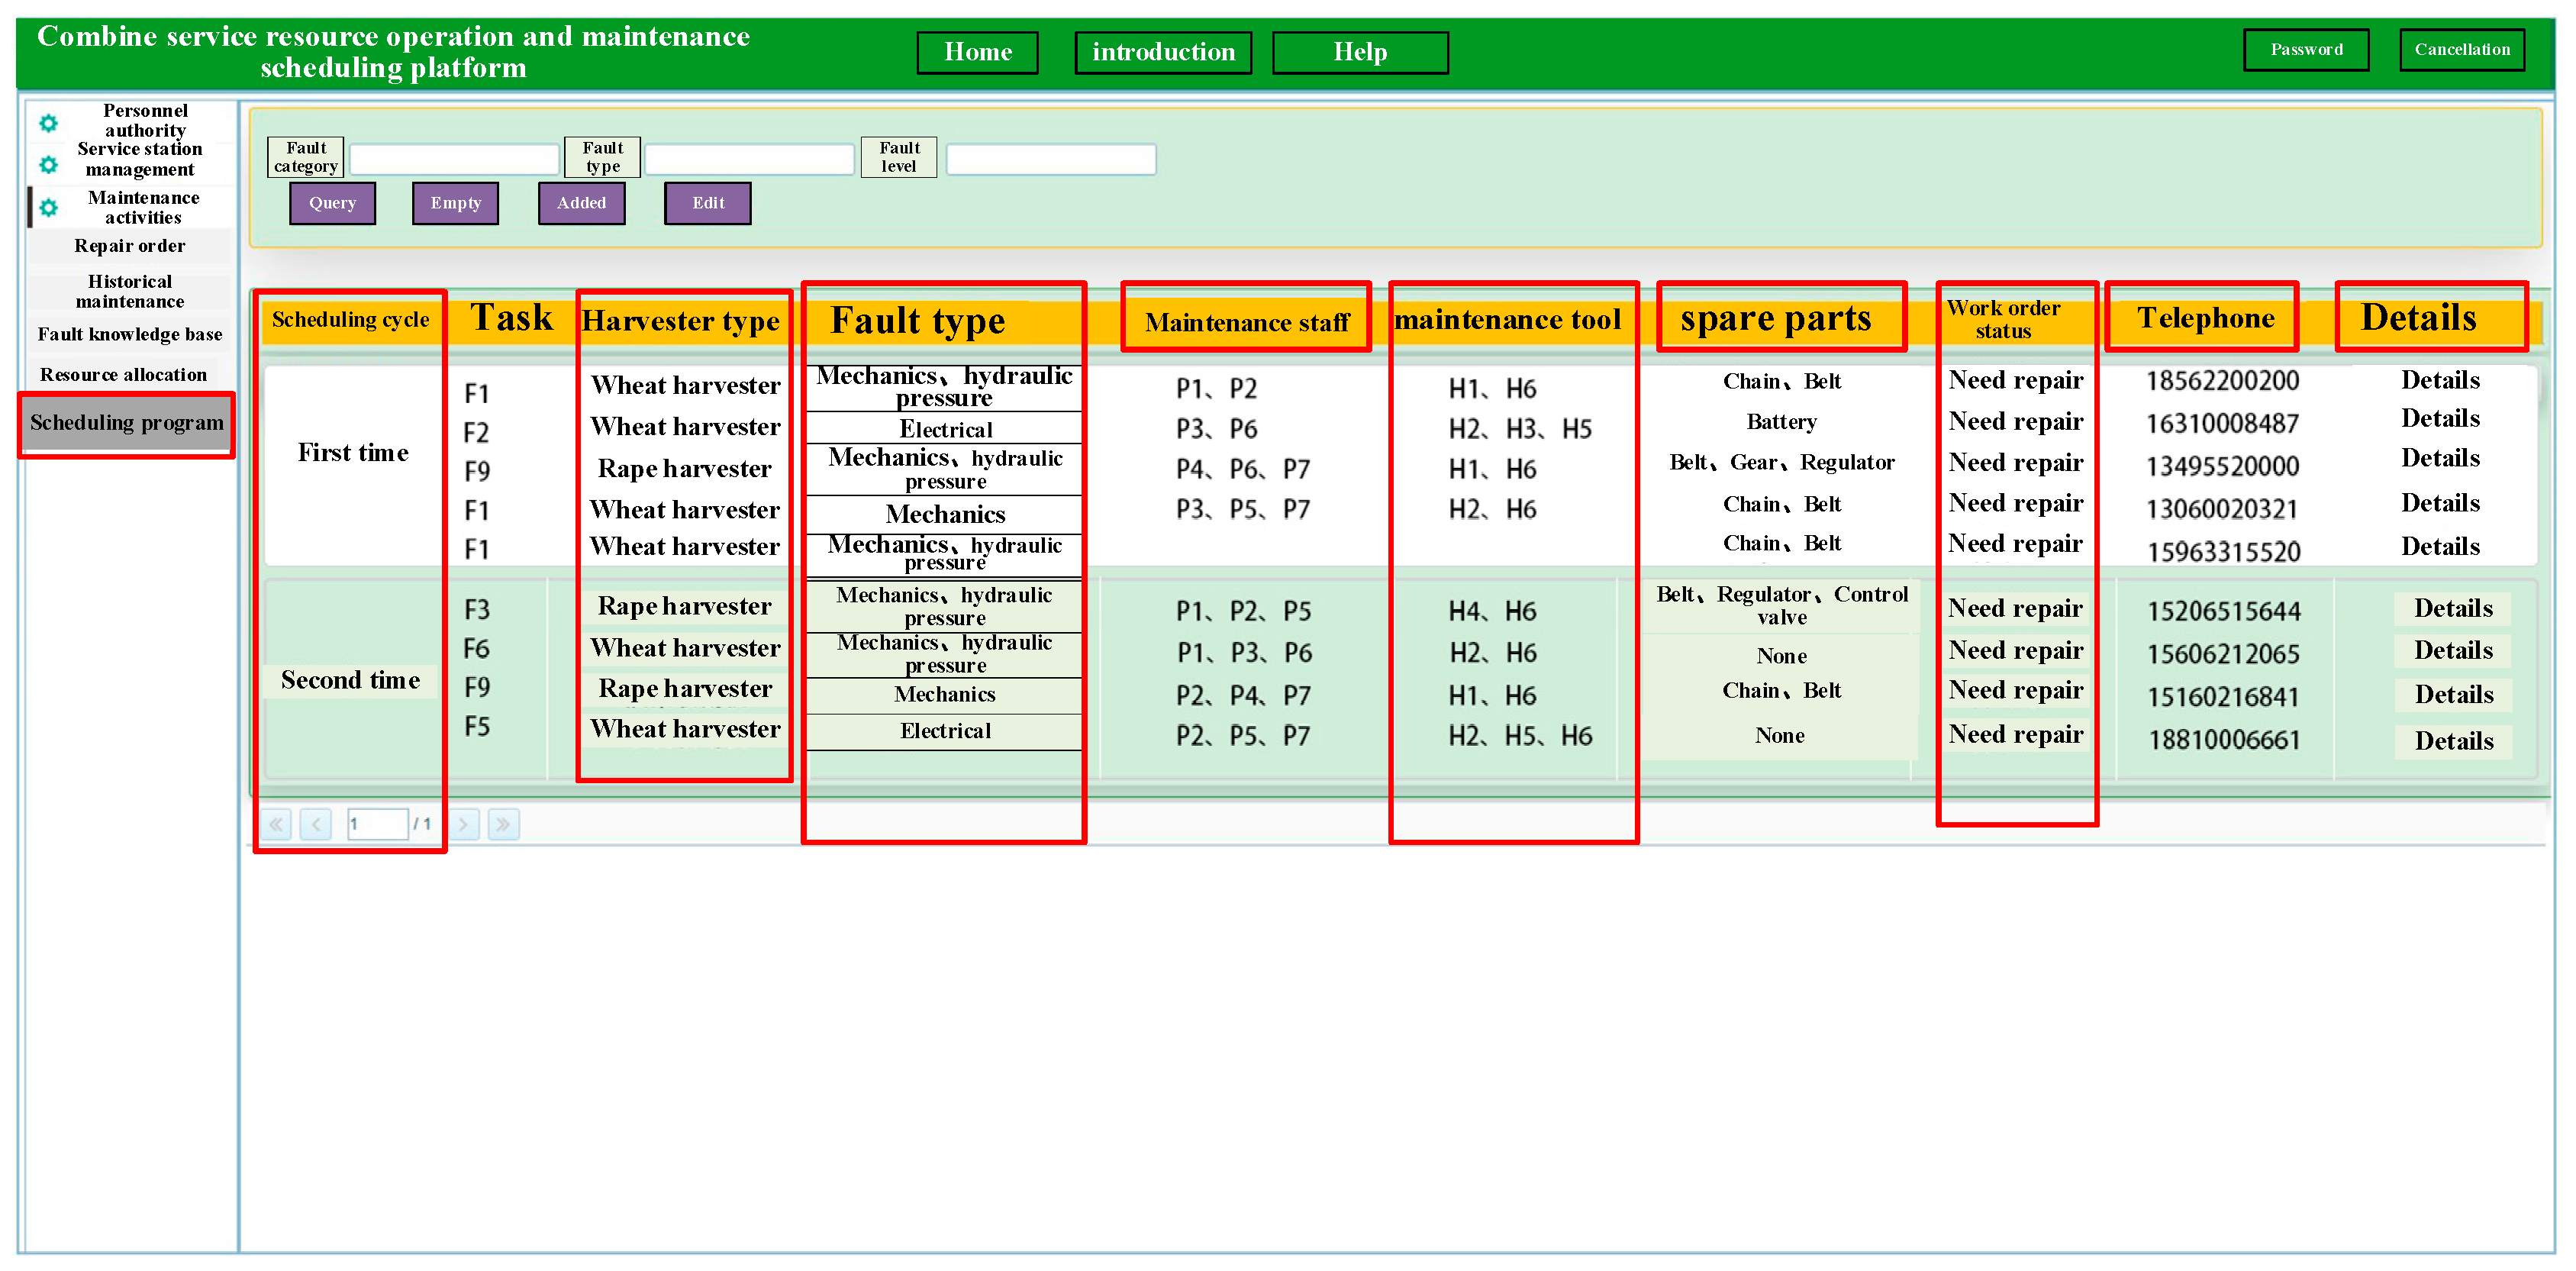
According to the maintenance task information, the combined optimization rules were used to obtain the optimal scheduling maintenance plan of the operation and maintenance platform. As shown in Figure 8, the scheduling tasks and resource allocation information can be seen.
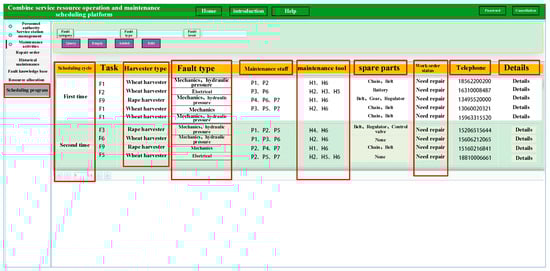
Figure 8.
Final scheduling scheme.
6.3.2. Comparison of Different Algorithms
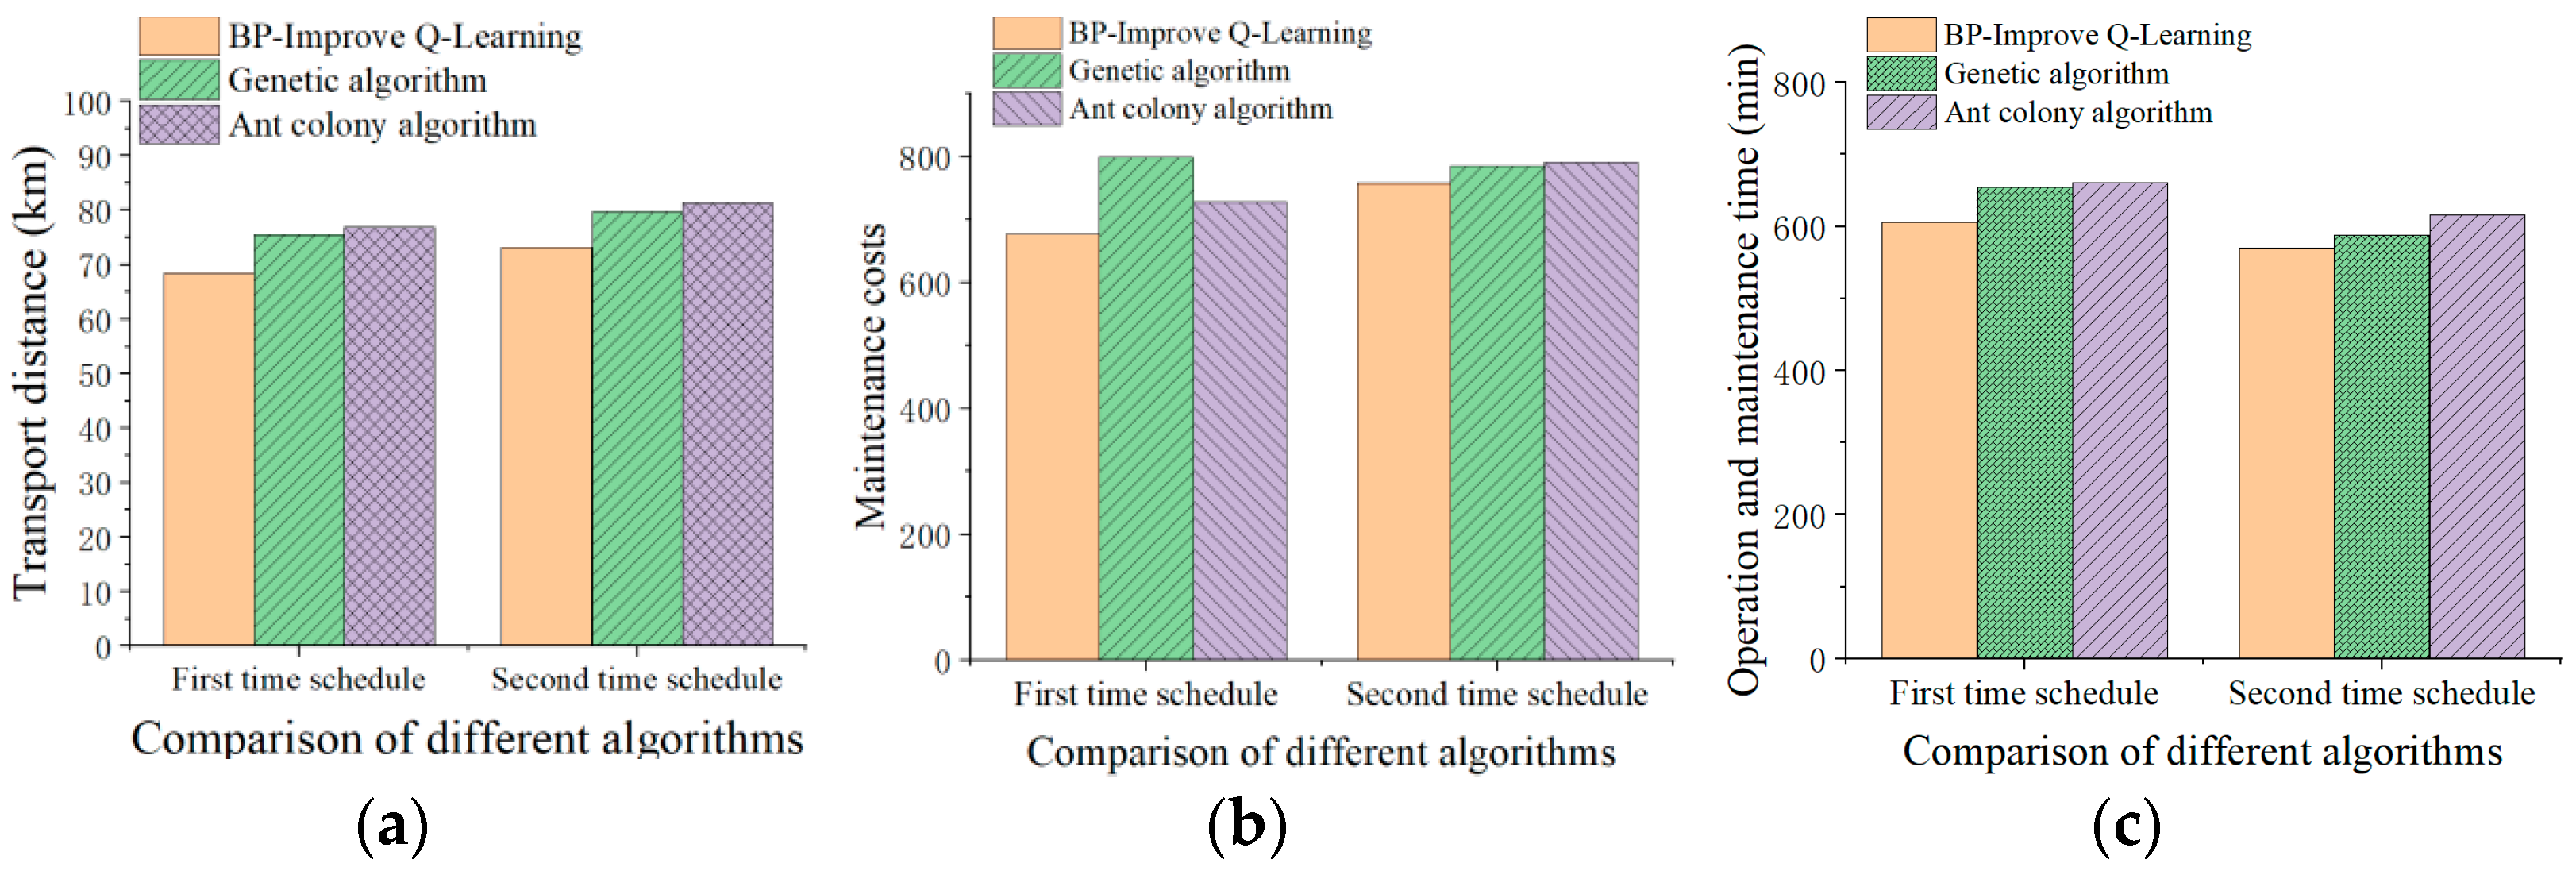
According to the above algorithm parameter configuration, the solving algorithm, the genetic algorithm, and the ant colony algorithm were also selected in this paper for comparative analysis. Each time the scheduling was triggered, the genetic algorithm, the ant colony algorithm, and the improved Q-Learning algorithm were used, respectively. By scheduling two tasks, their optimization effects were compared in terms of operation and maintenance distance, operation and maintenance cost, and operation and maintenance time, as shown in Figure 9.
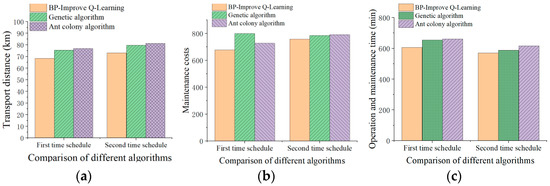
Figure 9.
Comparison of optimization performance of maintenance objectives of different algorithms. (a) Solved transport distance comparison. (b) Solved maintenance cost comparison. (c) Solved repair time comparison.
Under the same maintenance task conditions, three algorithms were used to compare the operation and maintenance time, the operation and maintenance cost, and the operation and maintenance distance. In the two scheduling processes, Figure 9a shows that the operation and maintenance distance of the algorithm proposed in this study is shorter, which can reduce the distance and improve the operation and maintenance efficiency. Both are lower than the compared algorithms and can complete the task in a shorter distance. Figure 9b refers to the comparison of the operation and maintenance costs of the three algorithms, under the two schedules. The proposed algorithm can complete the maintenance task at a lower cost. Figure 9c shows that the operation and maintenance cost and the time of the algorithm in this study are better than other algorithms. Therefore, the improved Q-learning algorithm is the algorithm with the strongest comprehensive performance among the three algorithms.
6.3.3. Application Validation
Cross-regional operation and maintenance service is a mobile service team or a service station, which is responsible for the maintenance of agricultural machinery for cross- regional operations in a region. Due to the cross-regional operation of agricultural machinery, according to the season and fruit maturity, under certain, special circumstances, the harvesters work intensively. This results in a substantial increase in failure rates and more maintenance requirements. There may be a large number of failure situations and orders coming in at any one point. Therefore, the performance of this algorithm was verified through examples. A large number of centralized maintenance demand orders were received at a certain time. The specific information is shown in Table 8.
Table 8.
Instance task information.
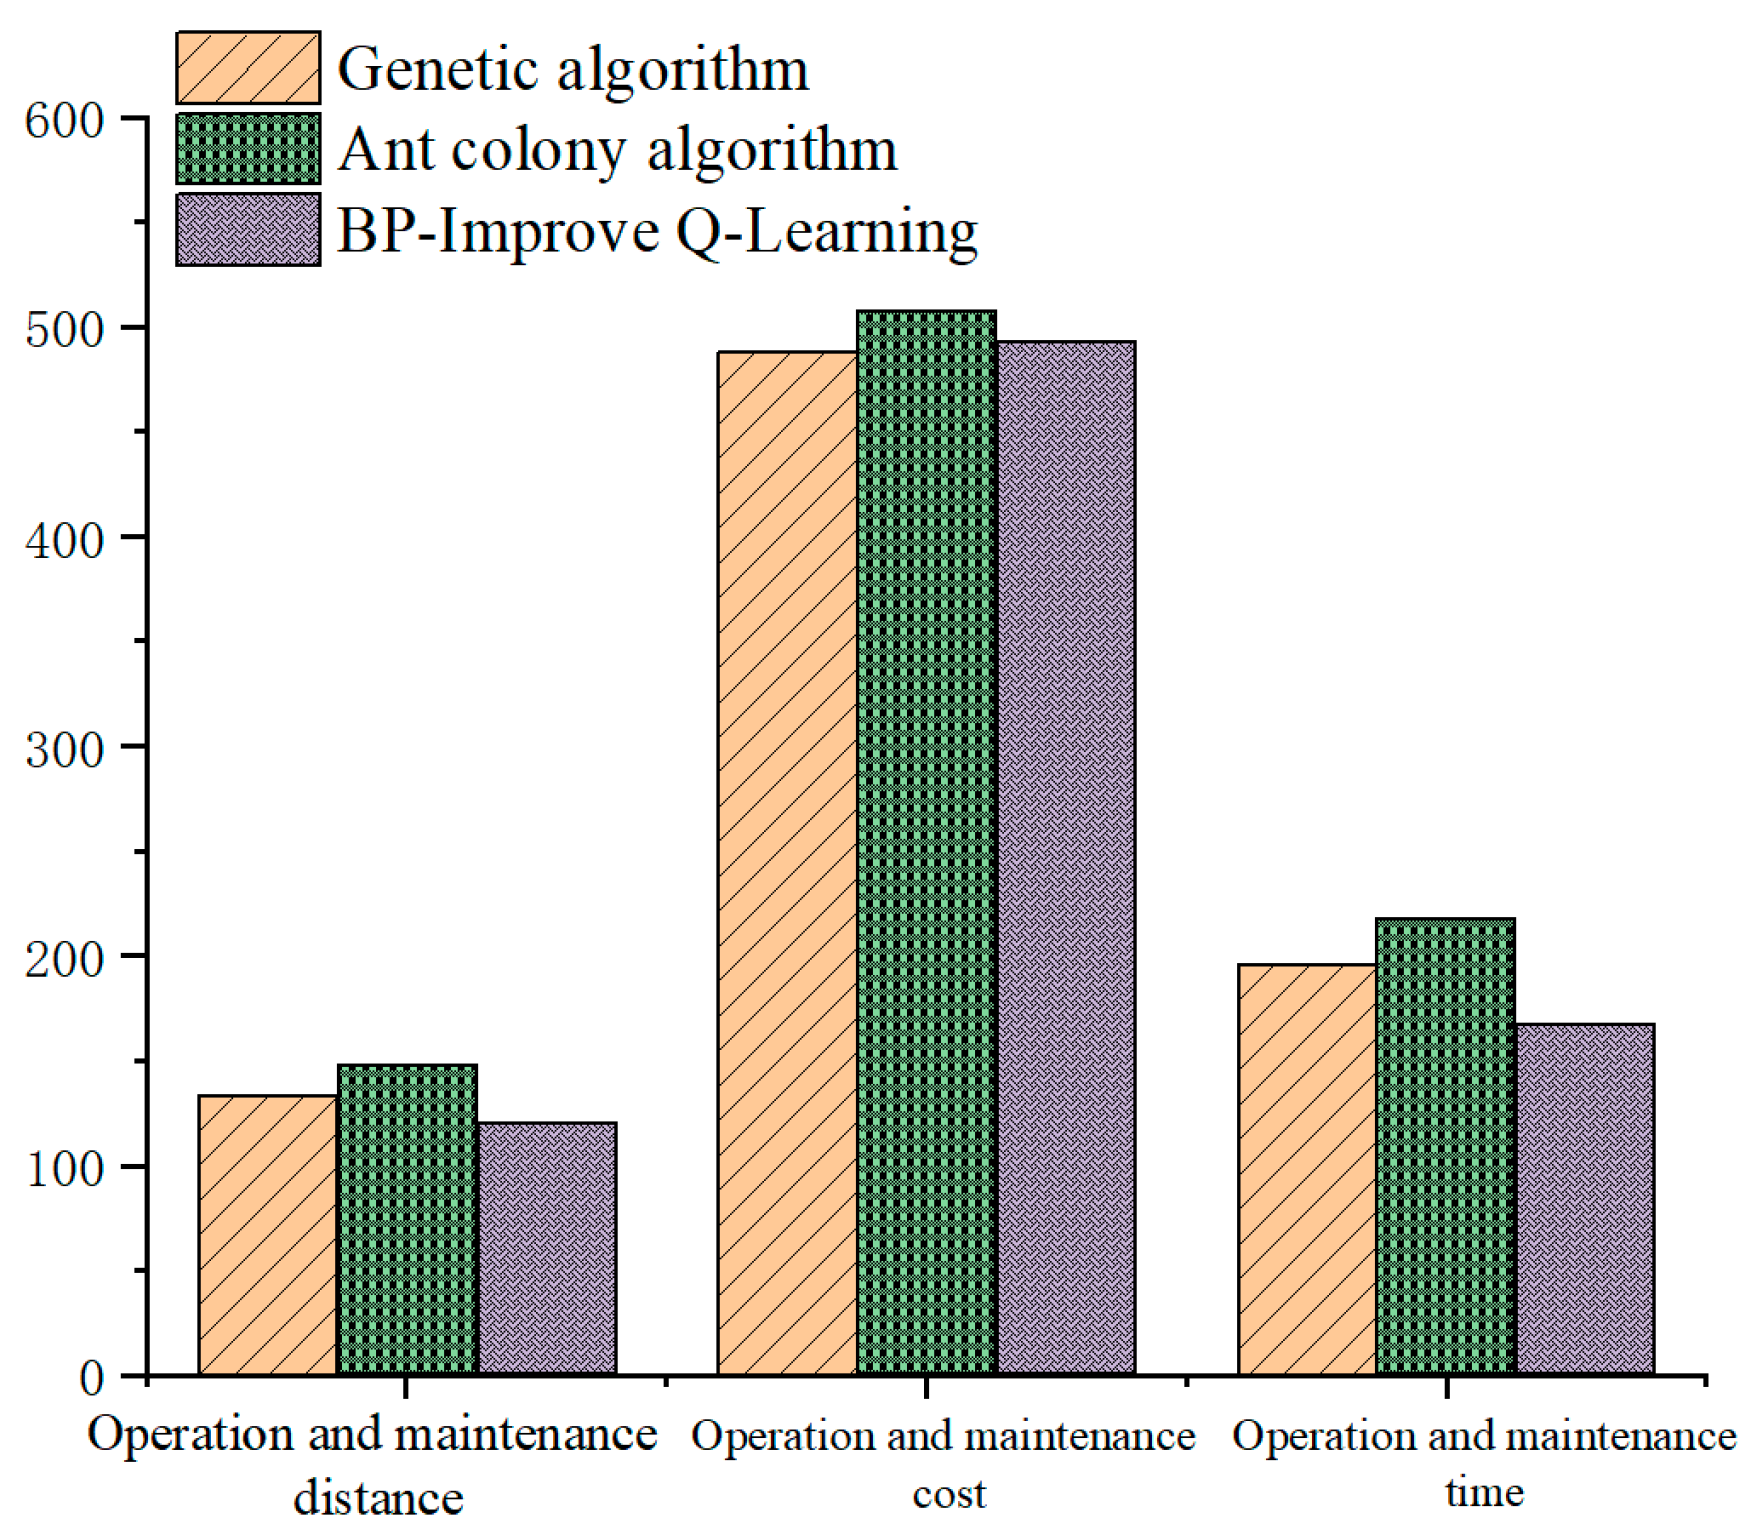
According to the priority rule, the priority order of tasks should be F3→F5→F1→F2→F4. The parameter setting of the algorithm is unchanged, and three algorithms are used to solve the problem, respectively. The verification results of the example are shown in Figure 10.

Figure 10.
Comparison of example verification.
It can be seen from Figure 10, that in the verification of the operation and maintenance distance and the operation and maintenance time, the algorithm proposed in this study achieved better results than the comparison algorithm, making the operation and maintenance distance the lowest and the operation and maintenance time the shortest. In the verification process of the operation and maintenance cost, it can be seen that the cost of the algorithm proposed in this paper is slightly higher than that of the genetic algorithm. In the practical example, the cost can be reduced to a lower level by adding a little operation and maintenance time. Finally, it can be seen that compared with the other two algorithms, the Q-learning algorithm has obvious advantages and can guarantee the completion efficiency of tasks.
7. Conclusions
- (1)
- The Q-learning algorithm is a type of enhanced algorithm, with real-time online learning ability, which can effectively adapt to the changes of the system operating environment, and can assign maintenance tasks in real time, in combination with the scene. In this study, the algorithm was improved, and the Q-learning algorithm of the BP neural network was used to solve the continuous state problems and to improve the data training ability and the generalization performance of the algorithm. Through the analysis of cost, time, and distance, it was verified that the method proposed in this paper can improve the execution path, to a certain extent, and can significantly reduce the task cost and shorten the transportation distance.
- (2)
- The practical problem was abstracted as a mathematical model, and a dynamic multi-objective solution algorithm that was suitable for the model was put forward, and was verified by calculation examples, with a practical application background. The improved Q-Learning algorithm solved the dynamic scheduling model of this paper very effectively and was stable. According to the historical operation and maintenance data of Lovol agricultural machinery enterprises, a verification and comparative analysis was carried out. The verification proved that the operation and maintenance platform developed in this study and the proposed scheduling method can reasonably allocate operation and maintenance resources, reduce operation and maintenance costs, and improve task completion efficiency.
- (3)
- A comprehensive operation and maintenance system platform for combine harvesters was developed in this study, which provided an intelligent information reference for cross-regional operation scenarios for agricultural machinery. The operation and maintenance system platform systematically combined harvester operation information monitoring, operation fault diagnosis, remote operation and maintenance, and service planning, and it effectively solved the organized and intelligent service in the post-regional market, as it can support the reasonable planning of the entire operation scene and provide an effective reference for cross-regional operations.
- (4)
- The service station was taken as a fixed location in this paper, and the task demand order was taken as a dynamic factor to carry out the research. According to the agricultural machinery maintenance scenario, it belonged to fixed-point maintenance. Since the maintenance scenarios included accompanying repair, itinerary repair, and fixed-point repair, in the follow-up research, the accompanying service mode of dynamic maintenance service points and the study of the service network location could be considered to improve the cross-regional maintenance service scheduling method for combine harvesters. According to the different service requirements, the dynamic maintenance service station can quickly respond to the maintenance services and other issues.
Author Contributions
In the research of this article. Conceptualization, W.Z. and B.Z.; methodology, W.Z. and F.W.; writing—original draft, W.Z. and F.W.; funding acquisition, L.Z.; project administration, W.Z. and L.Z.; formal analysis, W.Z. and J.W.; investigation, K.N.; software platform, W.Z. and C.Q.; data curation and software visualization, W.Z. and F.W. All authors have read and agreed to the published version of the manuscript.
Funding
The work was sponsored by the National Key R&D Program Project (2020YFB1709603) and the Intelligent Manufacturing Comprehensive Standardization Project (No. 2018GXZ1101011).
Institutional Review Board Statement
Not applicable.
Informed Consent Statement
Not applicable.
Data Availability Statement
Not applicable.
Conflicts of Interest
The authors declare no conflict of interest.
References
- Chenbo, X.; Guangyou, Y.; Lang, L.; Jing, L.; Xuehai, C. Operation faults monitoring of combine harvester based on SDAE-BP. Trans. Chin. Soc. Agric. Eng. (Trans. CSAE) 2020, 36, 46–53. [Google Scholar]
- Zhou, K.; Leck Jensen, A.; Sørensen, C.G.; Busato, P.; Bothtis, D.D. Agricultural operations planning in fields with multiple obstacle areas. Comput. Electron. Agric. 2014, 109, 12–22. [Google Scholar] [CrossRef]
- Haffar, I. “SPAM”: A computer model for management of spare-parts inventories in agricultural machinery dealerships. Comput. Electron. Agric. 1995, 12, 323–332. [Google Scholar] [CrossRef]
- Banerjee, S.; Punekar, R.M. A sustainability-oriented design approach for agricultural machinery and its associated service ecosystem development. J. Clean. Prod. 2020, 264, 121642. [Google Scholar] [CrossRef]
- He, P.; Li, J. A joint optimization framework for wheat harvesting and transportation considering fragmental farmlands. Inf. Process. Agric. 2021, 8, 1–14. [Google Scholar] [CrossRef]
- Chaabane, K.; Khatab, A.; Diallo, C.; Aghezzaf, E.H.; Venkatadri, U. Integrated imperfect multimission selective maintenance and repairpersons assignment problem. Reliab. Eng. Syst. Saf. 2020, 199, 106895. [Google Scholar] [CrossRef]
- Jiang, Y.; Hao, K.; Cai, X.; Ding, Y. An improved reinforcement-immune algorithm for agricultural resource allocation optimization. J. Comput. Sci. 2018, 27, 320–328. [Google Scholar] [CrossRef]
- Achillas, C.; Bochtis, D.; Aidonis, D.; Marinoudi, V.; Folinas, D. Voice-driven fleet management system for agricultural operations. Inf. Process. Agric. 2019, 6, 471–478. [Google Scholar] [CrossRef]
- Worasan, K.; Sethanan, K.; Pitakaso, R.; Moonsri, K.; Nitisiri, K. Hybrid particle swarm optimization and neighborhood strategy search for scheduling machines and equipment and routing of tractors in sugarcane field preparation. Comput. Electron. Agric. 2020, 178, 105733. [Google Scholar] [CrossRef]
- Du, X.; Ji, J.; Jin, X.; Li, C.; Yang, X. Research on divider losses with high-speed photography for foxtail millet harvesting. Future Gener. Comput. Syst. 2018, 88, 55–60. [Google Scholar] [CrossRef]
- Chen, J.; Zhou, H.; Hu, H.; Song, Y.; Gifu, D.; Li, Y.; Huang, Y. Research on agricultural monitoring system based on convolutional neural network. Future Gener. Comput. Syst. 2018, 88, 271–278. [Google Scholar] [CrossRef]
- Tripathi, A.; Pathak, I.; Vidyarthi, D.P. Integration of analytic network process with service measurement index framework for cloud service provider selection. Concurr. Comput. Pract. Exp. 2017, 29, e4144. [Google Scholar] [CrossRef]
- Sharma, A.; Cholda, P.; Kumar, R.; Dhiman, G. Risk-aware optimized quickest path computing technique for critical routing services. Comput. Electr. Eng. 2021, 95, 107436. [Google Scholar] [CrossRef]
- Al-Refaie, A.; Al-Shalaldeh, H.; Lepkova, N. Proposed Procedure for Optimal Maintenance Scheduling under Emergent Failures. J. Civ. Eng. Manag. 2020, 26, 396–409. [Google Scholar] [CrossRef]
- Rupnik, R.; Kukar, M.; Vračar, P.; Košir, D.; Pevec, D.; Bosnić, Z. AgroDSS: A decision support system for agriculture and farming. Comput. Electron. Agric. 2019, 161, 260–271. [Google Scholar] [CrossRef]
- Seyyedhasani, H.; Dvorak, J.S. Using the Vehicle Routing Problem to reduce field completion times with multiple machines. Comput. Electron. Agric. 2017, 134, 142–150. [Google Scholar] [CrossRef]
- Wang, N.; Ren, S.; Liu, Y.; Yang, M.; Wang, J.; Huisingh, D. An active preventive maintenance approach of complex equipment based on a novel product-service system operation mode. J. Clean. Prod. 2020, 277, 123365. [Google Scholar] [CrossRef]
- Mourtzis, D.; Angelopoulos, J.; Panopoulos, N. Design and Development of an Edge-Computing Platform towards 5G Technology Adoption for Improving Equipment Predictive Maintenance. Procedia Comput. Sci. 2022, 200, 611–619. [Google Scholar] [CrossRef]
- Zhu, Q.; Chen, M.; Feng, B.; Zhou, Y.; Li, M.; Xu, Z.; Ding, Y.; Liu, M.; Wang, W.; Xie, X. Optimized Spatiotemporal Data Scheduling Based on Maximum Flow for Multilevel Visualization Tasks. ISPRS Int. J. Geo-Inf. 2020, 9, 518. [Google Scholar] [CrossRef]
- Hu, Y.; Liu, Y.; Wang, Z.; Wen, J.; Li, J.; Lu, J. A two-stage dynamic capacity planning approach for agricultural machinery maintenance service with demand uncertainty. Biosyst. Eng. 2020, 190, 201–217. [Google Scholar] [CrossRef]
- Bin Kamilin, M.H.; Bin Ahmadon, M.A.; Yamaguchi, S. Multi-Task Learning-Based Task Scheduling Switcher for a Resource-Constrained IoT System. Information 2021, 12, 150. [Google Scholar] [CrossRef]
- Hu, J.; Wang, Y.; Pang, Y.; Liu, Y. Optimal maintenance scheduling under uncertainties using Linear Programming-enhanced Reinforcement Learning. Eng. Appl. Artif. Intell. 2022, 109, 104655. [Google Scholar] [CrossRef]
- Li, J.; Li, T.; Yu, Y.; Zhang, Z.; Pardalos, P.M.; Zhang, Y.; Ma, Y. Discrete firefly algorithm with compound neighborhoods for asymmetric multi-depot vehicle routing problem in the maintenance of farm machinery. Appl. Soft Comput. 2019, 81, 105460. [Google Scholar] [CrossRef]
- Hu, Y.; Xiao, S.; Wen, J.; Li, J. An ANP-multi-criteria-based methodology to construct maintenance networks for agricultural machinery cluster in a balanced scorecard context. Comput. Electron. Agric. 2019, 158, 1–10. [Google Scholar] [CrossRef]
- Gualberto, C.R.; Rodrigues, L.F.; Morabito, R.; de Freitas Almeida, J.F. Time-dependent performance evaluation of tire repair emergency systems in the agricultural stage of sugarcane mills. Comput. Electron. Agric. 2022, 193, 106701. [Google Scholar] [CrossRef]
- Yan, Q.; Wang, H.F.; Wu, F. Digital twin-enabled dynamic scheduling with preventive maintenance using a double-layer Q-learning algorithm. Comput. Oper. Res. 2022, 144, 105823. [Google Scholar] [CrossRef]
- Ghaithan, A.M. An Optimization Model for Operational Planning and Turnaround Maintenance Scheduling of Oil and Gas Supply Chain. Appl. Sci. 2020, 10, 7531. [Google Scholar] [CrossRef]
- Malik, S.; Kim, D. Improved Control Scheduling Based on Learning to Prediction Mechanism for Efficient Machine Maintenance in Smart Factory. Actuators 2021, 10, 27. [Google Scholar] [CrossRef]
- Kolling, C.; de Medeiros, J.F.; Duarte Ribeiro, J.L.; Morea, D. A conceptual model to support sustainable Product-Service System implementation in the Brazilian agricultural machinery industry. J. Clean. Prod. 2022, 355, 131733. [Google Scholar] [CrossRef]
- Hsu, T.-C.; Yang, H.; Chung, Y.-C.; Hsu, C.-H. A Creative IoT agriculture platform for cloud fog computing. Sustain. Comput. Inform. Syst. 2020, 28, 100285. [Google Scholar] [CrossRef]
- Sinha, B.B.; Dhanalakshmi, R. Recent advancements and challenges of Internet of Things in smart agriculture: A survey. Future Gener. Comput. Syst. 2022, 126, 169–184. [Google Scholar] [CrossRef]
- Liu, J.; Yang, T.; Bai, J.; Sun, B. Resource allocation and scheduling in the intelligent edge computing context. Future Gener. Comput. Syst. 2021, 121, 48–53. [Google Scholar] [CrossRef]
- GB/T 35488-2017; Combine Harvesters Monitoring System. China Standard Press: Beijing, China, 2017.
- Peng, G.; Yonghe, S.; Ying, Z.; Fei, T. Dynamic scheduling method of distributed photovoltaic operation and maintenance resources based on reinforcement learning. Comput. Integr. Manuf. Syst. 2022, 28, 552–563. [Google Scholar]
Publisher’s Note: MDPI stays neutral with regard to jurisdictional claims in published maps and institutional affiliations. |
© 2022 by the authors. Licensee MDPI, Basel, Switzerland. This article is an open access article distributed under the terms and conditions of the Creative Commons Attribution (CC BY) license (https://creativecommons.org/licenses/by/4.0/).