Abstract
Molecular germplasm characterization is essential for gathering information on favorable attributes and varietal improvement. The current study evaluated the genetic divergence and population structure of 80 potato genotypes collected from Punjab, Pakistan, using polymorphic retrotransposon-DNA-based markers (iPBS). A total of 11 iPBS primers generated 787 alleles with a mean value of 8.9 alleles per primer, of which ~95% were polymorphic across the 80 genotypes. Different variation attributes, such as mean expected heterozygosity (H = 0.21), mean unbiased expected heterozygosity (µHe = 0.22), and mean Shannon’s information index (I = 0.32), showed the existence of sufficient genetic diversity in the studied potato genotypes. Analysis of molecular variance (AMOVA) showed that genetic variation within the population was higher (84%) than between populations (16%). A neighbor-joining tree was constructed based on the distance matrices that arranged the 80 genotypes into five distinct groups, and the genotypes FD61-3 and potato 2 had the highest genetic distance. A STRUCTURE analysis corroborated the dendrogram results and distributed the 80 genotypes also into five clusters. Our results determined that retrotransposon-based markers are highly polymorphic and could be used to evaluate genetic diversity between local and exotic potato genotypes. The genotypic data and population structure dissection analysis reported in this study will enhance potato varietal improvement and development.
1. Introduction
Among food crops, potato (Solanum tuberosum L.) is considered a vital staple food cultivated commercially across temperate and sub-tropical regions [1]. Global potato production was recently estimated at over 370 million metric tons annually and is cultivated over more than 17 million hectares [2]. Potatoes were first grown in modern-day southern Peru and northwestern Bolivia from 5000 to 8000 BC [1]. China is the leading producer of potatoes and produces approximately 22% of global potato production, followed by India, Russia, Ukraine, and the United States [3]. It is estimated that potato is cultivated in Pakistan on approximately 185,360 hectares, with an average production of 4.5 million tons annually, and it is extensively grown in the Punjab region [4].
The potato genome has 12 chromosomes and is an autopolyploid, having different ploidy states, including diploid (2 × n = 24), triploid (3 × n = 36), tetraploid (24 × n = 48), pentaploid (5 × n = 60), and hexaploid (6 × n = 72). The population structure and genetic characterization of potatoes has been well characterized relative to other solanaceous plants [5,6]. Determining the extent and distribution of genetic divergence in distinct gene pools, evaluating germplasm collections, and improving the efficient preservation and management approaches are all critical factors for successful potato breeding programs. Conventionally, varietal characterization is conducted by assessing morphological traits; however, physical characteristics are often influenced by environmental variability, epistatic interactions, and pleiotropic effects, which restrict only a few traits, leading to low levels of polymorphism [7]. Inherent molecular variation in plant genomes makes it possible to establish and utilize genetic differences between various taxonomic groups, which assists researchers in assessing genetic diversity in gene pools of interest.
Commonly, DNA-based molecular markers are utilized to explore genetic diversity both within and between different crop plant species [8]. The inter-priming binding sites (iPBS) are a retrotransposon-based marker system based in the amplification of a target region incorporated through reverse transcriptase primer binding sites of two adjacent retrotransposons that are in opposite and anti-parallel directions [9]. The iPBS method uses a universal tRNA for primer binding and, therefore, does not rely on pre-defined sequence information, making it an attractive cost-effective proposition for efficient genotyping [10]. The iPBS method has been used for genetic diversity analysis in several crop species, such as date palm, guava, okra, beans, peas, and tobacco [11,12,13,14,15,16]. The iPBS markers have also been used extensively in genetic diversity studies of Turkish potatoes [17]. Earlier research has confirmed the universality of iPBS markers for molecular and phylogenetic studies and reported that iPBS markers are powerful tools for assessing genetic diversity [11,14,17]. Moreover, iPBS markers have been shown to be consistently more polymorphic than SSR markers [17].
The Pakistani potato is the only germplasm characterized on a morphological basis [18]. Previously, five cultivars were also evaluated for genetic diversity using RAPD markers [19]. These studies suggest that most Pakistani potato accessions need further genetic characterization, to provide vital information for potential use in local breeding programs. The current study has been designed to determine the relationship between the population structure and genetic diversity of 80 potato accessions sourced from the Punjab region in Pakistan using iPBS retrotransposon-based markers. This study will improve the efficacy of incorporating desired traits, such as disease/stress resistance, yield, and environmental adaptability.
2. Materials and Methods
2.1. Plant Material and Genomic DNA Extraction
We collected 80 potato accessions from the Potato Research Institute, Sahiwal; all genotypes and passport data are listed in Table 1. DNA The was extracted from 16-day-old potato leaves using a modified CTAB method [20]. The DNA quality was checked using gel electrophoresis (1% agarose), and quantity was measured with a known λ-DNA concentration.

Table 1.
Details of 80 potato (Solanum tuberosum L.) genotypes collected from the Potato Research Institute Sahiwal used for genetic diversity analysis in this study.
2.2. Amplification Profile of Retrotransposon-Based iPBS Primers
Initially, 16 iPBS primers (detailed in Table 2) previously developed and characterized by Kalender et al. [9] were assessed for their polymorphism and utility. A total of 11 primers that gave clear polymorphic bands were selected for molecular profiling of the 80 potato accessions detailed in Table 1. Here, PCR reactions were performed in 20 µL reactions consisting of 11.5 µL double-distilled H2O, 2 µL 10× Taq buffer with (NH2) SO4, (Thermo Scientific, Waltham, MA, USA), 2 µL (20 mM) MgCl2 (Thermo Scientific), 1 µL (2 mM) dNTPs (Deoxyribonucleotide triphosphate), 1 µL iPBS primer (Macrogen, Seoul, Republic of Korea), 0.5 µL Taq polymerase (Thermo Scientific), and 2 µL (10 ng) template DNA. The PCR conditions involved an initial denaturation cycle of 5 min at 94 °C, 35 cycles for 1 min at 94 °C, 1 min at an annealing temperature range between 30–50 °C, 2 min at the temperature of 72 °C, then a final extension of 10 min at a temperature of 72 °C, and storage temperature of 4 °C for 1 hour.
Table 2.
List of 16 inter-primer binding site (iPBS) retrotransposon primers with their sequence and annealing temperature used in this study.
2.3. Band Counting and Statistical Measurement
To confirm band pattern uniformity, three experimental replicates were performed for each PCR for all iPBS markers on the potato accessions. The PCR bands were examined using a 2% agarose gel using a transilluminator and were scored manually; only clear visible bands were scored with the assumption that bands of the same size represented the same single locus. A binary matrix was constructed for the presence of an allele on a specific locus denoted as ‘1’, and for the absence of an allele marked as ‘0’ for a particular locus. To estimate the polymorphism of each dominant marker, polymorphic information content (PIC) was calculated as PIC = 1 − [f2 + (1 − f)2], where ‘f’ indicates the frequency of the marker in the data set. Statistical parameters, such as Shannon’s information index (I), heterozygosity (He), unbiased heterozygosity (µHe), number of different alleles, number of effective alleles, and principal coordinate analysis (PCoA), were calculated using GeneAlex 6.5 [21]. The binary matrix was imported to construct a neighbor-joining (NJ) tree using MEGA 7.0.14 [22]. The model-based software STRUCTURE v. 2.3.4 created the population structure and allocated individual genotypes to sub-populations [23]. A Bayesian approach was applied to determine the population structure of the potato genotypes used in this study. Data from 11 distinct iPBS markers were analyzed using STRUCTURE software; using the value of K (10 runs at each K), the highest number of clusters was estimated by running combination data among the population and allelic frequency of 10,000 steps followed by 50,000 simulations of a Monte Carlo Markov chain (MCMC). The most probable K value was determined by measuring the assessed data of log probability of LnP(D), and the value of ΔK was calculated for the rate of change in LnP(D) between consecutive K-values [24]. We used the STRUCTURE HARVESTER for computational analysis of 80 potato accessions based on iPBS markers, and the maximum number of Ln Pr (X|K) was selected for bar plots among all 10 independent runs [25].
3. Results
3.1. Molecular Assessment of iPBS Markers
The 11 primers detailed in Table 3 gave stable, precise, and polymorphic PCR amplicons, and were subsequently selected for further genetic analysis of the 80 potato accessions. The banding pattern of the PCR products of 80 potato genotypes using iPBS primer 2252 is shown in Figure 1. The highest polymorphic band size of 1800 bp was obtained in Ruby and N-34 genotypes for primer 2229. Across 11 primers, 787 alleles were identified, out of which 752 were polymorphic, showing 96% polymorphism. Primer 2229 amplified the highest number of bands (60), and primers 2390 and 2391 amplified the lowest number of bands (25). The highest PIC value amongst the 11 polymorphic iPBS markers was marker 2277 (0.39), whereas marker 2391 had the lowest PIC value of 0.14 (Table 3). The highest values of Shannon’s information index (I = 0.48), heterozygosity (He = 0.33), and unbiased expected heterozygosity (µHe = 0.34) was observed for marker 2229.
Table 3.
Detection of polymorphism and summary statistics for mean values of 11 iPBS primers used to assess genetic diversity among 80 potato genotypes.
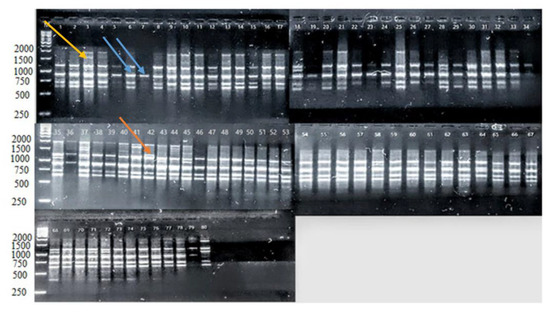
Figure 1.
The banding pattern of PCR products of 80 potato genotypes using 2252 iPBS primers. Well 1 includes a 1 kb size ladder, wells 2–30 include local strains, wells 31–35 are local cultivars, wells 36–46 represent NARC accessions, and wells 47–80 contain exotic cultivars. Yellow-colored arrows point to polymorphic alleles of sizes 1700 bp, and blue-colored arrows point to monomorphic alleles of size 900 bp, while the orange color represents a unique allele of size 1300 bp.
3.2. Heterozygosity and Molecular Variance (AMOVA) of 80 Potato Genotypes
Shannon’s information index (I) ranged from 0.29 (NARC) to 0.37 (EC), with an average of 0.32. Expected heterozygosity (He) ranged from 0.18 (NARC) to 0.24 (EC) with an average value of 0.21, and the unbiased heterozygosity (µHe) ranged between 0.19 (NARC) and 0.24 (EC) with an average value of 0.22 (Table 4). Among all populations, the population of ECs (exotic cultivars) showed the highest Shannon’s information index (0.37), expected heterozygosity (0.24), and unbiased expected heterozygosity (0.24), while genotypes from the NARC population showed the lowest Shannon’s information index (0.29), expected heterozygosity (0.19), and unbiased expected heterozygosity (0.19). The genotypes included in the EC population had the highest genetic distance from the genotypes of the local strain population, local cultivar population, and NARC population.
Table 4.
The summary of statistical analysis of genetic diversity across 80 potato genotypes based on 11 iPBS primers.
Analysis of molecular variance (AMOVA) was performed to determine the diversity both among and between the 80 potato genotypes according to their four geographic regions of origin (Table 5). Results from AMOVA revealed greater molecular variation within populations (85%) relative to between populations (15%).
Table 5.
Analysis of molecular variance (AMOVA) of 80 potato genotypes based on 11 iPBS markers presenting the percentage of molecular variance among and within the population.
3.3. Principal Coordinate analysis (PCoA) and Hierarchical Clustering of 80 Potato Genotypes
Principal coordinate analysis (PCoA) depicted the 80 potato genotypes based on their genetic distance (Figure 2). The 2 axis of the principal coordinate accounted for 20.6% of the total molecular variation, which distributed 80 genotypes in thee main groups, while six genotypes, including NARC37, NARC46, LC34, LS7, LS9, EC78, and EC47, were distinct from other genotypes.
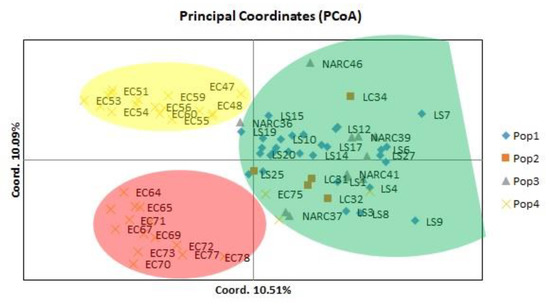
Figure 2.
Principle coordinate analysis of 80 potato genotypes indicated the 20.6% variation based on retrotransposon markers; population 1 represents local strains, population 2 represents local cultivars, population 3 represent NARC cultivars, and population 4 represents exotic cultivars.
Genetic distance was calculated using the dissimilarity index for constructing a NJ tree using 11 iPBS markers. Among the local strain (LS) population, LS9 (22.74) and LS3 (19.72) revealed the highest genetic distance. Among the local cultivar (LC) population, LC36 showed the highest genetic distance (17.35). Cultivars NARC37 (23.97) and NARC46 (19.88) indicated the maximum genetic length among the NARC cultivars population, and EC78 (23.65), EC69 (21.80), EC80 (21.65), and EC77 (21.34) had the maximum genetic distance among the EC (exotic cultivar) population. The NJ dendrogram separated 80 potato accessions into three major clusters with five sub-clusters (Figure 3). Cluster 1 consists of 16 genotypes, including 14 local strains, 1 NARC cultivar, and 1 local cultivar, of which LS14 (FD74-50) and LS10 (FD74-19) showed the closest genetic similarity, while LS7 (FD71-1), LS9 (FD73-77), LC34 (Ruby), and NARC46 (N-4) were more genetically diversified than other genotypes. Cluster 2 consists of 22 potato genotypes, including 17 exotic cultivars (ECs), 3 local strains, and 2 NARC cultivars, of which EC53 (El-mundo) and EC51 (Eldorodo) showed the closest genetic similarity while EC47 (Aurea), EC50 (Elodie), and EC54 (Erora) were genetically distinct. Cluster 3 consists of 17 exotic cultivars, of which EC73 (HZD-04-684) and EC70 (Sassy) had the closest genetic similarity, while EC71 (Focus), EC78 (Kuroda), EC65 (Red Sonia), and EC80 (Pirol) were genetically distinct. Cluster 4 consists of 13 genotypes, including 9 local strains and 4 local cultivars, of which LC32 (FSD red), LS18 (FD76-13), and LS25 (SL1-4) were genetically dissimilar. Similarly, cluster 5 consists of 12 genotypes, including 8 NARC cultivars and 4 local strains, of which LS29 (SL13-78) and LS24 (FD51-5) were closely related, while LS22 (FD77-62) and NARC39 (N-13) were more genetically dissimilar than other genotypes (Figure 3).
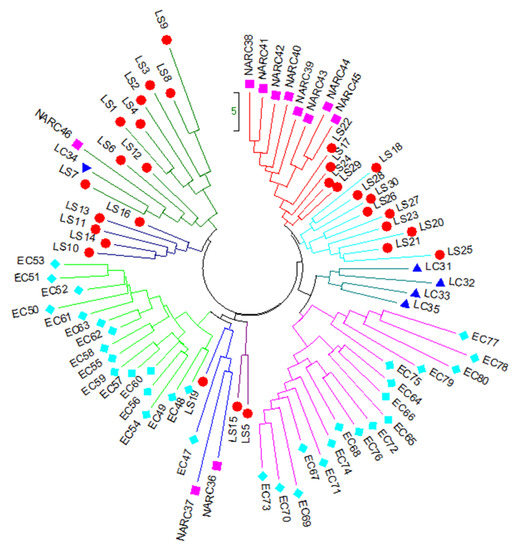
Figure 3.
Neighbor-joining tree of 80 genotypes of potato generated with data from 11 iPBS primers showing 5 main clusters with some clusters containing sub-groups. Abbreviations are as follows: LS ( ), local strains; LC (
 ), local cultivars; NARC (
 ), and EC (
 ), exotic cultivars.
), local strains; LC (), local cultivars; NARC (), and EC (), exotic cultivars.
3.4. Genetic Structure of 80 Potato Genotypes
The Bayesian methodology [23] used in STRUCTURE was applied to calculate the genetic structure of binary data extracted from 11 iPBS primers, and the data suggested that an optimum number of K = 5 represents the presence of five main clusters among 80 potato genotypes (Figure 4). A total of 11 iPBS primers distributed 80 potato genotypes into five major groups identified in yellow, red, blue, purple, and green (Figure 5). If a genotype has a member coefficient of 80% in K = 5, it belongs to that population. The result of iPBS data showed that population 1 had 7 genotypes (yellow), population 2 had 14 genotypes (red), population 3 had 7 genotypes (blue), population 4 had 13 genotypes (green), and population 5 had 14 potato genotypes (purple). In terms of the population structure of some the potato genotypes collected, namely LS18, LS28, NARC41, NARC45, EC51, EC52, EC54, EC56, EC59, EC60, EC61, EC62, EC67, EC68, EC70, EC73, and EC74, it was proposed that they do not share a common ancestor and represent pure genetic material. At the same time, genotypes with multiple colors are a mixture from numerous clusters, i.e., LC31, LC32, LC33, LC34, LC35, and LC36.
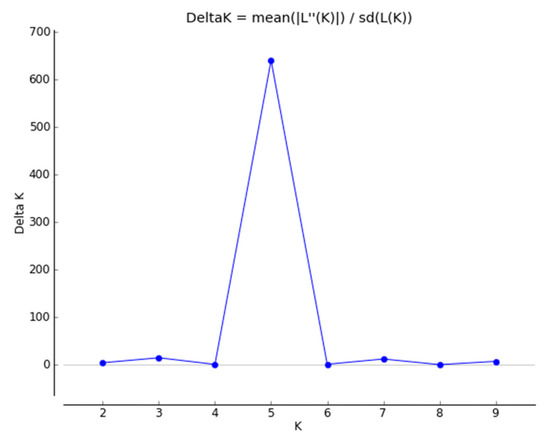
Figure 4.
Plot of delta K calculated as the mean of the second-order rate of change in the likelihood of K divided by the standard deviation of the likelihood of K, m(|L”(K)|)/sd[L(K)]. Delta K = 5 is the potential number of genetic clusters that may exist in the overall sample of individuals.
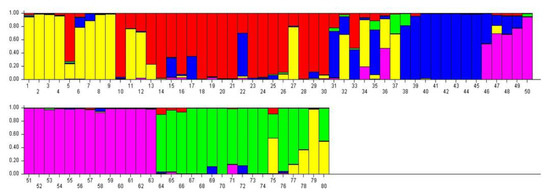
Figure 5.
The population structure of 80 genotypes assessed using Bayesian analysis with allelic variation from the 11 iPBS markers. Five populations (yellow, red, blue, purple, and green) were defined using the method described in Evanno et al. (2005). Each vertical line symbolizes an individual multi-locus genotype.
4. Discussion
Despite low labor requirements, potato production in Pakistan is poor relative to neighboring countries, such as India and Bangladesh. This is thought to be due to several biotic and abiotic stresses, as well as the limited allocation of arable land. To overcome biotic and abiotic stresses using a breeding approach understanding the genetic diversity within breeding lines, landraces, and germplasm is critical. According to previous studies, retrotransposons comprise half of the plant genome’s repetitive DNA. Potato has been reported to contain 214 Mb of LTR-transposons comprising 30% of total genome size. The iPBS markers are derived from retrotransposons and are not reliant on prior sequence information. Furthermore, iPBS markers have been applied in several different genetic evaluation studies of plant species, such as Cicer ssp. [26], Saussurea esthonica [27], Diospyros ssp. [28], Myrica rubra [29], and grape [30]. The iPBS markers typically generate multiple polymorphic bands per locus, are highly reproducible, and are inexpensive compared to other marker systems [30].
A total of 11 polymorphic iPBS markers were effective in characterizing the genetic variation between and within 80 potato genotypes. Unique alleles were found in Red River, Sagitta, FD 61-3, and PRI-RED genotypes with primers 2229, 2232, 2375, and 2239, respectively; these alleles could be sequenced in the future for primer design. The PIC values estimate the marker power of discrimination for a locus and provide the size of alleles. The PIC value recorded for each primer ranged from 0.13 to 0.38, with a mean value of 0.28, which is higher than the PIC value (0.12–0.31) reported in Turkish potato accessions by Demirel et al. [17]. This is likely due to the selection of more specific transposable base iPBS markers in this study into the genetic diversity of the Pakistani potato germplasm. The molecular analysis of 80 genotypes revealed the average recorded heterozygosity (He) for 11 iPBS primers was 0.2. The low He and Shannon’s information index (I) values observed in this study are due to using a limited number of iPBS markers, leading to selection bias.
A dendrogram was constructed based on data gathered from 11 iPBS primers by using the NJ method, and this distributed the 80 potato genotypes into five main clusters. Further cluster analysis showed that genetic diversity was higher among and between the potato genotypes due to genetic drift. The dendrogram was built based on dissimilarity coefficient values that showed a wide range of variable values of the similarity index and indicates that iPBS markers can be used effectively in genetic diversity studies. To further enhance the Pakistani potato industry, phylogenetic characterization based on genetic distance could be helpful for crop breeding, facilitating the development new breeding programs. Wild relatives and primitive cultivars of potatoes contribute to diversity in genetic resources for production programs for the potato crop [31,32,33]. The current study’s genetic dissimilarity results showed the highest genetic distance among the genotypes, including LS9 (FD73-77), LS3 (FD48-54), LC36 (Potato 3), NARC37 (Potato2), NARC46 (N-4), EC78 (Kuroda), EC69 (Suzen), EC80 (Pirol), and EC77 (Red River). These results provide a basis for enhanced diversification for parental selection for potato breeding in Pakistan.
Potato has been reported to show higher heterozygosity, as it is a tetraploid outcrossing crop [34]. The present study has shown a high level of genetic diversity in the potato genotypes selected. The heterozygosity results are in agreement with the previously reported studies [34]. Furthermore, heterosis and mutation-positive selection could also be the important factor contributing to the high heterozygosity in potato. Shannon’s information index (I) is important in order to understand genetic variation among cultivars, as it is related to genetic differences in uniformity and population combining abundance. The variation in I observed among genetic groups might be due to geographic factors, habitat destruction, restriction in gene flow, and type of breeding system. Further variation could be the result of the inclusion of wild accessions in the present study. These results are in contrast with a Chinese study [35] that showed that I varied from 0.73 to 1.76 among the 149 main potato cultivars of China. Analysis of molecular variance (AMOVA) showed the presence of high variation within potato genotypes, with the percentage of total variance being 85%. It has been previously stated that higher variations in varieties may be due to reasons, such as selection, adaptation, gene flow, genetic drift, and variation in ecotypes and pollination method [36].
The PCoA approach is a widely used method for assessing genetic diversity based on quantitative and qualitative traits that scale distance data to multidimensional planes for the characterization of genetic diversity. The data acquired from this study of population structure and heterozygosity of potato germplasm indicate that NARC cultivars clustered together in the dendrogram due to their low heterozygosity. Despite their extensive distribution and cultivation, these findings indicate that only a few NARC cultivars have been used in potato breeding programs. Our results showed that the local cultivar population and NARC cultivars tended to be closely related based on their clustering showing minimal genetic diversity that can be exploited for breeding purposes. Individuals with multiple colors, such as LC31, LC32, LC33, LC34, LC35, and LC36, are admixtures indicating the maximum genetic drift and, thus, inform future studies into enhancing potato genetic diversity for germplasm collection and conservation [8]. The genotypes were clustered based on geographical distribution and morphological features to execute a similarity index analysis. The PCoA method has been used previously to study the genetic relatedness among different potato genotypes [37]. The genetic diversity for 26 potato genotypes grown in Turkey was previously analyzed using six AFLP primers, resulting in the production of 191 polymorphic bands which distributed potato genotypes into six distinct subgroups [38]. Another study in Turkey used SSR markers for fingerprinting major potato landraces and varieties grown in Central Anatolia [39]. Among 16 SSR primers, five markers (STM19, STM31, STM3012, STI32, and STI42) distinguished the 15 potato genotypes into five groups [39]. In our study, 11 transposon-based markers distributed the potato accessions into 5 groups according to their genetic structures.
5. Conclusions
The study of the genetic variation of 80 Pakistani potato genotypes using iPBS-based markers provided data about their relatedness and diversity. This data can be submitted to the relevant molecular databases to incorporate new information in the national gene pool. Other techniques, such as genotype-by-sequencing (GBS) and DArT-Seq, can also be used to enhance genetic diversity studies using an increased number of accessions to better assess genetic distances among divergent genotypes. A comprehensive genome-wide association mapping study is required to better understand and further explore genetic diversity studies in a highly diverse collection of potato accessions. Establishing germplasm consisting of a core collection used in breeding programs is necessary. The findings of this study confirm the extent of diversity within the Pakistani potato germplasm. Further molecular diversity, trait dissection, and characterization studies are required for germplasm preservation and crop improvement.
Author Contributions
L.M. and A.M. performed data collection and original draft preparation; P.M.D. performed substantial reviewing, editing and formatting M.S.H. and M.J.J. were also responsible for reviewing and editing; A.M. and A.H. were responsible for software; supervision and lab work data analysis was by M.W.S.; Q.Y. and M.M.H. were responsible for the fieldwork and methodology. All authors have read and agreed to the published version of the manuscript.
Funding
This research received no external funding.
Institutional Review Board Statement
Not applicable.
Conflicts of Interest
The authors declare no conflict of interest.
References
- De Haan, S.; Rodriguez, F. Potato origin and production. In Advances in Potato Chemistry and Technology, 2nd ed.; Singh, J., Kaur, L., Eds.; Academic Press: Cambridge, MA, USA, 2016; pp. 1–32. [Google Scholar]
- FAO. Available online: https://www.fao.org/faostat/en/#data/QCL (accessed on 18 June 2022).
- Dongyu, Q. Role and Potential of Potato in Global Food Security; FAO: Rome, Italy, 2022; pp. 23–30. Available online: https://www.fao.org/3/cc0330en/cc0330en.pdf (accessed on 2 July 2022).
- FAOSTAT. Food and Agricultural Organization Statistical Database, Crop Production. 2020. Available online: http://faostat3.fao.org/download/Q/QC/E (accessed on 22 March 2022).
- Watanabe, K. Potato genetics, genomics, and applications. Breed. Sci. 2015, 65, 53–68. [Google Scholar] [CrossRef] [PubMed]
- Lee, K.J.; Sebastin, R.; Cho, G.T.; Yoon, M.; Lee, G.A.; Hyun, D.Y. Genetic Diversity and Population Structure of Potato Germplasm in RDA-Genebank: Utilization for Breeding and Conservation. Plants 2021, 10, 752. [Google Scholar] [CrossRef] [PubMed]
- Schulman, A.H. Molecular markers to assess genetic diversity. Euphytica 2007, 158, 313–321. [Google Scholar] [CrossRef]
- Nadeem, M.A.; Muhammad, A.N.; Muhammad, Q.S.; Yıldız, D.; Gonul, C.; Mehtap, Y.; Rüştü, H.; Fiaz, A.; Ahmad, A.; Nitin, L.; et al. DNA molecular markers in plant breeding: Status and recent advancements in genomic selection and genome editing. Biotechnol. Equip. 2018, 32, 261–285. [Google Scholar] [CrossRef]
- Kalendar, R.; Antonius, K.; Smýkal, P.; Schulman, A.H. iPBS: A universal method for DNA fingerprinting and retrotransposon isolation. Theor. Appl. Genet. 2010, 121, 1419–1430. [Google Scholar] [CrossRef]
- Yildiz, M.; Kocak, M.; Nadeem, M.A.; Cavagnaro, P.; Barboza, K.; Baloch, F.S.; Argün, D.; Keleş, D. Genetic diversity analysis in the Turkish pepper germplasm using iPBS retrotransposon-based markers. Turk. J. Agric. For. 2020, 44, 1–14. [Google Scholar] [CrossRef]
- Mehmood, A.; Jaskani, M.J.; Ahmad, S.; Ahmad, R. Evaluation of genetic diversity in open pollinated guava by iPBS primers. Pak. J. Agric. Sci. 2013, 50, 591–597. [Google Scholar]
- Baloch, F.S.; Ahmad, A.; Luis, E.; Sáenzde, M.; Rüştü, H.; Vahdettin, Ç.; Tolga, K.; Mehtap, Y.; Hakan, Ö. DNA based iPBS-retrotransposon markers for investigating the population structure of pea (Pisum sativum) germplasm from Turkey. Biochem. Syst. Ecol. 2015, 61, 244–252. [Google Scholar] [CrossRef]
- Yıldız, M.; Koçak, M.; Baloch, F.S. Genetic bottlenecks in Turkish okra germplasm and utility of iPBS retrotransposon markers for genetic diversity assessment. Genet. Mol. Res. 2015, 14, 10588–10602. [Google Scholar] [CrossRef]
- Al-Najm, A.; Luo, S.; Ahmad, N.M.; Trethowan, R. Molecular variability and genetic relationships of date palm (Phoenix dactylifera L.) cultivars based on inter-primer binding site (iPBS) markers. Aust. J. Crop Sci. 2016, 10, 732–740. [Google Scholar] [CrossRef]
- Yaldiz, G.; Camlica, M.; Nadeem, M.A.; Nawaz, M.A.; Baloch, F.S. Genetic diversity assessment in Nicotiana tabacum L. with iPBS-retrotransposons. Turk. J. Agric. For. 2018, 42, 154–164. [Google Scholar] [CrossRef]
- Nemli, S.; Kianoosh, T.; Tanyolac, M.B. Genetic diversity and population structure of common bean (Phaseolus vulgaris L.) accessions through retrotransposon-based interprimer binding sites (iPBSs) markers. Turk. J. Agric. For. 2015, 39, 940–948. [Google Scholar] [CrossRef]
- Demirel, U.; Tındaş, İ.; Yavuz, C.; Baloch, F.S.; Çalışkan, M.E. Assessing genetic diversity of potato genotypes using inter-PBS retrotransposon marker system. Plant Genet. Resour. 2018, 16, 137–145. [Google Scholar] [CrossRef]
- Khan, M.F.; Tabassum, N.; Latif, A.; Khaliq, A.; Malik, M. Morphological characterization of potato (Solanum tuberosum L.) germplasm under rainfed environment. Afr. J. Biotechnol. 2013, 21, 3214–3223. [Google Scholar]
- Abbas, S.J.; Rasool, G.; Shah, S.R.U.; Iqbal, A. Analysis of genetic diversity in Pakistani potato cultivars by using randomly amplified polymorphic DNA (RAPD) primers. Am.-Eurasian J. Sustain. Agric. 2008, 2, 50–54. [Google Scholar]
- Murray, M.; Thompson, W.F. Rapid isolation of high molecular weight plant DNA. Nucleic Acids Res. 1980, 8, 4321–4325. [Google Scholar] [CrossRef]
- Peakall, R.; Smouse, P.E. GenAlEx tutorials-part 2: Genetic distance and analysis of molecular variance (AMOVA). Bioinformatics 2012, 28, 2537–2539. [Google Scholar] [CrossRef]
- Kumar, S.; Stecher, G.; Tamura, K. MEGA7: Molecular evolutionary genetics analysis version 7.0 for bigger datasets. Mol. Biol. Evol. 2016, 33, 1870–1874. [Google Scholar] [CrossRef]
- Pritchard, J.K.; Stephens, M.; Donnelly, P. Inference of population structure using multilocus genotype data. Genetics 2000, 155, 945–959. [Google Scholar] [CrossRef]
- Evanno, G.; Regnaut, S.; Goudet, J. Detecting the number of clusters of individuals using the software STRUCTURE: A simulation study. Mol. Ecol. 2005, 14, 2611–2620. [Google Scholar] [CrossRef]
- Earl, D.A. STRUCTURE HARVESTER: A website and program for visualizing STRUCTURE output and implementing the Evanno method. Conserv. Genet. Resour. 2012, 4, 359–361. [Google Scholar] [CrossRef]
- Andeden, E.E.; Baloch, F.S.; Derya, M.; Kilian, B.; Özkan, H. iPBS-Retrotransposons-based genetic diversity and relationship among wild annual Cicer species. J. Plant Biochem. Biotechnol. 2013, 22, 453–466. [Google Scholar] [CrossRef]
- Gailīte, A.; Ievinsh, G.; Ruņģis, D. Genetic diversity analysis of Latvian and Estonian Saussurea esthonica populations. Environ. Exp. Bot. 2011, 9, 115–119. [Google Scholar]
- Raddová, J.; Ptáčková, H.; Čechová, J.; Ondrášek, I. Genetic analysis of the genus Diospyros ssp. using RAPD and i-PBS methods. Acta Univ. Agric. Silvic. Mendelianae Brun. 2012, 60, 205–216. [Google Scholar] [CrossRef]
- Fang-Yong, C.; Ji-Hong, L. Germplasm genetic diversity of Myrica rubra in Zhejiang Province studied using inter-primer binding site and start codon-targeted polymorphism markers. Sci. Hortic. 2014, 170, 169–175. [Google Scholar] [CrossRef]
- Guo, D.L.; Guo, M.X.; Hou, X.G.; Zhang, G.H. Molecular diversity analysis of grape varieties based on iPBS markers. Biochem. Syst. Ecol. 2014, 52, 27–32. [Google Scholar] [CrossRef]
- Bamberg, J.B.; del Rio, A. Conservation of Potato Genetic Resources. In Genetic Improvement of Solanaceous Crops, Volume I: Potato; Razdan, M.K., Mattoo, A.K., Eds.; Science Publishers, Inc.: Plymouth, UK, 2005; p. 476. [Google Scholar]
- D’hoop, B.B.; Paulo, M.J.; Mank, R.A.; van Eck, H.J.; van Eeuwijk, F.A. Association mapping of quality traits in potato (Solanum tuberosum L.). Euphytica 2008, 161, 47–60. [Google Scholar] [CrossRef]
- Jansky, S. Breeding for Disease Resistance in Potato. In Plant Breeding Reviews; Janick, J., Ed.; John Wiley & Sons, Inc.: Oxford, UK, 2010; Volume 19, pp. 69–155. [Google Scholar] [CrossRef]
- Meirmans, P.G.; Liu, S.; van Tienderen, P.H. The analysis of polyploid genetic data. J. Hered. 2018, 109, 283–296. [Google Scholar] [CrossRef]
- Hu, J.; Mei, M.; Jin, F.; Xu, J.; Duan, S.; Bian, C.; Li, G.; Wang, X.; Jin, L. Phenotypic variability and genetic diversity analysis of cultivated potatoes in China. Front. Plant Sci. 2022, 13, 954162. [Google Scholar] [CrossRef]
- Bohn, M.; Utz, H.F.; Melchinger, A.E. Genetic similarities among winter wheat cultivars determined on the basis of RFLPs, AFLPs, and SSRs and their use for predicting progeny variance. Crop Sci. 1999, 39, 228–237. [Google Scholar] [CrossRef]
- Khodadadi, M.; Fotokian, M.H.; Miransari, M. Genetic diversity of wheat (Triticum aestivum L.) genotypes based on cluster and principal component analyses for breeding strategies. Aust. J. Crop Sci. 2011, 5, 17–24. [Google Scholar]
- Akkale, C.; Yildirim, Z.; Yildirim, M.B.; Kaya, C.; Öztürk, G.; Tanyolaç, B. Assessing genetic diversity of some potato (Solanum tuberosum L.) genotypes grown in Turkey using the AFLP marker technique. Turk. J. Field Crop. 2010, 15, 73–78. [Google Scholar]
- Kandemir, N.; Yılmaz, G.; Karan, Y.B.; Borazan, D. Development of a simple sequence repeat (SSR) marker set to fingerprint local and modern potato varieties grown in central Anatolian Plateau in Turkey. Afr. J. Biotechnol. 2010, 9, 5516–5522. [Google Scholar]


Disclaimer/Publisher’s Note: The statements, opinions and data contained in all publications are solely those of the individual author(s) and contributor(s) and not of MDPI and/or the editor(s). MDPI and/or the editor(s) disclaim responsibility for any injury to people or property resulting from any ideas, methods, instructions or products referred to in the content. |
© 2023 by the authors. Licensee MDPI, Basel, Switzerland. This article is an open access article distributed under the terms and conditions of the Creative Commons Attribution (CC BY) license (https://creativecommons.org/licenses/by/4.0/).