Abstract
Melon (Cucumis melo L.) holds significant importance as a horticultural crop, but it faces several yield-limiting factors, including salinity stress. While salinity traditionally hampers the vegetative growth of melon and detrimentally impacts fruit development and quality, certain melon cultivars exhibit the ability to flourish in conditions of relatively high soil salinity. However, truly salt-tolerant melon varieties are quite rare. In this article, we conducted seedling indoor tests, assessed morphological, physiological and biochemical indices, and explored different salt tolerance types among five melon varieties. As a result, we identified three salt-tolerant varieties, with ‘kuizilike’ (KLK) demonstrating the most impressive performance under salt stress. ‘KLK’ exhibited minimal growth and development constraints during salt stress, with the lowest Na+ content, the highest K+ content, and the highest K+/Na+ ratio. Moreover, it displayed the lowest content of malondialdehyde, the highest concentrations of osmoregulation substances, and the highest activity of antioxidant enzymes. Real-time fluorescence quantitation PCR results revealed significantly elevated gene expression levels of TPK, NHX2, LTP, POD, SuSy, HK, PRP and P5CR in ‘KLK’ compared to other varieties. These newly identified salt-tolerant melon germplasms will serve as valuable genetic resources for future studies on the mechanisms underlying melon salt tolerance, and provide insights into melon improvement and molecular breeding.
1. Introduction
Salinity poses a significant global environmental challenge. Salinity adversely affects up to 20% of the world’s arable land and as much as 50% of all irrigated lands [1]. Alarming projections suggest that if current trends in salinity stress persist, we could lose 50% of our current cultivated agricultural land by 2050 [2]. This looming threat jeopardizes crop production and food security on a global scale.
While various strategies have been employed to ameliorate salinized land, the most effective approach involves the identification and cultivation of salt-tolerant crop varieties [3,4,5,6,7]. Thus, exploring salt tolerance in crops and comprehending the mechanisms that confer this trait are essential steps toward harnessing salinized land for sustainable agriculture. One such crop of immense agronomic and economic importance worldwide is melon (Cucumis melo L.), with global production totaling 28.5 million tons in 2020, according to the FAOSTAT [8]. Unfortunately, melon yields are severely impacted by salt stress, a critical limiting factor in its cultivation [9]. Intriguingly, there exists a significant variability among melon cultivars in their salt tolerance, with some varieties demonstrating robust growth even in high salinity conditions [9,10,11]. A salt-tolerant melon cultivar not only serves as a valuable genetic resource but also acts as an ideal donor for enhancing salt resistance in salt-sensitive melon varieties. A handful of salt tolerance genes have been identified and characterized in melon [12,13,14,15]. Therefore, it is imperative to prioritize the screening and selection of salt-tolerant melon cultivars.
Salt stress significantly limits plant physiological processes due to osmotic and ion (mainly sodium ion; Na+) toxicity [16,17,18]. It can also disrupt the balance of the antioxidant system in plants, leading to increased membrane lipid peroxidation [19]. To adapt to soil salinization, plants have evolved various strategies [20], including antioxidant systems and osmotic regulation [21]. Previous research has highlighted the importance of maintaining a high cytosolic K+/Na+ ratio as a key characteristic of salt-tolerant plants, often suggested as a valuable screening criterion for plant breeders [22]. In one study, researchers screened for salt tolerance in wheat at both the seedling and maturity stages across six wheat genotypes. Among these genotypes, Pasban-90 exhibited a higher K+/Na+ ratio and free amino acids under 150 mM NaCl treatment, establishing it as the most salt-tolerant genotype [23]. Another investigation by Sarabi et al. delved into the physiological and biochemical responses to salinity stress in five Iranian melon landraces. These melon varieties were grown under greenhouse conditions and subjected to irrigation with half-strength Hoagland solution containing 0, 30, 60, or 90 mM NaCl for 60 days. The results identified ‘Suski-e-Sabz’ and ‘Ghobadlu’ landraces as highly promising resources, displaying well-suited tolerance to salt stress. Consequently, these landraces hold great potential for utilization in the development of new cultivars through breeding programs [1]. Xiong et al. evaluated the salinity stress tolerance of nine Hami melon landraces from Xinjiang, China. These plants were cultivated in glasshouse conditions and irrigated with Hoagland solution containing either 0 or 100 mM NaCl. At different stages of salt stress, they measured various parameters such as plant dry weight, single fruit weight, Na+ and K+ content, and net fluxes of K+ and Na+. Additionally, the expression levels of leaf Na+/H+ antiporters (NHX) were analyzed to assess salinity stress tolerance. The findings revealed significant differences in salt tolerance among Hami melon landraces in Xinjiang, with ‘Huangdanzi’, ‘Zajiaojiashigua’, ‘Kalakesai’ and ‘Paotaihong’ emerging as salt-tolerant varieties [10]. While melon cultivation often grapples with salinity-related challenges, there has been limited research on screening for salt-tolerant melon varieties. In this study, we identified three salt-tolerant materials from five melon varieties. These chosen salt-tolerant landraces represent valuable assets that can be utilized to improve melon cultivation by enhancing its tolerance to salinity stress.
2. Materials and Methods
2.1. Plant Materials and Treatments
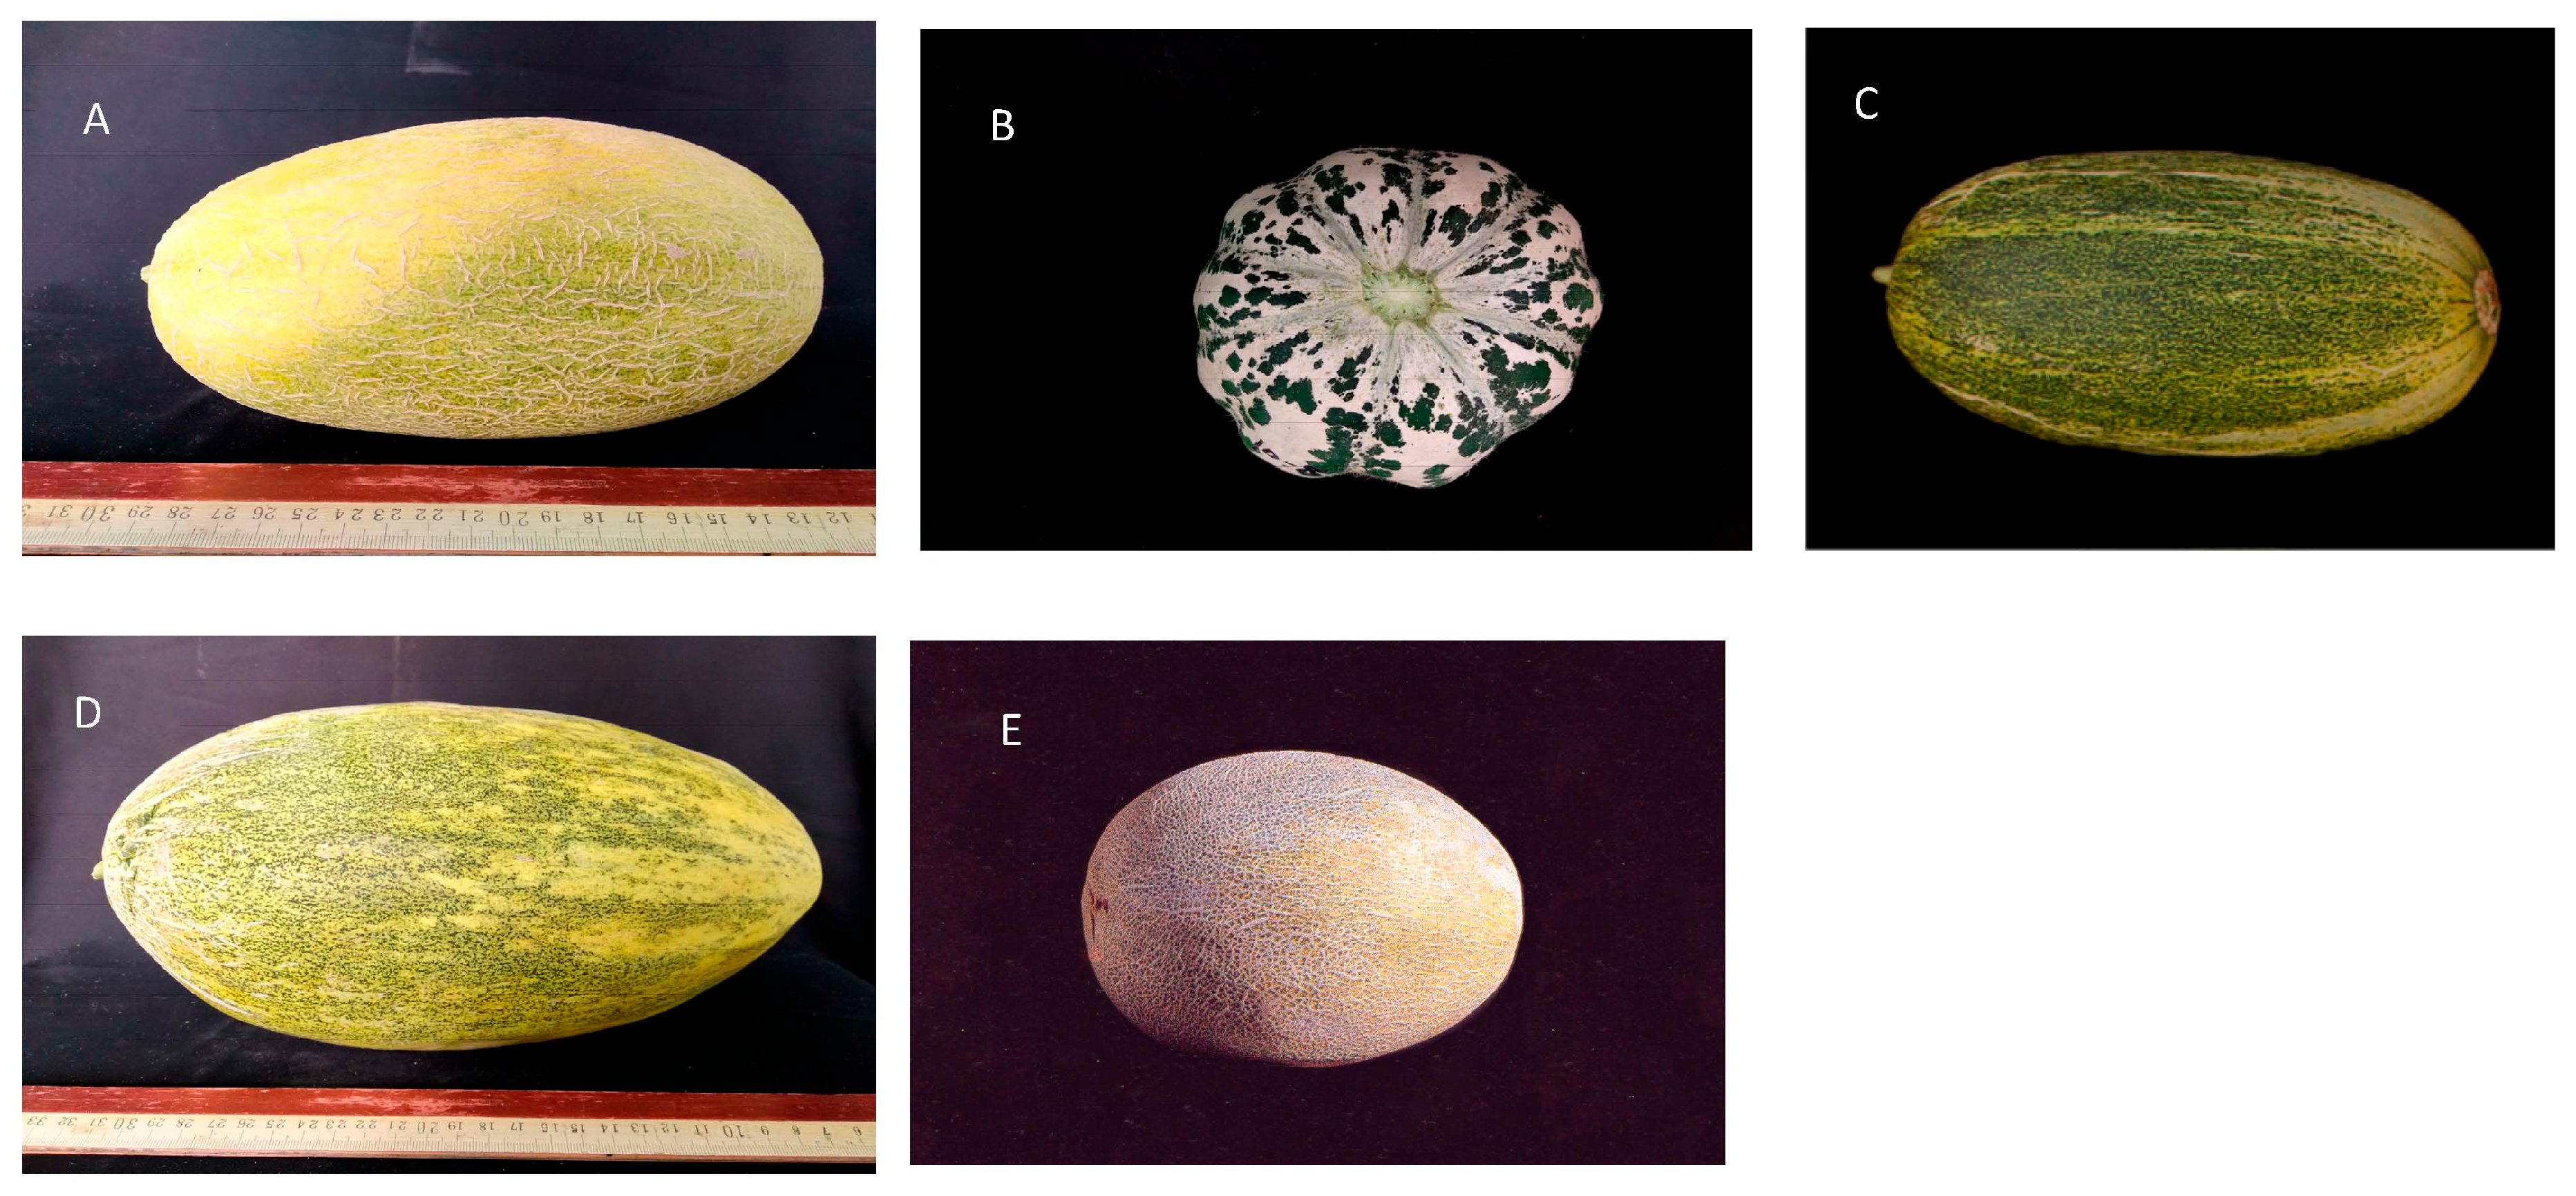
Five Chinese muskmelon cultivars, namely ‘Kuizilike’ (KLK), ‘21xiatiangua’ (21XTG), ‘Laotiepi’ (LTP), ‘Qingpibairoudonggua’ (QDG) and ‘Hamijiageda’ (HGD), were selected for experimentation. Table 1 provides the abbreviations and collection locations for each of these five varieties, while Figure 1 shows the images of the fruits.

Table 1.
Melon landraces sourced from Xinjiang province used as the subjects of this study.
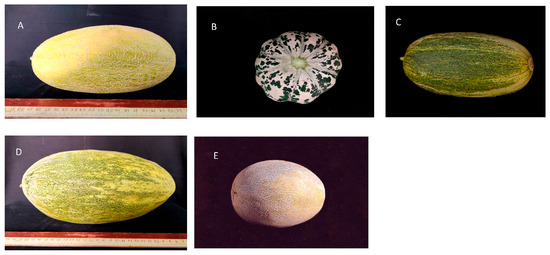
Figure 1.
Fruits of five melon varieties. Fruits were collected and photographed from five Chinese muskmelon cultivars: ‘Kuizilik’ (KLK) (A), ‘21xiatiangua’ (21XTG) (B), ‘Laotiepi’ (LTP) (C), ‘Qingpibairoudonggua’ (QDG) (D), and ‘Hamijiageda’ (HGD) (E).
To initiate the experiment, the seeds of these cultivars underwent surface sterilization in a 0.1% NaClO solution for 20 min. Subsequently, they were rinsed thoroughly three times with deionized water. To accelerate germination, the seeds were placed in a thermostatically controlled incubator at 30 °C for 24 h. Only those seeds that displayed consistent germination were sown into pots filled with a mixture of perlite, vermiculite, and grass carbon in a 1:1:1 (v/v/v) ratio. The potted plants were then cultivated in a Light incubator with day/night temperatures at 28 °C/22 °C. They were exposed to a 14 h photoperiod, ensuring a lighting level exceeding 7000 lux, and a relative humidity of 60 ± 10%. The control plants received half-strength Hoagland nutrient solution, while the treatment plants were watered with 50 mM increments of NaCl dissolved in half-strength Hoagland solution, to a final concentration of 100 mM NaCl at two-leaf stage. After 24 h from the initiation of salt treatment, the flow velocity of K+ and Na+ ions in leaves was measured by NMT technology (avoiding veins). At 0 h, 24 h and 48 h, the second leaf closest to the top of plant was rapidly harvested and flash-frozen in liquid nitrogen. These samples were then stored at −80 °C for subsequent real-time fluorescence quantitative PCR analysis. Three destructive samplings were conducted at various intervals—0 days, 5 days, and 20 days—following the attainment of the final saline concentration. For each sampling, early mature leaves located at positions three and four from the apex were collected and stored at −80 °C for further analysis.
2.2. Measurements of Na+ and K+ Fluxes
The net fluxes of Na+ and K+ were quantified using non-invasive micro-test technology (NMT), a method previously outlined [11,24]. From each treatment group, six phenotypically consistent individual melon seedlings were selected for ion flux measurements after a 24 h period. This experiment was conducted under the auspices of the NMT Industrial Alliance of China National Zhongguancun Science Park in Beijing, China.
2.3. Determination of K+, Na+ Ion Content
The determination of K+ and Na+ ion content followed the procedure described by Edelstein [25]. Melon leaves designated for testing were harvested, dried and subsequently crushed. Na+ and K+ were extracted from the dried leaves, and the resulting material was then subjected to ashing at 600 °C for 6 h. The resulting ash was further digested using HCl, followed by dilution with deionized water. Finally, the concentrations of Na+ and K+ were measured by flame photometry.
2.4. Determination of Lipid Peroxidation
The concentration of malondialdehyde (MDA), a primary product of lipid peroxidation, was assessed using the thiobarbituric acid (TBA) method [26]. The formula used for calculating MDA concentration (mmol·g−1 FW) is as follows:
where Vt is the volume of the extract (mL) and FW denotes the fresh weight of the sample.
MDA (mmol·g−1 FW) = [6.45 × (A532 − A600) − 0.599 × A450] × Vt/FW,
2.5. Determination of Osmoregulatory Substances
The contents of soluble sugars were determined using a previously established anthrone colorimetric method [27]. Meanwhile, the contents of soluble proteins were determined based on the Coomassie brilliant blue G-250 staining [28]. Lastly, the contents of free proline were quantified following the sulfosalicylic acid method according to Ábrahám et al. [29].
2.6. Determination of Antioxidant Enzyme Activity
The activity of several antioxidant enzymes, including peroxidase (POD), superoxide dismutase (SOD) and catalase (CAT), was determined as per the procedures outlined by Kong et al. [30]. Approximately 0.5 g of plant tissue was weighed and homogenized in 5 mL of extraction buffer using an ice bath. The resulting homogenate was subjected to centrifugation at 12,000× g for 20 min at 4 °C, and the supernatant was utilized for enzyme activity measurements.
POD (U/g FW) activity was determined through the guaiacol colorimetric method. Absorbance readings at 470 nm were taken every 30 s, with a total of three readings recorded. A change of 0.01 in absorbance value per minute equated to 1 enzyme activity unit (U). This per gram refers to fresh weight.
SOD (U/g FW) activity was assessed using the nitroblue tetrazolium method. The absorbance was measured at 560 nm after exposing the samples to 30 min of light at 4000 Lx. SOD activity was expressed as the enzyme activity unit required to inhibit 50% of nitroblue tetrazolium reduction. This per gram refers to fresh weight.
CAT (U/g FW) activity was determined through the UV absorption method. Absorbance at 240 nm was measured with one reading every minute for three repetitions. An enzyme activity unit was defined as a 0.01 reduction in absorbance value per minute. This per gram refers to fresh weight.
APX (U/g FW) activity was determined based on the method described by Gutiérrez et al. [31]. After the addition of H2O2, the absorption value of the reaction solution was measured at room temperature for 40 s at a wavelength of 290 nm. The oxidation of 1 µmol of ascorbic acid per gram of the sample per minute was considered as one unit of enzyme activity. This per gram refers to fresh weight.
2.7. RNA Extraction and qRT-PCR Verification
For RNA extraction and qRT-PCR verification, a highly salt-tolerant variety (KLK) and highly salt-sensitive variety (QDG) were selected as experimental materials. Three distinct time points were established—0 h, 24 h and 48 h—after salt treatment, with three replicates at each time point. The second true leaf of each seedling was promptly harvested and rapidly immersed in liquid nitrogen to preserve its integrity, and subsequently stored at −80 °C. Total RNA was extracted from the samples collected at different time points using a plant RNA extraction kit (Tiangen, Beijing, China). The RNA quality and concentration are shown in Supplemental Table S1. Primer design was carried out using Primer 3.0 software (version 3; San Francisco, CA, USA) (Table 2). The qRT-PCR was operated with SYBR Green kit (Tiangen Biotech, Beijing, China), following the methods detailed by Liu et al. [32]. Relative gene expression data analysis was performed using the 2−∆∆Ct method [33].
Table 2.
Primer sequences used in quantitative real-time PCR.
2.8. Statistical Analysis
Statistical analysis was conducted using IBM SPSS Statistics version 22 software (Armonk, NY, USA). Analysis of variance (ANOVA) was employed, with LSD and Duncan multiple comparisons used for post hoc analysis (p < 0.05). For phenotypic statistics, a total of 10 samples were selected, while other data in this work were derived from three independent experiments, each of which included three replicates. The data are presented as means ± standard error (SE).
3. Results
3.1. Growth Parameters of the Five Melon Cultivars under Salt Stress
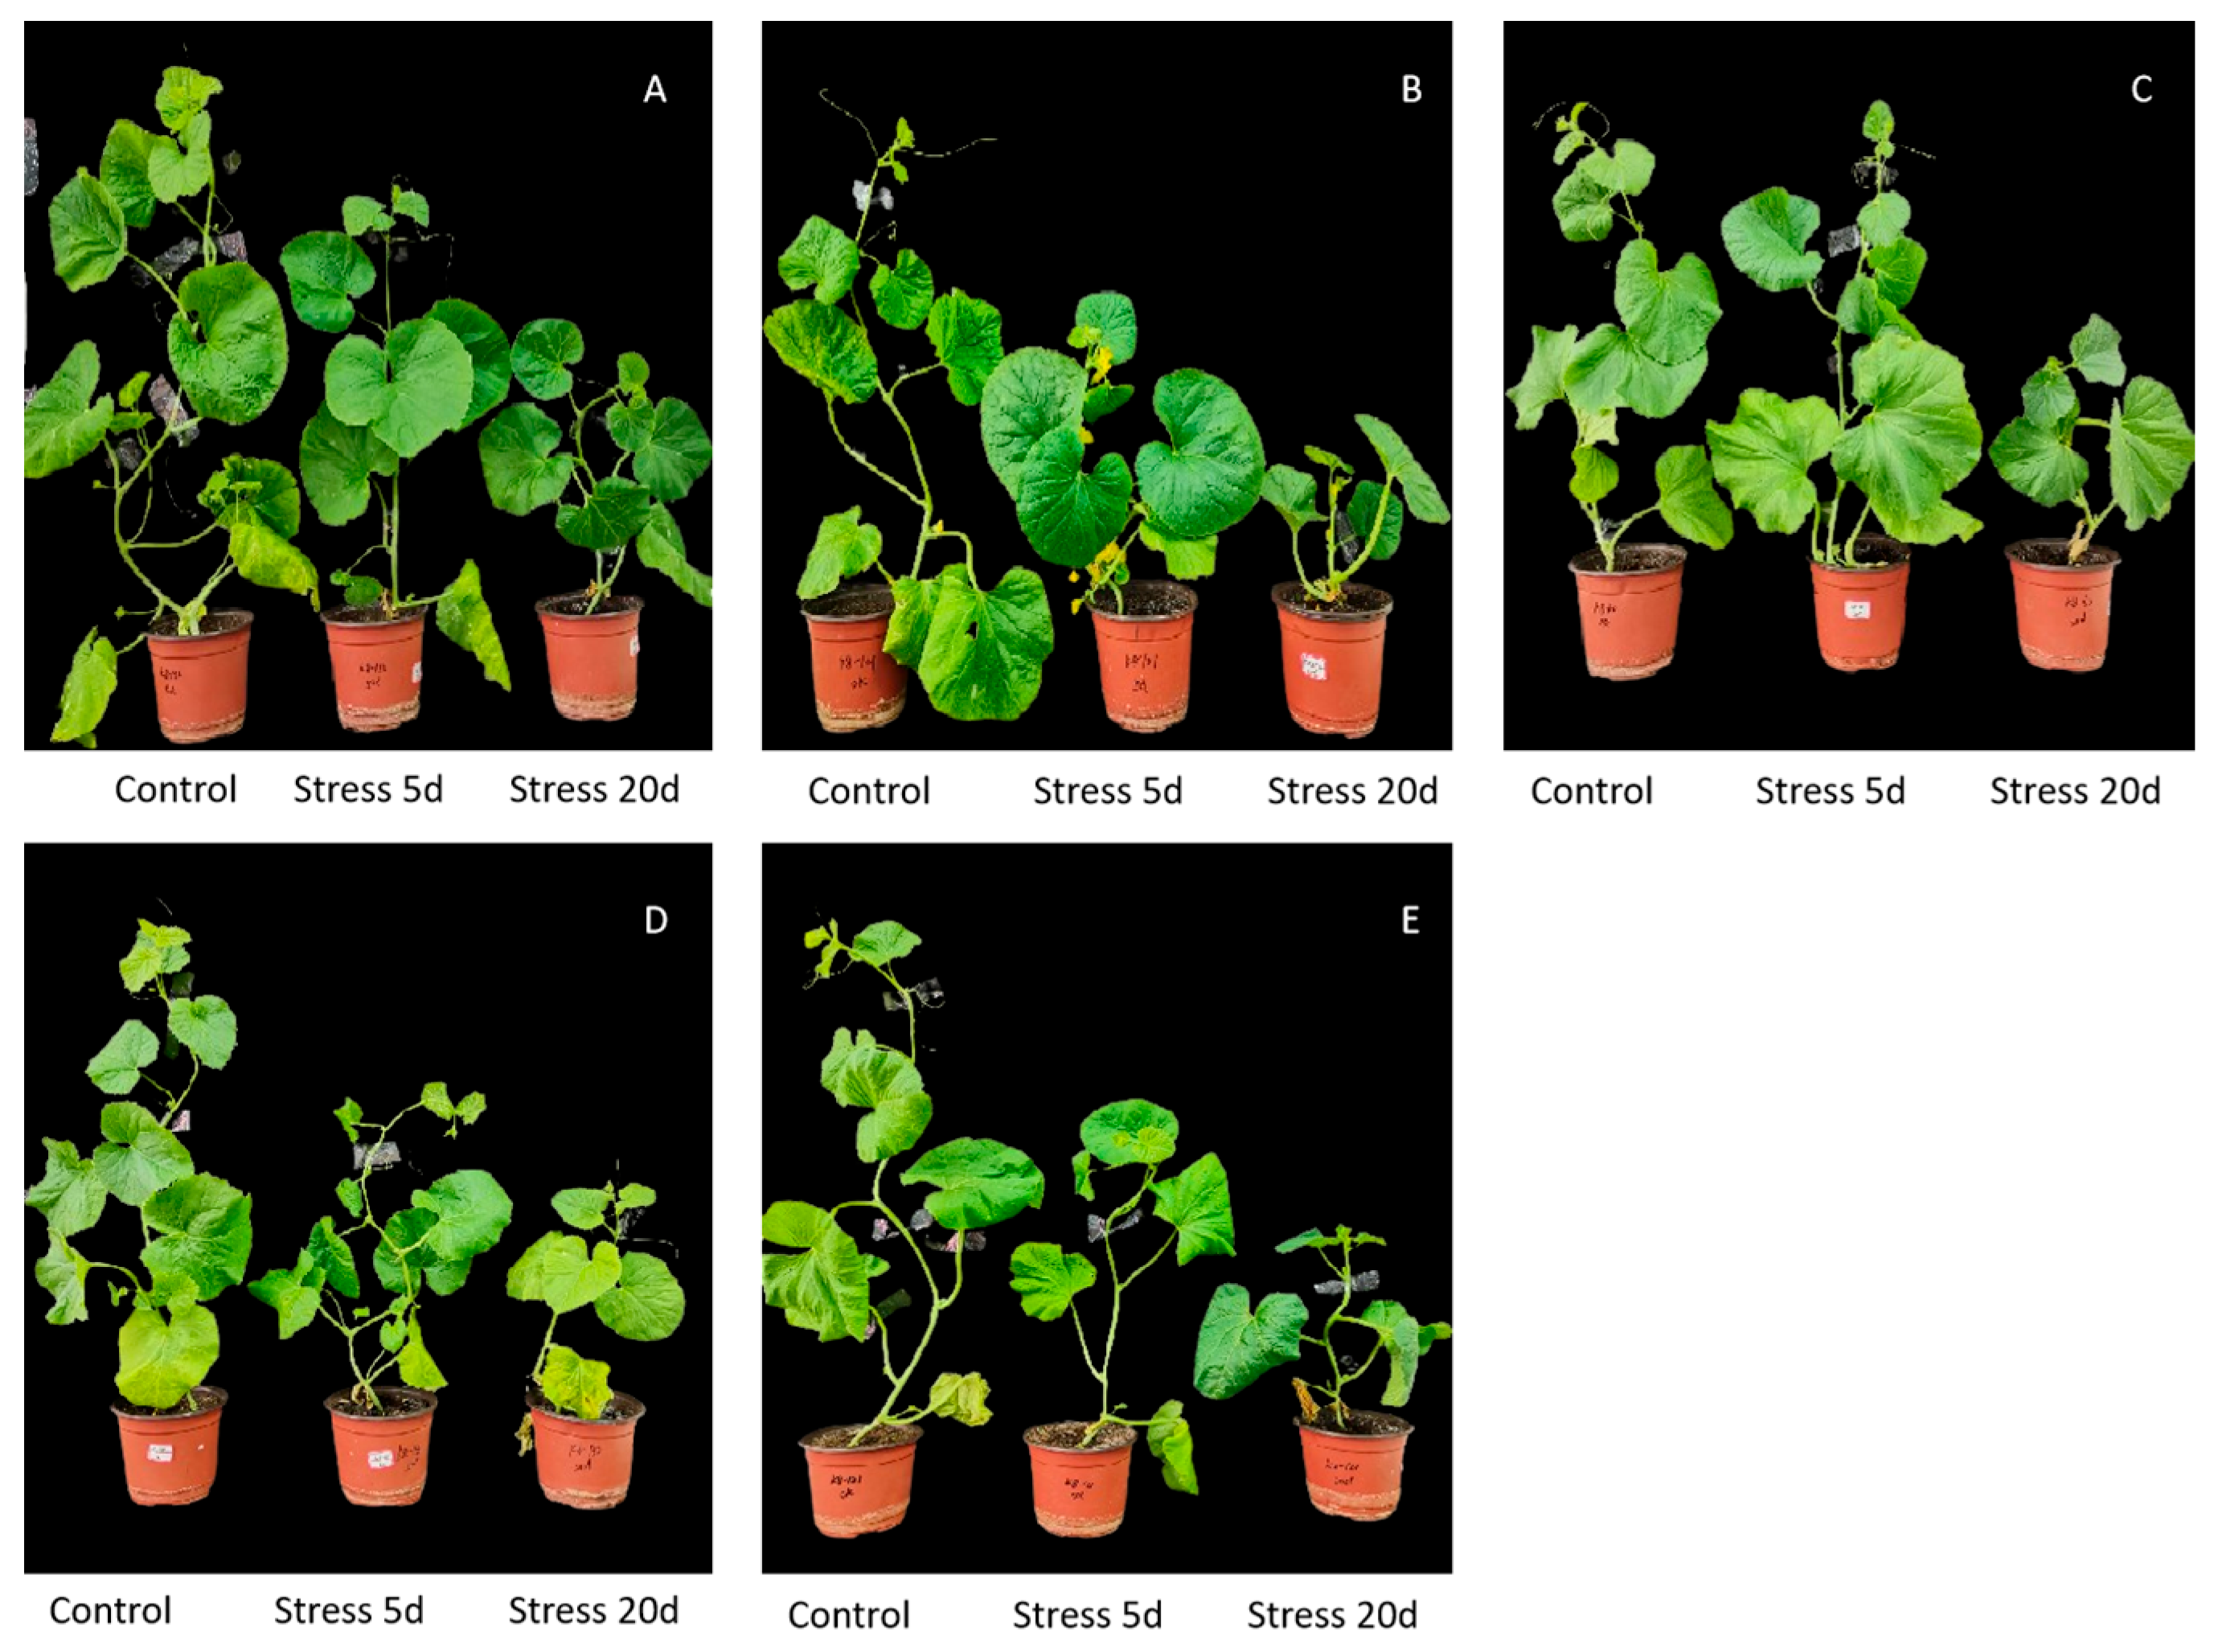
To evaluate the impact of salt stress on melon plants, two-leaf stage seedlings were subjected to a 100 mM NaCl treatment for durations of 5 and 20 days. The results revealed varying degrees of salt tolerance among different melon varieties, as evidenced by changes in several growth parameters, including shoot height, shoot diameter, petiole length, petiole diameter, leaf thickness and leaf number. ‘KLK’, ‘21XTG’ and ‘LTP’ exhibited high salt tolerance. Conversely, ‘QDG’ and ‘HGD’ were more sensitive to salt stress and demonstrated lower salt tolerance (Table 3). When compared to the control group, an extended duration of salinity stress (20 days) significantly reduced shoot height, petiole length and leaf number. Among the five melon varieties, ‘KLK’ experienced the least decline, with the shoot height, petiole length and leaf number decreasing by 37.8%, 5.1% and 15.9%, respectively. In contrast, ‘QDG’ exhibited the most significant reduction, with the shoot height, petiole length and leaf number decreasing by 74.1%, 43.4% and 32.9%, respectively. Conversely, in comparison to the control, the prolonged salinity stress (20 days) notably increased shoot diameter, petiole diameter and leaf thickness. Among the varieties, ‘KLK’ demonstrated the greatest increase, with respective increments of 46.5%, 31.8% and 30.5%. ‘QDG’ displayed the smallest increase, with respective increments of 13.3%, 15.7% and 14.9%. The phenotypes of the five melon cultivars under salt stress are shown in Figure 2. Salinity clearly stunted the growth of all five cultivars, with more pronounced effects observed after 20 days of exposure. Notably, necrosis was evident in the cotyledons of all varieties, with ‘QDG’ showing necrosis and wilting in a greater number of true leaves after 20 days of the 100 mM salt treatment. Similar damage, albeit on fewer leaves, was observed on ‘HGD’. In contrast, ‘KLK’, ‘21XTG’ and ‘LTP’ exhibited only cotyledon necrosis, with all true leaves maintaining normal conditions.
Table 3.
Morphological changes in different melon varieties under salt stress.
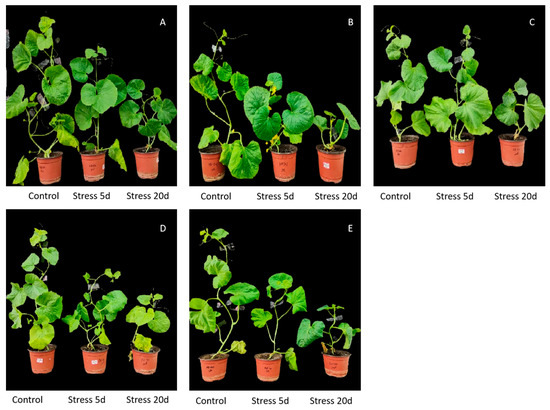
Figure 2.
Growth phenotypes of five melon varieties under different salt stress durations. Control plants received half-strength Hoagland nutrient solution, while treatment plants were watered with 100 mM increments of NaCl dissolved in half-strength Hoagland solution at two-leaf stage. The growth phenotypes of KLK (A), 21XTG (B); LTP (C), QDG (D) and HGD (E) were observed after 0, 5 and 20 days of salt stress.
3.2. Salt-Tolerant Varieties Enhanced Salt Tolerance by Reducing Na+ and Accumulating More K+
NMT measurements within the mesophyll (avoiding vein) indicated a uniform pattern regarding the K+ fluxes in ‘KLK’ and ‘LTP’ when subjected to salinity stress at a concentration of 100 mM. Both salt-treated cultivars exhibited significant decreases in K+ influxes compared to plants under non-saline conditions. In contrast, ‘QDG’ and ‘HGD’ showed notable shifts from K+ influxes to pronounced effluxes under 100 mM salinity stress. In the absence of salinity stress, ‘21XTG’ maintained K+ efflux, but when exposed to 100 mM salinity stress, its K+ outflow velocity rapidly decreased (Figure 3A). To further verify these findings, relative expression levels of TPK (two-pore K+ channel, Cucumis sativus t, K2P) were assessed. The result showed that the TPK gene was up-regulated and reached its peak after 24 h salt stress. During this timeframe, the TPK gene relative expression level in ‘KLK’ was 1.9 times higher than that in ‘QDG’ (Figure 3G).
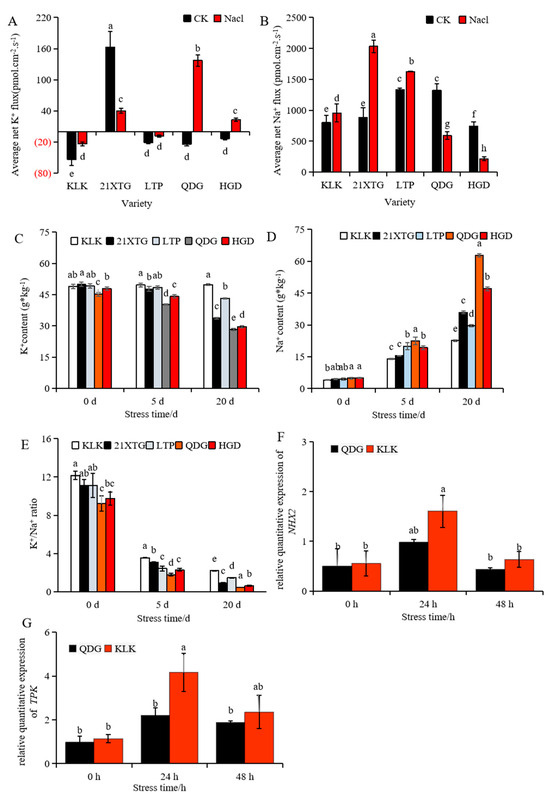
Figure 3.
Salt stress disrupts ion balance in different melon cultivars. (A,B): Average flow velocity of K+ (A) and Na+ (B) was determined in leaves of different melon varieties treated with 100 mmol·L−1 NaCl for 24 h. The above horizontal coordinate indicates that K+ is in the outflow state, and the below horizontal coordinate indicates that K+ is in the internal flow state (A). (C–E): K+ content (C), Na+ content (D) and the K+/Na+ ratio (E) in leaves of different melon cultivars under salt stress for 0, 5 and 20 days. (F,G): Relative expressions of salt tolerance genes NHX2 (F) and TPK (G) was determined in leaves of a salt-tolerant melon cultivar ‘KLK’ and a salt-sensitive cultivar ‘QDG’ under salt stress for 0, 24 and 48 h. All data are presented as means ± SE derived from 3 biological replicates. Different letters indicate significant statistical difference (p < 0.05) tested by analysis of variance (ANOVA) followed by Duncan multiple comparisons as post hoc analysis.
NMT measurements in the mesophyll (avoiding vein) unveiled a consistent pattern of Na+ fluxes in ‘KLK’, ‘21XTG’ and ‘LTP’ when subjected to 100 mM salinity stress. These salt-treated cultivars exhibited notable increases in Na+ efflux compared to their non-saline-treated counterparts. In contrast, ‘QDG’ and ‘HGD’ exhibited significant decreases in Na+ effluxes when exposed to 100 mM salinity stress (Figure 3B). The mesophyll of ‘KLK’, ‘21XTG’ and ‘LTP’ demonstrated a greater capacity to exclude Na+ compared to that of ‘QDG’ and ‘HGD’. Simultaneously, the relative expression of the Na+/H+ antiporter gene NHX was up-regulated and reached its peak after 24 h salt stress. The NHX gene relative expression level in ‘KLK’ was 1.64 times higher than that in ‘QDG’ (Figure 3F).
Simultaneously, the Na+ content in leaves increased (Figure 3D), while K+ content decreased upon salt stress (Figure 3C). ‘KLK’, ‘21XTG’ and ‘LTP’ exhibited higher K+/Na+ ratios (Figure 3E). As the duration of salt stress extended, the Na+ content in the leaves of different melon seedling varieties showed an increasing trend. After 5 days of salt stress, all five varieties (‘KLK’, ‘21XTG’, ‘LTP’, ‘QDG’, ‘HGD’) exhibited significantly higher Na+ concentrations compared to the control group, with increases of 2.47, 2.44, 3.5, 3.59, and 2.92 times, respectively. After 20 days of salt stress, the Na+ content of five melon varieties increased by 4.60, 7.01, 5.70, 11.84 and 8.58 times compared to the control group, respectively. Notably, ‘KLK’ exhibited the lowest Na+ concentration in the leaves after salt stress, while ‘QDG’ displayed the highest. Under salt stress for 20 days, the Na+ content in ‘QDG’ was 2.78 times that of ‘KLK’. Conversely, with increasing stress duration, K+ content in leaves of different melon seedling varieties showed a decreasing trend, except for ‘KLK’, which experienced a slight increase. After 5 days of salt stress, K+ content in ‘KLK’ increased by 1.4%, while K+ content in ‘21XTG’, ‘LTP’, ‘QDG’, and ‘HGD’ decreased by 4.3%, 1.4%, 10.8%, and 7.7%, respectively, compared to the non-stress condition. After 20 days of salt stress, K+ content in ‘KLK’ increased by 1.7% compared to the CK, while K+ content in ‘21XTG’, ‘LTP’, ‘QDG’ and ‘HGD’ decreased by 32.4%, 12.1%, 37.6% and 38.1% compared to the CK, respectively. As depicted in Figure 3E, the K+/Na+ ratio exhibited an overall declining trend. ‘KLK’, ‘21XTG’ and ‘LTP’ had significantly higher K+/Na+ ratios compared to ‘QDG’ and ‘HGD’. The ‘KLK’ boasted the highest K+/Na+ ratio, while the ‘QDG’ had the lowest.
In conclusion, ‘KLK’, ‘21XTG’ and ‘LTP’ exhibited elevated K+/Na+ ratios through the retention of K+ and the enhancement of Na+ export, ultimately bolstering their salt tolerance.
3.3. Salt Stress Caused Lipid Peroxidation in Melon Seedlings, Resulting in Damaged Plasma Membrane
The content of malondialdehyde in the leaves of melon seedlings increased gradually with the duration of salt stress, reaching its highest level after 20 days of exposure. Among the melon varieties, ‘QDG’ exhibited the highest malondialdehyde content, while ‘KLK’ had the lowest. Notably, the malondialdehyde content in ‘QDG’ was 1.81 times higher than that in ‘KLK’ (Figure 4A). The relative transcript level of the gene encoding lipid transfer protein (LTP) increased significantly after salt stress. In particular, the LTP transcript level in the leaves of ‘KLK’ was significantly higher than that in ‘QDG’ at 48 h, with ‘KLK’ exhibiting an expression level 2.73 times higher, as shown in Figure 4B.
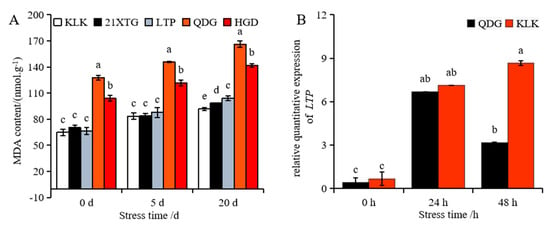
Figure 4.
Malondialdehyde (MDA) content was determined in leaves of different melon cultivars under salt stress for 0, 5 and 20 days (A). Relative expressions of salt tolerance gene LTP (B) was determined in leaves of a salt-tolerant melon cultivar ‘KLK’ and a salt-sensitive cultivar ‘QDG’ under salt stress for 0, 24 and 48 h. All data are presented as means ± SE derived from 3 biological replicates. Different letters indicate significant statistical difference (p < 0.05) tested by analysis of variance (ANOVA) followed by Duncan multiple comparisons as post hoc analysis.
3.4. The Impact of Salt Stress on Antioxidant System of Different Melon Cultivars
As the duration of salt stress increased, the activities of the enzymes superoxide dismutase (SOD), peroxidase (POD), and Catalase (CAT) in leaves of five melon cultivars initially increased and then decreased (Figure 5A–C). In contrast, the activity of ascorbate peroxidase (APX) enzyme exhibited a continuous increase (Figure 5D). Under non-saline conditions, ‚KLK’, ‘21XTG’, and ‘LTP’ displayed significantly higher SOD, CAT and POD activities compared to ‘QDG’, with the order of enzyme activity being ‘KLK’ > ‘LTP’ > ‘21XTG’ > ‘HGD’ > ‘QDG’. The APX enzyme activity in ‘KLK’ and ‘LTP’ was also significantly higher than that in ‘QDG’ and ‘HGD’. Under short-term stress (5 d), ‘KLK’ exhibited the highest SOD, POD, CAT and APX activities, while ‘QDG’ had the lowest. The SOD, POD, CAT and APX activities in ‘KLK’ were 1.51, 2.02, 1.46 and 1.82 times higher than those in ‘QDG’, respectively. After salt stress for 20 days, the SOD, POD and CAT activities in the leaves of ‘KLK’, ‘21XTG’ and ‘LTP’ were significantly higher than those in QDG’ and ‘HGD’. ‘QDG’ had the lowest enzyme activity, while ‘KLK’ had the highest enzyme activity. Specifically, SOD, POD and CAT enzyme activities in ‘KLK’ were 1.69, 1.54 and 3.21 times higher than those in ‘QDG’, respectively. The APX enzyme activity in ‘KLK’ and ‘LTP’ was significantly higher than that in ‘QDG’ and ‘HGD’. The APX enzyme activity in ‘KLK’ was 1.49 and 1.66 times higher than that in ‘HGD’ and ‘QDG’, respectively, while that in ‘LTP’ was 1.25 and 1.39 times higher than that in ‘HGD’ and ‘QDG’.
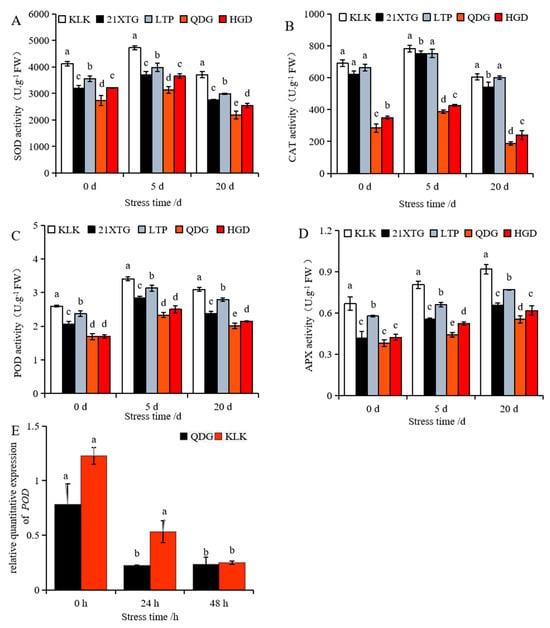
Figure 5.
The enzyme activity of SOD (A), CAT (B), POD (C) and APX (D) was determined in leaves of different melon cultivars under salt stress for 0, 5 and 20 days. Relative expressions of salt tolerance gene POD (E) were determined in leaves of a salt-tolerant melon cultivar ‘KLK’ and a salt-sensitive cultivar ‘QDG’ under salt stress for 0, 24 and 48 h. All data are presented as means ± SE derived from 3 biological replicates. Different letters indicate significant statistical difference (p < 0.05) tested by analysis of variance (ANOVA) followed by Duncan multiple comparisons as post hoc analysis.
Additionally, a down-regulated expression trend of POD (peroxidase 43) was observed (Figure 5E). Nevertheless, throughout the entire process, the relative transcript level of POD in ‘KLK’ was higher than that in ‘QDG’. This indicated that the activity of antioxidant enzymes and the antioxidant-related gene expression in ‘KLK’, ‘21XTG’ and ‘LTP’ were consistently higher than those in ‘HGD’ and ‘QDG’.
3.5. The Impact of Salt Stress on Osmotic Regulatory Substances in Different Melon Cultivars
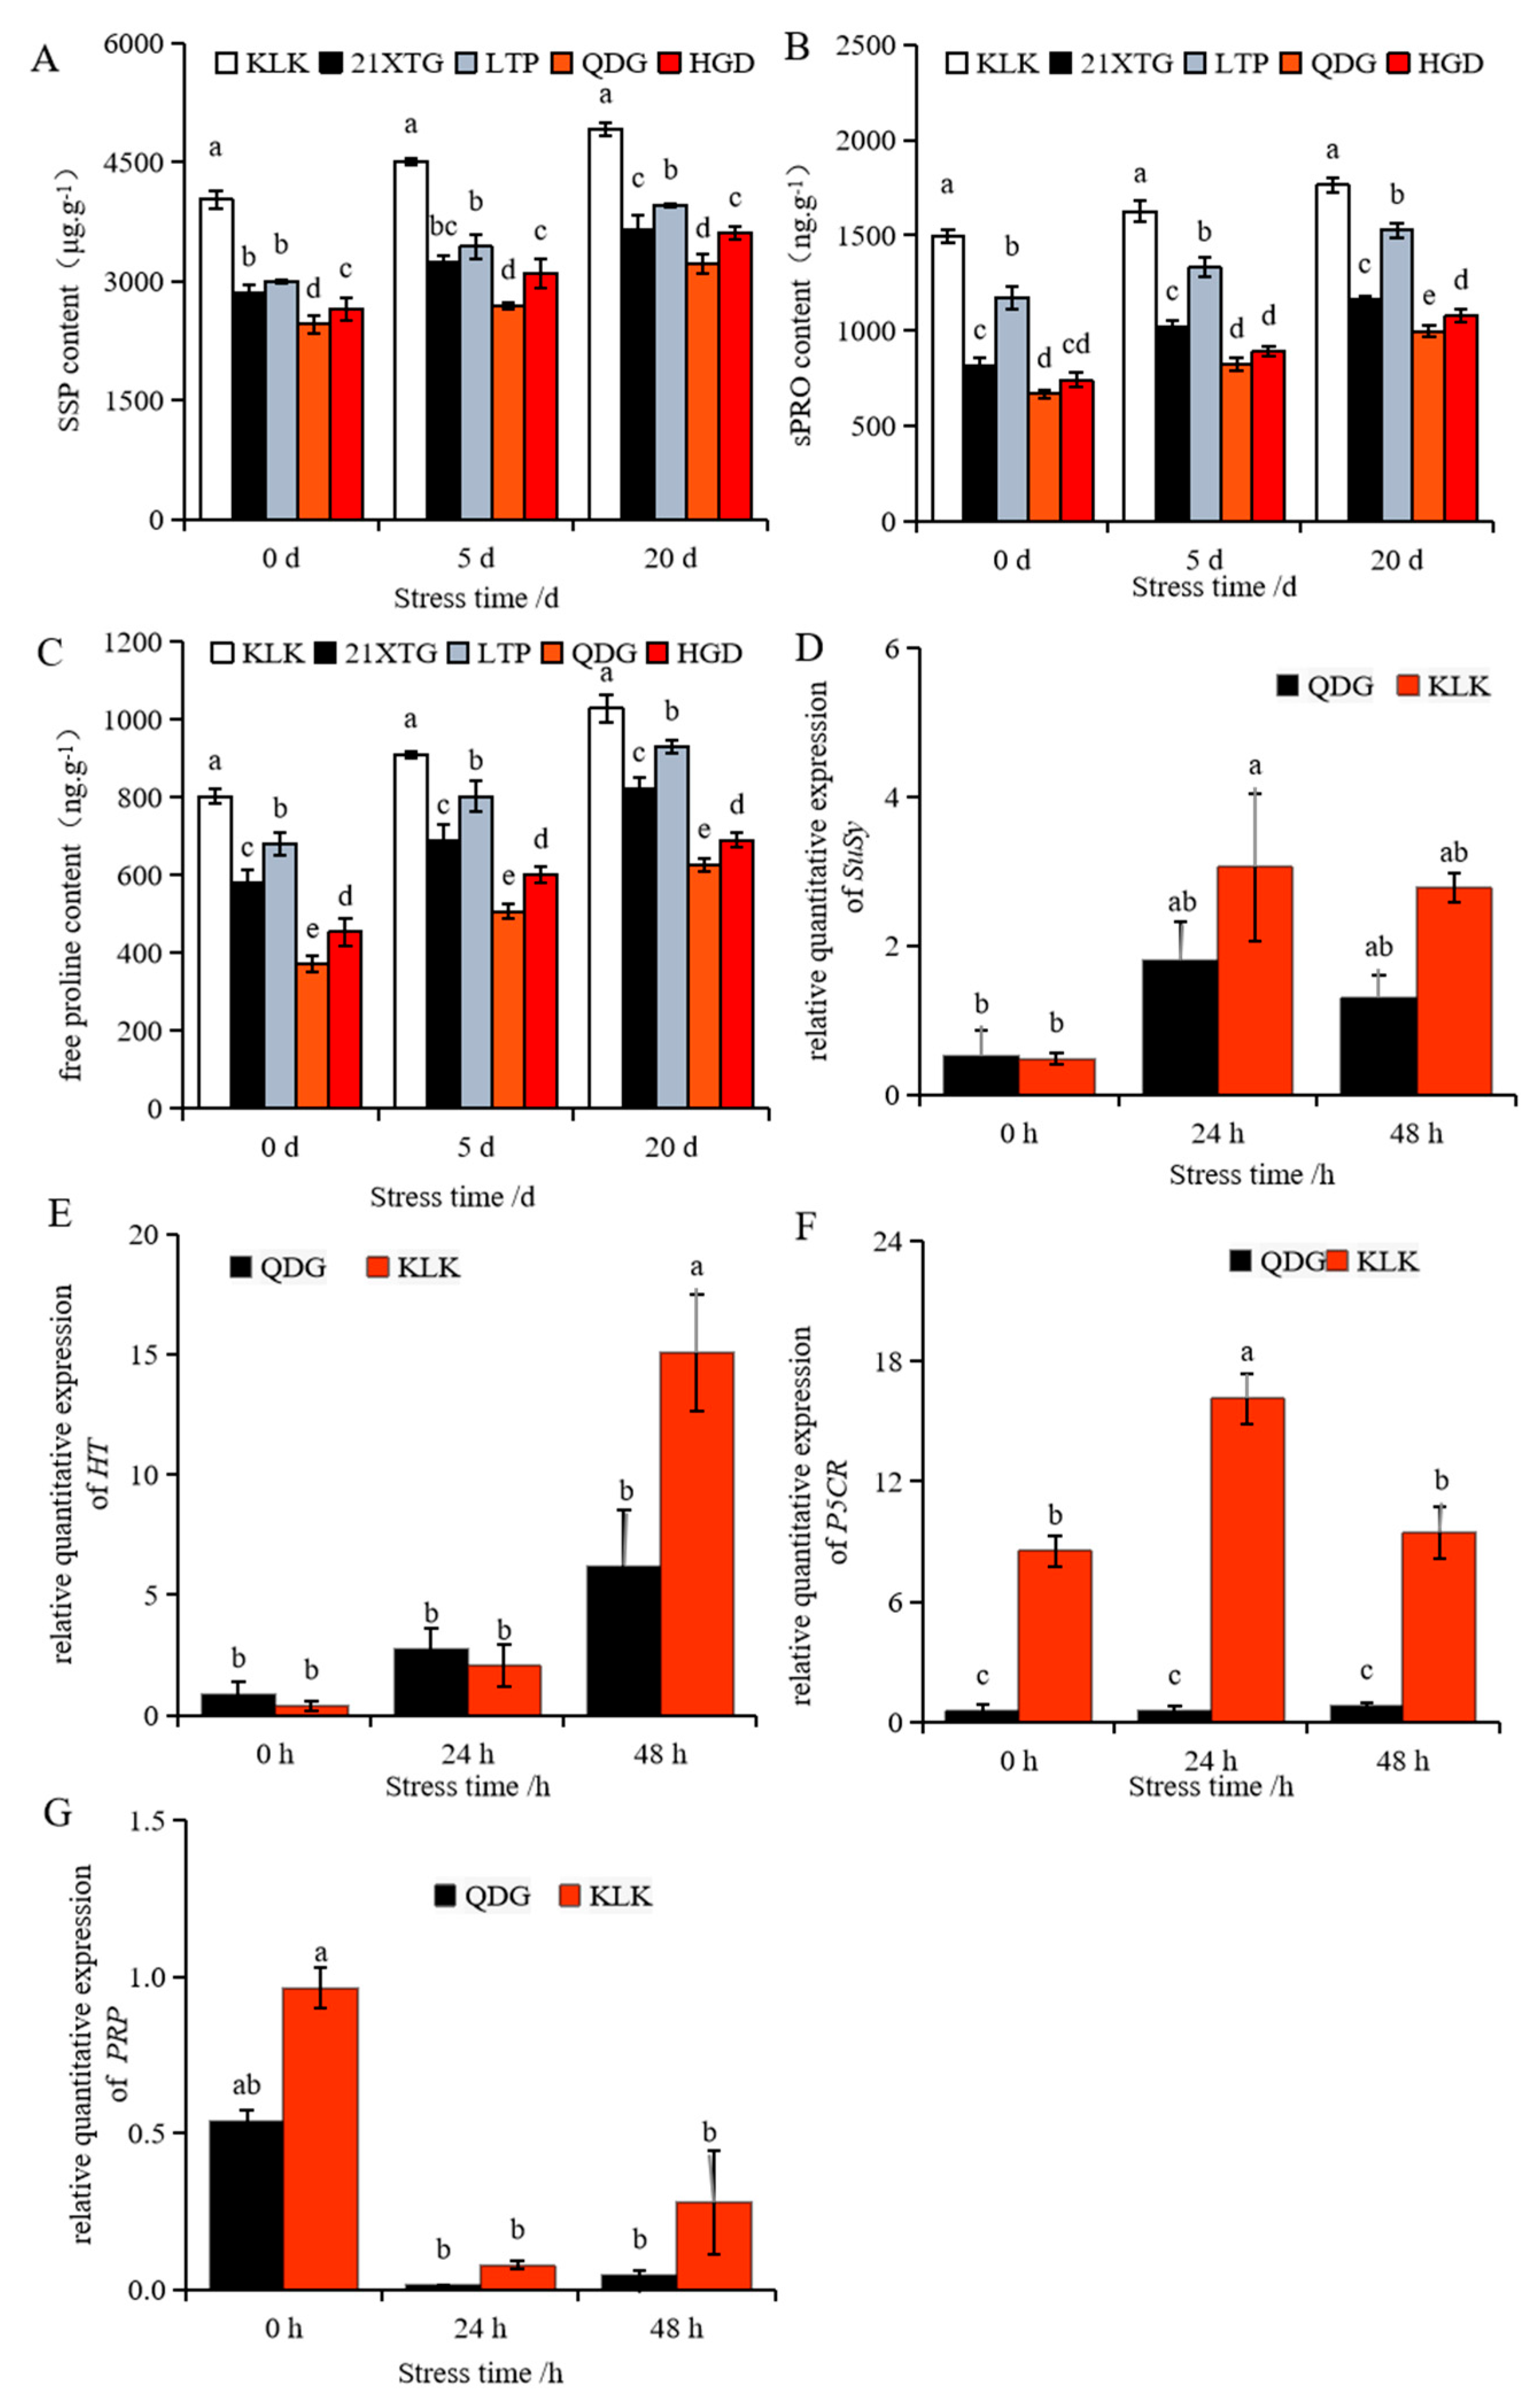
As the duration of salt stress increased, the levels of soluble sugar (SS), soluble protein (sPRO) and free proline in the leaves of the five melon varieties displayed a gradual upward trend (Figure 6A–C). Concurrently, the upregulation of a gene encoding sucrose synthase (SuSy) and a gene encoding hexose transporter (HT) was observed (Figure 6D,E). The expression of proline-related gene pyrroline-5-carboxylate reductase (P5CR) was up-regulated after 24 h of salt stress and then down-regulated (Figure 6F). The relative transcript level of the gene encoding a proline-rich protein (PRP) was significantly inhibited under salt stress (Figure 6G). Comparing the results to non-saline conditions, after 5 days of salt stress, the contents of soluble sugar, soluble protein and free proline in the leaves of five melon cultivars increased. Notably, ‘KLK’ exhibited the highest levels, while ‘QDG’ had the lowest. Specifically, the soluble sugar and protein contents and free proline level in ‘KLK’ were 1.67, 1.98 and 1.80 times that of ‘QDG’, respectively. After 20 days of salt stress, ‘KLK’ and ‘LTP’ maintained significantly higher levels compared to ‘HGD’ and ‘QDG’. ‘KLK’ had the highest levels of soluble sugars, proteins, and free proline, which was 1.53 times that in ‘QDG’. In line with these physiological measurements, the relative transcript level of SuSy and HT in ‘KLK’ after 24 h of salt stress was 2.15 times and 2.43 times higher than that in ‘QDG’. In line with these physiological indexes, the relative expression of SuSy and HT in ‘KLK’ was 2.15 times and 2.43 times higher than that in ‘QDG’ after 24 h of salt stress. Moreover, the soluble protein and free proline contents in ‘KLK’, ‘21XTG’ and ‘LTP’ were significantly higher than those in ‘HGD’ and ‘QDG’, with ‘KLK’ recording the highest level, at 1.77 and 1.64 times that of ‘QDG’, respectively. Additionally, the relative expression of PRPs and P5CR in ‘KLK’ was 6.11 times and 11.62 times higher than that in ‘QDG’, respectively. In conclusion, ‘KLK’, ‘21XTG’ and ‘LTP’ accumulated more soluble sugar, soluble protein, and free proline, and exhibited up-regulated transcript levels of genes involved in the synthesis of osmoregulatory substances (SuSy, HT, PRPs, P5CR) compared to ‘HGD’ and ‘QDG’.

Figure 6.
Contents of soluble sugar (A), soluble protein (B), and free proline (C) were determined in leaves of different melon cultivars under salt stress for 0, 5 and 20 days. Relative expressions of sucrose synthase (SuSy) (D), Hexose transporter gene (HT) (E), pyrroline-5-carboxylate reductase (P5CR) (F), and 14 kDa proline-rich protein (PRP) (G) in leaves of a salt-tolerant melon cultivar ‘KLK’ and a salt-sensitive cultivar ‘QDG’ under salt stress for 0, 24 and 48 h. All data are presented as means ± SE derived from 3 biological replicates. Different letters indicate significant statistical differences (p < 0.05) tested by analysis of variance (ANOVA) followed by Duncan multiple comparisons as post hoc analysis.
4. Discussion
One of the key characteristics of salt-tolerant plants in response to salt stress is the maintenance of intracellular ion homeostasis [35]. In order to prevent cell damage and nutrient deficiency, plants usually regulate cytoplasmic Na+/K+ by decreasing Na+ and increasing K+ under salt stress conditions [36]. In this study, ion flux detection technology was employed to dynamically monitor K+ and Na+ fluxes after 24 h of salt stress in melon seedling leaves. The results showed that K+ fluxes in the leaves of ‘KLK’ and ‘LTP’ continued to exhibit influxes, whereas K+ effluxes in ‘21XTG’ slowed down rapidly. In contrast, K+ fluxes in ‘QDG’ and ‘HGD’ shifted rapidly from influx to efflux after salt stress, especially in ‘QDG’. This observation confirmed that ‘KLK’ ‘21XTG’ and ‘LTP’ had a better K+ retention ability under salt stress. This finding aligns with previous research, which demonstrated that the expression of NtTPK1 in BY-2 cells was increased by 2 times when cells were exposed to 250 mM NaCl [37], and overexpression of NtTPK1 resulted in salt tolerance in rice [38]. Our study showed that under salt stress, the K+ content in ‘KLK’ ‘21XTG’ and ‘LTP’ was higher than that in ‘QDG’ and ‘HGD’. Additionally, the relative transcript level of potassium channel gene TPK in ‘KLK’ was notably increased compared to that in ‘QDG’. This result was consistent with the dynamic ion flux detection, demonstrating that the high K+ concentration in ‘KLK’ ‘21XTG’ and ‘LTP’ was mainly achieved by maintaining the absorption rate of K+ [21]. The K+/Na+ ratio is often considered as a critical feature of plant salt tolerance and is a key indicator used by breeders to screen for salt-tolerant varieties [39,40]. The NHXs family of genes holds a significant role in maintaining the balance of Na+ and K+ ions in plants [41]. NHX in the vacuole membrane enable plants to sequester Na+ to the vacuole, thus reducing the content of Na+ in the cytoplasm and alleviating ion toxicity [42,43]. Some studies have found that the expression of CqNHX1 gene in Quinoa is up-regulated under salt stress in salt-tolerant local varieties [44,45]. In this study, ‘KLK’ exhibited a higher K+/Na+ ratio, and the NHX2 gene expression in both ‘KLK’ and ‘QDG’ was up-regulated under salt stress. Specifically, NHX2 expression in the leaves of ‘KLK’ after 24 h of salt stress was 1.64 times higher than that in ‘QDG’, and the Na+ efflux rate was 1.62 times higher in ‘KLK’ than that in ‘QDG’. Consequently, the Na+ content in ‘QDG’ was 2.78 times higher than that in ‘KLK’. These findings confirm that ‘KLK’ exhibits greater salt tolerance than ‘QDG’, and salt-tolerant varieties enhance salt tolerance by increasing Na+ efflux and reducing Na+ content in the plant, consistent with previous findings in reed [46].
Under salt stress, plants employ various strategies to regulate the absorption of Na+ and Cl- to prevent ion toxicity. Additionally, they must accumulate sufficient solutes for osmotic regulation [47]. In this study, it was observed that the soluble sugar level increased significantly after salt stress. Notably, ‘KLK’ ‘21XTG’ and ‘LTP’ exhibited significantly higher soluble sugar levels compared to ‘QDG’ and ‘HGD’. Previous studies have found that proline content increased significantly under salt stress in tomato [48] and Arabidopsis thaliana [49]. Furthermore, the accumulation of proline has been positively correlated with salt tolerance [50]. Consistent with these findings, the current study demonstrated an increase in proline content after salt stress, with ‘KLK’ ‘21XTG’ and ‘LTP’ exhibiting higher levels than ‘QDG’ and ‘HGD’. The high concentration of soluble proteins in plant cells can help maintain a low osmotic potential, improve cell water retention, and protect cell membranes. In this study, as the duration of salt stress increased, the soluble protein content in leaves also increased. Notably, ‘QDG’ had the lowest soluble protein content, while ‘KLK’ had the highest. This difference in soluble protein content is one of the factors contributing to the greater osmotic regulation ability of salt-tolerant cultivars compared to the salt-sensitive ones. The results of real-time quantitative PCR showed that genes related to glucose metabolism (SuSy and HK) and proline synthesis (the PRP encoding proline-rich protein (PRPs) kDa and P5CR) were up-regulated in ‘KLK’ compared to ‘QDG’. These findings highlight the importance of osmoregulatory substance accumulation in enhancing salt stress resistance in melon varieties like ‘KLK’, ‘21XTG’, and ‘LTP’.
The imposition of salt stress on plants induces the overproduction of reactive oxygen species (ROS), a phenomenon that can lead to membrane lipid peroxidation and alterations in the structure and functionality of cell membranes. Malondialdehyde (MDA) serves as a byproduct of membrane lipid peroxidation and offers valuable insights into the assessment of cell membrane integrity to a certain degree [51]. Our results revealed that MDA content increased progressively with the duration of salt stress. Notably, ‘QDG’ had higher content of MDA compared to ‘KLK’, ‘21XTG’ and ‘LTP’. This suggests varying degrees of plasma membrane damage following salt stress, with ‘QDG’ experiencing more severe damage. Lipid transfer proteins (LTP) transport lipid between cell membranes to repair membrane damage caused by stress and regulate osmotic pressure and membrane fluidity [52]. Several studies have indicated that LTPs are involved in salt stress to some extent [53,54,55]. For example, research has shown that salt stress can induce significant expression of the LTP gene in soybean roots [56]. Consistent with these findings, this study observed an up-regulation of LTP gene expression after salt stress, with ‘KLK’ exhibiting higher expression levels compared to ‘QDG’.
The removal of reactive oxygen species (ROS) represents a crucial mechanism employed by plants to combat oxidative stress and thereby enhance salt tolerance [57]. The plant antioxidant system plays a pivotal role in eliminating excess ROS, preventing damage to plants caused by ROS accumulation [58,59] and preserving a dynamic equilibrium between ROS generation and removal [36]. Studies have consistently demonstrated that salt-tolerant varieties possess more robust antioxidant defense systems, characterized by higher activities of SOD, CAT and POD enzymes compared to salt-sensitive varieties under salt stress [60]. Our study showed that the SOD, POD and CAT activities initially increased and then decreased with prolonged salt stress, while the APX activities increased continuously. Moreover, ‘KLK’, ‘21XTG’ and ‘LTP’ displayed higher enzyme activity than ‘HGD’ and ‘QDG’. Comparable findings were also observed in wheat [61] and maize [62]. Additionally, we found altered expression of POD genes, which play a vital role in intracellular ROS detoxification and in maintaining ROS balance within cells. The up-regulation of POD expression following salt stress was in alignment with physiological indices, and it was observed that the relative transcript level of POD in ‘KLK’ was higher than that in ‘QDG’. The results suggested that under salt stress conditions, there was an induction of POD expression and increase in POD activity, which further enhanced the salt tolerance of ‘KLK’, ‘21XTG’ and ‘LTP’.
5. Conclusions and Future Perspectives
In this study, we conducted phenotype observations, comprehensive evaluations of 14 physiological indices, and verified the salt-tolerant gene expression among five melon varieties. As a result, we successfully identified three salt-tolerant materials, with ‘KLK’ demonstrating the highest level of salt tolerance. ‘KLK’ displayed minimal constraints in terms of growth and development under salt stress conditions. These varieties hold potential as valuable donor parents for breeding salt-tolerant melon cultivars. Molecular marker-assisted selection and genetic engineering have been highlighted as crucial strategies for enhancing salt tolerance in crops [63,64]. While hundreds of quantitative trait loci (QTLs) associated with salt tolerance have been identified, progress in subsequent fine-mapping and map-based gene cloning has been relatively slow. One primary obstacle is the limited availability of salt-tolerant varieties in the parental combinations, particularly in melons. For example, in rice, a significant number of QTLs have been identified by using mapping populations derived from crosses between salt-sensitive varieties and salt-tolerant varieties [65,66]. Furthermore, studies have demonstrated that the incorporation of the SNP947-G ZmHKT1;2 allele into elite maize germplasms can enhance salt tolerance by significantly reducing shoot Na+ content, up to an impressive 80% reduction. [67]. Additionally, research has revealed that an at1 allele possessing a truncation at its carboxyl terminal heightens sensitivity, while the knockout of AT1 leads to increased tolerance to alkalinity in various crops, including sorghum, millet, rice, and maize [68]. We can use the salt-tolerant varieties we have identified through screening to pinpoint salt-tolerant or salt-sensitive genes. This knowledge can be applied for conducting marker-assisted selection in breeding programs. Alternatively, we have the option to employ gene editing technology to deactivate salt-sensitive genes. In summary, our work lays the foundation for salt-tolerant breeding of muskmelon in the future.
Supplementary Materials
The following supporting information can be downloaded at: https://www.mdpi.com/article/10.3390/agriculture13112051/s1, Table S1. RNA Quality Control Results Summary.
Author Contributions
Methodology, X.Z. and B.L.; formal analysis, W.Y.; data curation, Y.L. and M.L.; writing—original draft preparation, W.Y.; project administration, X.Z. All authors have read and agreed to the published version of the manuscript.
Funding
This work was supported by the Project of Renovation Capacity Building for the Young Sci-Tech Talents Sponsored by Xinjiang Academy of Agricultural Sciences (xjnkq-2020009), Xinjiang Academy of Agricultural Sciences Science and technology innovation key cultivation Special project (xjkcpy-2022006) and China Agriculture Research System of MOF and MARA (CARS-25).
Data Availability Statement
All data generated or analyzed in this study are included in this published article.
Acknowledgments
The authors would like to acknowledge the Xinjiang Academy of Agricultural Sciences and Hami-melon Research Center, Xinjiang Academy of Agricultural Sciences. We also thank NMT Industrial Alliance for their technical support.
Conflicts of Interest
The authors declare no conflict of interest.
References
- Sarabi, B.; Bolandnazar, S.; Ghaderi, N.; Ghashghaie, J. Genotypic differences in physiological and biochemical responses to salinity stress in melon (Cucumis melo L.) plants: Prospects for selection of salt tolerant landraces. Plant Physiol. Biochem. 2017, 119, 294–311. [Google Scholar] [CrossRef]
- Kumar, K.; Kumar, M.; Kim, S.R.; Ryu, H.; Cho, Y.G. Insights into genomics of salt stress response in rice. Rice 2013, 28, 27. [Google Scholar] [CrossRef] [PubMed]
- Ghoulam, C.; Fares, K. Effect of salinity on seed germination and early seedling growth of sugar beet (Beta vulgaris L.). Seed Sci. Technol. 2001, 29, 357–364. [Google Scholar] [CrossRef]
- Ashraf, M.Y.; Awan, A.R.; Mahmood, K. Rehabilitation of saline ecosystems through cultivation of salt tolerant plants. Pak. J. Bot. 2012, 44, 69–75. [Google Scholar]
- Singh, M.; Nara, U.; Kumar, A.; Choudhary, A.; Singh, H.; Thapa, S. Salinity tolerance mechanisms and their breeding implications. J. Genet. Eng. Biotechnol. 2021, 19, 173. [Google Scholar] [CrossRef]
- Rai, G.K.; Kumar, P.; Choudhary, S.M.; Kosser, R.; Khanday, D.M.; Choudhary, S.; Kumar, B.; Magotra, I.; Kumar, R.R.; Ram, C.; et al. Biomimetic Strategies for Developing Abiotic Stress-Tolerant Tomato Cultivars: An Overview. Plants 2022, 12, 86. [Google Scholar] [CrossRef] [PubMed]
- Shelake, R.M.; Kadam, U.S.; Kumar, R.; Pramanik, D.; Singh, A.K.; Kim, J.Y. Engineering drought and salinity tolerance traits in crops through CRISPR-mediated genome editing: Targets, tools, challenges, and perspectives. Plant Commun. 2022, 3, 100417. [Google Scholar] [CrossRef] [PubMed]
- FAO. FAOSTAT Database. Food and Agriculture Organization of the United Nations. Available online: http://faostat3.fao.org (accessed on 1 April 2022).
- Botía, P.; Navarro, J.M.; Cerdá, A.; Martínez, V. Yield and fruit quality of two melon cultivars irrigated with saline water at different stages of development. Europ. J. Agron. 2005, 23, 243–253. [Google Scholar] [CrossRef]
- Xiong, M.; Zhang, X.; Shabala, S.; Shabala, L.; Chen, Y.; Xiang, C.; Nawaz, M.A.; Bie, Z.; Wu, H.; Yi, H. Evaluation of salt tolerance and contributing ionic mechanism in nine Hami melon landraces in Xinjiang, China. Sci. Hortic. 2018, 237, 277–286. [Google Scholar] [CrossRef]
- Wang, L.M.; Zhang, L.D.; Chen, J.B.; Huang, D.F.; Zhang, Y.D. Physiological analysis and transcriptome comparison of two muskmelon (Cucumis melo L.) cultivars in response to salt stress. Genet. Mol. Res. 2016, 15, 1–18. [Google Scholar] [CrossRef]
- Zhao, L.; Zhang, F.; Liu, B.; Yang, S.; Xiong, X.; Hassani, D.; Zhang, Y. CmRAV1 shows differential expression in two melon (Cucumis melo L.) cultivars and enhances salt tolerance in transgenic Arabidopsis plants. Acta Biochim. Biophys. Sin. 2019, 51, 1123–1133. [Google Scholar] [CrossRef]
- Aduse Poku, S.; Nkachukwu Chukwurah, P.; Aung, H.H.; Nakamura, I. Over-Expression of a Melon Y3SK2-Type LEA Gene Confers Drought and Salt Tolerance in Transgenic Tobacco Plants. Plants 2020, 9, 1749. [Google Scholar] [CrossRef]
- Huang, T.-L.; Zhao, L.-N.; Gao, L.-W.; Véry, A.-A.; Sentenac, A.; Zhang, Y.-D. Constitutive expression of CmSKOR, an outward K+ channel gene from melon, in Arabidopsis thaliana involved in saline tolerance. Plant Sci. 2018, 274, 492–502. [Google Scholar] [CrossRef]
- Zhang, G.; Ding, Q.; Wei, B. Genome-wide identification of superoxide dismutase gene families and their expression patterns under low-temperature, salt and osmotic stresses in watermelon and melon. 3 Biotech 2021, 11, 194. [Google Scholar] [CrossRef]
- Munns, R.; Tester, M. Mechanisms of salinity tolerance. Annu. Rev. Plant Biol. 2008, 59, 651–681. [Google Scholar] [CrossRef] [PubMed]
- Geilfus, C.M.; Ludwig-Müller, J.; Bárdos, G.; Zörb, C. Early response to salt ions in maize (Zea mays L.). J. Plant Physiol. 2018, 220, 173–180. [Google Scholar] [CrossRef]
- Gong, Z.; Xiong, L.; Shi, H.; Yang, S.; Herrera-Estrella, L.R.; Xu, G.; Chao, D.Y.; Li, J.; Wang, P.Y.; Qin, F.; et al. Plant abiotic stress response and nutrient use efficiency. Sci. China Life Sci. 2020, 63, 635–674. [Google Scholar] [CrossRef]
- He, X.; Wan, Z.; Jin, N.; Jin, L.; Zhang, G.; Lyu, J.; Liu, Z.; Luo, S.; Yu, J. Enhancement of cucumber resistance under salt stress by 2, 4-epibrassinolide lactones. Front. Plant Sci. 2022, 13, 1023178. [Google Scholar] [CrossRef] [PubMed]
- Wang, Y.; Zhao, H.; Xu, L.; Zhang, H.; Xing, H.; Fu, Y.; Zhu, L. PUB30-mediated downregulation of the HB24-SWEET11 module is involved in root growth inhibition under salt stress by attenuating sucrose supply in Arabidopsis. New Phytol. 2023, 237, 1667–1683. [Google Scholar] [CrossRef] [PubMed]
- Gupta, B.; Huang, B. Mechanism of salinity tolerance in plants: Physiological, biochemical, and molecular characterization. Int. J. Genom. 2014, 2014, 701596. [Google Scholar] [CrossRef]
- Tester, M.; Davenport, R. Na+ tolerance and Na+ transport in higher plants. Ann. Bot. 2003, 91, 503–527. [Google Scholar] [CrossRef]
- Irshad, A.; Ahmed, R.I.; Ur Rehman, S.; Sun, G.; Ahmad, F.; Sher, M.A.; Aslam, M.Z.; Hassan, M.M.; Qari, S.H.; Aziz, M.K.; et al. Characterization of salt tolerant wheat genotypes by using morpho-physiological, biochemical, and molecular analysis. Front. Plant Sci. 2022, 13, 956298. [Google Scholar] [CrossRef]
- Wu, H.; Shabala, L.; Barry, K.; Zhou, M.; Shabala, S. Ability of leaf mesophyll to retain potassium correlates with salinity tolerance in wheat and barley. Physiol Plant. 2013, 149, 515–527. [Google Scholar] [CrossRef] [PubMed]
- Edelstein, M.; Plaut, Z.; Ben-Hur, M. Sodium and chloride exclusion and retention by non-grafted and grafted melon and Cucurbita plants. J. Exp. Bot. 2011, 62, 177–184. [Google Scholar] [CrossRef] [PubMed]
- Al-aghabary, K.; Zhu, Z.; Shi, Q. Influence of Silicon Supply on Chlorophyll Content, Chlorophyll Fluorescence, and Antioxidative Enzyme Activities in Tomato Plants Under Salt Stress. J. Plant Nutr. 2005, 27, 2101–2115. [Google Scholar] [CrossRef]
- Liu, M.; Xu, Z.; Yang, Y.; Feng, Y. Effects of different spectral lights on Oncidium PLBs induction, proliferation, and plant regeneration. Plant Cell Tissue Organ Cult. (PCTOC) 2011, 106, 10. [Google Scholar] [CrossRef]
- Kučerová, K.; Henselová, M.; Slováková, Ľ.; Hensel, K. Effects of plasma activated water on wheat: Germination, growth parameters, photosynthetic pigments, soluble protein content, and antioxidant enzymes activity. Plasma Process. Polym. 2019, 16, 1800131. [Google Scholar] [CrossRef]
- Ábrahám, E.; Hourton-Cabassa, C.; Erdei, L.; Szabados, L. Methods for determination of proline in plants. Plant Stress Toler. 2010, 639, 317–331. [Google Scholar] [CrossRef]
- Kong, L.; Wang, F.; Si, J.; Feng, B.; Zhang, B.; Li, S. Increasing in ros levels and callose deposition in peduncle vascular bundles of wheat (Triticum aestivum L.) grown under nitrogen deficiency. J. Plant Interact. 2013, 8, 109–116. [Google Scholar] [CrossRef]
- Gutiérrez, D.R.; Chaves, A.R.; Rodrígues, S.C. Effect of uv-c and ozone on the bioactive compounds and antioxidant capacity of minimally processed rocket (eruca sativa mill.). Int. J. New Technol. Res. 2018, 4, 107–113. [Google Scholar] [CrossRef]
- Liu, D.; Dong, S.; Miao, H.; Liu, X.; Li, C.; Han, J.; Zhang, S.; Gu, X. A Large-Scale Genomic Association Analysis Identifies the Candidate Genes Regulating Salt Tolerance in Cucumber (Cucumis sativus L.) Seedlings. Int. J. Mol. Sci. 2022, 23, 8260. [Google Scholar] [CrossRef] [PubMed]
- Livak, K.J.; Schmittgen, T.D. Analysis of relative gene expression data using real-time quantitative PCR and the 2(-Delta Delta C(T)) Method. Methods 2001, 25, 402–408. [Google Scholar] [CrossRef]
- Kong, Q.; Yuan, J.; Niu, P.; Xie, J.; Jiang, W.; Huang, Y.; Bie, Z. Screening suitable reference genes for normalization in reverse transcription quantitative real-time PCR analysis in melon. PLoS ONE 2014, 9, e87197. [Google Scholar] [CrossRef]
- Hussain, S.; Hussain, S.; Ali, B.; Ren, X.; Chen, X.; Li, Q.; Saqib, M.; Ahmad, N. Recent progress in understanding salinity tolerance in plants: Story of Na+/K+ balance and beyond. Plant Physiol. Biochem. 2021, 160, 239–256. [Google Scholar] [CrossRef]
- Yang, Y.; Guo, Y. Elucidating the molecular mechanisms mediating plant salt-stress responses. New Phytol. 2018, 217, 523–539. [Google Scholar] [CrossRef] [PubMed]
- Hamamoto, S.; Marui, J.; Matsuoka, K.; Higashi, K.; Igarashi, K.; Nakagawa, T.; Kuroda, T.; Mori, Y.; Murata, Y.; Nakanishi, Y.; et al. Characterization of a tobacco TPK-type K+ channel as a novel tonoplast K+ channel using yeast tonoplasts. J. Biol. Chem. 2008, 283, 1911–1920. [Google Scholar] [CrossRef]
- Obata, T.; Kitamoto, H.K.; Nakamura, A.; Fukuda, A.; Tanaka, Y. Rice shaker potassium channel OsKAT1 confers tolerance to salinity stress on yeast and rice cells. Plant Physiol. 2007, 144, 1978–1985. [Google Scholar] [CrossRef]
- Flowers, T.J.; Colmer, T.D. Plant salt tolerance: Adaptations in halophytes. Ann. Bot. 2015, 115, 327–331. [Google Scholar] [CrossRef] [PubMed]
- Poustini, K.; Siosemardeh, A. Ion distribution in wheat cultivars in response to salinity stress. Field Crop Res. 2004, 85, 125–133. [Google Scholar] [CrossRef]
- Su, Q.; Zheng, X.; Tian, Y.; Wang, C. Exogenous Brassinolide Alleviates Salt Stress in Malus hupehensis Rehd. by Regulating the Transcription of NHX-Type Na+(K+)/H+ Antiporters. Front. Plant Sci. 2020, 11, 38. [Google Scholar] [CrossRef]
- Shi, H.; Ishitani, M.; Kim, C.; Zhu, J.K. The Arabidopsis thaliana salt tolerance gene SOS1 encodes a putative Na+/H+ antiporter. Proc. Natl. Acad. Sci. USA 2000, 97, 6896–6901. [Google Scholar] [CrossRef] [PubMed]
- Apse, M.P.; Aharon, G.S.; Snedden, W.A. Salt tolerance conferred by overexpression of a vacuolar Na+/H+ antiport in Arabidopsis. Science 1999, 285, 1256–1258. [Google Scholar] [CrossRef]
- Ruiz, K.B.; Aloisi, I.; Del Duca, S.; Canelo, V.; Torrigiani, P.; Silva, H.; Biondi, S. Salares versus coastal ecotypes of quinoa: Salinity responses in Chilean landraces from contrasting habitats. Plant Physiol. Biochem. 2016, 101, 1–13. [Google Scholar] [CrossRef] [PubMed]
- Ruiz-Carrasco, K.; Antognoni, F.; Coulibaly, A.K.; Lizardi, S.; Covarrubias, A.; Martínez, E.A.; Molina-Montenegro, M.A.; Biondi, S.; Zurita-Silva, A. Variation in salinity tolerance of four lowland genotypes of quinoa (Chenopodium quinoa Willd.) as assessed by growth, physiological traits, and sodium transporter gene expression. Plant Physiol. Biochem. 2011, 49, 1333–1341. [Google Scholar] [CrossRef]
- Takahashi, R.; Liu, S.; Takano, T. Isolation and characterization of plasma membrane Na(+)/H(+) antiporter genes from salt-sensitive and salt-tolerant reed plants. J. Plant Physiol. 2009, 166, 301–309. [Google Scholar] [CrossRef]
- Munns, R.; Gilliham, M. Salinity tolerance of crops—What is the cost? New Phytol. 2015, 208, 668–673. [Google Scholar] [CrossRef]
- Fujita, T.; Maggio, A.; Garcia-Rios, M.; Bressan, R.A.; Csonka, L.N. Comparative analysis of the regulation of expression and structures of two evolutionarily divergent genes for Delta1-pyrroline-5-carboxylate synthetase from tomato. Plant Physiol. 1998, 118, 661–674. [Google Scholar] [CrossRef] [PubMed]
- Liu, J.; Zhu, J.K. Proline accumulation and salt-stress-induced gene expression in salt-hypersensitive mutant of Arabidopsis. Plant Physiol. 1997, 114, 591–596. [Google Scholar] [CrossRef]
- Sawahel, W.A.; Hassan, A.H. Generation of transgenic wheat plants producing high levels of the osmoprotectant proline. Biotechnol. Lett. 2002, 24, 721–725. [Google Scholar] [CrossRef]
- Bhaskaran, J.; Panneerselvam, R. Accelerated reactive oxygen scavenging system and membrane integrity of two Panicum species varying in salt tolerance. Cell Biochem. Biophys. 2013, 67, 885–892. [Google Scholar] [CrossRef] [PubMed]
- Holmberg, N.; Bülow, L. Improving stress tolerance in plants by gene transfer. Trends Plant Sci. 1998, 3, 61–66. [Google Scholar] [CrossRef]
- Jang, C.S.; Lee, H.J.; Chang, S.J.; Seo, Y.W. Expression and promoter analysis of the TaLTP1 gene induced by drought and salt stress in wheat (Triticum aestivum L.). Plant Sci. 2004, 167, 995–1001. [Google Scholar] [CrossRef]
- García-Garrido, J.M.; Menossi, M.; Puigdoménech, P.; Martínez-Izquierdo, J.A.; Delseny, M. Characterization of a gene encoding an abscisic acid-inducible type-2 lipid transfer protein from rice. FEBS Lett. 1998, 428, 193–199. [Google Scholar] [CrossRef]
- Wang, H.W.; Kwon, H.J.; Yim, W.C.; Lim, S.D.; Moon, J.C.; Lee, B.M.; Seo, Y.W.; Kim, W.; Jang, C.S. Expressional diversity of wheat nsLTP genes: Evidence of subfunctionalization via cis-regulatory divergence. Genetica 2010, 138, 843–852. [Google Scholar] [CrossRef]
- Surjus, A.; Durand, M. Lipid changes in soybean root membranes in response to salt treatment. J. Exp. Bot. 1996, 47, 17–23. [Google Scholar] [CrossRef]
- Li, H.; Wang, H.; Wen, W.; Yang, G. The antioxidant system in Suaeda salsa under salt stress. Plant Signal. Behav. 2020, 15, 1771939. [Google Scholar] [CrossRef] [PubMed]
- Liu, S.S.; Wang, W.Q.; Li, M.; Wan, S.B.; Sui, N. Antioxidants and unsaturated fatty acids are involved in salt tolerance in peanut. Acta Physiol. Plant. 2017, 2017, 39. [Google Scholar] [CrossRef]
- Sui, N.; Tian, S.; Wang, W.; Wang, M.; Fan, H. Overexpression of Glycerol-3-Phosphate Acyltransferase from Suaeda salsa Improves Salt Tolerance in Arabidopsis. Front. Plant Sci. 2017, 8, 1337. [Google Scholar] [CrossRef] [PubMed]
- Gul, H.S.; Ulfat, M.; Zafar, Z.U.; Haider, W.; Ali, Z.; Manzoor, H.; Afzal, S.; Ashraf, M.; Athar, H.U. Photosynthesis and Salt Exclusion Are Key Physiological Processes Contributing to Salt Tolerance of Canola (Brassica napus L.): Evidence from Physiology and Transcriptome Analysis. Genes 2022, 14, 3. [Google Scholar] [CrossRef]
- Dugasa, M.T.; Cao, F.; Ibrahim, W.; Wu, F. Differences in physiological and biochemical characteristics in response to single and combined drought and salinity stresses between wheat genotypes differing in salt tolerance. Physiol Plant. 2019, 165, 134–143. [Google Scholar] [CrossRef]
- Wang, M.; Wang, Y.; Zhang, Y.; Li, C.; Gong, S.; Yan, S.; Li, G.; Hu, G.; Ren, H.; Yang, J.; et al. Comparative transcriptome analysis of salt-sensitive and salt-tolerant maize reveals potential mechanisms to enhance salt resistance. Genes Genom. 2019, 41, 781–801. [Google Scholar] [CrossRef]
- Hanin, M.; Ebel, C.; Ngom, M.; Laplaze, L.; Masmoudi, K. New Insights on Plant Salt Tolerance Mechanisms and Their Potential Use for Breeding. Front. Plant Sci. 2016, 7, 1787. [Google Scholar] [CrossRef] [PubMed]
- Shams, M.; Khadivi, A. Mechanisms of salinity tolerance and their possible application in the breeding of vegetables. BMC Plant Biol. 2023, 23, 139. [Google Scholar] [CrossRef]
- Rahman, M.A.; Thomson, M.J.; De Ocampo, M.; Egdane, J.A.; Salam, M.A.; Shah-E-Alam, M.; Ismail, A.M. Assessing trait contribution and mapping novel QTL for salinity tolerance using the Bangladeshi rice landrace Capsule. Rice 2019, 12, 63. [Google Scholar] [CrossRef] [PubMed]
- Bizimana, J.B.; Luzi-Kihupi, A.; W Murori, R.; Singh, R.K. Identification of quantitative trait loci for salinity tolerance in rice (Oryza sativa L.) using IR29/Hasawi mapping population. J. Genet. 2017, 96, 571–582. [Google Scholar] [CrossRef]
- Zhang, M.; Li, Y.; Liang, X.; Lu, M.; Lai, J.; Song, W.; Jiang, C. A teosinte-derived allele of an HKT1 family sodium transporter improves salt tolerance in maize. Plant Biotechnol. J. 2022, 21, 97–108. [Google Scholar] [CrossRef]
- Zhang, H.; Yu, F.; Xie, P.; Sun, S.; Qiao, X.; Tang, S.; Chen, C.; Yang, S.; Mei, C.; Yang, D.; et al. A Gγ protein regulates alkaline sensitivity in crops. Science 2023, 379, eade8416. [Google Scholar] [CrossRef] [PubMed]


Disclaimer/Publisher’s Note: The statements, opinions and data contained in all publications are solely those of the individual author(s) and contributor(s) and not of MDPI and/or the editor(s). MDPI and/or the editor(s) disclaim responsibility for any injury to people or property resulting from any ideas, methods, instructions or products referred to in the content. |
© 2023 by the authors. Licensee MDPI, Basel, Switzerland. This article is an open access article distributed under the terms and conditions of the Creative Commons Attribution (CC BY) license (https://creativecommons.org/licenses/by/4.0/).